Abstract
This paper proposes a comprehensive numerical methodology for predicting Sound Transmission Loss (STL) in acoustic metamaterials. It integrates a high-fidelity model (HFM), using Thermoviscous Acoustics for detailed characterization, with a reduced-order model (ROM), employing Pressure Acoustics in COMSOL Multiphysics. The goal is a hierarchical approach balancing computational cost with predictive accuracy for metamaterial designs. The results show that HFM is crucial for understanding complex dissipative mechanisms, especially viscous and thermal losses in sub-wavelength features. The ROM offers rapid predictions for broader design exploration. The case studies compare these models against each other and to experimental results in the low-to-mid frequency range. The average STL values for both models diverged by a marginal 6 dB.
1. Introduction
Noise pollution remains a significant environmental and health concern across various sectors, including the urban planning, transportation, industrial, and medical field [1,2,3,4,5,6]. The demand for advanced noise control solutions has led to the emergence of acoustic metamaterials—engineered materials with extraordinary sound manipulation properties not found in nature. These materials derive their acoustic characteristics from their designed sub-wavelength structures rather than their bulk material composition, enabling novel applications such as broadband sound insulation [7,8,9,10,11], ultra-thin sound barriers [12], and enhanced absorption [13,14,15,16].
Predicting the acoustic properties of these complex metamaterials is crucial for their effective design and deployment. Traditional experimental methods are time-consuming and expensive during the iterative design phases. Numerical methods offer a powerful alternative for virtual prototyping. However, the intricate microstructures of acoustic metamaterials often necessitate detailed simulations that capture highly localized phenomena, leading to computationally intensive models. High-fidelity numerical models (HFMs) offer unparalleled accuracy, leading researchers to adopt them for predicting acoustic properties such as the sound absorption coefficient (SAC) [17,18] and Sound Transmission Loss (STL) [19,20]. However, the required computational cost may prove prohibitive for extensive design exploration. Therefore, simplified or reduced-order models (ROMs) have been adopted by many researchers. They offer computational efficiency but may require additional experimental work or additional numerical modeling to predict certain parameters required as input for ROMs [21,22].
This paper addresses the challenge faced in ROMs by proposing a framework for STL prediction that leverages the strengths of both HFMs and ROMs. The central hypothesis is that a judicious combination of these modeling paradigms, specifically implemented within the COMSOL Multiphysics version 6.2 environment, can significantly enhance the efficiency of STL prediction without the need for additional numerical modeling for predicting parameters required by previously suggested ROMs. Instead of focusing on STL values at any single frequency, the average result of ROM over the complete low-to-mid frequency range have been compared to the average STL obtained with an HFM. The results show that average STL values remain in close proximity to those obtained with an HFM. Hence, this advantage can be leveraged to perform a much faster exploration of the design space and the impact of geometric parameters can be analyzed quickly. The results are validated using experimental work with an impedance tube.
2. Materials and Methods
This section outlines the numerical framework for predicting the STL in acoustic metamaterials, emphasizing the strategic deployment of HFMs and ROMs within COMSOL Multiphysics.
2.1. Theoretical Background
Accurate numerical modeling of acoustic phenomena, particularly in complex structures like metamaterials, requires a deep understanding of the underlying physical principles and their mathematical representations. The theoretical foundations of the HFM and ROM employed in this study are explained in the following paragraphs.
2.1.1. High-Fidelity Numerical Model (HFM)
The Thermoviscous Acoustics (TVA) module in COMSOL Multiphysics provides a high-fidelity description of acoustic wave propagation by considering the fundamental fluid properties of viscosity and thermal conductivity. This approach is crucial when acoustic phenomena occur at scales comparable to or smaller than the viscous or thermal penetration depths, typically in narrow channels, micro-perforations, or intricate paths [16,23]. In such scenarios, energy dissipation due to viscous friction and thermal conduction within the fluid becomes significant and directly impacts STL.
The model solves a coupled system of linearized partial differential equations, derived from the conservation laws of fluid dynamics (mass, momentum, and energy), for small perturbations around a quiescent background state. The primary dependent variables solved are the acoustic pressure (p), the acoustic particle velocity (u = (ux,uy,uz)), and the acoustic temperature variation (T). In the frequency domain, these equations are
Equation (1) is the continuity equation, where ρ0 is air density, ω is the angular frequency, and ρ represents acoustic density perturbation. Equation (2) is the momentum equation, where μ is dynamic viscosity and μB is bulk viscosity, which capture viscous shear losses and volumetric expansion/compression losses, respectively. Equation (3) is the energy conservation equation, where Cp is the heat capacity at constant pressure, T0 is the equilibrium temperature, α0 is the coefficient of thermal expansion, and Q is a heat source term. Equation (4) is the linearized equation of state connecting ρ to p and T, where βT is the isothermal compressibility.
The inclusion of all these terms makes Thermoviscous Acoustics a robust, high-fidelity approach for micro-scale acoustic modeling, but it comes with significant computational demands due to the increased number of coupled degrees of freedom.
2.1.2. Reduced-Order Numerical Model (ROM)
The Pressure Acoustics (PA) module represents ROM by assuming an ideal fluid that is both inviscid and non-thermally conducting [23]. This simplification is valid when the characteristic dimensions of the acoustic propagation path are much larger than the viscous and thermal penetration depths, meaning dissipative effects at boundaries are negligible or can be approximated. The primary dependent variable solved for is the scalar acoustic pressure (p). In the frequency domain, the governing equation is the inhomogeneous Helmholtz equation:
Here, c0 is the speed of sound in the fluid, and other variables are as defined previously. Table 1 provides a comparative analysis of PA vs. TVA.

Table 1.
Summary of comparison: PA vs. TVA.
2.2. COMSOL Implementation
All numerical simulations were performed using COMSOL Multiphysics version 6.2. Pressure Acoustics, Frequency Domain was used for ROM of metamaterials and to model the bulk air domain. Thermoviscous Acoustics, Frequency Domain was employed for HFM of interior cavities of metamaterial unit cells. The Solid Mechanics module was used to include the fluid–structure interaction. Table 2 shows the material properties that were assigned to each domain. Figure 1 provides a representative model explaining boundary conditions applied for calculation of STL. Normally incident plane wave of 1 Pa was applied with periodic and symmetry boundary conditions applied as shown. Identical mesh was also implemented on boundaries with periodic BC, and a mesh resolution of 6 quadratic elements per wavelength was utilized for all air domains. Further reduction in element size did not result in any variation in output variable. The minimum element size within perforations was kept at 0.0007 mm, sufficiently smaller than the smallest perforation diameter, to accurately capture losses. All analyses were run for a frequency range of 50–1800 Hz with a step size of 25 Hz. The workstation used for the analysis was installed with a 16 core E5 Xeon processor and 128 GB RAM. ROM could be solved with either a direct or iterative solver. However, all analyses were performed with an iterative solver as HFM could not be run using a direct solver. Default iterative solvers generated by COMSOL Multiphysics were used in both instances, and no changes to default settings of the solvers were made.
Table 2.
Material properties assigned in numerical models.
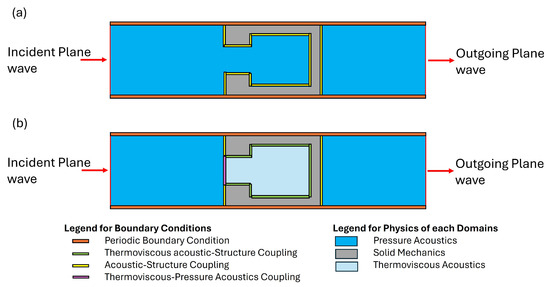
Figure 1.
Two-dimensional representation of numerical models with implemented physics and boundary conditions: (a) ROM; (b) HFM.
The STL is defined as the logarithmic ratio of incident sound power (Winc) to transmitted sound power (Wtrans):
Winc is calculated from the incident wave’s intensity, and Wtrans is obtained by integrating the normal intensity over the transmitted surface. Incident and transmitted power calculation required the creation of bulk air domain on both sides of the design.
2.3. Modeling Framework
The proposed methodology adopts a hierarchical approach to optimize computational efficiency while maintaining the necessary accuracy for complex acoustic metamaterials. In the case of ROM, PA has been employed for all air domains and Solid Mechanics module has been utilized for solid domains. This allowed for rapid simulation of the acoustic field. Acoustic–structure coupling has been used to ensure that both physics communicate efficiently. For HFM, TVA has been implemented in the air domain within the cavity of the design, ensuring precise modeling of the thermal and viscous losses within the design, while the bulk air domain has been modeled using PA. The Solid Mechanics module has been used for the solid domain. Acoustics–Thermoviscous Acoustics coupling, acoustic–structure coupling, and Thermoviscous Acoustics–structure coupling have been used to ensure that data flows efficiently from one domain to the other. Figure 1a shows the 2D representation of ROM and Figure 1b shows the 2D representation of HFM.
2.4. Experimental Framework
Experimental validation of the numerical models was performed by measuring the Sound Transmission Loss (STL) of cylindrical samples using a BSWA Technology Co. SW-422 impedance tube, as illustrated in Figure 2. This setup necessitates the use of cylindrical specimens with a 100 mm diameter. STL measurements were conducted utilizing the transfer function method with a 4-microphone array. The impedance tube was instrumented with four MPA 416 1/4″ microphones and an MC3242 data acquisition (DAQ) system. Microphone calibration was performed using a CA115 calibrator supplied by the original equipment manufacturer (OEM). Measurements were conducted across a frequency range of 50–1800 Hz at a step size of 2 Hz.
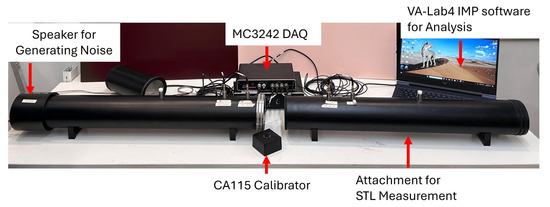
Figure 2.
Impedance tube for experimental validation.
The samples were fabricated via fused deposition modeling (FDM) using an INTAMSYS Funmat Pro 410 printer. Specific print parameters are delineated in Table 3. To maintain structural integrity and mitigate potential artifacts from small features, the extracted cylindrical samples had a 0.6 mm thick wall. For the express purpose of numerical model validation, only two selected metamaterial designs were fabricated and subjected to experimental analysis. Each experimental test was repeated thrice to minimize inherent experimental variability and error.
Table 3.
Print parameters for INTAMSYS Pro 410.
3. Case Studies
To demonstrate the efficacy and applicability of the proposed multi-fidelity modeling approach, several representative acoustic metamaterial configurations were analyzed. Micro-perforated Panels (MPPs) were integrated into a 2D auxetic geometry to repurpose the cavities of auxetic geometry into Helmholtz resonators. Figure 3 shows the complete design philosophy, Figure 3a shows the complete repeating design, and Figure 3b shows the 3D printed sample extracted from the complete design for testing in the impedance tube. Figure 3c provides the detailed dimensions of the underlying 2D auxetic geometry and Figure 3d provides the details of the unit lattice extracted for the numerical analysis. The design had integrated supports built in during the design phase; these supports have been optimized to minimize any negative impact on the acoustic properties. More details on the design philosophy and design for additive manufacturing can be found in previously published literature [24].
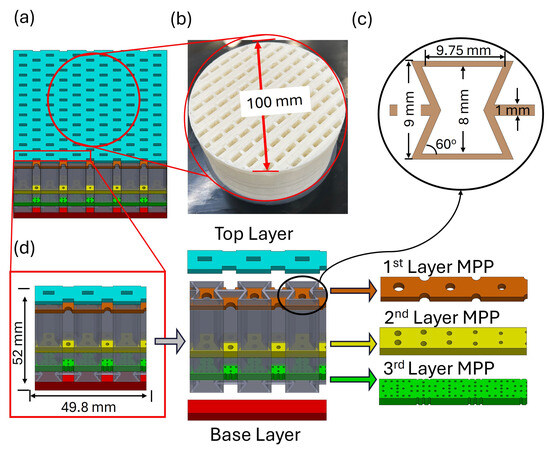
Figure 3.
Design philosophy for the auxetic MPP hybrid. (a) Repeating structure; (b) 3D printed 100 mm sample with 0.6 mm outer wall for impedance tube testing; (c) complete dimensions for underlying auxetic; (d) repeating unit lattice and its combination with MPPs.
The complete dimensional data of the nine design iterations discussed in this study can be seen in Table S1 of the Supplementary Materials. The complete information has been provided for ease of reproducing the results discussed in this study. Furthermore, Figure S1 has also been added to the Supplementary Materials to sufficiently explain the perforation dimensions and alignment.
4. Results and Discussion
Figure 4 provides a comparison of the experimental results with the HFM and ROM. Only two samples underwent experimental testing, as the primary objective was to validate the numerical models. Slight differences exist between the HFM and experimental results, while the trend remains the same. These can be attributed to the manufacturing defects resulting from FDM and the inherent surface roughness associated with the technique. A detailed critical analysis can be found in previously published literature [24]. The ROM shows significant variation from the experimental results, which will be discussed in the next few paragraphs.
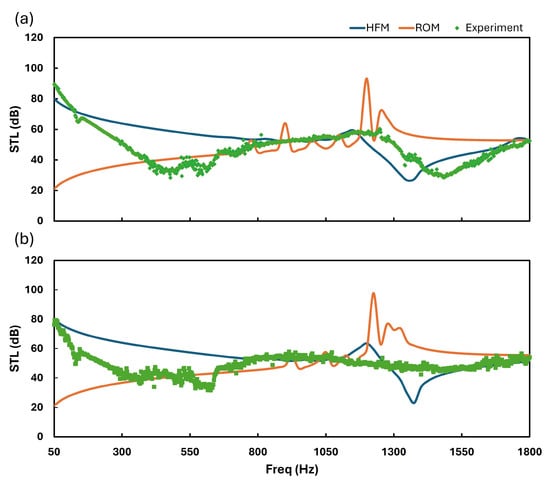
Figure 4.
Comparison of experimental results with HFM and ROM: (a) Sample 6. (b) Sample 9.
Figure 5 represents a comparison of the ROM and HFM for all the samples presented in this study. The comparison shows large difference between the results of both numerical models at first glance, especially at lower frequencies. In the confined geometries, thermoviscous losses represent the dominant mechanism for acoustic energy dissipation [19,23]. As an acoustically oscillating fluid propagates through narrow channels, the viscous and thermal effects become significant. This interaction gives rise to the formation of acoustic boundary layers, specifically, the viscous boundary layer (δv) and the thermal boundary layer (δt) along the channel walls. Within these layers, a resistive force (due to viscous shear) and heat exchange (due to thermal conduction) act to convert acoustic energy into thermal energy, thus dissipating it from the propagating wave. The thicknesses of these boundary layers are inversely proportional to the square root of the angular frequency (ω) or frequency (f) of the incident wave.
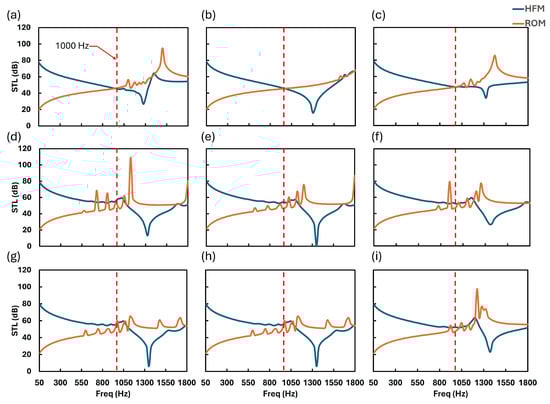
Figure 5.
Comparison of HFM and ROM over complete frequency range for each sample: (a) Sample 1. (b) Sample 2. (c) Sample 3. (d) Sample 4. (e) Sample 5. (f) Sample 6. (g) Sample 7. (h) Sample 8. (i) Sample 9.
Due to the inverse proportionality, the thickness of thermoviscous boundary layer is large at lower frequencies. Solving Equation (7) for a frequency of 100 Hz gives a boundary layer thickness of 0.22 mm, while it reduces to 0.076 mm at 1000 Hz. Therefore, the resulting losses at lower frequencies are also greater than those at higher frequencies. As the mathematical relation behind the ROM treats the fluid media as ideal, it does not consider these losses and the predicted STL becomes much less than the actual value. At higher frequencies, the thermoviscous boundary layer created in perforations becomes smaller and the resulting losses also reduce. Therefore, the HMF-predicted STL becomes closer to the ROM-predicted value. The red dotted line shown in Figure 5 marks the 1000 Hz frequency where the prediction by both models is relatively close. Table S2 in the Supplementary Materials provides numerical data for comparison of all the cases analyzed in this regard. It can also be observed there that the minimum percentage difference occurs near 1000 Hz frequency.
Table 4 and Figure 6 are of prime importance to fully grasp the relevance of the ROM. Table 4 shows the percent increase in the Degree of Freedom (DoF) and time when using an HFM with nearly the same number of mesh elements as the ROM. The DoF increases by nearly 40% in each case, while the time required for each numerical run increases by nearly 80%. The same solver type was ensured for a comparable analysis. Figure 6 presents the average STL over the complete frequency range (50–1800 Hz) plotted for each sample. The averages of the ROM and HFM are not only close, but they also follow the same pattern for all samples. The increase in the average STL result of the HFM is commensurate with the increase in the average STL achieved from the ROM. Across all of the presented cases, the average STL values remained within approximately 6 dB of each other, signifying a modest 9% difference.
Table 4.
HFM vs. ROM: DoF and time comparison.
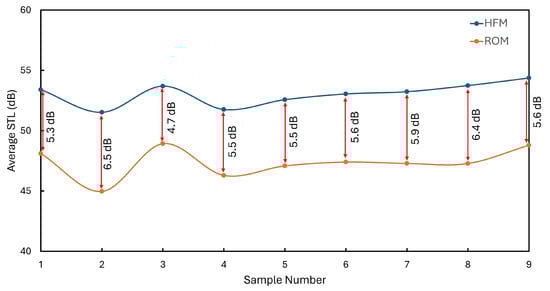
Figure 6.
Average STL for each sample achieved using both numerical models.
As evidenced by the data presented in Table S1 of the Supplementary Materials, the design complexity increases from sample 1 to sample 9. Nonetheless, Figure 6 illustrates that the proposed ROM effectively predicts the average STL, maintaining a consistent error.
An ROM implemented in COMSOL can accurately predict STL behavior for designs without perforations [8,10]. However, the presence of perforations causes air interaction with complex cavities, which cannot be predicted with the ROM alone. Additional numerical modeling is required to make the ROM robust [21,22]. Otherwise, the HFM can accurately predict behavior in such cases. The amount of time required to run numerical models based on the HFM or ROM suggested in the literature is quite high. The suggested ROM works on average STL values, which can provide very useful insight into the performance of the designs. As the computational cost of the ROM is very low, it offers a unique advantage to researchers. An initial exploration of a given design space to identify the effect of geometric parameters of interest can be performed at a much higher pace, narrowing down the variables involved and accelerating the development of the desired metamaterial. In such cases, the average STL value can be used to track the overall behavior of the design within a low-to-mid frequency range. Subsequently, the HFM can be adopted to analyze the exact behavior within the complete frequency range.
5. Conclusions
This paper presented a robust numerical methodology for efficiently and accurately predicting STL in acoustic metamaterials. An HFM and ROM were implemented within COMSOL Multiphysics. Our findings show that the HFM based on the TVA module is crucial for accurately modeling intricate dissipative mechanisms in sub-wavelength features. The same is also evidenced by the presented experimental work. Conversely, the ROM based on the PA module offers a computationally efficient alternative, notably for initial design exploration to assess the geometric parameter’s influence on the average STL. The proposed ROM required one-fifth of the time and significantly less computational power than the HFM without the need for any additional numerical modeling or experimental work. Across all of the analyzed cases, the average STL values from the proposed ROM diverged by a marginal 6 dB from those predicted by the HFM over the entire frequency range. This hierarchical framework, leveraging both approaches, powerfully accelerates the design and optimization of novel acoustic metamaterials. In future, other metamaterial designs will be investigated using the proposed numerical approach. Moreover, the robustness of the approach will also be tested for other acoustic parameters such as SAC.
Supplementary Materials
The following supporting information can be downloaded at https://www.mdpi.com/article/10.3390/engproc2025111017/s1: Figure S1: Layer-wise perforation dimensions for Sample 9. All perforations are aligned to the center of each auxetic cavity; Table S1: Detailed Dimensions of Designs analyzed during the reported study (All dimensions are in mm); Table S2: Comparison of STL at selected frequencies: ROM vs HFM.
Author Contributions
Conceptualization, A.B.N. and K.A.K.; methodology, A.B.N.; software, A.B.N.; validation, A.B.N., K.A.K. and M.K.A.K.; formal analysis, A.B.N. and M.K.A.K.; investigation, A.B.N. and M.K.A.K.; resources, K.A.K.; data curation, A.B.N.; writing—original draft preparation, A.B.N.; writing—review and editing, A.M. and A.T.; visualization, A.B.N.; supervision, A.M. and K.A.K.; project administration, A.M.; funding acquisition, K.A.K. All authors have read and agreed to the published version of the manuscript.
Funding
This research received no external funding.
Institutional Review Board Statement
Not applicable.
Informed Consent Statement
Not applicable.
Data Availability Statement
To ensure transparency and reproducibility, all relevant data supporting the findings of this study are available upon reasonable request from the corresponding author.
Conflicts of Interest
The authors declare no conflicts of interest.
References
- Alberti, G.; Portelli, D.; Galletti, C. Healthcare professionals and noise-generating tools: Challenging assumptions about hearing loss risk. Int. J. Environ. Res. Public Health 2023, 20, 6520. [Google Scholar] [CrossRef]
- Bengtsson, J. Low Frequency Noise During Work. Effects on Performance and Annoyance. Doctoral Thesis, Göteborgs universitet/University of Gothenburg, Göteborg, Sweden, 2003. [Google Scholar]
- Bisogno, A.; Scarpa, A.; Di Girolamo, S.; De Luca, P.; Cassandro, C.; Viola, P.; Ricciardiello, F.; Greco, A.; De Vincentiis, M.; Ralli, M. Hearing loss and cognitive impairment: Epidemiology, common pathophysiological findings, and treatment considerations. Life 2021, 11, 1102. [Google Scholar] [CrossRef] [PubMed]
- Fulton, S.E.; Lister, J.J.; Bush, A.L.H.; Edwards, J.D.; Andel, R. Mechanisms of the hearing–cognition relationship. Semin. Hear. 2015, 36, 140–149. [Google Scholar] [CrossRef]
- Iannace, G.; Ciaburro, G.; Trematerra, A. Heating, ventilation, and air conditioning (HVAC) noise detection in open-plan offices using recursive partitioning. Buildings 2018, 8, 169. [Google Scholar] [CrossRef]
- Waye, K.P. Effects of low frequency noise and vibrations: Environmental and occupational perspectives. In Encyclopedia of Environmental Health; Elsevier: Amsterdam, The Netherlands, 2011. [Google Scholar]
- Ciochon, A.; Kennedy, J.; Leiba, R.; Flanagan, L.; Culleton, M. The impact of surface roughness on an additively manufactured acoustic material: An experimental and numerical investigation. J. Sound Vib. 2023, 546, 117434. [Google Scholar] [CrossRef]
- Li, F.; Chen, Y.; Zhu, D. Revealing the Sound Transmission Loss Capacities of Sandwich Metamaterials with Re-Entrant Negative Poisson’s Ratio Configuration. Materials 2023, 16, 5928. [Google Scholar] [CrossRef]
- Li, Z.; Li, X.; Chua, J.W.; Lim, C.H.; Yu, X.; Wang, Z.; Zhai, W. Architected lightweight, sound-absorbing, and mechanically efficient microlattice metamaterials by digital light processing 3D printing. Virtual Phys. Prototyp. 2023, 18, e2166851. [Google Scholar] [CrossRef]
- Lin, C.; Wen, G.; Yin, H.; Wang, Z.-P.; Liu, J.; Xie, Y.M. Revealing the sound insulation capacities of TPMS sandwich panels. J. Sound Vib. 2022, 540, 117303. [Google Scholar] [CrossRef]
- Wang, Z.; Guo, Z.; Li, Z.; Zeng, K. Design, manufacture, and characterisation of hierarchical metamaterials for simultaneous ultra-broadband sound-absorbing and superior mechanical performance. Virtual Phys. Prototyp. 2022, 18, e2111585. [Google Scholar] [CrossRef]
- Nguyen, H.Q.; Wu, Q.; Chen, H.; Chen, J.J.; Yu, Y.K.; Tracy, S.; Huang, G.L. A Fano-based acoustic metamaterial for ultra-broadband sound barriers. Proc. R. Soc. A 2021, 477, 20210024. [Google Scholar] [CrossRef]
- Costa-Baptista, J.; Fotsing, E.R.; Mardjono, J.; Therriault, D.; Ross, A. Design and fused filament fabrication of multilayered microchannels for subwavelength and broadband sound absorption. Addit. Manuf. 2022, 55, 102777. [Google Scholar] [CrossRef]
- Fan, J.; Song, B.; Zhang, L.; Wang, X.; Zhang, Z.; Wei, S.; Xiang, X.; Zhu, X.; Shi, Y. Structural design and additive manufacturing of multifunctional metamaterials with low-frequency sound absorption and load-bearing performances. Int. J. Mech. Sci. 2023, 238, 107848. [Google Scholar] [CrossRef]
- Fotsing, E.R.; Dubourg, A.; Ross, A.; Mardjono, J. Acoustic properties of periodic micro-structures obtained by additive manufacturing. Appl. Acoust. 2019, 148, 322–331. [Google Scholar] [CrossRef]
- Tang, Y.; Ren, S.; Meng, H.; Xin, F.; Huang, L.; Chen, T.; Zhang, C.; Lu, T.J. Hybrid acoustic metamaterial as super absorber for broadband low-frequency sound. Sci. Rep. 2017, 7, 43340. [Google Scholar]
- Chen, L.; Ji, H.; Tang, Y.; Wang, H.; Qiu, J. Enhancing sound absorption of Helmholtz resonators through microlattice metamaterials lining. Thin-Walled Struct. 2025, 215, 113465. [Google Scholar] [CrossRef]
- Song, Z.; Chen, W.; Jin, S.; Zhang, H.; Shan, F.; Qu, S. Low-frequency sound absorption enhancement in multi-layer honeycomb metamaterials with embedded long-curved-neck Helmholtz resonators. Appl. Acoust. 2025, 240, 110909. [Google Scholar] [CrossRef]
- Liu, Z.-M.; Pang, Y. Effect of the size and pressure on the modified viscosity of water in microchannels. Acta Mech. Sin. 2015, 31, 45–52. [Google Scholar] [CrossRef]
- Kim, J.; Choi, E.; Jeon, W. Lightweight soundproofing meta-panel for separate wide frequency bands. Mech. Syst. Signal Process. 2023, 184, 109647. [Google Scholar] [CrossRef]
- Zhang, Y.; Zhang, L.; Duan, Y.; Zhou, X. Broadband sound reduction in space-coiling ventilation structures with microperforated shells. Appl. Acoust. 2025, 235, 110676. [Google Scholar] [CrossRef]
- Yang, H.; Seong, W. Acoustic Transmission Loss of a Cylindrical Silencer Filled with Multilayer Poroelastic Materials Based on Mode-Matching Method. J. Mar. Sci. Eng. 2024, 12, 2109. [Google Scholar] [CrossRef]
- COMSOL Multiphysics. Acoustics Module User Guide, version 6.2. User’s Manual. COMSOL AB: Stockholm, Sweden, 2022.
- Naveed, A.B.; Mubashar, A.; Khan, M.K.A.; Munir, A.; Khan, K.A. Additively manufactured hybrid auxetic structures for enhanced low frequency acoustic performance through experiments and modelling. Sci. Rep. 2025, 15, 23460. [Google Scholar] [CrossRef] [PubMed]


Disclaimer/Publisher’s Note: The statements, opinions and data contained in all publications are solely those of the individual author(s) and contributor(s) and not of MDPI and/or the editor(s). MDPI and/or the editor(s) disclaim responsibility for any injury to people or property resulting from any ideas, methods, instructions or products referred to in the content. |
© 2025 by the authors. Licensee MDPI, Basel, Switzerland. This article is an open access article distributed under the terms and conditions of the Creative Commons Attribution (CC BY) license (https://creativecommons.org/licenses/by/4.0/).