Proceeding Paper

Adaptive IoT-Based Platform for CO2 Forecasting Using Generative Adversarial Networks: Enhancing Indoor Air Quality Management with Minimal Data †

National Research Council of Italy, Institute for Microelectronics and Microsystems, 73100 Lecce, Italy
*
Author to whom correspondence should be addressed.
Presented at the 2nd International Conference on AI Sensors and Transducers, Kuala Lumpur, Malaysia, 29 July–3 August 2025.
Eng. Proc. 2025, 110(1), 3; https://doi.org/10.3390/engproc2025110003
Published: 30 October 2025

Abstract

Monitoring indoor air quality is vital for health, as CO2 is a major pollutant. An automated system that accurately forecasts CO2 levels can optimize HVAC management, preventing sudden increases and reducing energy waste while maintaining occupant comfort. Traditionally, such systems require extensive datasets collected over months to train algorithms, making them computational expensive and inefficient. To address this limitation, an adaptive IoT-based platform has been developed, leveraging a limited set of recent data to forecast CO2 trends. Tested in a real-world setting, the system analyzed parameters such as physical activity, temperature, humidity, and CO2 to ensure accurate predictions. Data acquisition was performed using the Smartex WWS T-shirt for physical activity data and the UPSense UPAI3-CPVTHA environmental sensor for other measurements. The chosen sensor devices are wireless and minimally invasive, while data processing was carried out on a low-power embedded PC. The proposed forecasting model adopts an innovative approach. After a 5-day training period, a Generative Adversarial Network enhances the dataset by simulating a 10-day training period. The model utilizes a Generative Adversarial Network with a Long Short-Term Memory network as the generator to predict future CO2 values based on historical data, while the discriminator, also a Long Short-Term Memory network, distinguishes between actual and generated CO2 values. This approach, based on Conditional Generative Adversarial Networks, effectively captures data distributions, enabling more accurate multi-step probabilistic forecasts. In this way, the framework maintains a Root Mean Square Error of approximately 8 ppm, matching the performance of our previous approach, while reducing the need for real training data from 10 to just 5 days. Furthermore, it achieves accuracy comparable to other state-of-the-art methods that typically requires weeks or even months of training. This advancement significantly enhances computational efficiency and reduces data requirements for model training, improving the system’s practicality for real-world applications.

1. Introduction

Research into indoor air quality (IAQ) is consistently important, particularly as studies indicate that pollutant levels are often greater indoors than outdoors [1]. Commonly monitored parameters include particulate matter (PM), a mixture of solid and liquid particles suspended in the air, classified by their aerodynamic diameter in microns (PM1, PM2.5, PM10) [2,3], and carbon dioxide (CO2), with the buildup of CO2 being a significant factor in discussions on ventilation and deteriorating IAQ [4]. Prolonged exposure to high levels of CO2 is associated with numerous health issues, such as headaches, fatigue, drowsiness, nausea, and disrupted sleep patterns [5,6,7]. Concentrations above 700 ppm can trigger symptoms of sick building syndrome (SBS), and levels exceeding 1000 ppm have been shown to impair cognitive function in children, with increased effects up to 5000 ppm [5]. These findings have resulted in defined IAQ thresholds: good (<1000 ppm), moderate (1000–1500 ppm), and poor (>1500 ppm).
The need to monitor CO2 has grown due to the COVID-19 pandemic and the rise in remote work, which has led to more time spent indoors and homes functioning as offices [8]. This makes effective monitoring vital for identifying unhealthy conditions and controlling ventilation systems. In homes, CO2 originates from sources like cooking and heating, but also from the exhaled breath of occupants. The rate of CO2 exhalation depends on individual factors such as age, weight, and fitness level, which influence metabolic rate and gas exchange [9].
An additional trend is the increase in exercising at home [8], which elevates both CO2 production and oxygen needs. Therefore, monitoring systems must detect rising pollution levels early to activate ventilation, preserving air quality while avoiding energy waste. Manual ventilation often fails to prevent CO2 peaks, whereas an automated system that predicts levels accurately can optimize ventilation, save energy, and maintain comfort.
Several studies have used artificial intelligence (AI) methods, including Artificial Neural Networks (ANNs), Linear Regression, and Decision-Tree models, to accurately estimate CO2 by analyzing temperature and humidity [10,11]. However, most do not forecast future CO2 levels, and there are few studies focused on this goal [12,13,14,15,16]. These forecasting approaches usually depend on large, long-term datasets for training, which is expensive and may not suit real environments where conditions change. For instance, one project [14] employed five days of data (only nine hours per day at one-hour intervals) to predict CO2 two days ahead. Given that CO2 can vary greatly within an hour, this data resolution is too low for responsive ventilation control. A better method uses systems trained on shorter, updated data periods. Segala et al. [16] developed a deep-learning (DL) model that reduced prediction error to approximately 15 ppm after a week of training and around 10 ppm after 30 days.
This study introduces a CO2 forecasting system for homes that employs ubiquitous sensors to track temperature, humidity, CO2, and physical activity in real time, extending our previous work [17]. It was tested in a real household where residents work remotely and exercise indoors. A Generative Adversarial Network (GAN) algorithm was used, achieving high accuracy (max error 8 ppm) with only five days of training and no need for room dimensions. A GAN-generated dataset simulated an additional five days, effectively replicating a 10-day training period while maintaining realism. Initial tests involved one room with a single occupant, but the system is scalable to multiple rooms and occupants.
The remainder of this paper is organized as follows. Section 2 reports some details on architecture and algorithmic framework for CO2 forecasting. The results are included in Section 3, while the conclusions are reported in Section 4.

2. Materials and Methods

2.1. Hardware Architecture and Data Acquisition

The proposed system architecture incorporates three primary components: a wireless air quality sensor (UpSense, Trento, Itay), a sensor-equipped t-shirt (Smartex, Cascina, Italy), and an embedded personal computer (PC) for data collection and processing [18,19]. The air-quality-monitoring unit is an Upsens UPAI3-CPVTHA device (UpSense, Trento, Itay) (Figure 1a). It measures multiple parameters including particulate matter (PM1, PM2.5, PM10), CO2, volatile organic compounds (VOCs), atmospheric pressure, temperature, and humidity, transmitting data via WiFi [18]. For physiological monitoring, a Smartex Wearable Wellness System (WWS) t-shirt (Figure 1b) is employed [19]. It integrates a piezoresistive sensor for breathing rate, textile electrodes for heart rate, and an onboard triaxial accelerometer for torso movement analysis. Data is transmitted via Bluetooth at a 25 Hz sampling rate, suitable for activity classification.
From the environmental sensor, CO2, temperature, and humidity data were selected. From the wearable, the activity level was derived every 5 s using a validated algorithm that analyzes accelerometer data for activity level assessment [20].
The experimental setup was an 18 m2 room (3 m height) in a residential house, equipped with a workstation, treadmill, and weight bench. The room contained a thermally insulated aluminum window and a wooden door. The air quality sensor was mounted 1.5 m above the floor, away from air vents or windows. Three healthy participants (ages 31–42) occupied the room individually on alternating days over a 15-day period. Data was collected continuously 24/7. The room was typically unoccupied outside of scheduled activities: smart working (avg. 8 h/day for 10 days) and physical activity (avg. 2 h/day for 12 days). The window was briefly opened (∼10 min) only when CO2 reached unsafe levels. The environmental sensor sampled data every minute. Accelerometer data was streamed to the PC, where a Python version 3.11 -based software processed it to compute the activity level [21]. This software also managed data alignment and synchronization from all sensors.

2.2. Methodology

GANs are a generative model designed to generate artificial (fake) samples from a given data distribution. These synthetic samples are, for example, used for data augmentation if more samples were required for other tasks. In addition, GANs can also be employed for supervised learning purposes [22,23].
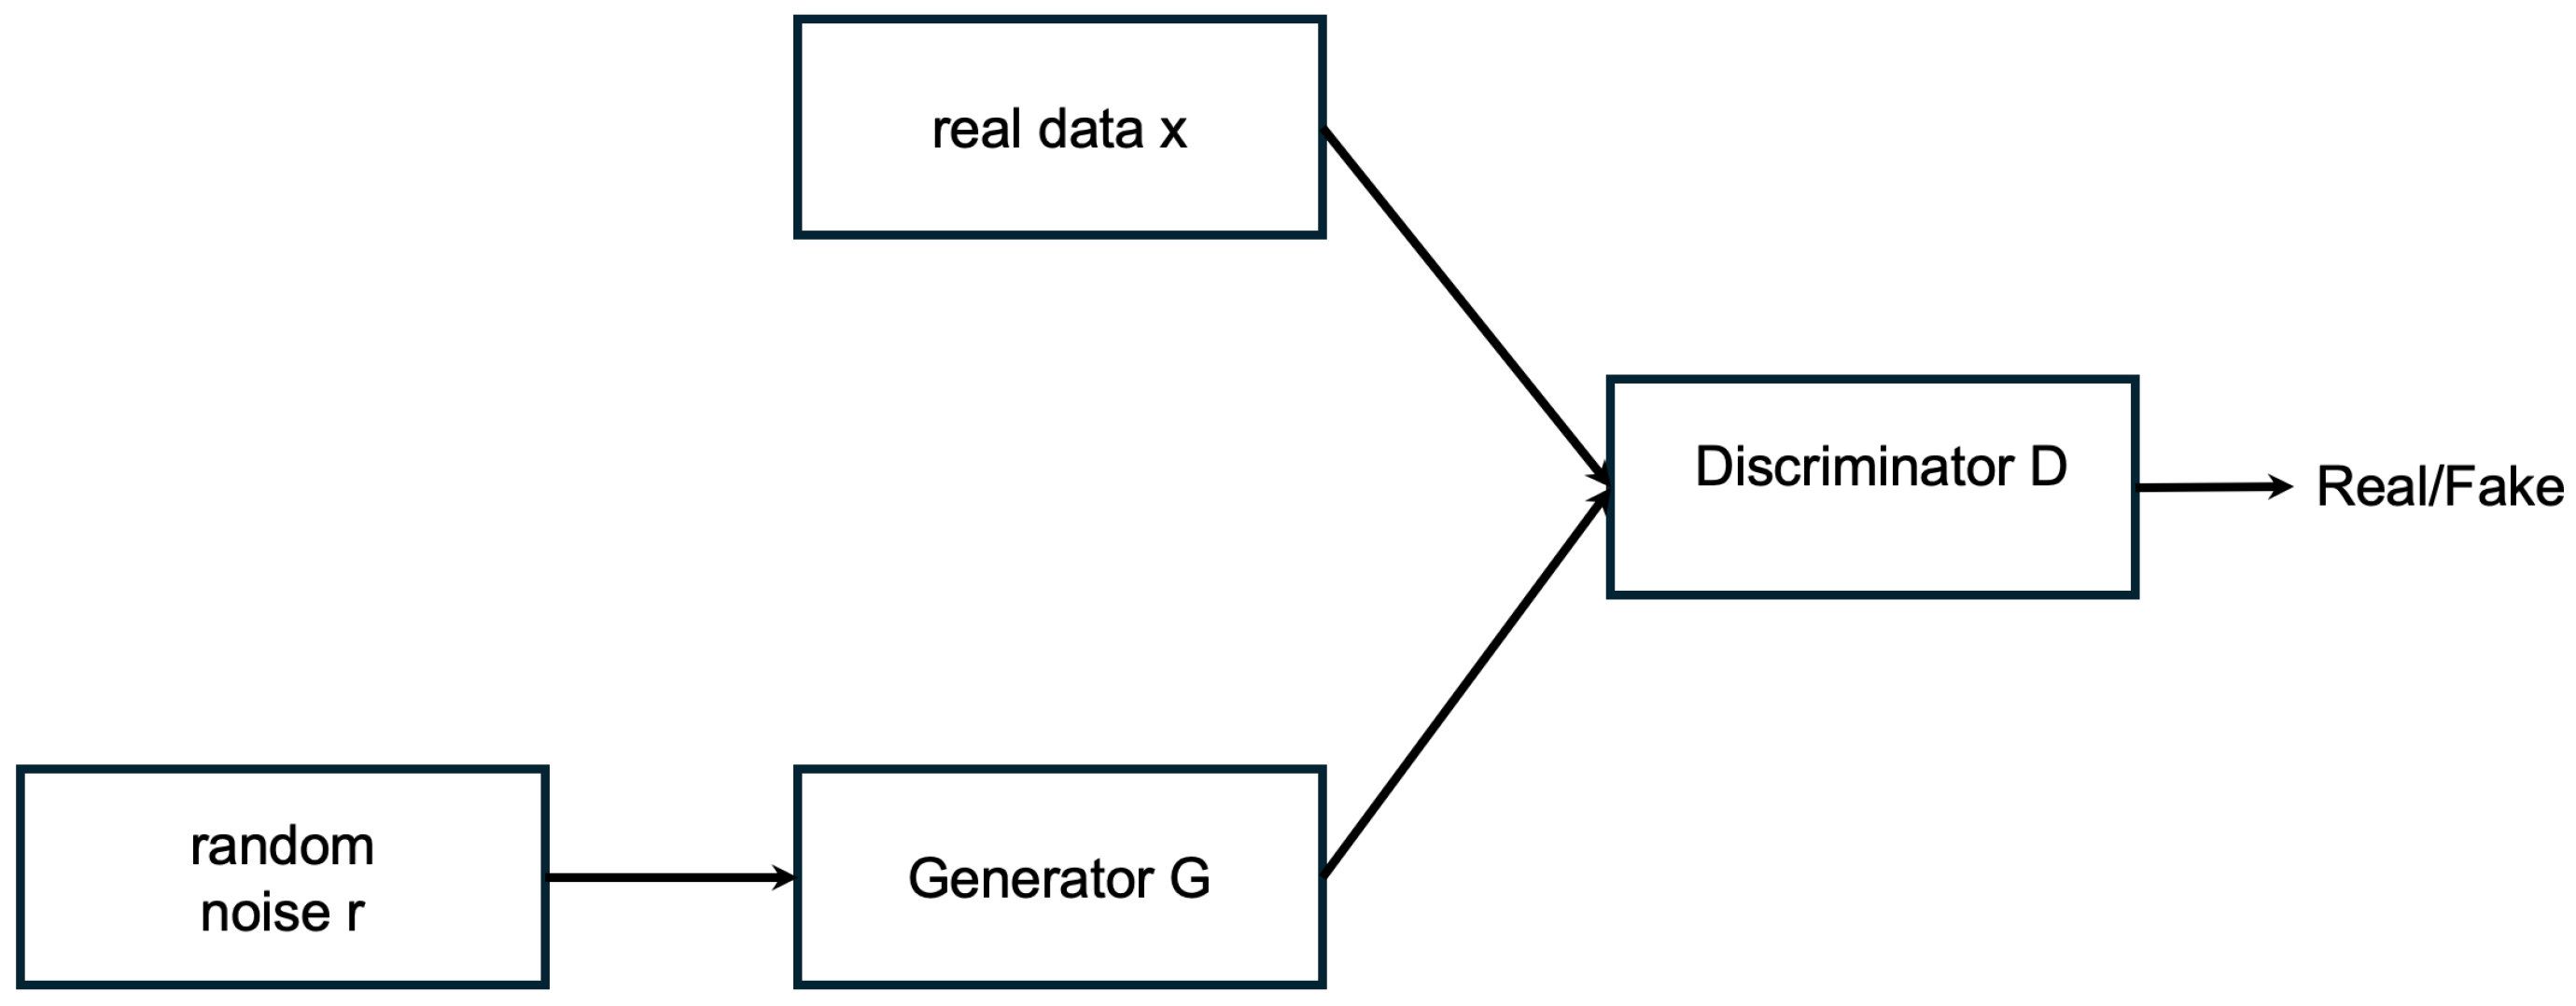
Specifically, a GAN includes two neural networks: a generator (G) and a discriminator (D). These components are trained in an adversary process simultaneously. First, a noise vector is sampled from a known, usually Gaussian, probability distribution. Then, a noise vector is taken as input by G and trained to generate a sample following the given probability distribution. Instead, D is tuned to discriminate generated data from real data. An example of a GAN operating diagram is shown in Figure 2.
In this work, the Conditional Generative Adversarial Network (CGAN) is employed [24]. The CGAN method is implemented adding the label to the data, and, in addition, further conditional inputs to D and G are added, constraining the generated data by G [25]. Only sufficiently real and qualified data can be identified by D.
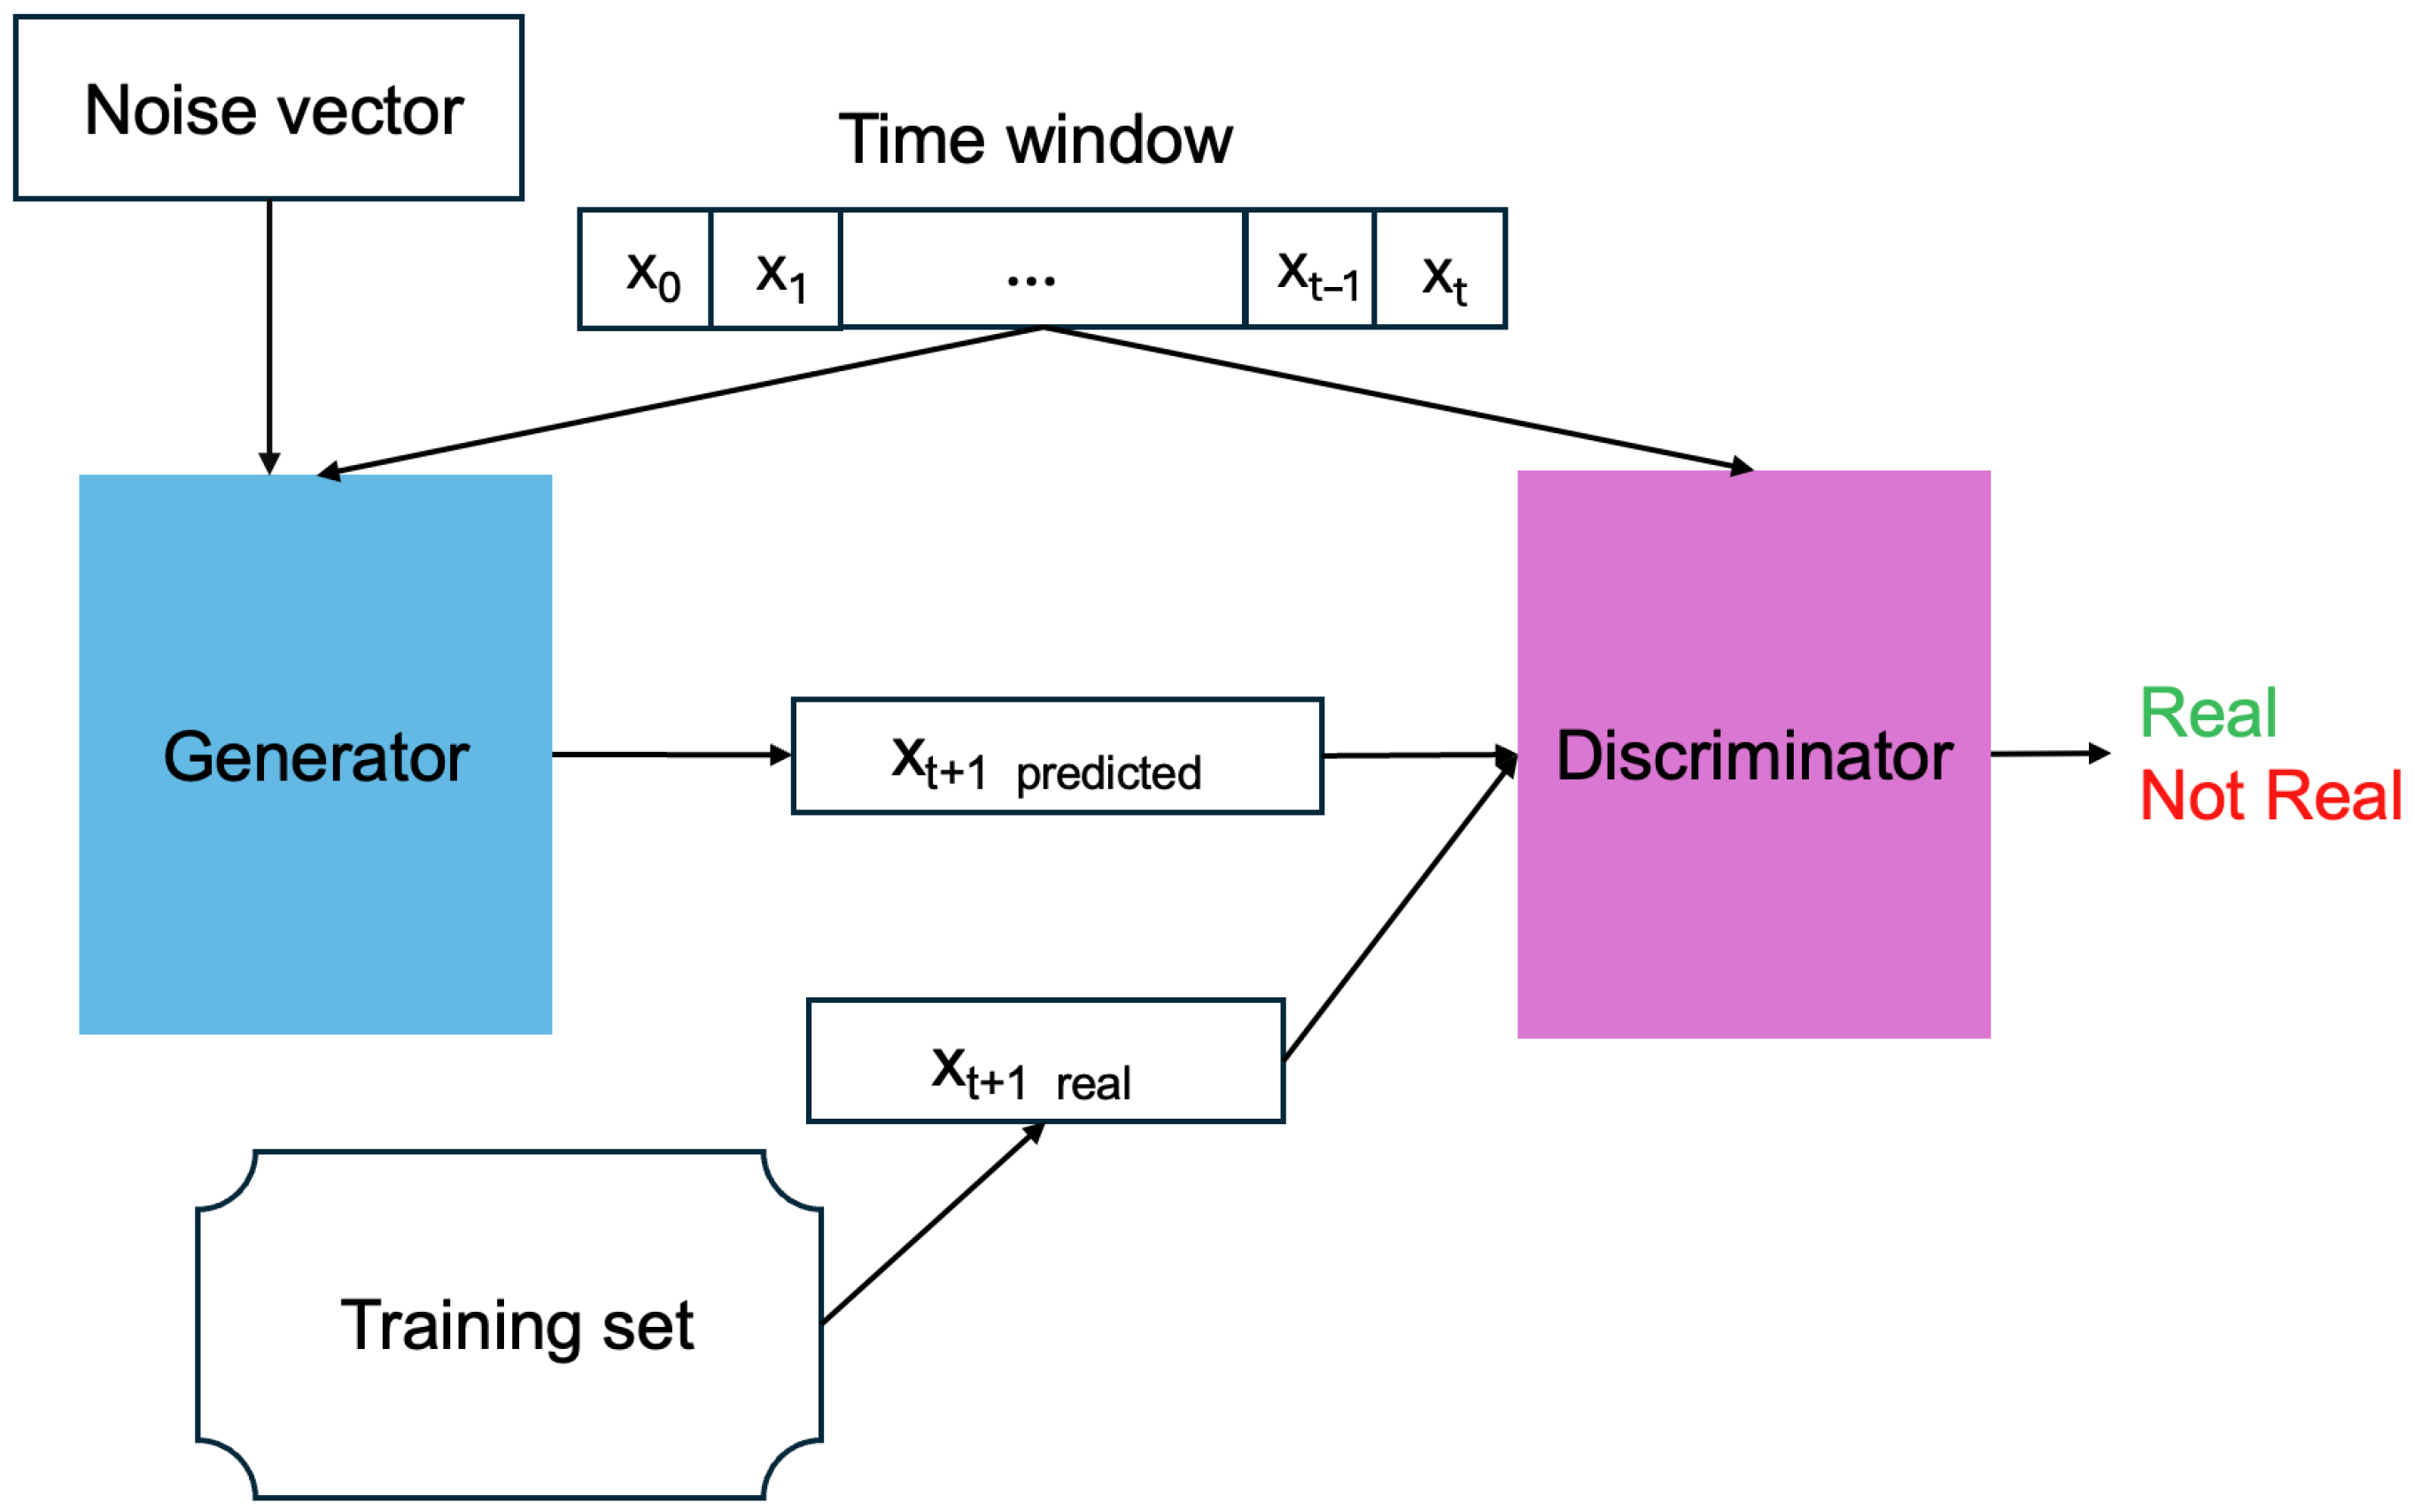
In particular, given the historical data in a time window w = { x 0 , , x t } , the probability distribution of next value x t + 1 is modelled using CGAN. The overview of the implemented network is presented in Figure 3.
Within an adversarial framework, G and D networks utilize historical data. The G’s input is a stochastic vector sampled from a normal distribution ( μ = 0 , σ = 1 ), which it transforms into a prediction for the next time step, x t + 1 , relative to a time window w. Concurrently, D assesses this predicted value, classifying it as either a legitimate forecast or a generated fake.
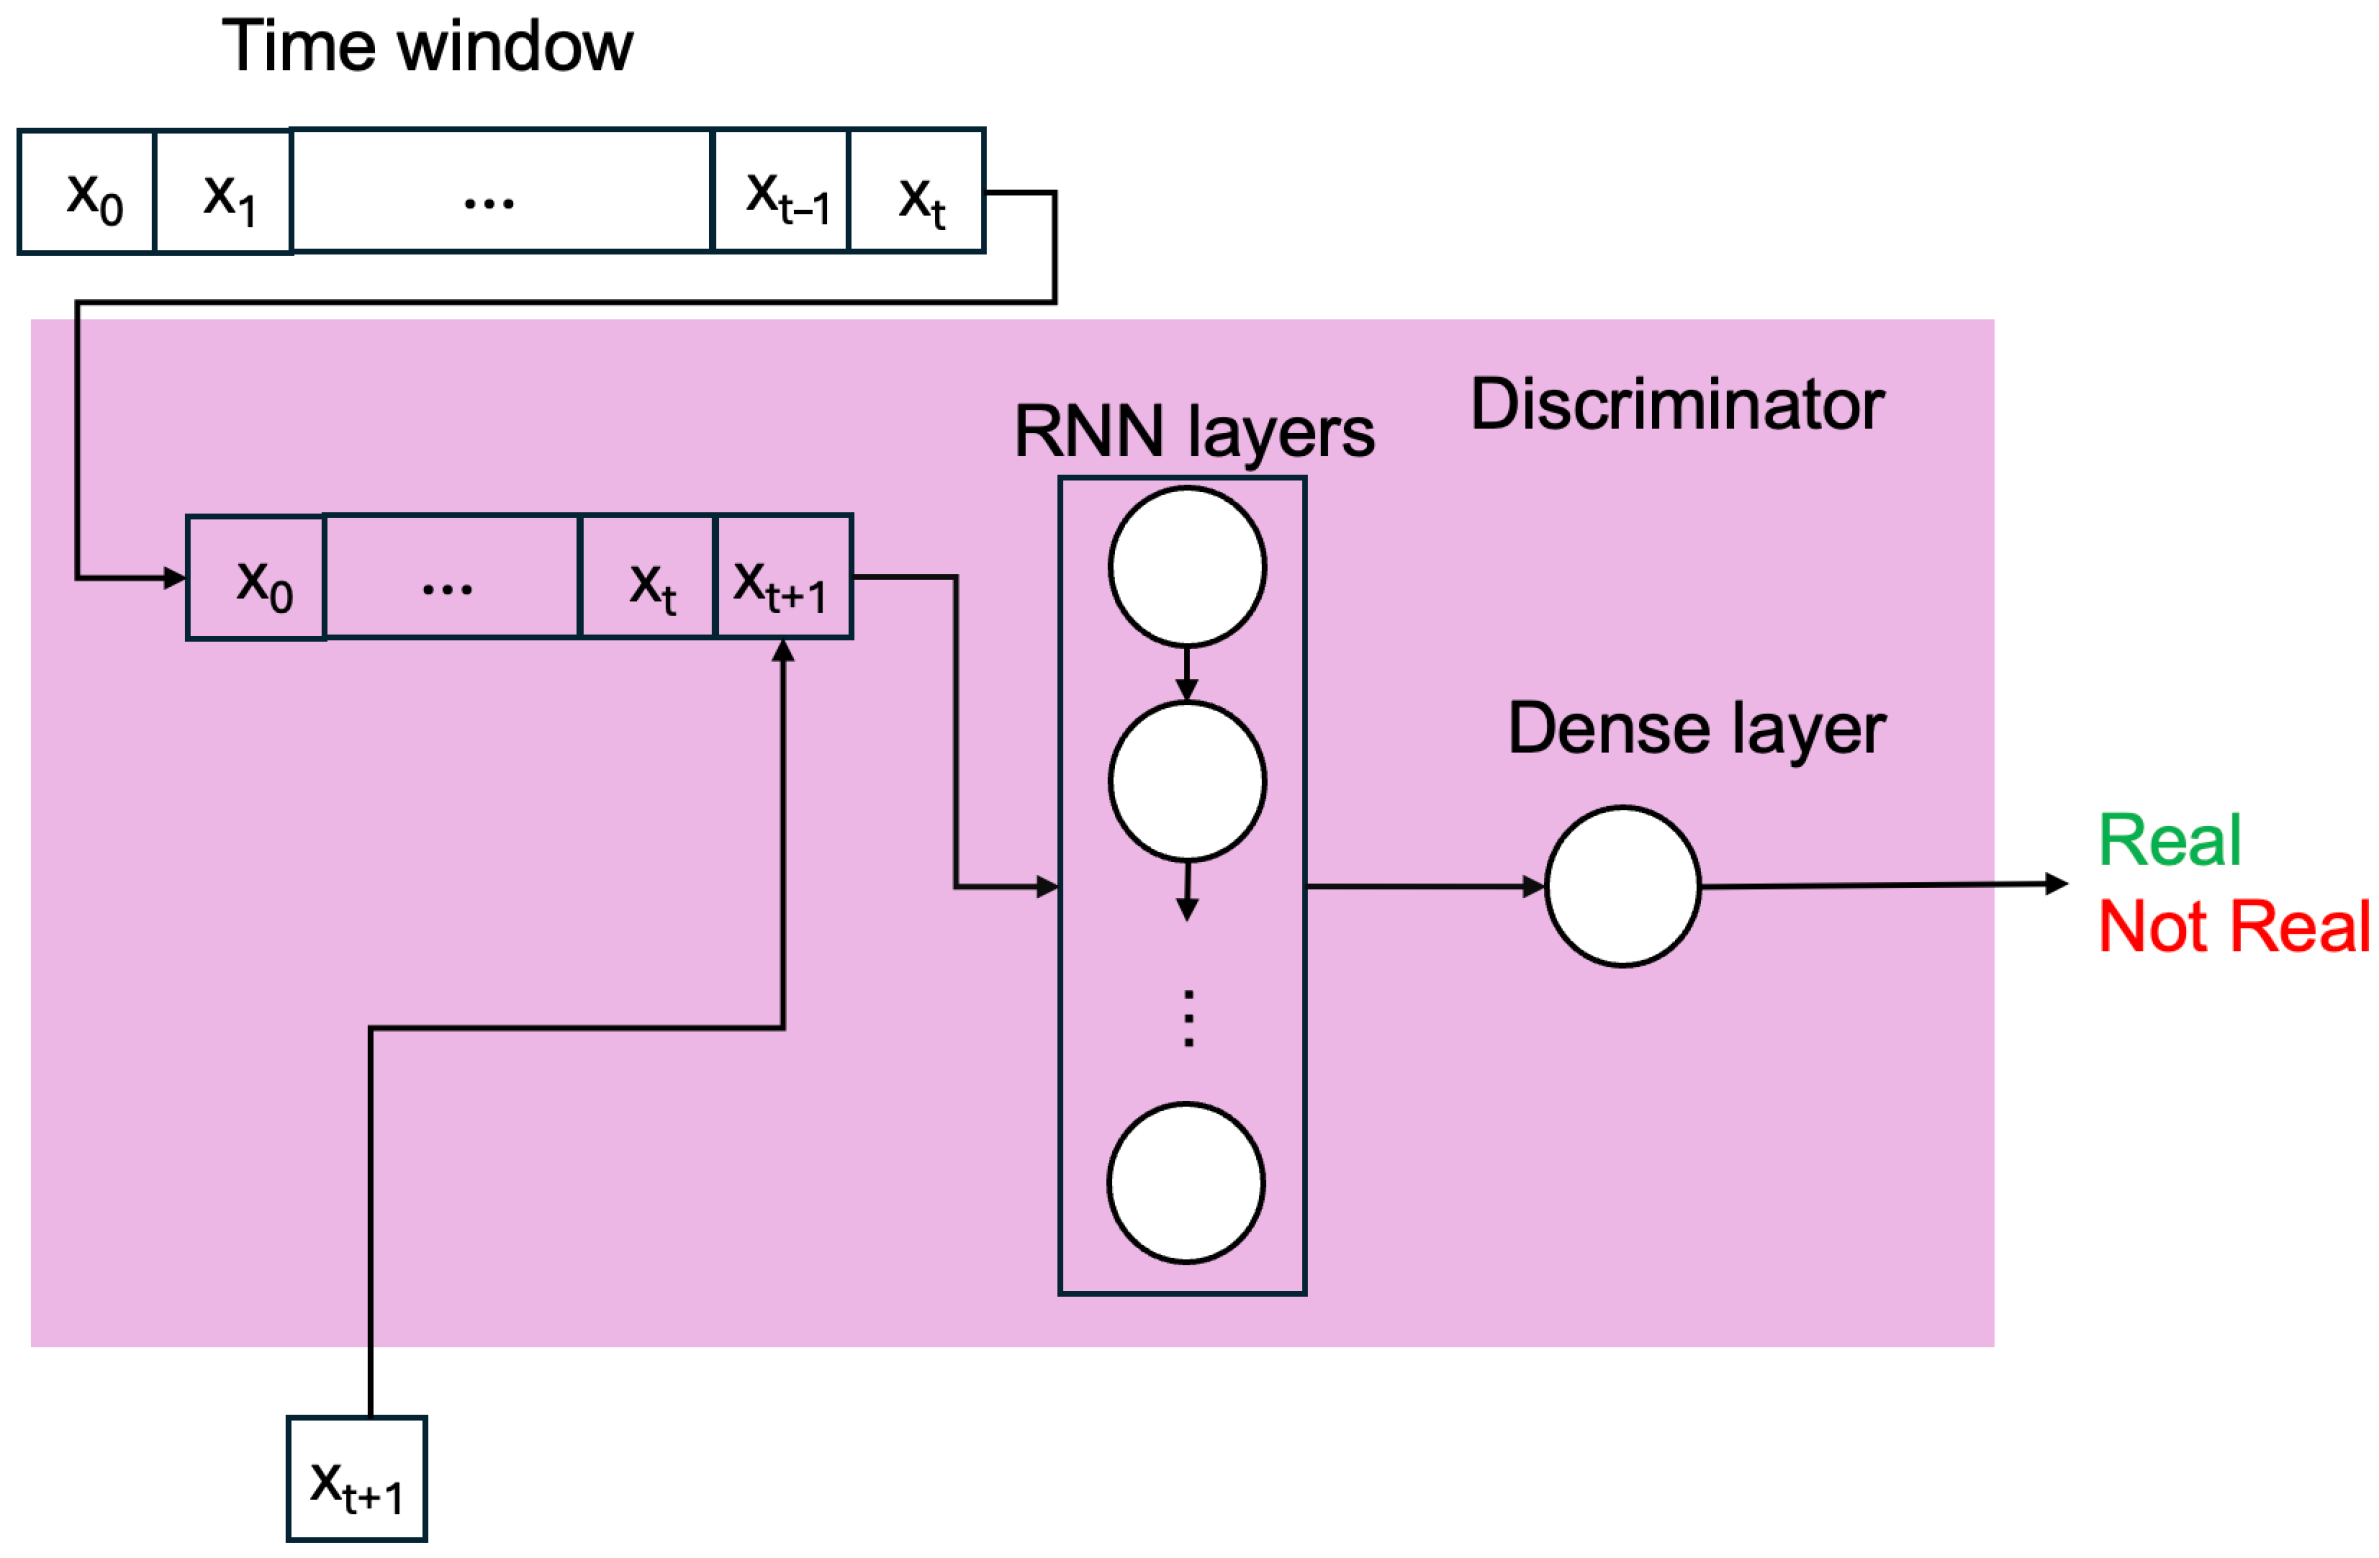
Both G and D are constructed using a Recurrent Neural Network (RNN) [26] variant—either LSTM or GRU, with the layout outlined in Table 1. In the G network (Figure 4), an initial time window is encoded into a hidden state by an RNN layer. The resulting representation is concatenated with a random noise vector, and this combined tensor is propagated through two dense layers to synthesize the subsequent time-step value, x t + 1 . D (Figure 5) is designed to evaluate sequence authenticity, accepting a time window appended with a candidate x t + 1 value (sourced from either the dataset or the generator) to form a complete time-series window. This window is first analyzed by an RNN layer to capture temporal dependencies, and then a final dense layer reduces this information to a single validity score, classifying the input as real or synthetic.

3. Results and Discussion

The accuracy of the CO2 prediction framework was validated through a series of empirical tests. These tests were run on on a Dell Precision 7920 Rack workstation (Dell Technologies, Round Rock, TX, USA), with 256GB RAM, dual Intel Xeon Gold 5218R CPU@2.10Ghz processors (Intel, Santa Clara, CA, USA), three Nvidia RTX A2000 12GB GPUs (Nvidia, Santa Clara, CA, USA) using Python version 3.11 and the following libraries: Tensorflow (2.10), pandas (2.0.3), scikit-learn (1.2.1), and numpy (1.23.5). Root Mean Square Error (RMSE) served as the key metric for evaluating the architectural performance. RMSE is defined by the equation:
R M S E = 1 N i = 1 N ( y i y ¯ i )
In this equation, y i is the ground-truth CO2 value, y ¯ i is the model’s forecast, and N signifies the number of minutes in the forecast horizon.
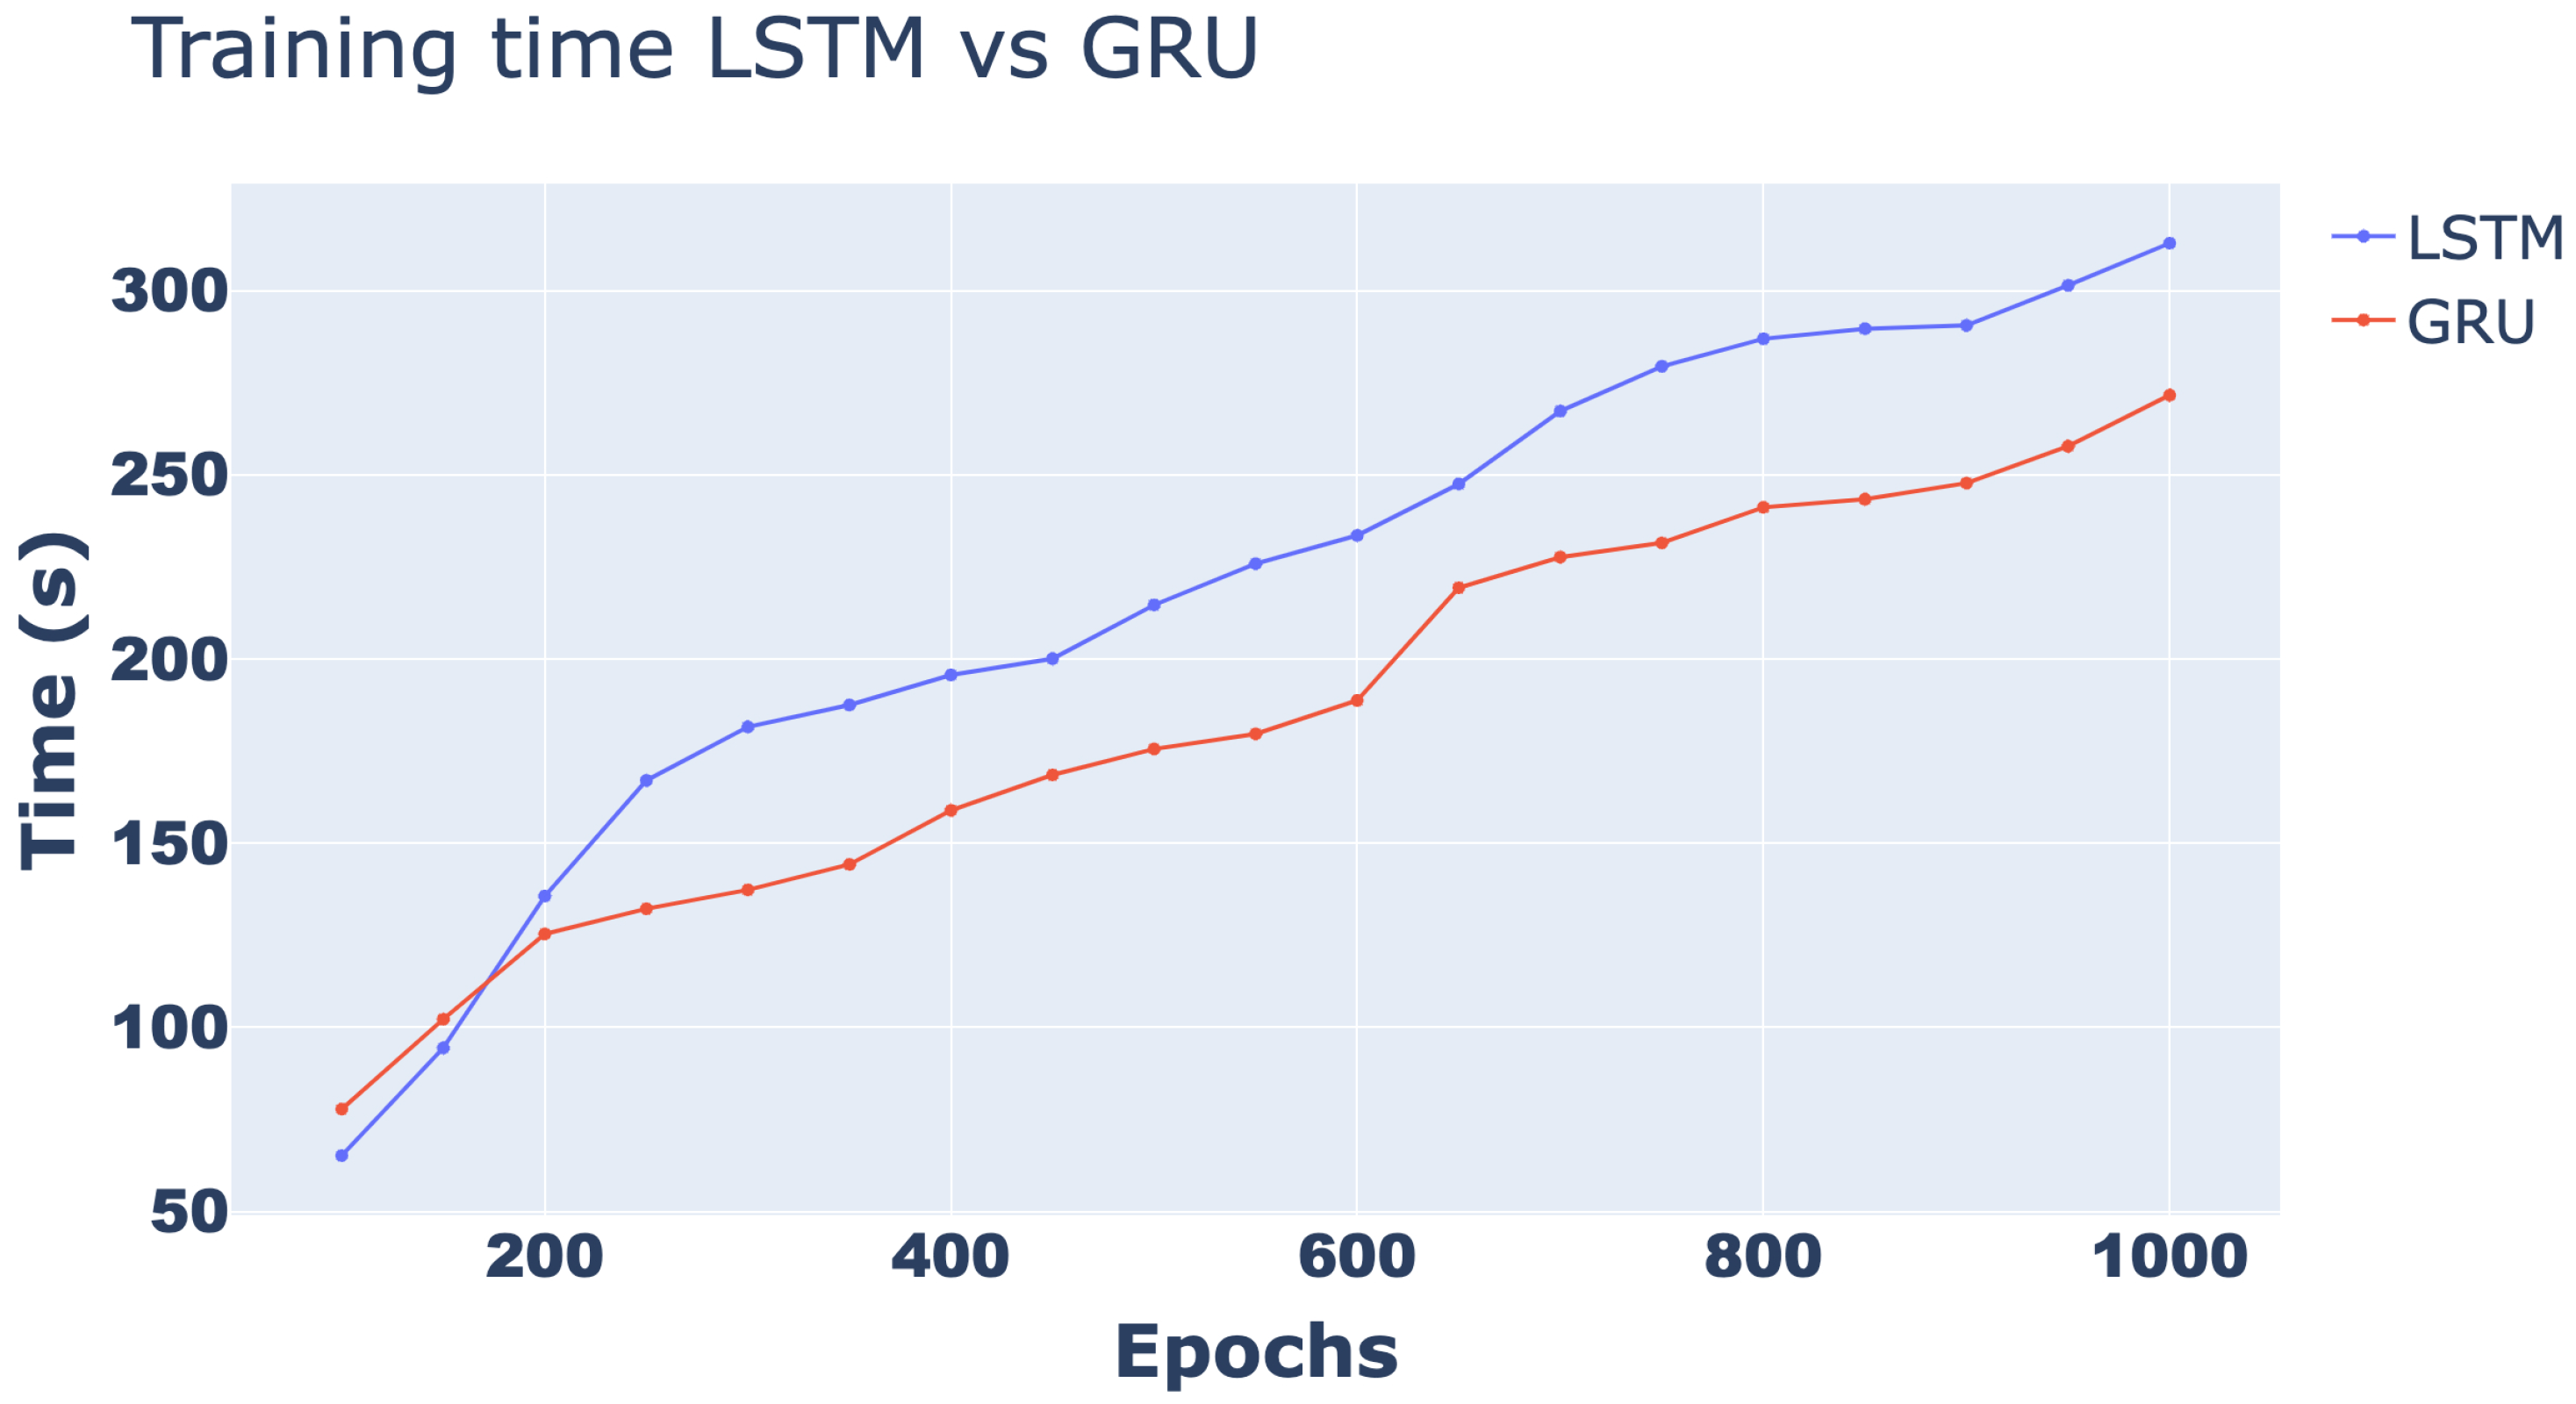
Figure 6 shows the training time when varying the numbers of training epochs for the two types of RNNs used (LSTM and GRU) as the main components of both G and D. As can be seen from the graph, training time tends to increase linearly as the number of epochs increments, with GRU proving to be approximately 80 s faster.
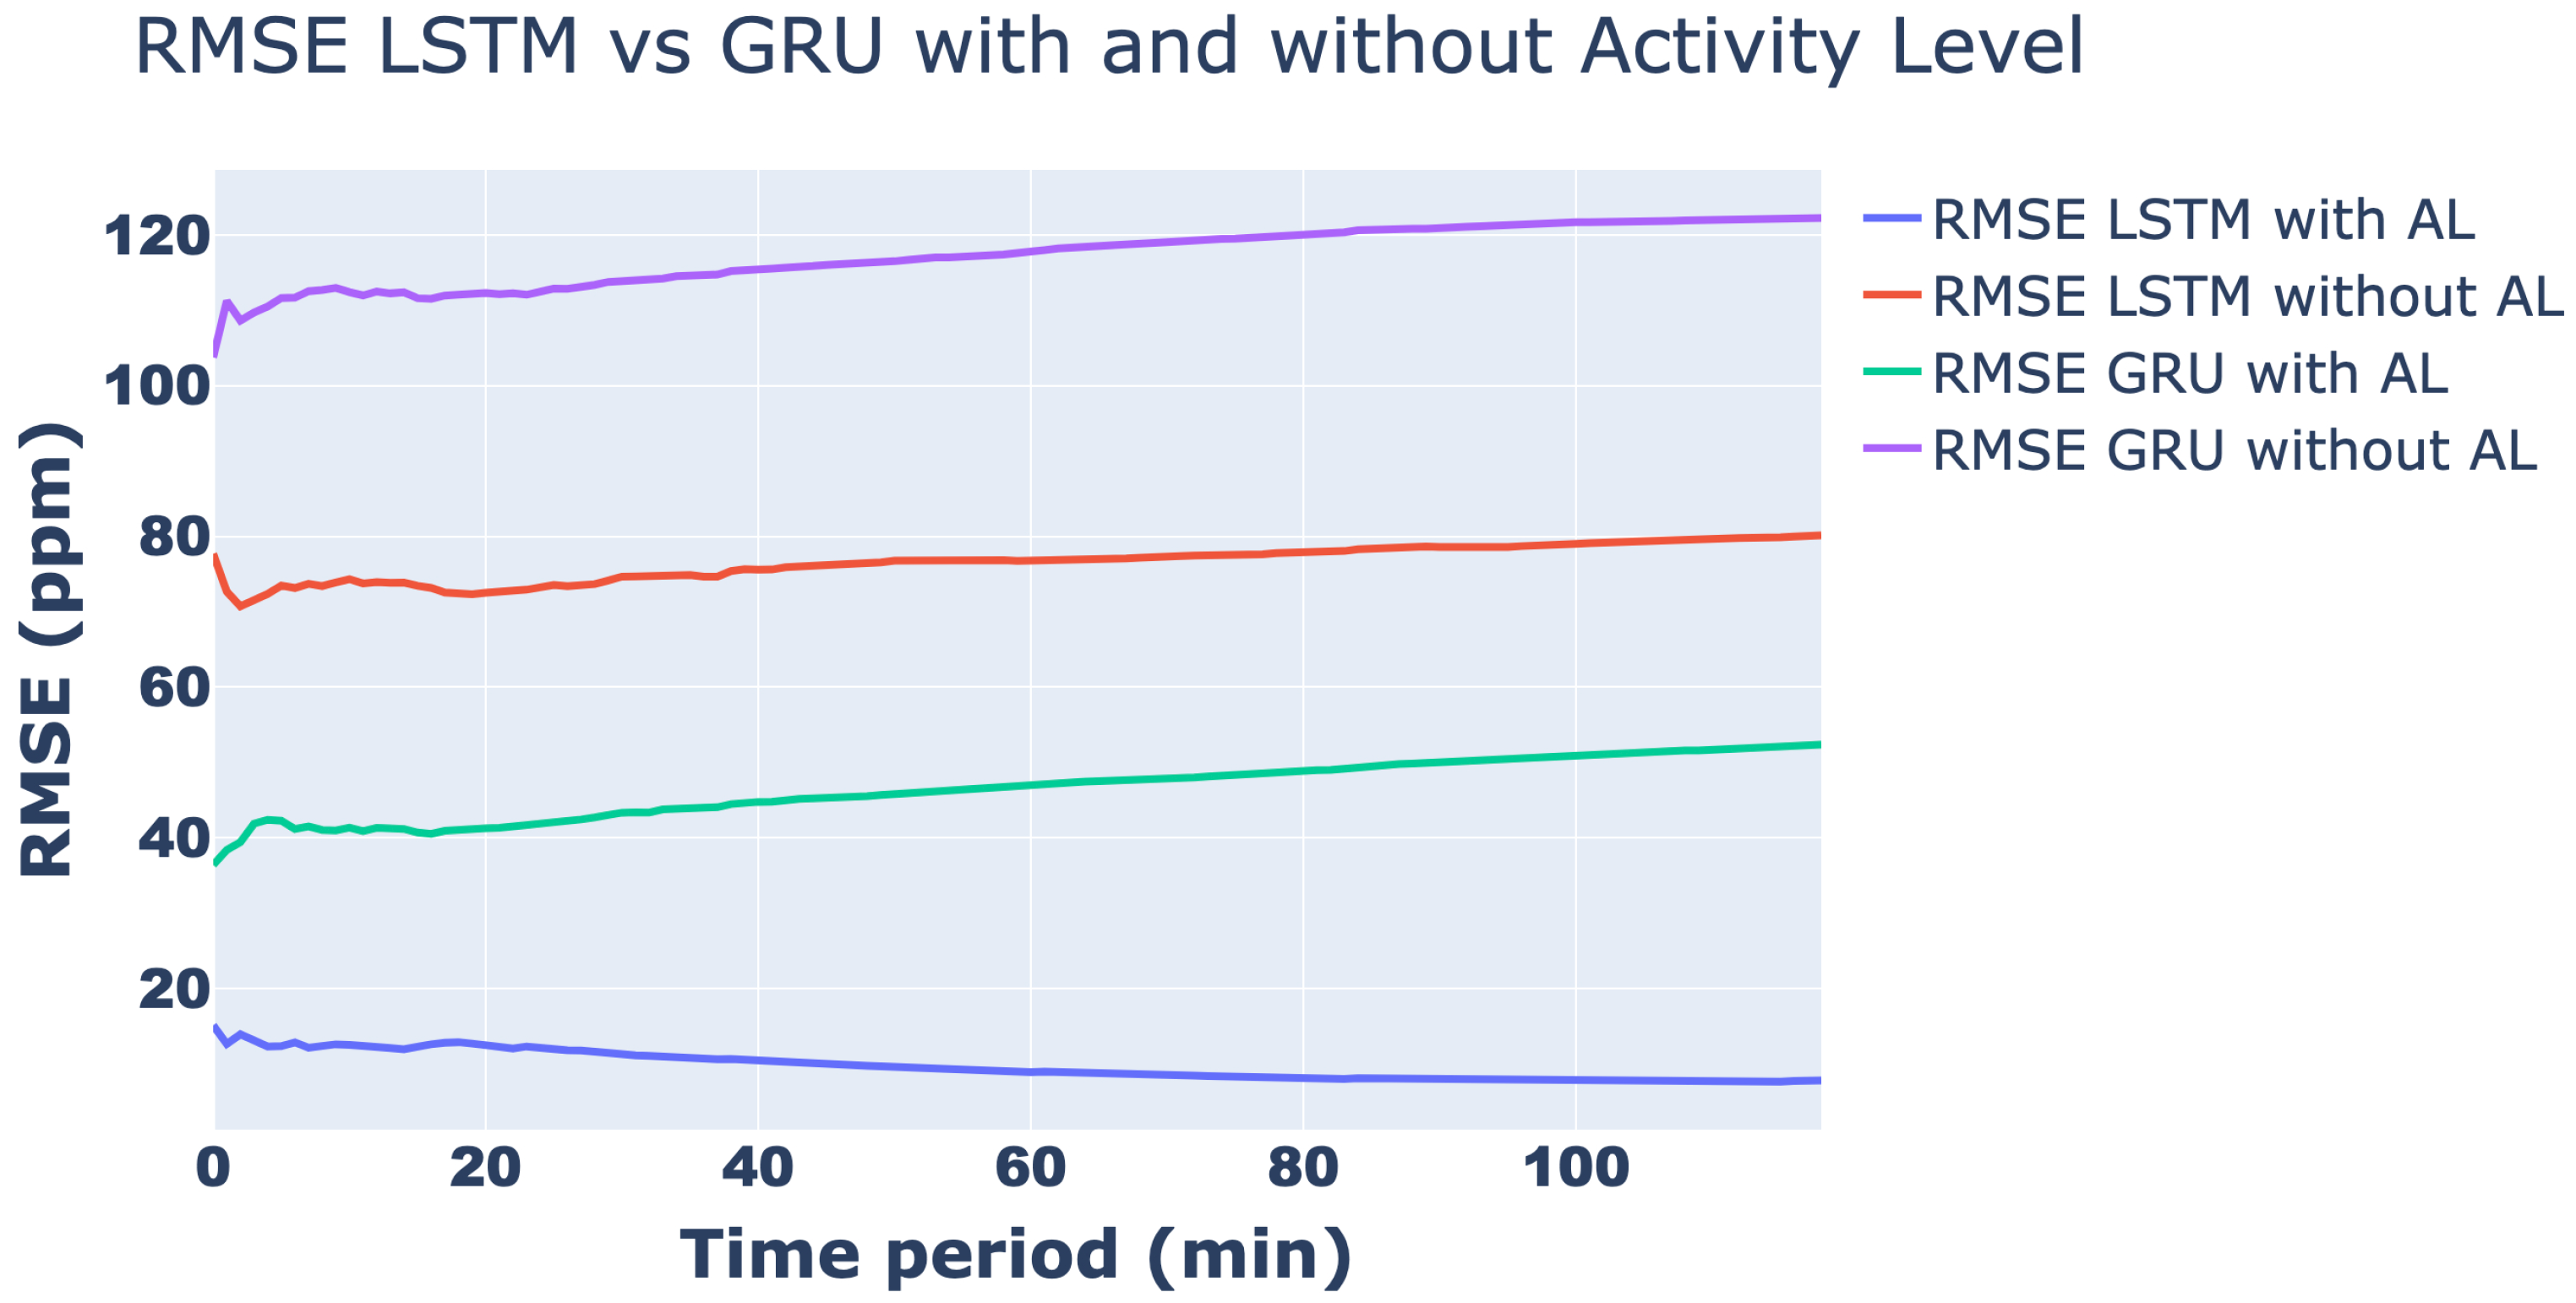
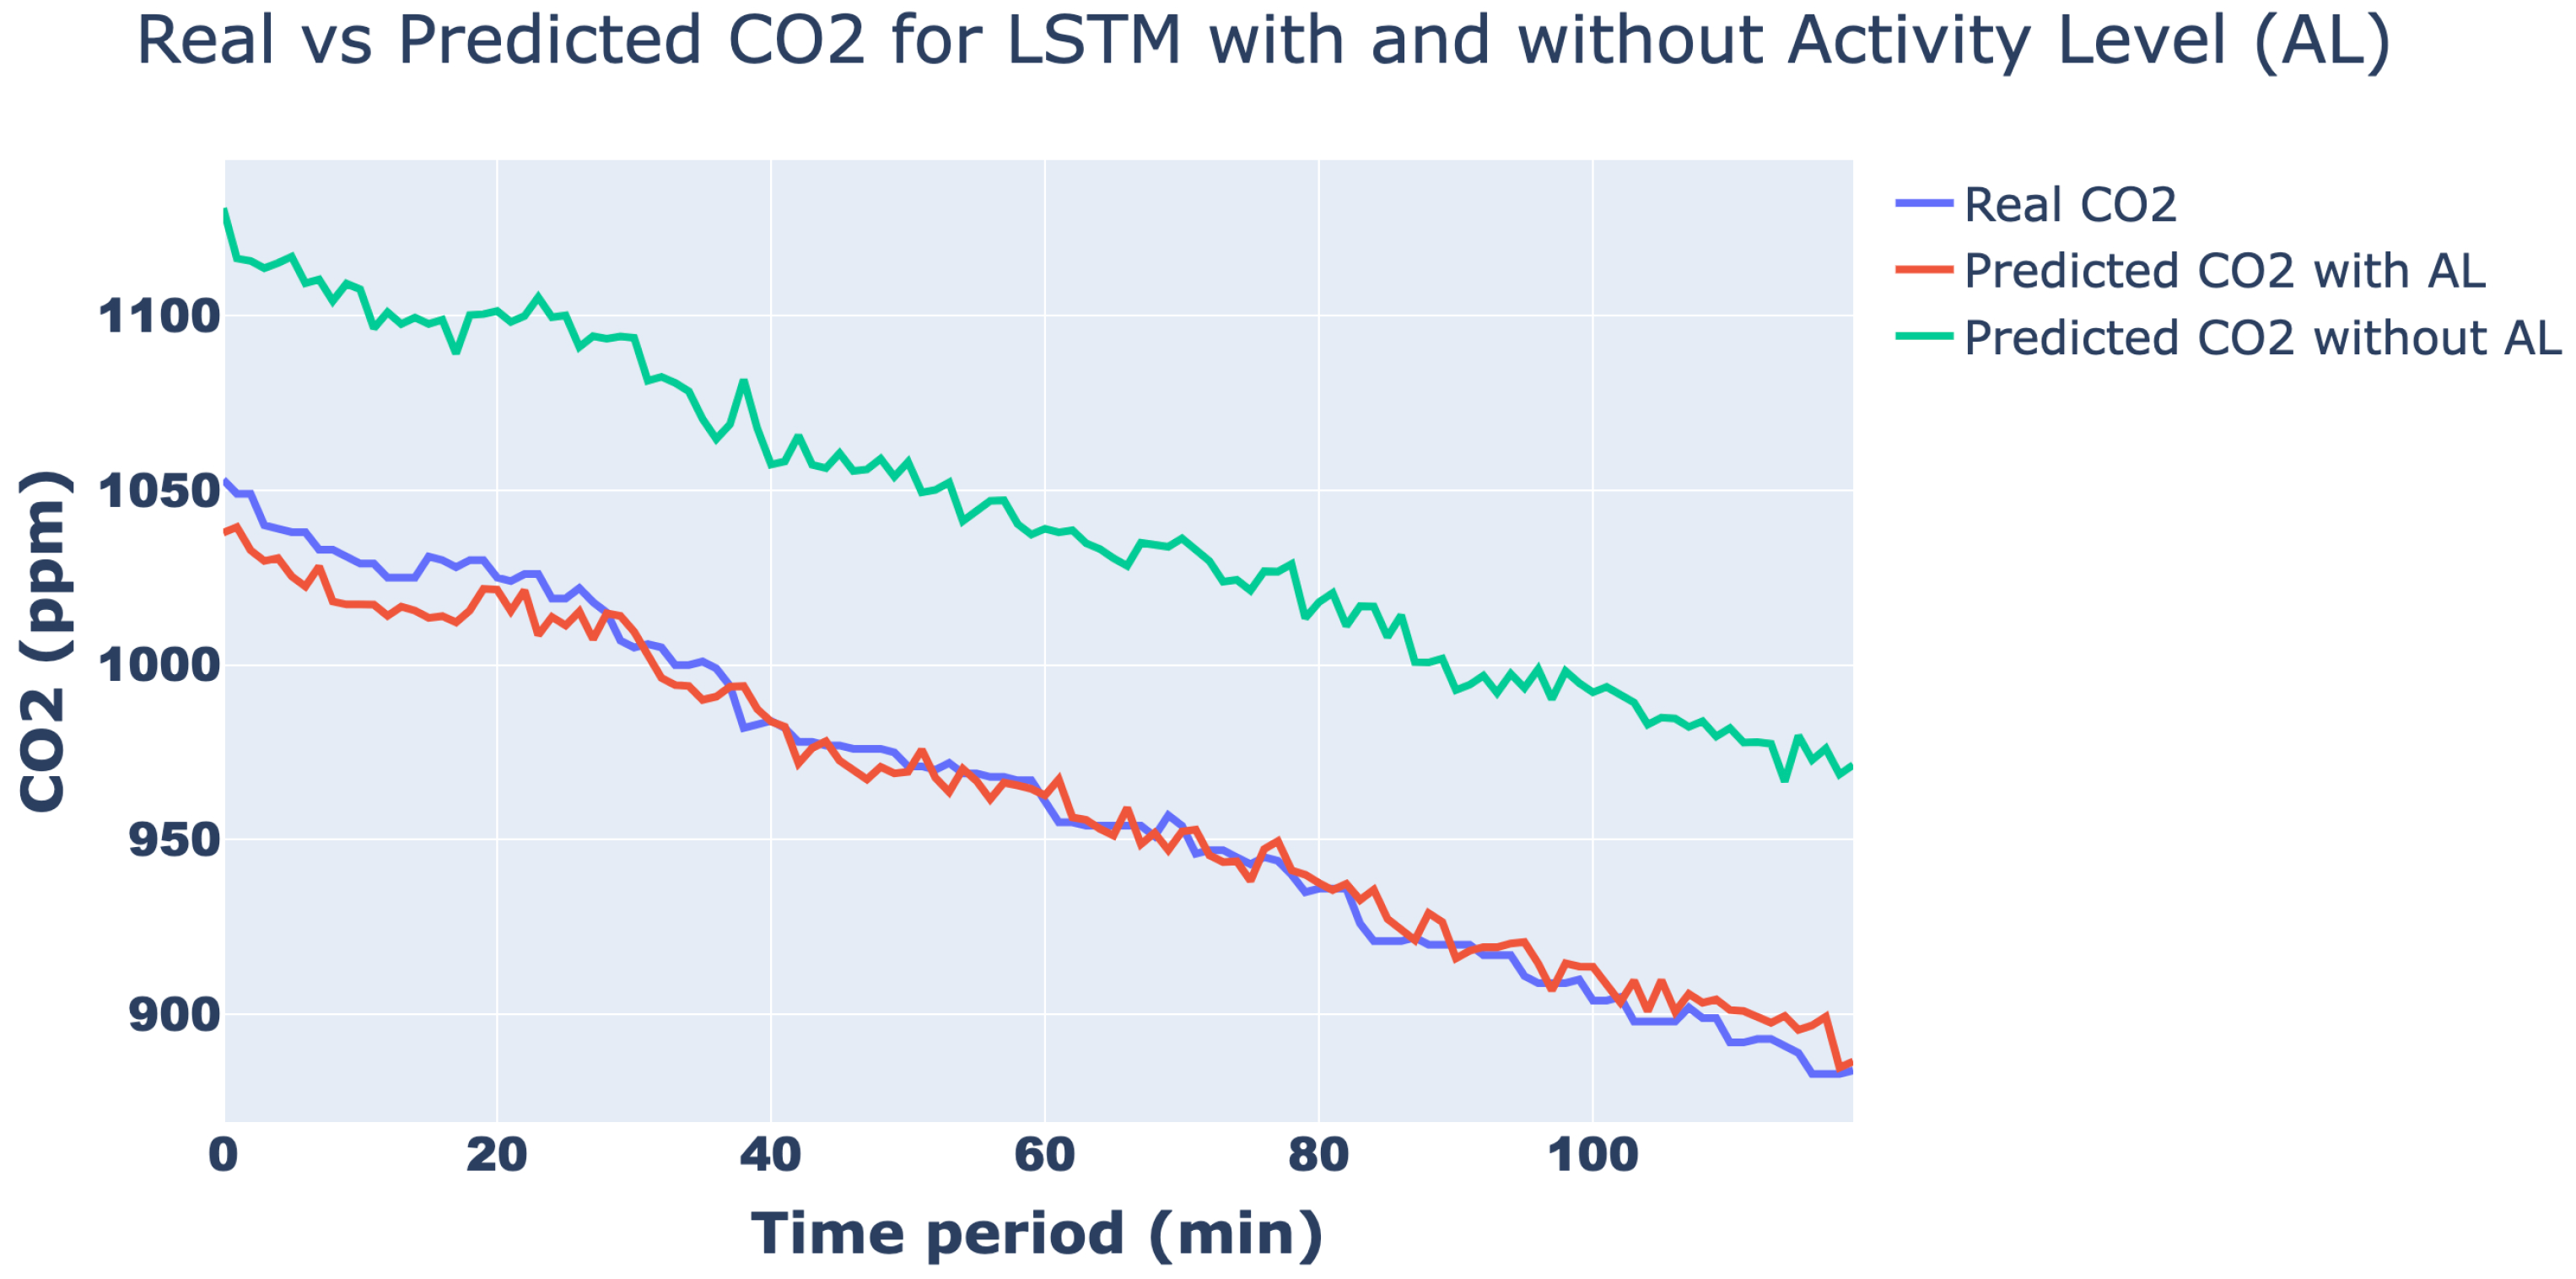
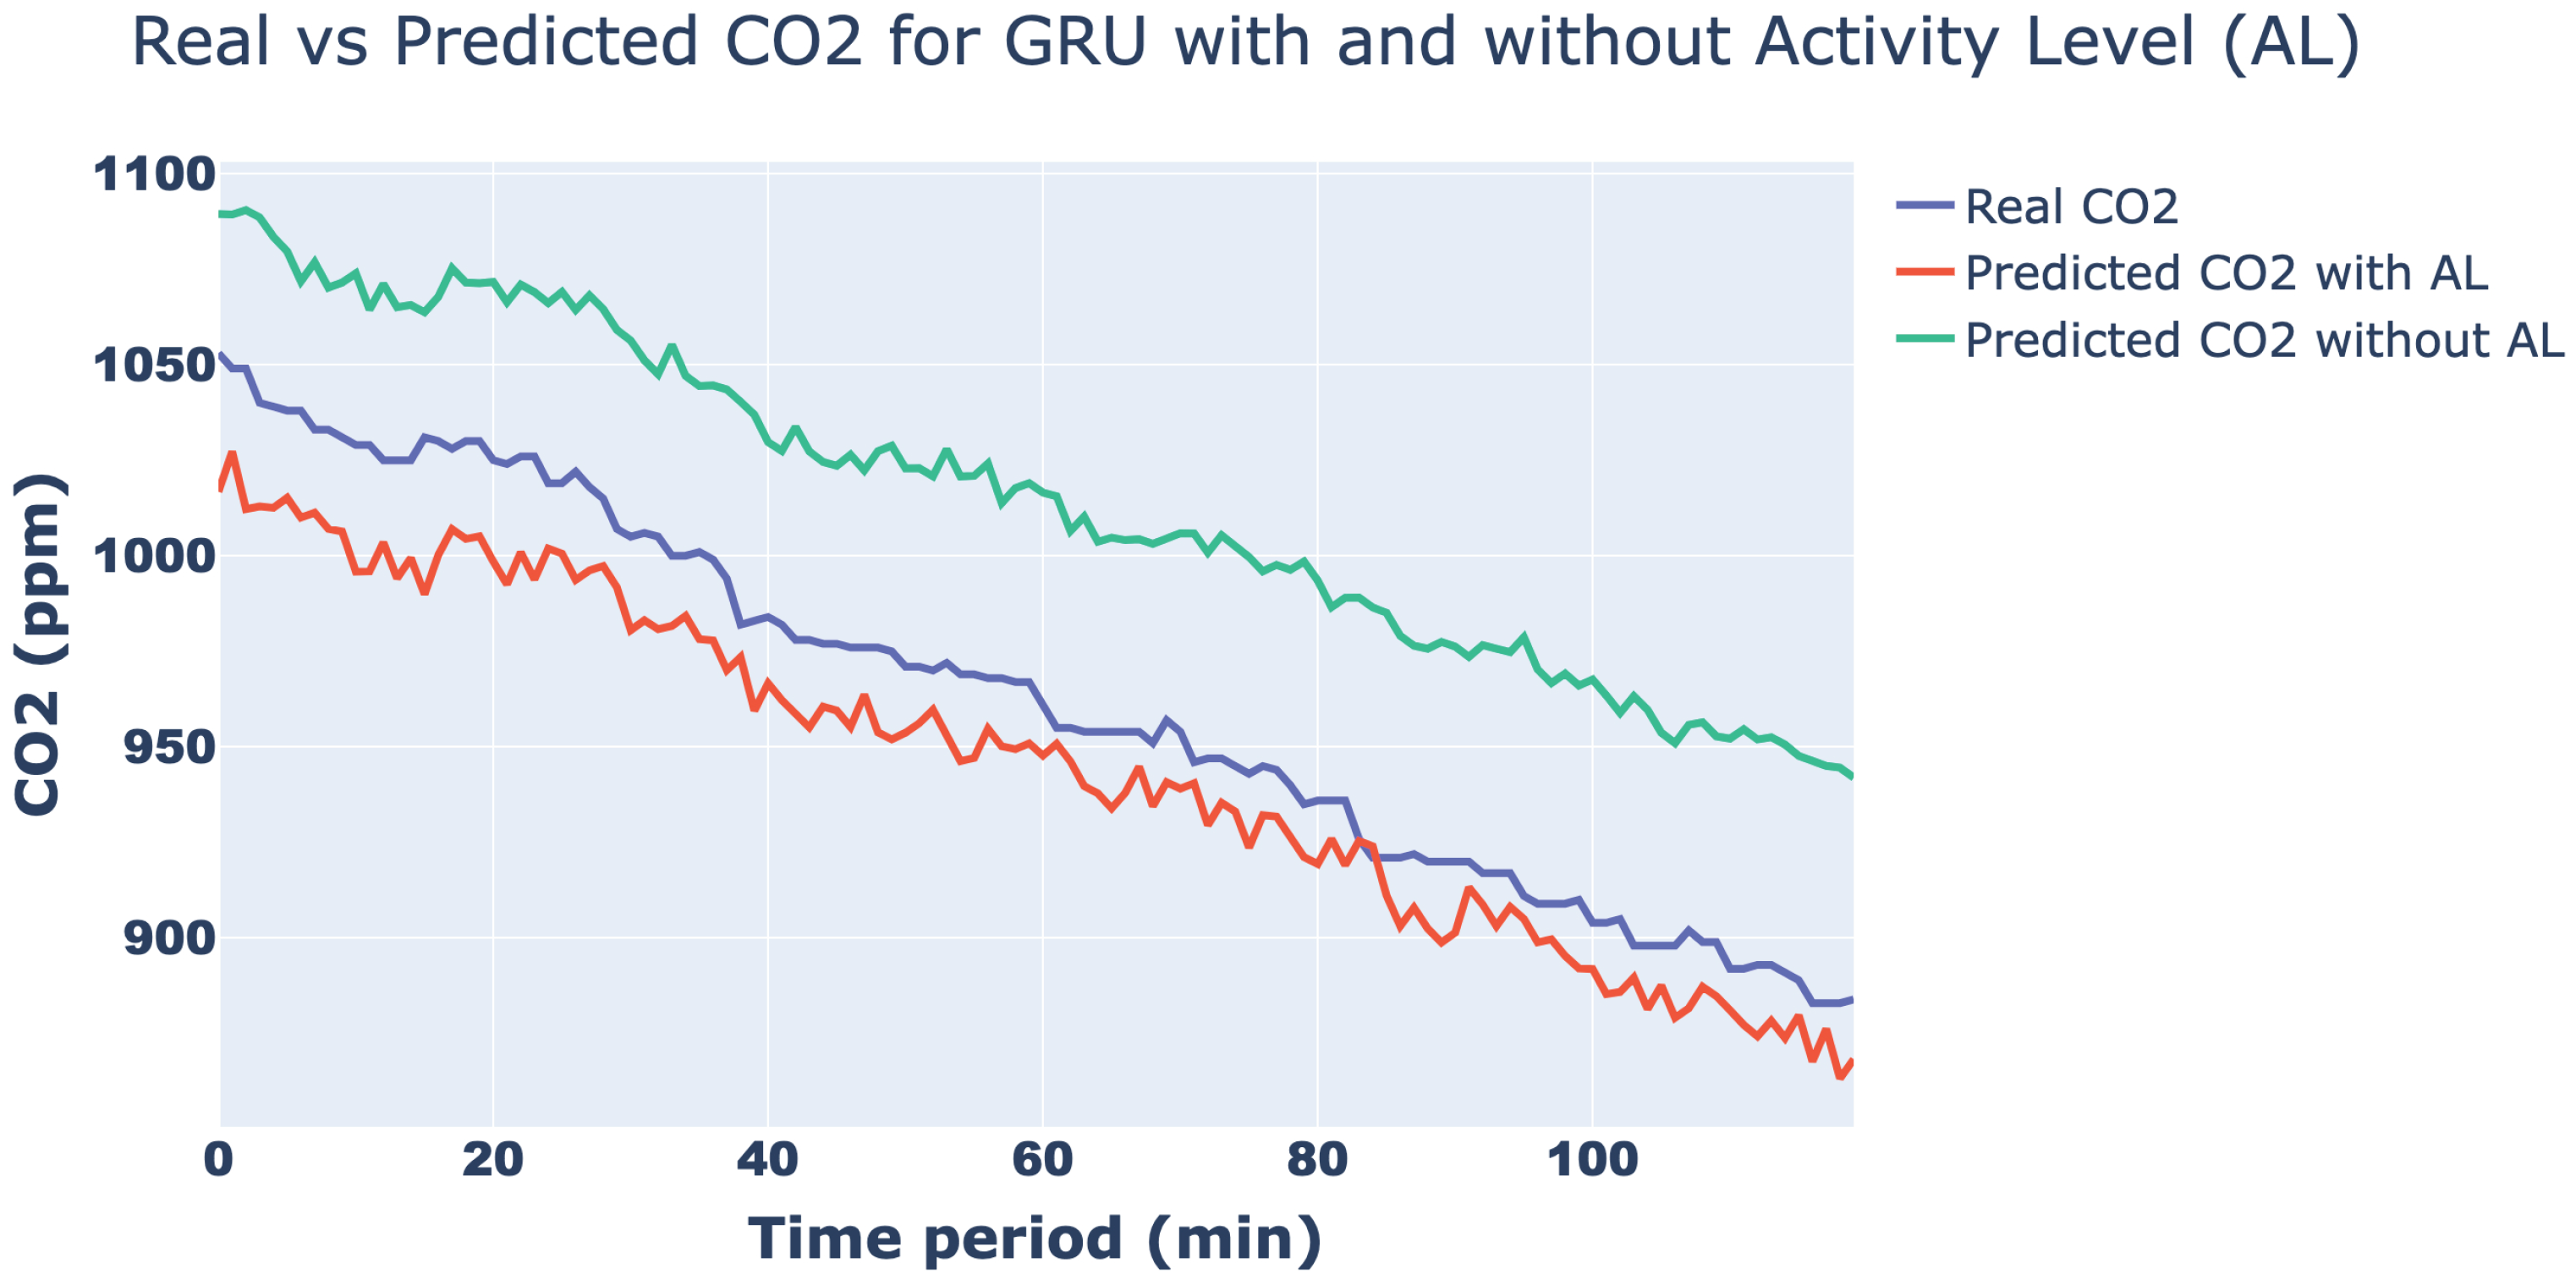
To evaluate the impact of incorporating activity level data, the forecasting performance for 120-min CO2 concentration trends was compared for both LSTM and GRU models, with and without this feature. The results were striking: LSTM model’s RMSE improved from 80.22 ppm to 7.78 ppm with the inclusion of activity data. Similarly, the GRU model’s error decreased from 122.28 ppm to 52.41 ppm. Figure 7 illustrates how the performance of both models changes over different forecasting horizons. Furthermore, Figure 8 and Figure 9 visually compare the 120-min forecast trends of both RNN types, with and without the activity level, highlighting the superior accuracy of the LSTM model. A final summary of these RMSE values is provided in Table 2.
This work ultimately selected LSTM architecture due to its higher forecasting precision, as evidenced by the trends in Figure 8 and Figure 9 and the metrics in Table 2. This decision was made despite GRU’s computational efficiency during training, as LSTM’s training times were deemed sufficiently low to support real-time performance.

4. Conclusions

This study introduces an integrated hardware–software framework designed to monitor and predict CO2 levels in homes for automatic HVAC control. Elevated CO2 concentrations pose health and comfort risks, a problem exacerbated by modern, highly insulated homes that reduce natural air exchange. This environment can lead to rapid CO2 accumulation, necessitating continuous air quality assessment for timely intervention.
The system operates adaptively, using a short historical data window to accurately predict near-future CO2 trends. This efficient use of data also makes the approach suitable for implementation on low-cost embedded hardware, promoting wider adoption.
It employs low-cost, wireless environmental and wearable sensors to monitor temperature, humidity, CO2, and occupant physical activity in real time. Incorporating activity data significantly improved prediction accuracy, albeit adding some hardware complexity. A GAN model, primarily using LSTM networks as main component of G and D, achieved the best results, yielding a low RMSE of approximately 8 ppm. This high accuracy was achieved with a condensed training period of just 10 days (5 real and 5 simulated), shorter than other methods.
The framework was validated in a real single-room setting used for remote work and exercise. Future work will expand monitoring to multiple rooms with several occupants and explore less invasive activity tracking, such as smartwatches.

Author Contributions

Conceptualization, A.L., A.M., A.C. and G.R.; methodology, A.L., A.M., A.C. and G.R.; validation and experimental investigation, A.L., A.M., A.C. and G.R.; writing—original draft preparation, A.L., A.M., A.C. and G.R.; review and editing, A.L., A.M., A.C. and G.R.; supervision, A.L. All authors have read and agreed to the published version of the manuscript.

Funding

This paper was developed within the project funded by Next Generation EU—“Age-It—Ageing well in an ageing society” project (PE0000015), National Recovery and Resilience Plan (NRRP)—PE8—Mission 4, C2, Intervention 1.3. The views and opinions expressed are only those of the authors and do not necessarily reflect those of the European Union or the European Commission. Neither the European Union nor the European Commission can be held responsible for them.

Institutional Review Board Statement

Not applicable.

Informed Consent Statement

Not applicable.

Data Availability Statement

The data presented in this study are available on request from the corresponding author. The data are not publicly available due to restrictions (with them containing information that could compromise the privacy of research participants).

Conflicts of Interest

The authors declare no conflicts of interest.

References

  1. Marć, M.; Tobiszewski, M.; Zabiegała, B.; de la Guardia, M.; Namieśnik, J. Current air quality analytics and monitoring: A review. Anal. Chim. Acta 2015, 853, 116–126. [Google Scholar] [CrossRef]
  2. Hu, Y.; Wu, M.; Li, Y.; Liu, X. Influence of PM1 exposure on total and cause-specific respiratory diseases: A systematic review and meta-analysis. Environ. Sci. Pollut. Res. Int. 2022, 29, 15117–15126. [Google Scholar] [CrossRef]
  3. Xu, J.; Chen, Y.; Lu, F.; Chen, L.; Dong, Z. The Association between Short-Term Exposure to PM1 and Daily Hospital Admission and Related Expenditures in Beijing. Toxics 2024, 12, 393. [Google Scholar] [CrossRef] [PubMed]
  4. Hattori, S.; Iwamatsu, T.; Miura, T.; Tsutsumi, F.; Tanaka, N. Investigation of Indoor Air Quality in Residential Buildings by Measuring CO2 Concentration and a Questionnaire Survey. Sensors 2022, 22, 7331. [Google Scholar] [CrossRef] [PubMed]
  5. Azuma, K.; Kagi, N.; Yanagi, U.; Osawa, H. Effects of low-level inhalation exposure to carbon dioxide in indoor environments: A short review on human health and psychomotor performance. Environ. Int. 2018, 121, 51–56. [Google Scholar] [CrossRef]
  6. Apte, M.G.; Fisk, W.J.; Daisey, J.M. Association between indoor CO2 concentrations and Sick Building Syndrome in U.S. office buildings: An analysis of the 1994–1996 base study data. Indoor Air 2000, 10, 246–257. [Google Scholar] [CrossRef] [PubMed]
  7. Baudet, A.; Baurès, E.; Blanchard, O.; Le Cann, P.; Gangneux, J.P.; Florentin, A. Indoor Carbon Dioxide, Fine Particulate Matter and Total Volatile Organic Compounds in Private Healthcare and Elderly Care Facilities. Toxics 2022, 10, 136. [Google Scholar] [CrossRef]
  8. Folk, A.L.; Wagner, B.E.; Hahn, S.L.; Larson, N.; Barr-Anderson, D.J.; Neumark-Sztainer, D. Changes to Physical Activity during a Global Pandemic: A Mixed Methods Analysis among a Diverse Population-Based Sample of Emerging Adults in the US. Int. J. Environ. Res. Public Health 2021, 18, 3674. [Google Scholar] [CrossRef]
  9. Persily, A.; de Jonge, L. Carbon dioxide generation rates for building occupants. Indoor Air 2017, 27, 868–879. [Google Scholar] [CrossRef] [PubMed]
  10. Wei, W.; Ramalho, O.; Malingre, L.; Sivanantham, S.; Little, J.C.; Mandin, C. Machine learning and statistical models for predicting indoor air quality. Indoor Air 2019, 29, 704–726. [Google Scholar] [CrossRef]
  11. Candanedo, L.M.; Feldheim, V. Accurate occupancy detection of an office room from light, temperature, humidity and CO2 measurements using statistical learning models. Energy Build 2016, 112, 28–39. [Google Scholar] [CrossRef]
  12. Khazaei, B.; Shiehbeigi, A.; Kani, A.H.M.A. Modeling indoor air carbon dioxide concentration using artificial neural network. Int. J. Environ. Sci. Technol. 2019, 16, 729–736. [Google Scholar] [CrossRef]
  13. Ahn, J.; Shin, D.; Kim, K.; Yang, J. Indoor air quality analysis using deep learning with sensor data. Sensors 2017, 17, 2476. [Google Scholar] [CrossRef]
  14. Kallio, J.; Tervonen, J.; Räsänen, P.; Mäkynen, R.; Koivusaari, J.; Peltola, J. Forecasting office indoor CO2 concentration using machine learning with a one-year dataset. Build. Environ. 2021, 187, 107409. [Google Scholar] [CrossRef]
  15. Putra, J.C.P.; Safrilah; Ihsan, M. The prediction of indoor air quality in office room using artificial neural network. In Proceedings of the 4th International Conference on Engineering, Technology, and Industrial Application (ICETIA), Surakarta, Indonesia, 13–14 December 2017. [Google Scholar]
  16. Segala, G.; Doriguzzi-Corin, R.; Peroni, C.; Gazzini, T.; Siracusa, D. A Practical and Adaptive Approach to Predicting Indoor CO2. Appl. Sci. 2021, 11, 10771. [Google Scholar] [CrossRef]
  17. Rescio, G.; Manni, A.; Caroppo, A.; Carluccio, A.M.; Siciliano, P.; Leone, A. Multi-Sensor Platform for Predictive Air Quality Monitoring. Sensors 2023, 23, 5139. [Google Scholar] [CrossRef] [PubMed]
  18. Upsens, QuAir. Available online: https://www.upsens.com/quair (accessed on 11 September 2025).
  19. SMARTEX. Available online: https://www.smartex.it/ (accessed on 11 September 2025).
  20. Leone, A.; Rescio, G.; Diraco, G.; Manni, A.; Siciliano, P.; Caroppo, A. Ambient and Wearable Sensor Technologies for Energy Expenditure Quantification of Ageing Adults. Sensors 2022, 22, 4893. [Google Scholar] [CrossRef]
  21. Leone, A.; Rescio, G.; Caroppo, A.; Siciliano, P.; Manni, A. Human Postures Recognition by Accelerometer Sensor and ML Architecture Integrated in Embedded Platforms: Benchmarking and Performance Evaluation. Sensors 2023, 23, 1039. [Google Scholar] [CrossRef]
  22. Chakraborty, T.; KS, U.R.; Naik, S.M.; Panja, M.; Manvitha, B. Ten years of generative adversarial nets (GANs): A survey of the state-of-the-art. Mach. Learn. Sci. Technol. 2024, 5, 011001. [Google Scholar] [CrossRef]
  23. Saxena, D.; Cao, J. Generative adversarial networks (GANs survey): Challenges, solutions, and future directions. arXiv 2023, arXiv:2005.00065. [Google Scholar] [CrossRef]
  24. Lin, Y.; Yu, X.; Cheng, T. Multi-task Semantic Segmentation for Apolloscape based on CGAN. J. Phys. Conf. Ser. 2020, 1550, 032071. [Google Scholar] [CrossRef]
  25. He, G.; Liu, K.; Wang, S.; Lei, Y.; Li, J. CWM-CGAN Method for Renewable Energy Scenario Generation Based on Weather Label Multi-Factor Definition. Processes 2022, 10, 470. [Google Scholar] [CrossRef]
  26. Lin, T.; Horne, B.G.; Tino, P.; Giles, C.L. Learning long-term dependencies in NARX recurrent neural networks. IEEE Trans. Neural Netw. 1996, 7, 1329–1338. [Google Scholar] [PubMed]
Figure 1. (a) Upsens UPAI3-CPVTHA air quality sensor (UpSense, Trento, Itay) (b) Smartex WWS sensorized t-shirt (Smartex, Cascina, Italy).
Engproc 110 00003 g001
Figure 2. GAN operation flowchart.
Engproc 110 00003 g002
Figure 3. Overview of the proposed CGAN architecture. The time window w is forwarded to G and D.
Engproc 110 00003 g003
Figure 4. Architecture of G in detail.
Engproc 110 00003 g004
Figure 5. Architecture of D in detail.
Engproc 110 00003 g005
Figure 6. Training time for LSTM and GRU varying the numbers of training epochs.
Engproc 110 00003 g006
Figure 7. RMSE for LSTM and GRU with and without activity level for 120 min of forecasting.
Engproc 110 00003 g007
Figure 8. CO2-concentration forecasting results for 120 min with and without activity levels for LSTM.
Engproc 110 00003 g008
Figure 9. CO2-concentrationforecasting results for 120 min with and without activity levels for GRU.
Engproc 110 00003 g009
Table 1. Hyperparameters for the proposed GAN models (# is number of).
HyperparameterRNN Variant
LSTMGRU
# cells in G648
# cells in D12832
Size of noise vector416
Size of time window44
# training iteration for D42
Table 2. RMSE for CO2 concentration forecasting for 120 min with and without activity levels.
Cell TypeRMSE (ppm)
With Activity LevelWithout Activity Level
LSTM7.7880.22
GRU52.41122.28
Disclaimer/Publisher’s Note: The statements, opinions and data contained in all publications are solely those of the individual author(s) and contributor(s) and not of MDPI and/or the editor(s). MDPI and/or the editor(s) disclaim responsibility for any injury to people or property resulting from any ideas, methods, instructions or products referred to in the content.