Abstract
Analysis methods for plateau surfaces have been described in the ISO standards, JIS, and previous studies. The authors of a previous study proposed a method based on the concept of random sample consensus (RANSAC). This method achieved high analysis accuracy for plateau surfaces by setting detailed conditions. However, the process of setting optimal conditions is performed manually, which reduces productivity due to the manpower and man-hours required. In this study, we propose a new method for automating the setting of conditions. This method, which does not require human intervention, is expected to contribute to the improvement of productivity at production sites.
1. Introduction
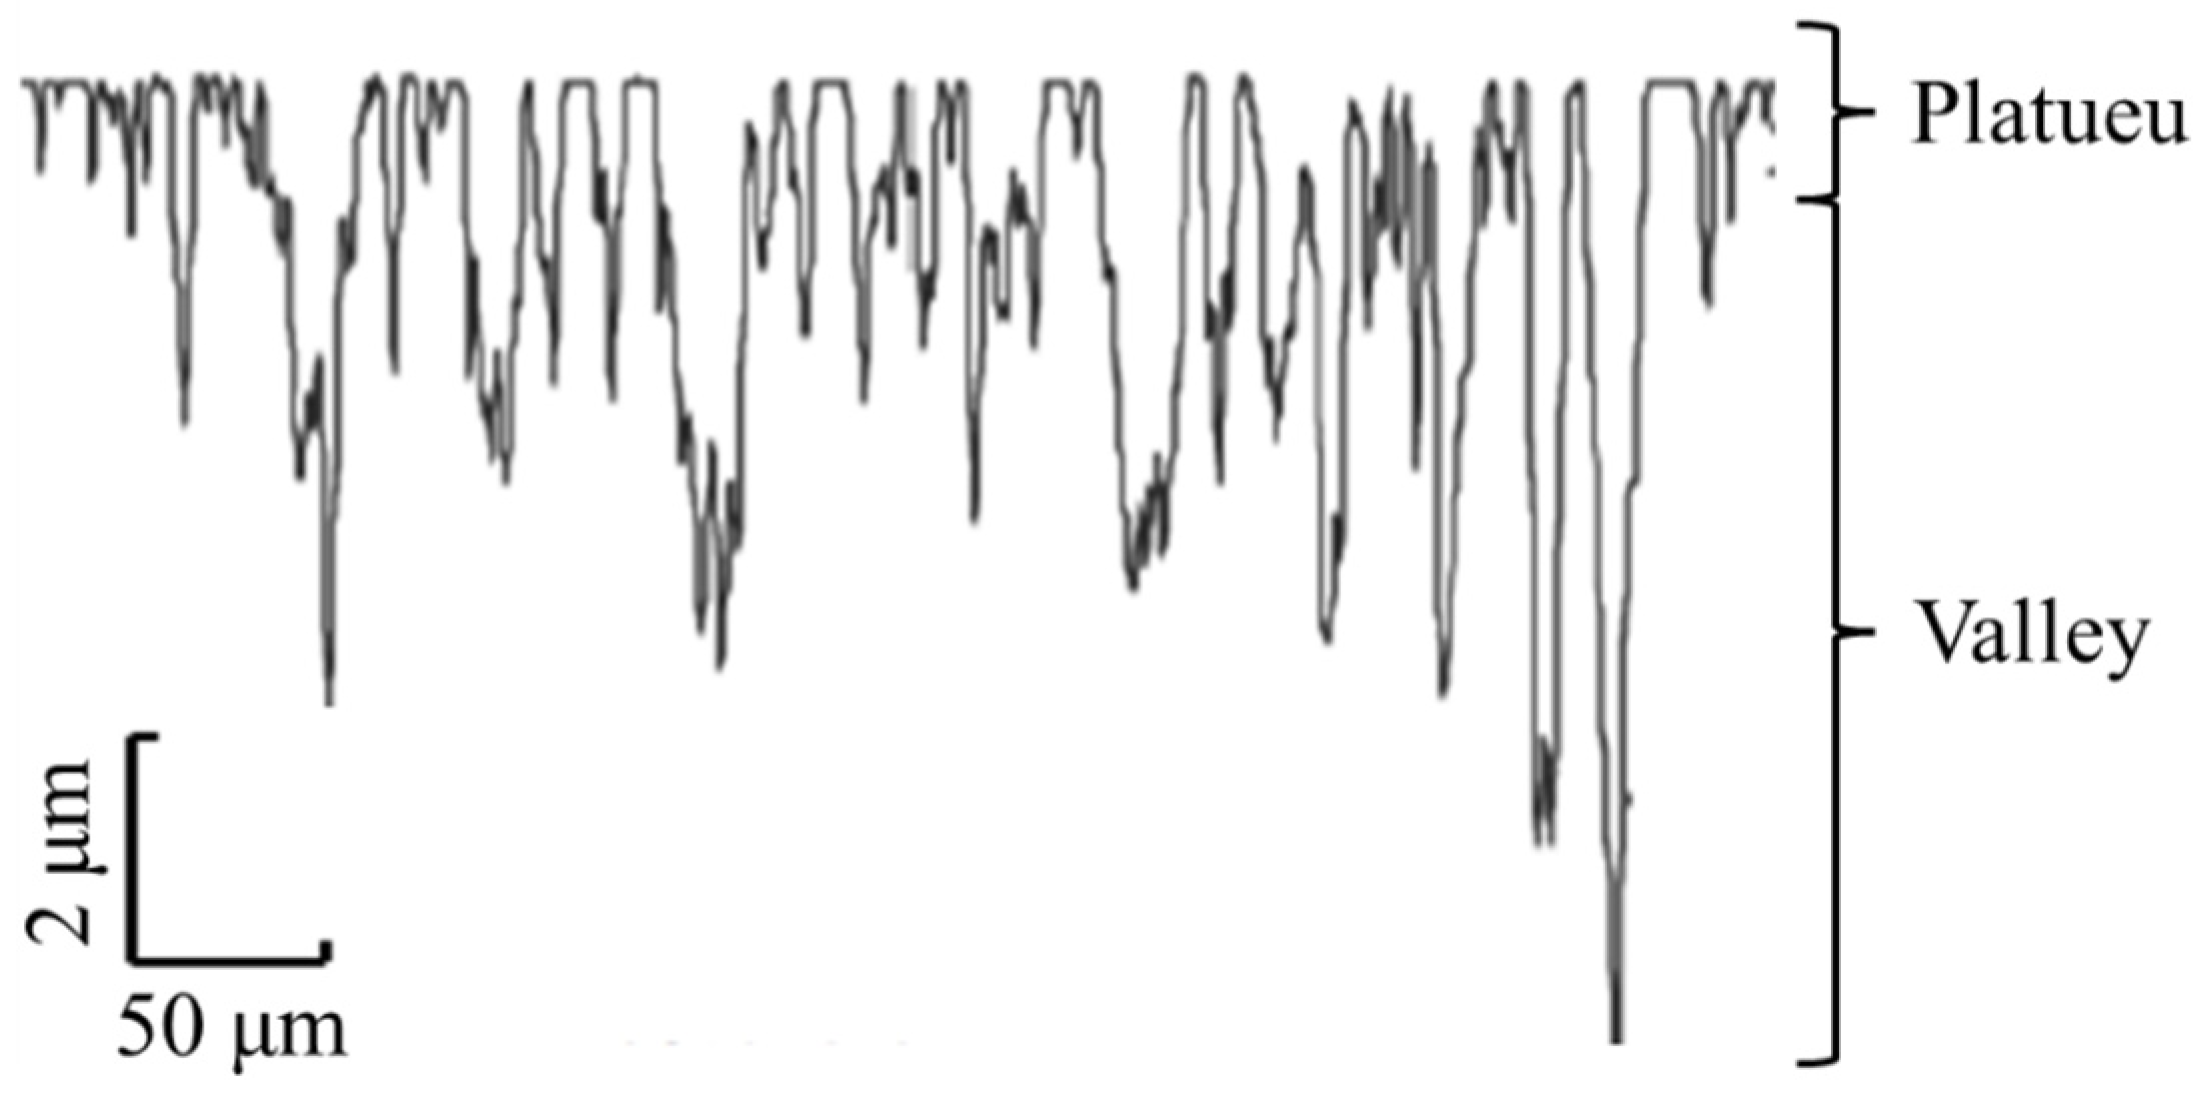
The inner surface of an automobile engine bore requires high sliding properties because the piston slides inside the cylinder. For this reason, the bore surface is finished by plateau honing, as shown in Figure 1. The plateau-honed surface has a plateau region and a valley region. Each region has a different requirement specification and is therefore evaluated using a material probability curve. The material probability curve shows the ratio of the real part of surface roughness to the void part, relative to the height direction. The material probability curve is represented on a normal probability plot. The slope of the straight line that is fitted to the slope of the part of the material probability curve corresponding to the plateau and valley regions is the parameter value [1]. The degree of fit of the straight line to the material probability curve affects the roughness parameter value of the plateau surface. Therefore, several analytical methods were proposed, because it is important to detect the slope of a straight line with high validity [2,3,4,5,6,7,8].

Figure 1.
Plateau-honed surface.
The method for evaluating plateau surfaces, described by the ISO standard [2,3], requires an arcane computational algorithm. Therefore, a simple calculation algorithm was proposed. Reference [4] proposed a method based on image processing techniques. Reference [5] proposed a method that complies with the ISO standard. Reference [6] proposed a method that allows the evaluation of plateau surfaces, which the ISO standard regards as unanalyzable. This study proposes a new linear fitting method based on the concept of random sample consensus (RANSAC) and the least squares method. In addition, because the industrial world demands improved productivity, this study aims to develop a method that does not require human intervention.
2. Proposed Method Applying RANSAC and the Least Squares Method
The algorithm for the proposed method, which applies the RANSAC concept, is as follows:
- Two points are randomly extracted from the material probability curve, and the model line is calculated from the two randomly extracted points.
- The number of data points within the tolerance (inliers) from the model line is counted.
- The best model is the one in which the number of inliers is greater than the specified value and the total error between the acceptable data and the model line is the smallest.
This step is performed at each slope of the plateau and valley regions. The three conditions, to be set in advance, are the boundary position between the plateau and valley regions on the material probability curve, the tolerance, and the number of inliers. In Section 2.1 and Section 2.2, we describe the determination of these three conditions.
2.1. Determination of Boundary Position Using the Least Squares Method
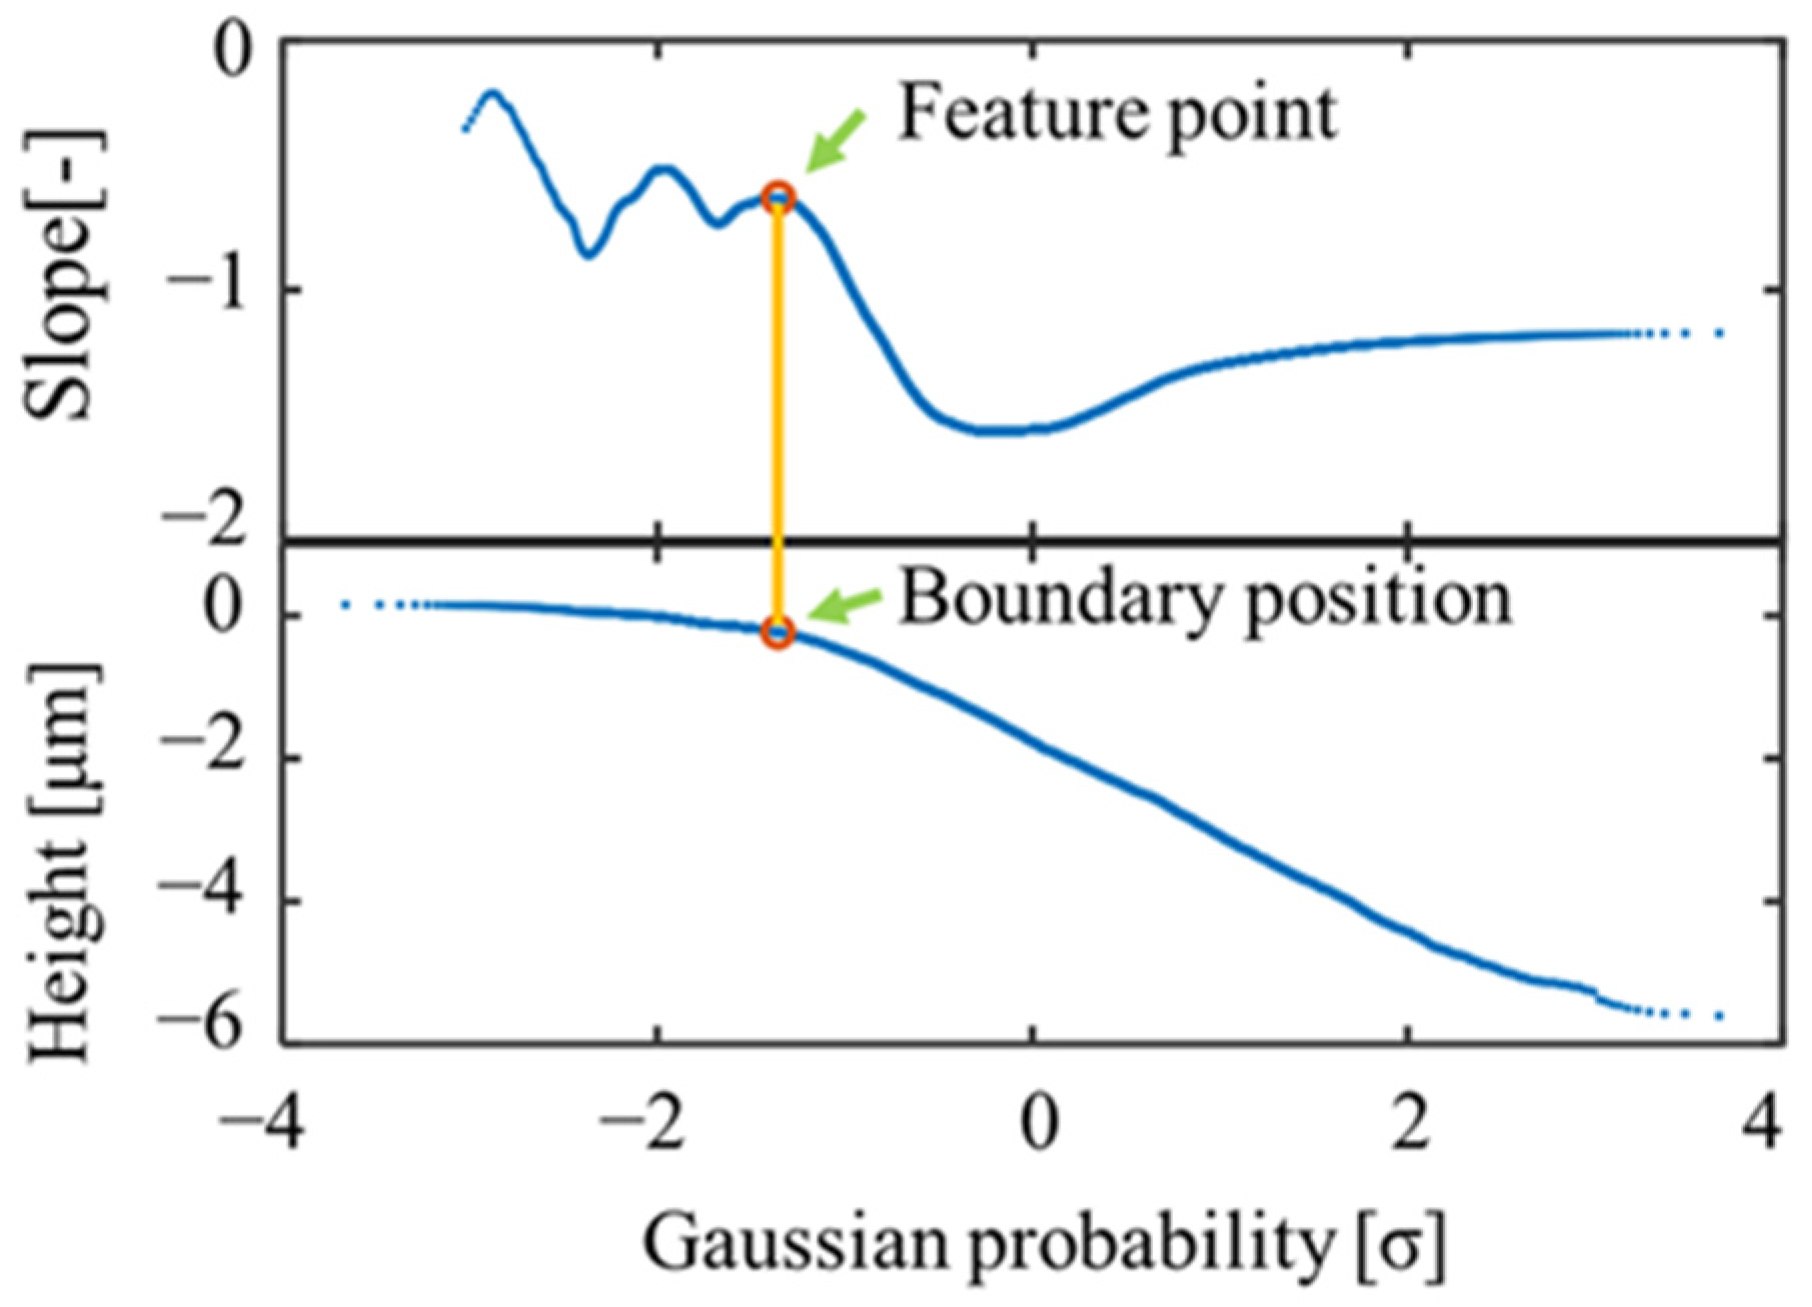
The calculation procedure of the method developed by this study for locating the boundary is as follows:
- The material probability curve is scanned one point at a time from the edge, and the straight line that is fitted to each range is calculated using the least squares method.
- The change in the slope of the line produces an extreme value.
- The local maximum point with the largest difference from the neighboring local minimum point, among several detected extremes, is set as a feature point.
- The point on the material probability curve corresponding to the feature point is determined to be the boundary position.
The boundary positions on the material probability curve corresponding to the feature points are shown in Figure 2 [7].
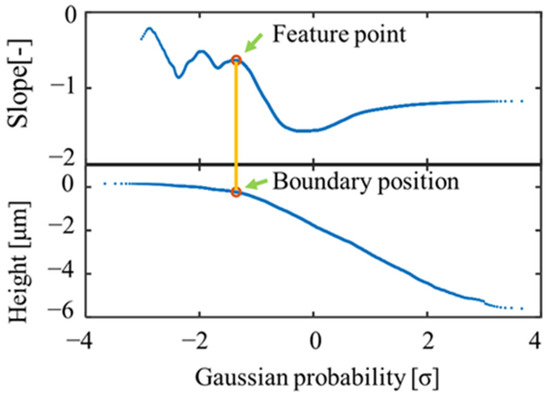
Figure 2.
Detection result of feature point.
2.2. Automization of Setting of Tolerances and Number of Inliers
The proposed method based on the RANSAC concept seeks manually the best combination to achieve the property that the accuracy of straight-line detection varies depending on the combination of tolerances and the number of inliers. Therefore, the straight line is detected for all combinations of each value. Automization of the setting of tolerances and the number of inliers is achieved by selecting a model line, with an even smaller error, from the model lines calculated for each combination.
3. Experiment
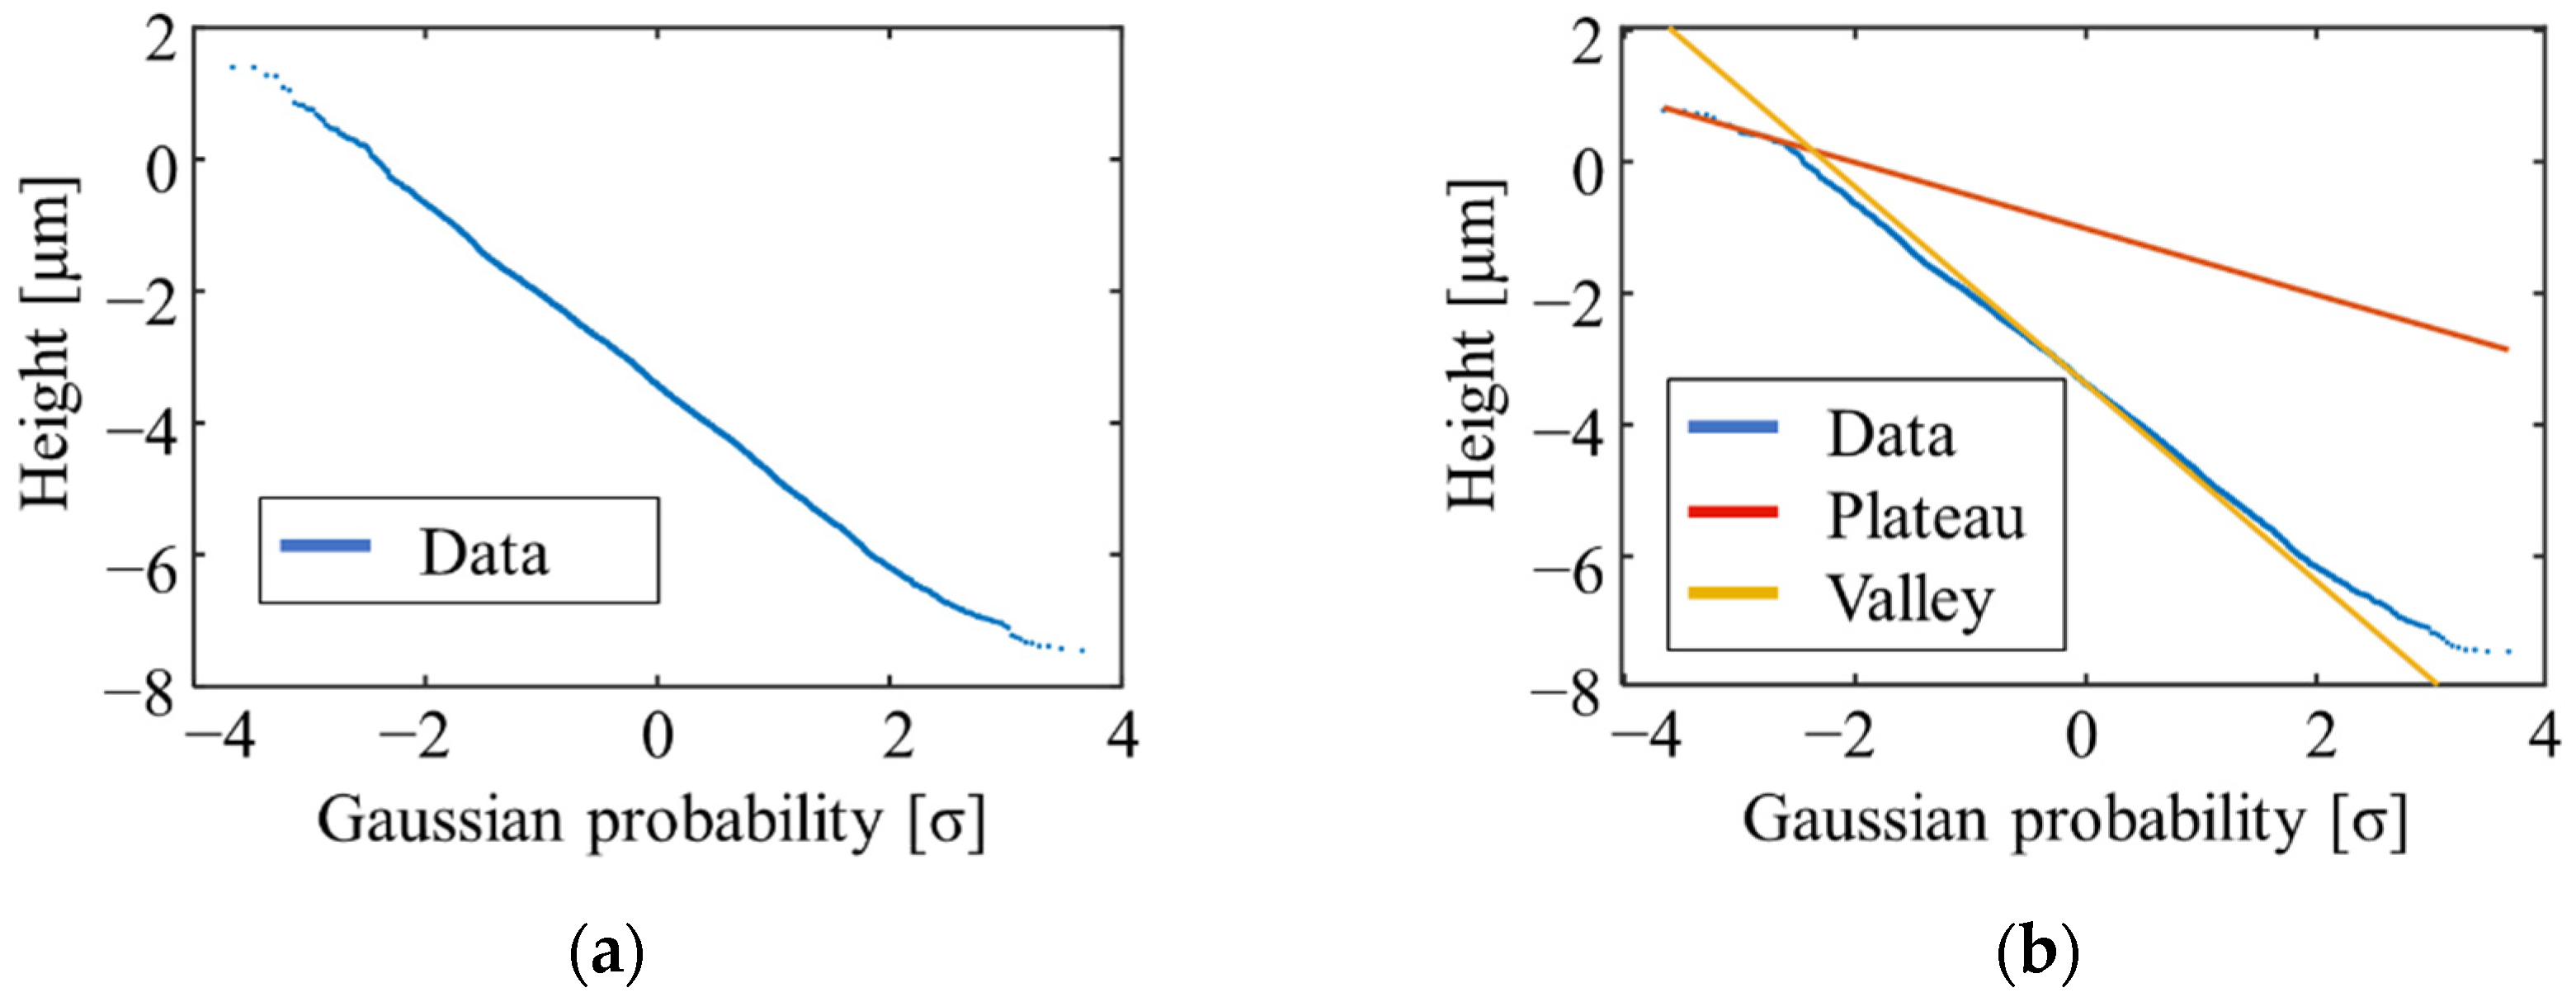
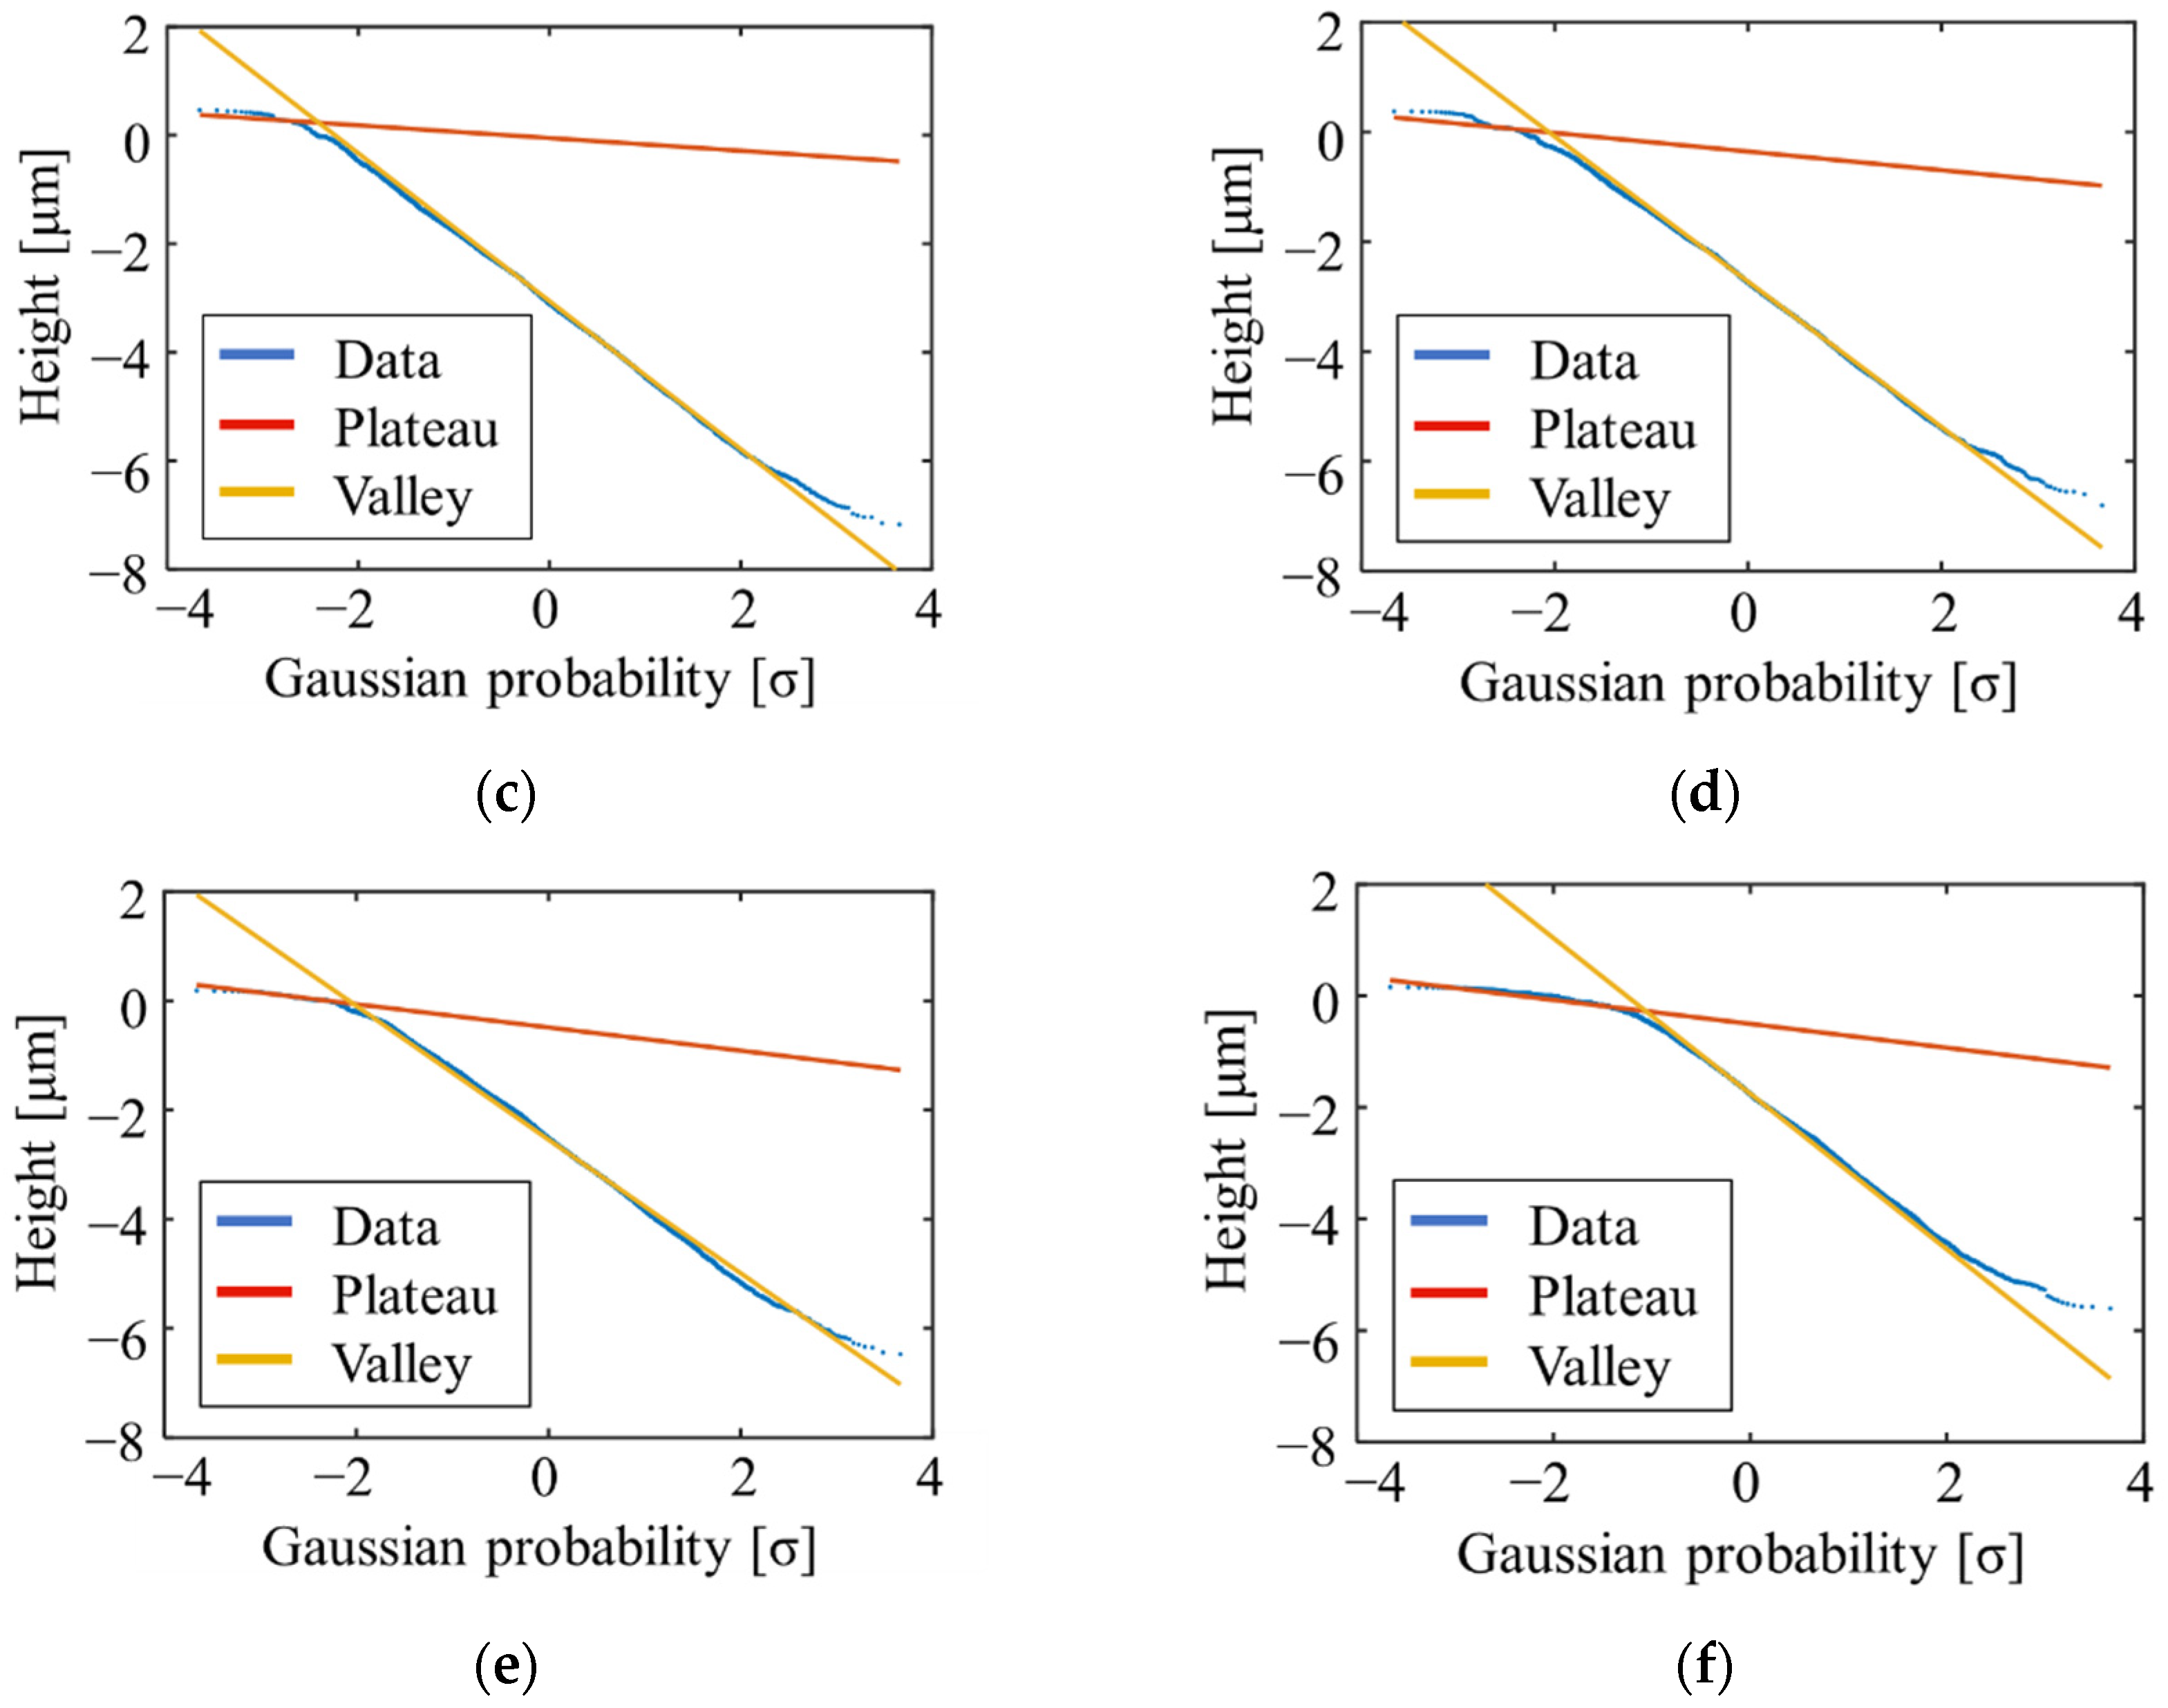
In this study, the validity of the newly developed algorithm was verified by applying it to the surface profile data of samples with sliding times from 0 to 10,000. As the roughness profile of the plateau surface changes with the sliding time, the material probability curve also changes. It is necessary to apply the proposed method at each sliding time to verify the validity of the algorithm. Figure 3 shows the results of applying the proposed method and fitting straight lines to the material probability curve for the following number of times: 0, 5, 10, 50, 100, and 500. Figure 3 shows that the straight lines coincide with the plateau and valley regions.

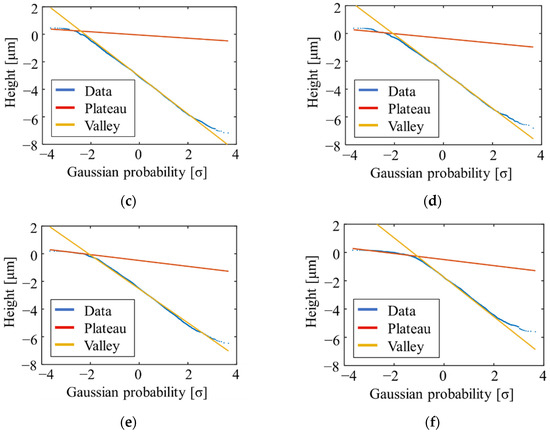
Figure 3.
Detection result of straight lines for the following sliding times: (a) 0; (b) 5; (c) 10; (d) 50; (e) 100; and (f) 500.
4. Conclusions
This study developed a method that applied the concept of the least squares method and RANSAC to contribute to the improvement of productivity at production sites. Because this method requires the setting of three conditions, we developed an algorithm to identify these conditions. The experimental results in this study showed that RANSAC can be applied to evaluate plateau surfaces. However, the developed algorithm for identifying the boundary position has a problem, in that it is not fully automated, as the final decision to identify the boundary position is made by visual evaluation. In the future, we will contribute to the improvement of productivity in manufacturing plants by developing a new method to solve this problem.
Author Contributions
Conceptualization, I.Y.; methodology, I.Y. and S.N.; software, S.N. and R.S.; validation, S.N., R.S. and I.Y.; formal analysis, I.Y.; investigation, I.Y., S.N. and R.S.; resources, I.Y.; data curation, S.N.; writing—original draft preparation, S.N. and I.Y.; writing—review and editing, S.N., I.Y. and R.S.; visualization, S.N. and I.Y.; supervision, I.Y.; project administration, I.Y.; funding acquisition, I.Y. All authors have read and agreed to the published version of the manuscript.
Funding
This research received no external funding. This work was partly supported by the Precise Measurement Technology Promo-tion Foundation (PMTP-F) grant number 1-38.
Institutional Review Board Statement
Not applicable.
Informed Consent Statement
Not applicable.
Data Availability Statement
Not applicable.
Conflicts of Interest
The authors declare no conflict of interest.
References
- Yoshida, I.; Tsukada, T.; Arai, Y. Characterization of three-stratum surface textures. Jpn. J. Tribol. 2008, 53, 99–111. Available online: https://www.researchgate.net/publication/297936036_Characterization_of_three-stratum_surface_textures (accessed on 1 September 2021).
- ISO 13565-3:1998 Geometrical Product Specifications (GPS)—Surface Texture: Profile Method; Surfaces Having Stratified Functional Properties-Part 3: Height Characterization Using the Material Probability Curve. Available online: https://www.iso.org/obp/ui/#iso:std:iso:13565:-3:ed-1:v1:en (accessed on 25 November 2021).
- ISO 21920-2:2021 Geometrical product specifications (GPS)—Surface Texture: Profile-Part 2: Terms, Definitions, and Surface Texture Parameters. Available online: https://www.iso.org/standard/72226.html (accessed on 25 November 2021).
- Yoshida, I.; Kondo, Y.; Wakatsuki, G.; Numada, M. Study of a Plateau Surface Evaluation Method Using a Fast M-Estimation Type Hough Transform, International Journal of Automation Technology. Int. J. Autom. Technol. 2019, 13, 118–123. [Google Scholar] [CrossRef]
- Sakakibara, R.; Yoshida, I.; Kondo, Y.; Numada, M.; Yamashita, K. A Proposal of Hyperbolic Fitting Method by Applying the Properties of Functions for Plateau Surface Analysis in ISO13565-3. Nanomanufacturing Metrol. 2020, 3, 1–11. [Google Scholar]
- Sakakibara, R.; Yoshida, I.; Nagai, S.; Kondo, Y.; Yamashita, K. Surface roughness evaluation method based on roughness parameters in ISO 13565-3 using the least-squares method for running-in wear process analysis of plateau surface. Tribol. Int. 2021, 163, 1–9. [Google Scholar] [CrossRef]
- Nagai, S.; Yoshida, I.; Machida, H.; Kondo, Y.; Sakakibara, R.; Yamashita, K. Study on Surface Roughness Evaluation Method of Inner Surface of Engine Bore Using RANSAC Method and Least Squares Method. In Proceedings of the Abrasive Technology Conference 2021, Hokkaido, Japan, 30 November–3 December 2021; ABTEC-U-C44. p. 215. [Google Scholar]
- Nagai, S.; Yoshida, I.; Sakakibara, R. Study on Surface Roughness Evaluation Method for Engine Bore Surface Using RANSAC and Least Square Method. In Proceedings of the 6th STI-Gigaku 2021, Nagaoka, Japan, 20–22 October 2021. STI-9-19. [Google Scholar]
Publisher’s Note: MDPI stays neutral with regard to jurisdictional claims in published maps and institutional affiliations. |
© 2021 by the authors. Licensee MDPI, Basel, Switzerland. This article is an open access article distributed under the terms and conditions of the Creative Commons Attribution (CC BY) license (https://creativecommons.org/licenses/by/4.0/).