Abstract
This study aims to develop and implement a robust monitoring system to continuously assess water quality parameters, such as total dissolved solids (TDS), pH, and turbidity. This system enhances the quality control process for water refilling stations by adopting the Internet of Things and sensors. Sensors are integrated with a central monitoring unit to provide real-time water quality data. The station enhances water quality management practices, customer trust, and compliance with regulatory standards. Prototype integrated sensors were also developed to replace TDS sensors. The sensor-based monitoring system demonstrated the feasibility and benefits in ensuring a safe and reliable water supply.
1. Introduction
The Philippines sources its water from surface water (rivers, lakes, reservoirs) and groundwater resources, which spread over approximately 50,000 km2. Groundwater provides more than 50% of potable water and 85% of the channeled water supply in the country [1]. Despite 91% of the population having access to essential water services, this does not always guarantee safe drinking water [2].
Water quality is crucial to modern life. In determining water quality levels, physical, chemical, and microbiological parameters are used. Effective water quality monitoring significantly improves public health. A total of 92.5% of Central Luzon families in the Philippines have access to basic drinking water services, highlighting the importance of quality monitoring as over 50% of households rely on refilling stations [3].
Traditionally, water quality monitoring in developing countries involves manual collection and laboratory analysis, a method prone to delays and inefficiencies [4]. In the Philippines, the Department of Health’s Administrative Order No. 2017–0010 outlines drinking water standards, requiring water to be clear, pleasant-tasting, and free from harmful contaminants. It also indicates the measurement of physical and chemical parameters, specifically turbidity, total dissolved solids, and pH. The standard values for turbidity must be less than or equal to 5.0 NTU, TDS must be less than or equal to 10 mg/L, and pH levels must be between five and seven. The ability to determine TDS, turbidity, and pH is essential to secure the water quality. TDS is measured based on the number of dissolved solids in water, with higher levels indicating potential pollutants [5]. Turbidity indicates water clarity and potential microbial contamination [6], while pH levels affect water safety, with extreme acidity or alkalinity posing health risks [7].
With the high costs associated with domestic purifiers and bottled water, many people are using water refilling stations. These stations provide safe drinking water, despite management and environmental challenges [8]. The water refilling stations must ensure water quality by conducting regular TDS monitoring and monthly third-party tests for coliform bacteria, pH, and turbidity. If high TDS levels are detected, corrective measures, including softener recharging and membrane replacement, are promptly implemented to maintain water safety.
In this study, we explored the continuous monitoring of TDS, turbidity, and pH in water to ensure the safety and quality of water from water refilling stations.
2. Literature Review
TDS Sensor
TDS sensors are the most common tools for the quick detection of drinking water quality [9]. The sensor is used for daily water quality monitoring [10]. This device is connected to the server to send short messages to relay the water quality of the water refilling station. Daily monitoring of pH, TDS, and turbidity is crucial as these parameters reflect harmful contaminants in water. They serve as early warning signals for potential issues, allowing immediate corrective actions to be taken [11,12].
A real-time Internet of Things (IoT)-based water quality monitoring system is used for domestic water quality monitoring, focusing on pH, temperature, turbidity, and electrical conductivity [13]. The IoT-based monitoring system is used in water refilling stations, specifically monitoring pH, turbidity, and TDS. The system collects data at 30 min intervals, which are used by administrators for SMS alerts for emergencies [14,15,16].
A structured user experience (UX) design process, including analysis, design, prototyping, and evaluation, is crucial for developing effective water quality monitoring systems [17,18]. The process involved analyzing user needs, designing web application concepts, prototyping sensors, and evaluating outputs to provide a meaningful user experience. Testing IoT devices is necessary to ensure practical implementation. This involves connecting devices to laptops to verify functionality, performance, regression, integration, security, privacy, and usability [19].
3. Methodology
We developed a system to monitor pH, TDS, and turbidity in drinking water. Data collected from sensors are transmitted and processed by microcontrollers to update the database and display water quality parameters on an ASP.NET Web Application developed using the .NET Framework and C#. The dashboard presents real-time updates for the Crystal Clear water refilling station, which was the study site [20,21]. We used modified prototyping with IoT. It is based on the Nurun Process [22], which integrates IoT devices with Arduino microcontrollers. Figure 1 demonstrates the three-part research scheme of this study.
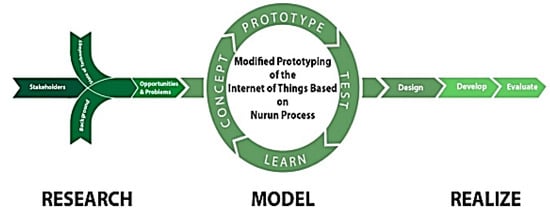
Figure 1.
Research process using Nurun Process.
The initial stage of the Nurun process is to investigate the feasibility of the system through interviews, observations, and a review of relevant literature. After the investigation, a device was developed and implemented in the model stage. In the model stage, a prototype is tested and modified. Diagrams showing entity relationships, data flow, and circuits are drawn to design and implement the device or a system effectively.
The test involves user acceptability (UA) in two stages: alpha testing involving internal testing for functionality, sensor calibration, data accuracy, and error handling, and beta testing to identify issues, gather feedback, and assess adaptability. In the realize stage, stakeholders tested the prototype and completed the UA questionnaire. The collected data were analyzed to determine whether the system met its objectives and operated as intended.
We developed a prototype of a water quality monitoring system for water refilling stations. Tests were conducted to ensure the system and enhance accuracies and reliabilities. These tests included self-calibration testing to verify the accuracy of the measurements, isolation testing to assess the system’s stability, third-party testing for external validation, stress testing to evaluate how the system performs under extreme conditions, and compatibility testing to ensure the system integrates seamlessly with existing infrastructure.
The developed system consists of the Wemos D1, Arduino Mega, pH sensor, TDS sensor, turbidity sensor, 12–5 V step-down power supply, and a 12 V–5.0 A lead–acid battery (Figure 2).
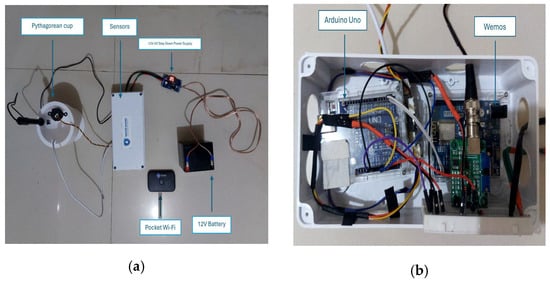
Figure 2.
(a) Physical device setup and (b) components of water quality monitoring system.
The system included pH, TDS, and turbidity sensors, placed inside a Pythagorean cup (Figure 3). In the cup, if water is poured beyond a certain level, it automatically drains through a hole at the bottom, preventing overflow. To protect the sensors from water and maintain their accuracy, they are enclosed in a waterproof junction box (Figure 3) to ensure the reliability and safety of the sensors and allow precise monitoring of water quality parameters. The depths at which the sensors are placed are 1.5 cm for the TDS sensor, 2.5 cm for the turbidity sensor, and 4.2 cm for the pH sensor. Such optimized depths ensure reliable and precise measurements. The waterproof junction box also protects the step-down power supply and the battery from damage.
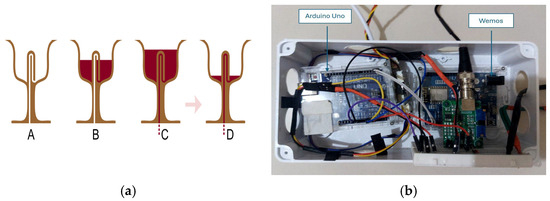
Figure 3.
(a) Pythagorean cup and (b) Protecting box for sensors.
The TDS sensor is calibrated by determining the slope and offset constants. The sensor is connected to an Arduino microcontroller to read values through an analog pin (A1). The Arduino code calculates the value in ppm, displaying the raw and TDS values through serial communication (Figure 4).
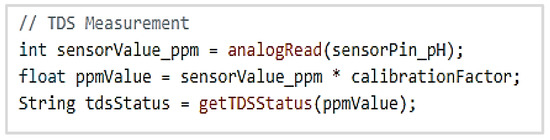
Figure 4.
Self-calibration of TDS measurement.
The pH sensor is calibrated by establishing the correlation between readings and actual pH values of standard solutions. A consistent voltage during calibration is maintained. The pH values are read from the analog pin (A2) and displayed if the readings are in the acceptable range (Figure 5).
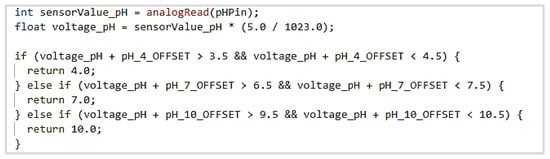
Figure 5.
Self-calibration of pH measurement.
The turbidity sensor is calibrated by measuring baseline readings in clear water and a reference solution. The turbidity is calculated in the Nephelometric turbidity unit (NTU) based on the output voltage (Figure 6).
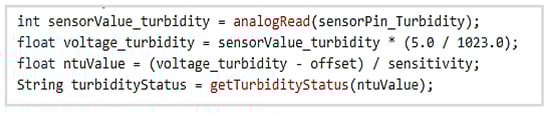
Figure 6.
Self-calibration of turbidity measurement.
4. Results
The six-hour test was conducted as shown in Table 1. The system’s ability was tested by adding impurities, such as vinegar, detergent powder, mud, salt, and hot water, which were introduced into the water sample. Vinegar lowered pH, detergent increased pH, turbidity, and conductivity, mud affected turbidity, salt raised conductivity, and hot water increased temperature. The sensors accurately detected these changes, demonstrating the system’s effectiveness in real-time water quality monitoring.

Table 1.
6 h Run Test Sensor readings of modified Tap Water.
A 12 h test was conducted as shown in Table 2 to evaluate the system’s performance by intentionally altering water quality with various solutions, simulating conditions. The test results helped observe how the system detected these changes. In the 24 h test, tap water was to assess the system’s response over a longer period (Table 3). The results provided data to evaluate the system’s effectiveness in detecting and responding to different water quality levels and validate its reliability for continuous monitoring in both controlled and real-world environments.
Table 2.
12 h run test sensor readings of modified tap water.
Table 3.
24 h run test sensor readings of modified tap water.
The third-party testing was carried out in cooperation with Acculab Calibration Laboratory Inc. to guarantee that the calibration process of the developed system was accurate and reliable. The difference was low, indicating that the system developed accurately monitored every 5 min (Table 4 and Table 5).
Table 4.
Comparison of monitoring results of developed system and third-party system (1st test).
Table 5.
Comparison of monitoring results of developed system and third-party system (2nd test).
We examined the difference between the system developed and the Acculab Calibration Laboratory’s system using an unpaired t-test (Table 6).
Table 6.
Unpaired t-test result between developed system and third-party system.
Compatibility testing was conducted to ensure that a website functioned correctly. The website was developed using ASP.NET Web Application with Bootstrap 4 and JavaScript. It was tested for compatibility on desktop computers and mobile browsers in Windows and Mac operating systems (Table 7). In the Windows operating system, Chrome, Firefox, Microsoft Edge, and Opera were used while in the Mac system, Chrome, Firefox, Safari, Microsoft Edge, and Opera were used. For mobile browsers, Android and iOS devices on the Infinix HOT 20s (Android) and iPhone 11 Pro (iOS) were used (Table 8). For Android, the website was compatible with Chrome and Firefox except for Safari. For iOS, the website was compatible with Chrome, Firefox, and Safari.
Table 7.
Compatibility of Windows and Mac operating systems.
Table 8.
Compatibility of mobile browsers.
Figure 7 illustrates the connections between each component. The pH, TDS, and turbidity sensors’ power pins were connected to an LM2596 step-down adjustable power supply for voltage regulation. Their analog outputs are connected to the Arduino UNO R3 Board ATmega328’s six analog inputs. The PH-4502C Liquid PH Sensor’s analog output pin connects to two analog input pins, the TDS Sensor’s output pin to one analog input pin, and the Turbidity Analog Sensor’s output pin to zero analog input pins on the Arduino. Data are transmitted from the Arduino to the WeMos D1 through serial connections using the TX and RX pins. The RX pin of the Arduino is linked to the TX pin of the WeMos D1, and vice versa. Analog sensor readings are converted to PPM values through the microcontroller’s programmed algorithm.
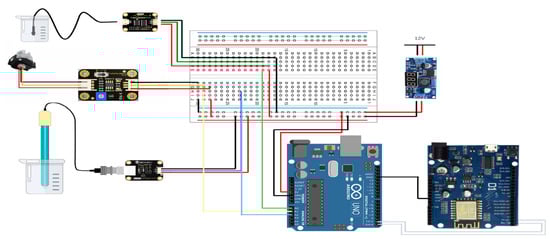
Figure 7.
Diagram of component connection.
Figure 8 illustrates a water quality monitoring system that employs Arduino-based microcontroller units and cloud services for data storage and visualization. The system comprises sensors, microcontroller units, power supply, and cloud services. Initially, the system utilizes three types of sensors to measure different water quality parameters: a pH sensor connected to analog pin A2, a TDS sensor connected to analog pin A1, and a turbidity sensor connected to analog pin A0. These sensors are connected to Arduino Uno, which serves as the primary microcontroller unit. The Arduino Uno processes the sensor data and then communicates with an ESP8266 module, which is a WiFi-enabled microcontroller. The ESP8266 handles the wireless transmission of processed data to cloud services.
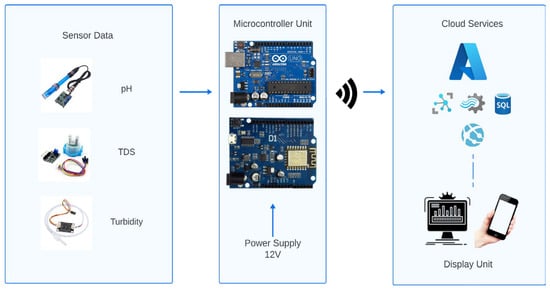
Figure 8.
Connections in developed system.
The entire system is powered by a 12V power supply, ensuring that both the Arduino Uno and the ESP8266 module receive adequate power for their operations. Finally, the sensor data are transmitted to cloud services for further processing, storage, and visualization. The cloud service platform used in this system provides functionalities, such as data analytics, database management, and real-time monitoring. Users can access and visualize the data through display units, such as computers and smartphones, providing them with real-time insights into water quality. This integration of hardware and cloud services enables efficient and effective monitoring of water quality, making the system a valuable tool for environmental monitoring and management.
The developed software was tested in alpha and beta testing modes. Alpha Testing involves unit, integration, stress, and compatibility testing, while beta testing consists of user acceptance testing by staff, supervisor and manager. A questionnaire was developed focusing on usability, functionality, user interface, and experience (Table 9). The overall results showed “Strongly Agree”.
Table 9.
Overall user acceptance.
5. Conclusions
We developed an IoT-based water quality monitoring system for water refilling stations, ensuring continuous and real-time monitoring of water quality parameters. The system underwent rigorous testing, including self-calibration, isolation, third-party evaluation, stress testing, and compatibility assessments. The results demonstrated a high accuracy and reliability. The system met standards for TDS, pH, and turbidity measurement, aligning with the Philippine National Standards for Drinking Water. User acceptance was high, confirming the system’s effectiveness, design, and usability while proving its ability to accurately measure and record water quality data. The process of monitoring water quality using the developed system enables the presentation of relevant reports and essential data to maintain water quality. Additionally, data visualization of historical water quality serves as a basis for service improvement.
Author Contributions
Conceptualization, A.L.I.; methodology, A.L.I.; Software, M.P.C.E.E., M.T.Y.S.V., A.V.G.Y. and J.G.B.; Validation, A.L.I., M.P.C.E.E., M.T.Y.S.V., A.V.G.Y. and J.G.B.; Sensor, M.P.C.E.E. and A.V.G.Y.; Analysis, A.L.I., M.P.C.E.E., M.T.Y.S.V., A.V.G.Y. and J.G.B.; Investigation, A.L.I., M.P.C.E.E., M.T.Y.S.V., A.V.G.Y. and J.G.B.; Documentation, A.L.I., M.P.C.E.E., M.T.Y.S.V., A.V.G.Y. and J.G.B.; Supervision, A.L.I.; Visualization, A.L.I., M.P.C.E.E., M.T.Y.S.V., A.V.G.Y. and J.G.B. All authors have read and agreed to the published version of the manuscript.
Funding
This research received no external funding.
Institutional Review Board Statement
This study was approved on 18 October 2024 by the Research Promotion and Coordination Office at the Mapúa Malayan Colleges Laguna.
Informed Consent Statement
Informed consent was obtained from all subjects involved in the study.
Data Availability Statement
Data is contained within the article.
Acknowledgments
The authors would like to express their sincere gratitude for the financial support given by the College of Computer and Information Science, Mapúa Malayan Colleges Laguna, Cabuyao City, Laguna, Philippines.
Conflicts of Interest
The authors declare no conflicts of interest.
References
- Barkwith, A. Improving Water Security in the Philippines. Available online: https://www.bgs.ac.uk/news/improving-water-security-in-the-philippines/ (accessed on 6 October 2021).
- Jern, M. Can I Drink the Tap Water in the Philippines? Best Water Filter? Available online: https://tappwater.co/en/tap-water-philippines-water-filter/ (accessed on 24 July 2021).
- Catilogo, M.I.U. PHL Access to Drinking Water Improves; 54% Source from Commercial Refilling Stations. Available online: https://www.bworldonline.com/the-nation/2023/03/23/512553/phl-access-to-drinking-water-improves-54-source-from-commercial-refilling-stations/ (accessed on 23 March 2023).
- Jan, F.; Min-Allah, N.; Düştegör, D. IoT-Based Smart Water Quality Monitoring: Recent Techniques, Trends and Challenges for Domestic Applications. Sensors 2024, 24, 1234. [Google Scholar] [CrossRef]
- Salillas, J. Water Refilling Station Monitoring System Using TDS Meter with SMS. Available online: http://uruae.org/siteadmin/upload/AE0917116.pdf (accessed on 19 September 2017).
- Jones, S. Turbidity in Drinking Water Information. Available online: https://www.h2olabcheck.com/blog/view/turbidity (accessed on 4 March 2020).
- Olsen, N. The pH of Water: What to Know. Medical News Today. Available online: https://www.medicalnewstoday.com/articles/327185 (accessed on 22 June 2023).
- Magtibay, B.B. Study on Water Refilling Station—Water Refilling Business. Business Diary Philippines. Available online: https://businessdiary.com.ph/835/water-refilling-station-study/ (accessed on 11 November 2021).
- Tian, Z.; Chen, H.; Ding, Q.; Che, X.; Bi, Z.; Wang, L. Research on Small-Scale Detection Instrument for Drinking Water Combined Laser Spectroscopy and Conductivity Technology. Sensors 2023, 23, 2985. [Google Scholar] [CrossRef] [PubMed]
- Qureshi, M.A.A.; Tahir, R.M. The Implementation of Water Salinity Tester as a Quantitative Tool to Determine the Total Dissolved Solids in Water. Tech. Rom. J. Appl. Sci. Technol. 2021, 3, 1–8. [Google Scholar]
- Islam, R.; Faysal, S.M.; Amin, R.; Juliana, F.M.; Islam, M.J.; Alam, J.; Asaduzzaman, M. Assessment of pH and Total Dissolved Substances (TDS) in the Commercially Available Bottled Drinking Water. IOSR J. Nurs. Health Sci. 2017, 6, 35–40. [Google Scholar]
- AtlasScientific. Why Is Turbidity Important? Available online: https://atlas-scientific.com/blog/why-is-turbidity-important/ (accessed on 14 May 2022).
- Geetha, S.; Gouthami, S.J.S.W. Internet of Things Enabled Real-Time Water Quality Monitoring System. Smart Water 2016, 2, 1. [Google Scholar] [CrossRef]
- Burhan, M.; Rehman, R.A.; Khan, B.; Kim, B.S. IoT Elements, Layered Architectures and Security Issues: A Comprehensive Survey. Sensors 2018, 18, 2796. [Google Scholar] [CrossRef] [PubMed]
- Rao, S. Support Simplified; Self-published; University of Alberta: Edmonton, AB, Canada, 2024. [Google Scholar]
- Demetillo, A.T.; Japitana, M.V.; Taboada, E.B. A System for Monitoring Water Quality in a Large Aquatic Area Using Wireless Sensor Network Technology. Sustain. Environ. Res. 2019, 29, 1–9. [Google Scholar] [CrossRef]
- Intel. IoT 101, Part 1: Introduction to Designing IoT Devices. Available online: https://www.intel.com/content/www/us/en/developer/articles/training/iot-101-series-1-design-iot-devices-introduction.html (accessed on 10 October 2017).
- Hartson, R.; Pyla, P.S. The UX Book: Process and Guidelines for Ensuring a Quality User Experience; Elsevier: Waltham, MA, USA, 2012. [Google Scholar]
- Anderson, J. IoT Testing: Approaches, Challenges, and Tools. Available online: https://www.iotforall.com/iot-testing-challenges-tools-and-testing-approach (accessed on 7 October 2022).
- Intal, G.L.; Camposagrado, C.G.; Tolentino, C. Proposed Framework and Features of the Data-Driven Web Decision Support System for Rural Water District in the Philippines. In Proceedings of the WCSE 2022 Spring Event: 2022 9th International Conference on Industrial Engineering and Applications, Sanya, China, 15–18 April 2022. [Google Scholar]
- Pawar, N.; Bourgeau, T.; Chaouchi, H. PrIoT: Prototyping the Internet of Things. In Proceedings of the 2018 IEEE 6th International Conference on Future Internet of Things and Cloud (FiCloud), Barcelona, Spain, 6–8 August 2018; pp. 216–223. [Google Scholar]
- Almojela, I.F.; Gonzales, S.M.; Gutierrez, K.; Santos, A.S.; Malabanan, F.A.; Tabing, J.N.T.; Escarez, C.B. WatAr: An Arduino-Based Drinking Water Quality Monitoring System Using Wireless Sensor Network and GSM Module. In Proceedings of the 2020 IEEE Region 10 Conference (TENCON), Osaka, Japan, 16–19 November 2020; pp. 550–555. [Google Scholar]


Disclaimer/Publisher’s Note: The statements, opinions and data contained in all publications are solely those of the individual author(s) and contributor(s) and not of MDPI and/or the editor(s). MDPI and/or the editor(s) disclaim responsibility for any injury to people or property resulting from any ideas, methods, instructions or products referred to in the content. |
© 2025 by the authors. Licensee MDPI, Basel, Switzerland. This article is an open access article distributed under the terms and conditions of the Creative Commons Attribution (CC BY) license (https://creativecommons.org/licenses/by/4.0/).