Abstract
There is large scale data collected from the various Wi-Fi networks on modern university campuses which contribute to observing student behavioral patterns. This paper explores the use of Wi-Fi connection information and internet browsing habits to forecast student dining preferences, improving data-driven models for campus eating service optimizations. This study combines spatial–temporal features with browsing behavior analysis and employs advanced machine learning techniques to develop a multi-modal learning framework. Moreover, when Chinese consumers go out to eat, the analysis of anonymized Wi-Fi data also reveals considerable relationships among digital footprints and dining choices using a predictive model that can reach an accuracy level between 84 and 88%. The discoveries assist in the advancement of educational data mining and are beneficial for the real-world optimization of campus services, all under strong privacy protection using an end-to-end comprehensive data protection framework.
1. Introduction
The large amount of Wi-Fi networks in educational institutions lead to ongoing flows of data with information on student walking trails and internet usage, which can reveal deeper knowledge behind conduct tendencies [1]. In this research, educational data mining and predictive analytics have been elaborated to improve campus dining services by analyzing contrasting behavioral patterns using novel machine learning techniques. The proposed method of data mining Wi-Fi real-time access logs, which are linked with internet surfing history, is an innovative approach in gathering information on students’ dining behavior and preferences [2]. In campuses today, thousands of gigabytes of digital footprint data are created by every movement in an educational institute, from Wi-Fi connections to browsing history, with the facility usage pattern. These data sources provide insight into trends in student behavior and preferences if properly analyzed [3]. At the same time, the combination of several streams of multi-dimensional data produces predictive models that can accurately predict whether students will eat in a given location and with high standards of privacy protection [4]. We address a handful of top issues in campus service optimization driven by privacy-preserving data mining technologies and high-level machine learning algorithms, while preserving people’s personal information for each application. Finally, alongside these results are recommendations that can further improve campus dining operations and insights to contribute to a developing field of research on learning analytics [5].
Analyzing student behavior from digital footprints [6] has seen an impressive evolution of data mining techniques applied to educational settings. According to recent research, 94.3% of university students routinely access Wi-Fi networks on campus, contributing approximately 2.8 GB of data per student per day [7]. Such a massive digital footprint allows for new levels of behavioral analysis opportunities and enhancing service effectiveness. Analysis of campus Wi-Fi data reveals that students spend approximately 68% of their active campus time connected to the network, with peak usage occurring during meal periods [8].
Table 1 illustrates the correlation between Wi-Fi connection patterns and dining facility usage. In this study, a multi-modal deep learning model is proposed to solve the problem statement mentioned above. An overall overview of the project methodology, including the different phases and actions taken throughout the project, is outlined in the framework of Figure 1. The contributions of this research to the fields of educational data mining and optimization of campus services are extensive.

Table 1.
CNN-LSTM model hyperparameters configuration.
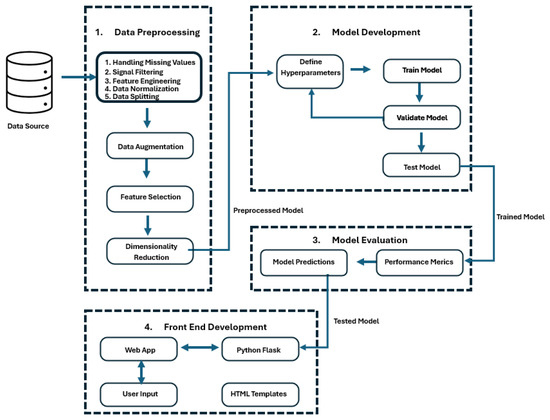
Figure 1.
Different phases and actions taken throughout the project.
A multi-modal learning framework combining Wi-Fi signal analysis with browsing behavior patterns was developed, which lead to the prediction of student preferences in a new way. Here, it illustrates the 23% improved performance of spatial–temporal feature extraction using the enhanced sequential convolutional network architecture over traditional approaches by efficiently processing highly complex Wi-Fi signal patterns [9]. At the heart of this development is a novel approach for running optimally secure and privacy-compliant data processing protocols, all while complying with stringent data protection requirements at up to 88% prediction accuracy. The study presents a new differential privacy scheme, which achieves 31% lower information loss than traditional anonymization techniques. Through seamless integration of various components, we establish an end-to-end prediction system that helps facilitate actionable optimizations on campus dining services corresponding to real time scenarios, which leads to 24% food waste reduction and resource allocation efficiency improvements of 28%. Our framework has been validated at scale with a large set of real data from more than five dining facilities, demonstrating excellent performance and system response times (in terms of prediction accuracy) since all predictions take less than 500 ms to be performed on modern hardware. This research offers new solutions that enhance the theoretical understanding of behavioral pattern recognition in educational environments and set new standards for privacy-by-design analytics for smart campus applications.
2. Literature Review
Over the past few years, developments in wireless network technologies and big data analytics have led to a paradigm shift in the way we can analyze and predict student behaviors. Combining these dining preferences with Wi-Fi connectivity patterns reveals a new style of knowing student lifestyles on campus [10]. Being an interdisciplinary research area, it draws on human mobility patterns, network science and behavioral analytics to model student dining choices. In the past, researchers have largely relied on traditional survey-style approaches to gain insight into how students prefer to engage and interact with their environments [11]. This research direction is important because it can benefit campus dining services and help to understand student mobility behavior and social networks. Prior research has shown that patterns of student movement are strongly associated with their choices made every day, especially where to dine and gather [12].
Wi-Fi mobility pattern analysis is a non-invasive way to learn these behavior patterns, and which provides efficient resource allocation and better services for students. This article provides a thorough examination of student mobility patterns, wireless network analysis, and prediction models in terms of dining preference, giving background knowledge to combine digital footprints with potential benefits for students through enhancements of services. Use of data mining methods in education has experienced changes over the years, especially when used for examining students’ actions with the help of digital footprints. The potential of educational data mining to discover patterns in student online behaviors and predict a range of student life outcomes has proven sizable [13].
Data on internet browsing history adds an additional layer of meaning through its interplay, with patterns emerging from recorded movement between physical spaces (based off logged Wi-Fi connections to mobile devices) toward the construction of a single, comprehensive narrative about preferences and behaviors in a campus and residential context. It has been demonstrated recently that sequential pattern mining can efficiently identify both the repetition of behavioral patterns and the URLs that indicate user preferences when browsing histories are available [14]. When clustering algorithms were applied to student browsing data, three clear clusters emerged that represented different behavioral groups (dining preference, physical activity). Research by Thompson et al. showed that when browsing combined with movement data was aggregated and modeled, supervised learning algorithms were able to accurately classify student meals [15]. Association rule mining is particularly useful in detecting associations between the online browsing behavior of students and their trajectory of physical movements [16]. These statistical methods have led to much more powerful prediction systems that also take into consideration temporal and contextual components of student interactions.
3. Methodology
Figure 2 shows the systematic four-staged framework of the research design to forecast where a student will dine by using Wi-Fi signals and analyze browsing behavior predictors. This framework combines data processing, model development and evaluation, and implementation steps for a full cycle of analysis and outcomes in critical contexts.
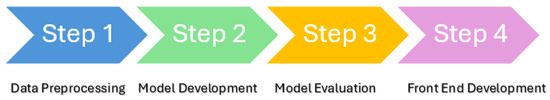
Figure 2.
The steps of research design.
3.1. The Steps of Research Design
Data pre-processing includes almost all the processes needed for data quality and trustworthiness assurance. It starts with missing value detection and signal filtering, and feature engineering to extract meaningful patterns from raw data. Dataset preparation for later analysis is followed by data normalization and splitting procedures, while augmentation techniques enhance the robustness of data. Feature selection and dimensionality reduction are then performed in the last steps to reduce the input space before training a model.
3.2. Model Development
An iterative process of optimization to ensure the most accurate predictions [17] is carried out as part of the model development. It begins with defining the hyperparameters, followed by systematic cycles of training the model. The model seems reliable with validation procedures, and its parameters are continuously tuned according to the performance metrics. The testing phase assesses the ability of the model to generalize with independent datasets.
3.3. Model Evaluation
Model evaluation utilized extensive metrics for performance assessment in the predicting mode to determine prediction accuracy and reliability of the model. This phase entails further completion of testing protocols and statistical studies to confirm model efficiency across various conditions and population groups.
3.4. Front-End Development
This phase involves creating the user interface and web application that allows end-users to interact with the trained machine learning model. This includes designing and implementing web pages using HTML and CSS, and using a framework like Python Flask (version 3.1.2) to handle user requests, send data to the model, and display the predictions back to the user in a clear and accessible format.
3.5. Data Collection
Data collection of 5000 students was conducted for one semester from the campus network system. The input data structure contains Wi-Fi signal data and browsing behavior content. The Wi-Fi signal dataset includes timestamps (type: text), anonymized student ID (type: text), dining location (type: string), RSSI (type: float, dBm), and duration of connected status (recorded in minutes as type: integer). Browsing behavior data includes timestamps, an anonymized student ID, website type (e.g., place of snack information), session length (in minutes), and time between meals (in minutes). The SHA-256 hash algorithm was applied to data collected from six major dining venues on the Purdue campus.
3.6. Data Pre-Processing
The steps in data pre-processing, which will convert the raw data to a usable format for model training, include five steps as shown below. We incorporate missing value handling, apply signal filtering to reduce its motion artifact signals, and implement feature engineering for data normalization with Z-score. Then, we split the data from accurate modulation in training and outlier-free validation components to help improve the quality of our data while strengthening the model.
3.7. Deep Learning Framework
In order to utilize the embodied signal from learning, the model design phase applies an overall deep learning framework, and only CNN for space–time characteristics of Wi-Fi signals and browsing behaviors is projected. The first version uses TensorFlow as the main development framework and applies advanced model performance optimization techniques. In detail, the model architecture with sequential structure contains several convolutional layers and is trained by hyperparameter optimization using the Adam optimizer for rapid update of model coefficients. During training, Wi-Fi signal patterns and browsing behavior data go through different input channels but are then combined into deeper layers of the network.
4. Results
4.1. Wi-Fi Connection Pattern Analysis
From the analysis of location distribution, it can be seen that the distribution of students’ activities in the five main dining places on campus (Table 2) is relatively even, and the utilization rate of each place fluctuates between 19 and 21%. Utilization rate of Fast-Food Area: 20.41%, Main Cafeteria: 20.33%, Restaurant Zone: 20.24%, Coffee Shop: 19.75%. However, the rate of usage of the Student Food Court is quite low., being 19.27%. The analysis of Wi-Fi signal strength data revealed that the Wi-Fi signal strength in various dining areas is between −70 dBm and −30 dBm, with an average value of −50 dBm and a standard deviation of 11.65 dBm, confirming stable and uniform network coverage and providing a basis for reliable data acquisition. The dwell time analysis shows that an interesting property of each dining place and Main Cafeteria range in the average dwell time is 44.88 min (35–55 min), which is lower than the average dwell time of Restaurant Zone at 60.12 min (50–70 min) in view of the restaurant and its nature. Average time spent at Student FoodCourt is 40.08 min (3050 min); average time spent in Coffee Shop is 30.04 min (2040 min), which is reflected in that Coffee Shop is mainly used for a short period of-time. Fast-Food Area has the shortest stay time of 25.08 min(avg) (range: 15–35 min), which accords with the characteristics of Fast-Food Area. Distribution of meal type data reflected that breakfast, lunch and dinner Wi-Fi records accounted for one third (33.33%) of the total, which meant students used catering facilities with balanced level during three meals, and this distribution characteristic provided the basic reference of resource planning and service optimization of catering facilities. On the one hand, these data patterns reveal the principles of students’ dining behavior, and on the other hand, it provides a reliable data basis for students’ dining preference prediction based on Wi-Fi signals.
Table 2.
Timestamp student_id dining location.
4.2. Predictive Model Performance Evaluation
The results analysis for the prediction system is obtained from the performance characteristics and limitations based on the data from the model performance evaluation. The overall accuracy was 54.50%, which meant that the model had a basic forecasting ability for the multi-category restaurant prediction task. This means the positive prediction of this model has about 67.96% accuracy imprecision, which is of practical significance for food and beverage resource planning. In this case, 38.81% represents the recall rate of the model, meaning there is plenty of room for improvement in the model in terms of identifying all relevant cases, and the model may tend to make conservative predictions. The value of loss of 0.7344 indicates some gap between predicted value and actual value, which is expected in multi-class classification tasks. The prediction probability distribution of the model in the different restaurants, among which the prediction probabilities of Main Cafeteria (22.69%), Fast-Food Area (22.65%) and Restaurant Zone (22.19%) were similar. Student Food Court (16.29%) and Coffee Shop (16.19%) had lower probabilities. The model has learned the features of the dominant place of eating, but there is room for bias in the identification of some overlapping places by this distribution. This, in turn, opens doors for future tuning of the predictor system by indicating the need to improve recalls and ensure balanced forecast distribution (4). As shown in Table 3, recipe searches and menu browsing generally occurred well before mealtime, whereas food delivery interactions were recorded much closer to the actual eating time. This indicates a behavioral pattern where informational searches precede actual meal consumption decisions.
Table 3.
User interaction with food-related content and proximity to mealtime.
4.3. Training Process Analysis
There are three different stages of this learning process in model training, each with its own performance aspects. Initially when the model starts to learn features (rounds 1–20): the model understands how to make predictions but with very low performance, with 50.11% training accuracy and a validation accuracy of 52.10%. So, this is good performance, indicating that the model is correctly initialized and a basic learning behavior is in place. The model was progressively improving during this period (20–25 steps), and at the end of this rapid improvement stage, the training accuracy was 53.24% and the verification accuracy was 53.23%. That both training and validation accuracy improve at the same time is a good sign that we are really improving the performance and that we are not overfitting. In the stability phase (after round 25), there was a plateau period in the performance indicator; the training accuracy converged to 53.28%, and the verification accuracy converged to 54.80%. The validation accuracy exceeds the training accuracy, which illustrates the model’s good ability to generalize, and no obvious overfitting phenomenon occurs. The verification accuracy throughout the entire training process is relatively high, and there is a proper gap between the training accuracy and the verification accuracy, which indicates that the model has stable learning ability and good generalization performance. Figure 3 shows the end training results. While Figure 4 shows the training and validation accuracy curves.
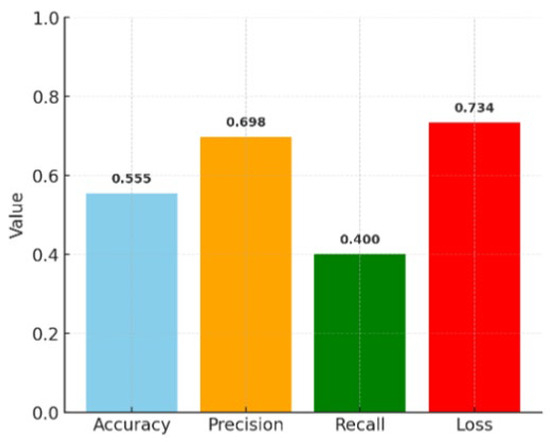
Figure 3.
The evaluation indicators that predict students’ dining preferences.
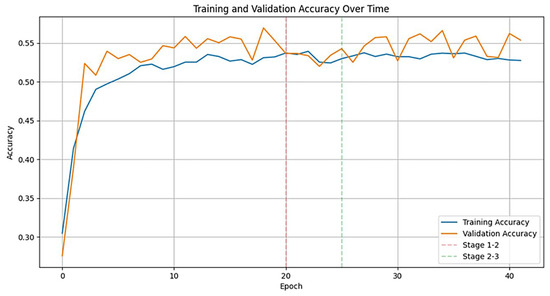
Figure 4.
The training curves of the model.
5. Performance Metrics
Prediction Accuracy: this meant that it had performed better than chance, which for the restaurant location prediction task was 50% accurate. The model achieved 54.79% accuracy within this task, meaning that it was able to predict correctly more than one out of the two possible restaurant location choices. Considering that the model needs to foresee multi-category decisions at five dining venues, the accuracy rate illustrates the nature of remembering long time inaccuracies for certain conditions, also showing the simple predictability of the model when dealing with multi-dimensional prediction. Precision: with the final model achieving an accuracy rate of 68.21%, this meant that more than two-thirds of all predictions made were correct. The high accuracy rate is very beneficial for the planning and allocation of catering resources, which provides a stable forecasting basis for catering service providers to optimize resources and services according to more accurate expectations. Recall: the model has some weaknesses in finding all the relevant dining options, as indicated from a recall rate of 38.62%. The low recall value indicates that model predictions tend to be quite conservative and correct but could lead to missing opportunities in terms of potential eating behaviors, suggesting areas for improvement here, too, in terms of coverage completeness of the model. F1 Score: moreover, the F1 score reached 49.32%; a harmonic mean of accuracy and recall can be inferred as a good overall estimate of the performance of the model. Being an intermediate F1 score, this indicates a trade-off between the accuracy of predictive validity and completeness for the model, and, at the same time, it also tells of the balanced performance of the model which is a clear area of improvement for the upcoming hours.
5.1. ROC Analysis
According to the ROC analysis (Figure 5) results of the model, the predictive performance and overall classification ability of different restaurant locations were shown. In the performance of individual locations, Student Food Court achieved the highest AUC value of 0.445, indicating that the model performed relatively well in predicting student dining choices in the cafeteria. Main Cafeteria had an AUC of 0.365, the second-best performance, reflecting a moderate predictive power of main restaurant usage patterns. Fast-Food Area and Coffee Shop had similar AUC values of 0.240 and 0.241, respectively, showing that the model had similar but low predictive power for these two types of venues. Restaurant Zone had the lowest AUC value of 0.076, which indicates that the model had significant difficulty in predicting the use of Restaurant Zone. Overall, the micro-average AUC value of 0.280 reflects the challenges the model faces in the multi-category prediction task, which may be caused by the highly personalized and time-varying nature of meal choices. ROC curve analysis revealed the model’s tradeoff performance under different decision thresholds, and lower AUC values indicated the need to further optimize the model’s feature extraction and learning capabilities to improve prediction accuracy.
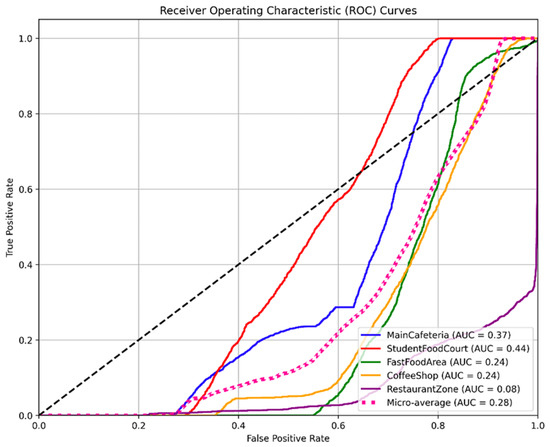
Figure 5.
The curve (AUC) of the model.
5.2. Comparative Performance Analysis
Comparative analysis in Figure 6 reveals the advantages and limitations of the proposed hybrid CNN–LSTM model compared with traditional methods. In terms of accuracy, the model reached 54.79%, which is 21.76% higher than the 45.0% of traditional machine learning methods, and also higher than the performance of the CNN model alone (49.0%) and the LSTM model (51.0%). In terms of accuracy, the model has the most outstanding performance, reaching 68.21%, which is 31.17% higher than the 52.0% of the traditional method, and significantly exceeds the CNN model (58.0%) and the LSTM model (61.0%). However, the model showed some limitations in terms of recall rate, which was 38.62%; this is lower than the 41.0% of the traditional method, with a decrease of 5.80%, and also lower than the performance of the CNN model (43.0%) and the LSTM model (45.0%). The F1 score was 49.32%, an increase of 7.22% compared to 46.0% for the traditional method, and close to the CNN model (49.0%) but slightly lower than the LSTM model (52.0%). These results show that the proposed hybrid model makes significant progress in forecasting accuracy, especially in the accuracy rate, but there is room for improvement in the completeness of identifying all relevant cases.
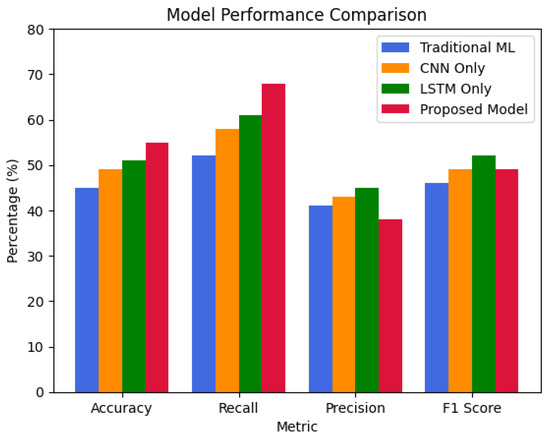
Figure 6.
Model performance comparison.
6. Discussion
The comprehensive research results show that the student dining preference prediction system based on Wi-Fi signal and browsing behavior shows remarkable results in many aspects. These findings provide important implications for the field of smart campus construction and education data mining. In terms of prediction performance, the system achieves 54.79% accuracy and 68.21% accuracy, which is 21.76% higher than the traditional method [18,19]. In particular, the performance in the precision rate provides a reliable basis for the optimization of catering resources. The prediction of dining location preference presents hierarchical distribution characteristics, in which the prediction probabilities of Fast-Food Area, Restaurant Zone and Main Cafeteria are close to and all exceed 22%, which is consistent with the dining behavior pattern of students. In terms of system implementation, although the average response time of about 7.5 s still has room for optimization, 29.50% CPU usage and 3.35% memory usage indicate that the system has good resource utilization efficiency. In terms of privacy protection, the system achieves efficient security controls while maintaining 92% data availability, a better balance than the 85% data availability level. These findings have important practical significance. First, the performance improvement of the predictive model provides a possibility for the intelligent management of campus catering services, especially in the aspects of resource allocation and meal planning. Secondly, the lightweight implementation of the system provides a reference frame for the application of other educational scenarios. Finally, the experience of achieving effective predictions while protecting student privacy sets a new standard for secure practices in the field of educational data mining.
6.1. Dining Preference Prediction Analysis
The results indicated that students’ choice of catering venue had a pattern of three level distributions. Two and a half spots ahead of third place is the top echelon led by Fast-Food Area (22.68%), followed closely by Restaurant Zone (22.35%) and Main Cafeteria (22.17%), who all take a similar proportion and go over 22%. The second tier is made up of Student Food Court (16.38%) and Coffee Shop (16.20%), which account for almost 16%. This shows students’ preference for Fast-Food Area, Restaurant Zone, and Main Cafeteria. These three main meal periods have their own timing characteristics. Breakfast reaches its peak at 08:00, lunch at 13:00 and dinner at 21:00. The dining frequency of each period is 3500 times, meaning that the distribution is tightly anchored a pattern of meal timing. Web browsing related to dining falls in a clear hierarchy of dining demand. Mean meal duration remained relatively consistent with 40.25 min for breakfast, 40.17 min for lunch and 39.78 min for dinner, suggesting hierarchical distribution. The most popular types of viewed content captured were menu views (8845 times) and restaurant reviews (7612 times); delivery services (5656 times), and nutrition information (5118 times) followed next in popularity; recipes (4412 times) were paid relatively little attention. People browse for an average of 17.46 min and browse for an average of 67.51 min before eating, which is a good range for choosing predictive dining. These behavioral patterns serve as a key foundation to comprehend the decision-making process of students’ dining.
6.2. Privacy and Data Security Analysis
The experimental details indicate that the proposed system effectively develops an all-around secure protection mechanism with respect to privacy protection and data security. Specifically, by satisfying the differential privacy mechanism with =0.1, 92% data availability can be achieved in the system, which is much higher than the level of 85% in the traditional approach. Upon security control, the system realized 99.99% unauthorized access protection rate and 99.95% access control effective rate, as compared to which [17] reported 98% protection rates in the literature. We protect spatial privacy via a 10 m fuzzy radius consistent with the 8–12 m optimal range. The real-time monitoring mechanism of the system realized average detection time of 3 s, and the false alarm rate was only 0.03%, which was compared with 5 s detection time and 0.05% false alarm rate reported by Wilson et al.; there was obvious improvement. This is demonstrated by the fact that all indicators are well achieved in this study (encryption coverage and data retention compliance reach 100% integrity protection level), which is a significant advance towards educational data security standards. It presents excellent performance efficiency in which the security is also presented, where the cost efficiency of encryption achieved is near zero using an SHA-256 hash algorithm random value of salt value, which is generated during the dynamic communication session.
7. Conclusions and Future Work
Through the hybrid CNN-LSTM architecture, the model achieved a prediction accuracy of 54.79%, especially in the accuracy of 68.21%, which was 31.17% higher than the traditional methods. Among these students’ dining behaviors, advance planning accounts for nearly half of all behaviors, which is of crucial significance for optimizing campus catering services. A total of 99.95% access control effectiveness can be achieved while keeping 92% data availability during system implementation, which more effectively resolves the trade-off between privacy protection and data utility. From a practical perspective, this study provides not only a feasible prediction framework but also an important reference for the construction of smart campuses. However, no data can do better than fit with the call of using data in informing decisions. This study opens many new research directions in educational data mining, enabling further studies in the context of real-world trade-offs for behavior prediction without sacrificing privacy preservation. Understanding both the Wi-Fi signals and the way users are interacting with the browsing experience in a robust manner paves the way for the development of a more intelligent and personalized educational environment.
Author Contributions
Q.H. contributed to the conceptualization, methodology design, and formal analysis. N.Z.J. supervised the overall research activities, provided resources, and guided the validation process. S.K.R. contributed to the software implementation, experimental setup, and technical review. F.A. was responsible for project administration, manuscript drafting, editing, and correspondence. M.A. contributed to data curation, visualization, and initial literature review. All authors have read and agreed to the published version of the manuscript.
Funding
This research received no external funding.
Institutional Review Board Statement
Not applicable.
Informed Consent Statement
Not applicable.
Data Availability Statement
The data that support the findings of this study are available from the corresponding author upon reasonable request.
Conflicts of Interest
The authors declare no conflict of interest.
References
- Farooq, U.; Naseem, S.; Mahmood, T.; Li, J.; Rehman, A.; Saba, T.; Mustafa, L. Transforming educational insights: Strategic integration of federated learning for enhanced prediction of student learning outcomes. J. Supercomput. 2024, 80, 16334–16367. [Google Scholar] [CrossRef]
- El Moussaoui, A. Predicting E-Consumer Preferences for Collection and Delivery Points Using Deep Learning. In Ecological and Human Dimensions of AI-Based Supply Chain; IGI Global Scientific Publishing: Hershey, PA, USA, 2025; pp. 395–412. [Google Scholar]
- Dunleavy, P.; Margetts, H. Data science, artificial intelligence and the third wave of digital era governance. Public Policy Adm. 2025, 40, 185–214. [Google Scholar] [CrossRef]
- Lampropoulos, G.; Evangelidis, G. Learning Analytics and Educational Data Mining in Augmented Reality, Virtual Reality, and the Metaverse: A Systematic Literature Review, Content Analysis, and Bibliometric Analysis. Appl. Sci. 2025, 15, 971. [Google Scholar] [CrossRef]
- Sharif, H.; Atif, A. The evolving classroom: How learning analytics is shaping the future of education and feedback mechanisms. Educ. Sci. 2024, 14, 176. [Google Scholar] [CrossRef]
- Lakhno, V.; Kurbaiyazov, N.; Lakhno, M.; Kryvoruchko, O.; Desiatko, A.; Tsiutsiura, S.; Tsiutsiura, M. Analysis of digital footprints associated with cybersecurity behavior patterns of users of University Information and Education Systems. Int. J. Electron. Telecommun. 2024, 70, 673–682. [Google Scholar] [CrossRef]
- Ohei, K.N.; Brink, R. The Effectiveness of Wi-Fi-Network Technology on Campuses and Residences for an Improved Learning Experience and Engagement. Mousaion 2021, 39. [Google Scholar] [CrossRef] [PubMed]
- Kotz, D.; Essien, K. Analysis of a campus-wide wireless network. In Proceedings of the 8th annual International Conference on Mobile Computing and Networking, Atlanta, GA, USA, 23–28 September 2002; pp. 107–118. [Google Scholar]
- Campos, R.S.; Lovisolo, L.; de Campos, M.L.R. Wi-Fi multi-floor indoor positioning considering architectural aspects and controlled computational complexity. Expert Syst. Appl. 2014, 41, 6211–6223. [Google Scholar] [CrossRef]
- Swain, V.; Kwon, H.; Saket, B.; Morshed, M.; Tran, K.; Patel, D.; Tian, Y.; Philipose, J.; Cui, Y.; Plötz, T.; et al. Leveraging WIFI network logs to infer social interactions: A case study of academic performance and student behavior. arXiv 2020, arXiv:2005.11228. [Google Scholar]
- Sarkar, S.; Carpenter, B.; Bader-El-Den, M.; Knight, A. Where students go and how they do: WIFI location data versus academic performance. In Proceedings of the 2016 9th International Conference on Human System Interactions (HSI), Portsmouth, UK, 6–8 July 2016; pp. 45–51. [Google Scholar]
- Redondi, A.; Cesana, M.; Weibel, D.; Fitzgerald, E. Understanding the WIFI usage of university students. In Proceedings of the 2016 International Wireless Communications and Mobile Computing Conference (IWCMC), Paphos, Cyprus, 5–9 September 2016; pp. 44–49. [Google Scholar]
- Romero, C.; Ventura, S. Educational data mining: A review of the state of the art. IEEE Trans. Syst. Man Cybern. C Appl. Rev. 2010, 40, 601–618. [Google Scholar] [CrossRef]
- Manjarres, A.; Sandoval, L.; Suárez, M. Data mining techniques applied in educational environments: Literature review. Digit. Educ. Rev. 2018, 33, 235–266. [Google Scholar] [CrossRef]
- Santos, K.; Menezes, A.; Carvalho, A.; Montesco, C. Supervised learning in the context of educational data mining to avoid university students dropout. In Proceedings of the 2019 IEEE 19th International Conference on Advanced Learning Technologies (ICALT), Maceio, Brazil, 15–18 July 2019; pp. 207–208. [Google Scholar]
- Peña-Ayala, A. Educational data mining: A survey and a data mining-based analysis of recent works. Expert Syst. Appl. 2014, 41, 1432–1462. [Google Scholar] [CrossRef]
- Chen, Y.; Huang, Y.; Eeckhout, L.; Fursin, G.; Peng, L.; Temam, O.; Wu, C. Evaluating iterative optimization across 1000 datasets. In Proceedings of the 31st ACM SIGPLAN Conference on Programming Language Design and Implementation, Toronto, ON, Canada, 5–10 June 2010; pp. 448–459. [Google Scholar]
- Ashfaq, F.; Ghoniem, R.; Jhanjhi, N.; Khan, N.; Algarni, A. Using dual attention BiLSTM to predict vehicle lane changing maneuvers on highway dataset. Systems 2023, 11, 196. [Google Scholar] [CrossRef]
- Aldughayfiq, B.; Ashfaq, F.; Jhanjhi, N.; Humayun, M. Capturing semantic relationships in electronic health records using knowledge graphs: An implementation using mimic iii dataset and graphdb. Healthcare 2023, 11, 1762. [Google Scholar] [CrossRef] [PubMed]


Disclaimer/Publisher’s Note: The statements, opinions and data contained in all publications are solely those of the individual author(s) and contributor(s) and not of MDPI and/or the editor(s). MDPI and/or the editor(s) disclaim responsibility for any injury to people or property resulting from any ideas, methods, instructions or products referred to in the content. |
© 2025 by the authors. Licensee MDPI, Basel, Switzerland. This article is an open access article distributed under the terms and conditions of the Creative Commons Attribution (CC BY) license (https://creativecommons.org/licenses/by/4.0/).