Abstract
In the mountainous and foothill areas of Santiago, Chile, debris flows and debris floods have been recurrent over recent decades, triggered by short-duration, high-intensity summer rainfall events. These events have caused significant damage to infrastructure and have affected the population, including loss of human lives. This study assesses the susceptibility to debris flow and debris flood generation in the Arrayán and Gualtatas stream basins, located in the Metropolitan Region, using satellite and cartographic data. A Susceptibility Index (SI) was determined through the analysis of 14 conditioning factors, grouped into three main categories: geology, geomorphology, and soil conditions. The weighting and ranking of each factor’s importance were carried out using the Analytic Hierarchy Process (AHP). The results, presented in a susceptibility map, indicate that 60.78% of the study area exhibits low to very low susceptibility, 24.64% moderate susceptibility, and 14.58% high to very high susceptibility, concentrated in stream headwaters, steep slopes, and areas with unconsolidated deposits. Recent debris flow events that have reached urban areas coincide with high-susceptibility zones, validating the methodology and cartographic products, which can support land-use planning and risk management efforts.
1. Introduction
The Andes mountain range presents a combination of geological, geomorphological, tectonic, and climatic conditions that make it highly susceptible to a variety of mass movements [1]. These processes are particularly common in the Andean foothills and the inner ravines of mountainous basins, where debris flows and debris floods frequently occur and may extend into alluvial plains [2]. These dynamics are especially concerning given the sustained urban expansion toward foothills zones, which increases population exposure to natural hazards. In this mountain environment, gravitational, glacial, snow-related, periglacial, and fluvial process interact, with steep slopes, rugged relief, and intense precipitation events enhancing denudation and deposition dynamics [3]. The combination of these environmental drivers promotes slope instability and increases the frequency and intensity of mass movement processes.
Mass movements are defined as rapid or slow movements of rock, soil, or both, driven by gravity [4]. Their classification depends on several factors, including the type of material involved, movement characteristics, and soil saturation, encompassing phenomena such as rockfalls, topples, landslides (rotational and translational), lateral spreading, creep, debris flow and debris floods [5]. The triggering and development of these processes are influenced by multiple interacting factors, such as lithology, geomorphology, geological structures, hydrology, hydrogeology, vegetation cover and climate conditions. Triggers include hydrometeorological extremes, seismic activity, and volcanic events [6]. In recent decades, a series of landslides triggered by seismic activity, thermal anomalies, and intense precipitation have affected central Chile. On 4 September 1958, in the interior of the Cajón del Maipo, 60 km SE of Santiago, a series of earthquakes of similar magnitude occurred (6.9, 6.7, 6.8 on the Richter scale), causing different mass movement events, like block falls, debris flows and rotational landslides [7]. In the El Alfalfal area, near the Colorado River, on 29 November 1987, thermal anomalies caused snow melt that destabilized a large rock, generating landslides, rock avalanches, debris flows, debris floods, and mud flows, causing 45 fatalities and the destruction of a large part of the Maitenes and El Alfalfal hydroelectric plants [8]. On 3 May 1993, in the San Ramón and Macul ravines (La Reina, Peñalolén and La Florida communes), debris flows triggered by intense rainfall and a 0 °C isotherm above 4540 mals left 26 fatalities, 9 missing people, 5000 people affected, 1169 houses totally or partially destroyed, and severe damage to public and private infrastructure [9,10]. During 25 and 26 February 2017, in the Cajón del Maipo, intense rainfall and a 0° isotherm above 4540 mals triggered debris flows and mudflows, causing 8 fatalities, 1 missing person, 1000 victims, damage to infrastructure, and massive water supply cut-off in the city of Santiago [11]. In addition, similar meteorological events generated debris flows in Cajón del Maipo in 1991, 2014, and 2016 [6,12,13,14,15,16]. Between 28 and 31 January 2021, in the San Alfonso and El Melocotón sectors, intense landslides caused debris flows, causing 250 people to be affected and leaving El Ingenio, San Alfonso, San Gabriel, Baños Morales, and Melocotón sectors isolated [17]. Recently, on 19 January 2023, in the Casa de Lata sector of the Yerba Loca creek, a debris flow was generated by the rapid melting of a slab of snow accumulated in the upper part of the creek. Due to rainfall between 5 and 9 January and thermal anomalies on 19 January in the Pre-Cordilleran and Cordilleran areas of central Chile, the debris flow left about 20 people isolated and cut the pedestrian path that connects Villa Paulina with the upper part of the creek basin by 5–10 m [18].
Most studies conducted in central Chile on debris flow susceptibility have applied methods based on the identification of source areas at the micro-basin scale [1,2,6]. This study aims to enhance the spatial identification and characterization of areas susceptible to debris flows and debris floods by delineating susceptible zones at the pixel scale, using remote sensing tools in the northeastern urban sector of the city of Santiago, located in the Andean foothills. Understanding these spatial patterns is essential for reducing socio-environmental vulnerability in rapidly growing urban areas.
2. Material and Methods
2.1. Study Area
The study area covers approximately 37,459 km2 and is located in the northeastern sector of the Metropolitan Region of Santiago, Chile, within the upper basin of the Mapocho River, between latitudes 33°07′ S and 33°28′ S, and longitudes 70°20′ W and 70°40′ W. It encompasses sub-basins of the Mapocho River, specifically the Arrayán and Gualtatas creeks. These are part of the northeastern tributary system of the Maipo River Basin, one of the most important watersheds in central Chile (Figure 1).
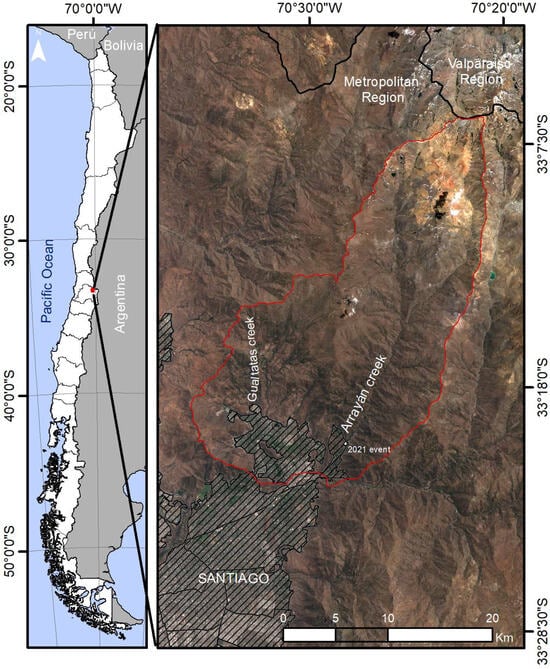
Figure 1.
Location map of the study area. The main sub-basins and creeks that compose them are shown.
The area presents a strong altitudinal gradient ranging from approximately 790 m to over 2860 m above sea level, transitioning from urban foothill zones to high Andean terrains. Land use is diverse and includes urban expansion zones, natural vegetation, conservation areas, and tourism infrastructure. This land-use mosaic interacts with the region’s geomorphological and climatic dynamics, increasing its susceptibility to gravitational processes [19].
The region is characterized by Mediterranean climate conditions, with a strong interannual variability in precipitation ranging from 100 mm to over 2000 mm, primarily associated with winter cold fronts [20].
Geologically, the study area includes volcanic, volcanoclastic, and sedimentary rocks belonging to the Abanico Formation (Upper Eocene–Lower Miocene), which are overlain by rocks from the Farellones Formation (Lower–Upper Miocene). These units are affected by faults and folds that contribute to the structural weakness of the terrain, favoring slope instability [21].
2.2. Data Sources
A bibliographic and cartographic review was conducted to characterize the geomorphological, hydrographic, geological, and land cover components of the study area. The analysis was based on the photointerpretation of high-resolution satellite imagery, including a 0.5 m resolution Pléiades mosaic (2015) and 3 m resolution PlanetScope imagery (2023), which was harmonized with the Sentinel-2 sensor. Additionally, the 12.5 m resolution ALOS PALSAR Digital Elevation Model (2011) (Available online: https://asf.alaska.edu/sar-data/palsar/, accessed on 11 November 2024) was used to analyze topographic and geomorphological features. The DEM was processed in ArcGIS Pro to derive slope, aspect, surface curvature, and the Topographic Wetness Index (TWI).
Additional data sources included digital cartography of the Metropolitan Region (Section E, scale 1:50,000), and the glacier and water resource inventory of the General Directorate of Water (2022) [22]. The persistence of snow cover was obtained from the time series analysis of MODIS satellite images (2000–2022) elaborated and updated by [23], which used MODIS 8-day 500 m Collection 5 Level 3 binary snow cover products. MODIS is a passive 36-band spectrometer on-board two satellites, Terra and Aqua.
The vegetation cover change data was downloaded from the server https://glad.earthengine.app/view/global-forest-change, accessed on 29 May 2025. Land uses were extracted from Catastro y Actualización de los Recursos Vegetacionales y Uso de la Tierra (2019) Cadastre and Update of Vegetation Resources and Land Use) and downloaded from the server https://ide.minagri.gob.cl/geoweb/2019/11/22/planificacion-catastral/, accessed on 29 May 2025.
2.3. Conditioning Factors
A total of 14 conditioning factors were considered for the calculation of the Susceptibility Index (SI), associated with three groups (Geomorphology, Geology, Soil condition), and described below.
Slope gradient: Slope was derived from the ALOS PALSAR DEM with a spatial resolution of 12.5 m. This data was also used to generate additional morphometric variables, including slope aspect, profile curvature, Topographic Wetness Index (TWI), and drainage network hierarchy.
Slope aspect: The orientation of slopes relative to solar exposure influences melting and moisture retention processes, which in turn affect erosion, material weathering, and vegetation cover. Drier, sun-facing slopes tend to exhibit reduced vegetation and increased susceptibility to mass wasting processes [24].
Profile curvature: Concave slopes, which are often associated with active erosion, are considered more susceptible to instability. Conversely, convex slopes tend to exhibit lower susceptibility [25].
Distance to geoforms: The geoforms correspond to linear elements of the surface and are related to higher degrees of fracturing. Areas near these features are classified as having higher susceptibility [26].
Drainage network density: Drainage density was calculated based on the number of channels within 1000 m × 1000 m cells. Higher drainage density is linked to high susceptibility due to enhanced surface runoff, whereas lower density indicates lower susceptibility.
Distance drainage network by hierarchy: The proximity and hierarchy drainage network conditions the permeability, saturation, and filtration capacity of the soil, affecting the stability of the substrate, eroding and saturating the lower parts of the slopes [27]. The distances were defined according to the runoff and order of the drains.
Topographic Wetness Index (TWI): This index reflects the potential for water accumulation within the terrain [28]. Higher index values correlate with greater susceptibility to debris flow and debris flood initiation due to increased moisture content.
Geological units: Lithological units were based on the literature and geological maps and were reclassified based on the categories used by [29]. The mechanical properties of different rock types influence their susceptibility to failure.
Fault density: Faults identified in geological maps were used to determine fault density within 1000 m × 1000 m grid cells. A higher fault density implies reduced rock strength and greater potential for slope instability [30].
Distance to faults: Proximity to fault zones increases landslide susceptibility due to structural weakness. Different weights were assigned to observed and inferred faults, with higher importance attributed to observed fault traces and closer areas [30].
Distance to folds: Similarly to faults, fold axes represent zones of structural weakness associated with increased fracturing. Susceptibility values were assigned based on distance from fold axes, with closer areas being more susceptible [26].
Forest change: Forest change data from 2000 to 2022 were obtained from [31], with classification into gain, stable, and deforested area. Vegetation changes were used as indicators of surface alteration and potential destabilization.
Land cover: Land cover classes were simplified from the “Castastro y Evaluacion de los Recursos Vegetacionales Nativos de Chile” (2013) (Cadastre and Evaluation of Native Plant Resources of Chile) at a 1:50,000 scale, and were used to differentiate surface types influencing hydrological and mechanical properties.
Snow persistence: Snow cover persistence was represented by the Snow Cover Index (SCI), as developed and updated by [23]. The index quantifies snow frequency over a 23-year period (2000–2022), expressed as a percentage ranging from 0 to 100%.
2.4. Susceptibility
Susceptibility is associated with the probability of mass movement occurrence in a specific area as a function of its intrinsic characteristics [32]. It was evaluated using a qualitative combination methodology of thematic layers [1,20,24,29,33]. It was quantified by calculating a Susceptibility Index (SI), which involves the sum of weighted scores for each one of the 14 conditioning factors considered in the study area [1,24,29] (Equation (1)).
where corresponds to each of the 14 conditioning factors reclassified in values between 0 and 5, where 0 indicates a factor that does not increase susceptibility and 5 indicates a factor that strongly influences susceptibility; corresponds to the percentage assigned to each of the conditioning factors according to their level of importance and on a percentage scale of 0–100% (Table 1).

Table 1.
Conditioning factors used to determine susceptibility.
The percentage assigned to each of the conditioning factors according to their level of importance was determined using the Analytical Hierarchical Process (AHP), which considers a comparison of the contribution of the different factors in a pairwise matrix. To obtain the weights of the factors in the AHP, the methodology used by [34] was applied, which relies on expert-based pairwise comparisons to quantify the relative importance of each factor by assigning a relative dominant value between one and nine in the intersection cell, considering the preference scale developed by [35]. The construction of the pairwise comparison matrix was guided by the existing literature on landslide and debris flow susceptibility [1,6,24]. Priority was assigned based on the recognized influence of each factor on slope instability. For example, topographic parameters such as slope gradient and drainage density were considered highly influential due to their direct relationship with gravitational processes and surface water accumulation and were therefore assigned higher weights than factors such as land cover. Finally, the values obtained from the AHP were converted to a percentage and adjusted, where the sum of the 14 conditioning factors is 100%.
ArcMap 10.8 software was used to process the acquired data, create new data, reclassify the thematic maps, and calculate the Susceptibility Index (SI) using the Raster Calculator tool. All input thematic maps were resampled to a common spatial resolution of 12.5 m to ensure consistency in the multi-criteria analysis and to match the resolution of the ALOS PALSAR Digital Elevation Model used for deriving topographic variables.
The SI values were subsequently classified into five susceptibility levels using the Natural Breaks (Jenks) method [36], which groups similar values and determines optimal category limits based on data distribution (Table 2). This method was selected over equal interval or quantile classification because it minimizes intra-class variance and maximizes inter-class variance. Given that Susceptibility Index values are typically non-normally distributed and tend to form clusters, the Jenks method is particularly suitable for capturing the natural structure of the data and producing meaningful class boundaries for spatial interpretation.
Table 2.
Reclassification of the Susceptibility Index.
3. Results
Based on 14 conditioning factors, a susceptibility map of debris flow and debris flood was generated for the Arrayán and Gualtatas stream basins, as shown in Figure 2, with the distribution of susceptibility categories detailed in Table 3.

Figure 2.
Debris flow and debris flood susceptibility map of the upper Mapocho river basin.
Table 3.
Area and percentage of susceptibility categories.
According to the susceptibility map (Figure 2), 70.05% of the study area is classified within the very low to moderate susceptibility classes for debris flow and debris flood occurrences. The quantitative breakdown of these categories is presented in Table 3. The areas with high and very high susceptibility, representing 29.93% of the total area, are primarily concentrated in the northeastern headwaters of the basin, valley bottoms, slopes steeper than 20°, and in geological units characterized by low consolidation, including alluvial, colluvial, fluvial, and landslide deposits, as well as glaciers, wetlands, and lakes in the upper part of the basin.
These patterns are consistent with previous susceptibility studies in the Santiago foothills [1,2], which also identified the headwater basins as zones with elevated susceptibility due to steep slopes and unstable geological conditions. However, our model provides finer spatial resolution, enabling the identification of additional susceptible areas not previously delineated. From a territorial planning perspective, the proximity of highly susceptible zones to urban development areas emphasizes the need to integrate susceptibility assessments into land-use planning instruments, infrastructure design, and environmental permitting processes.
4. Conclusions
Over the past decades, the foothill and highland zones of the Metropolitan Region have experienced numerous landslide events, primarily triggered by climatic anomalies such as torrential rainfall, and, to a lesser extent, by earthquakes of varying magnitudes.
In the study area, zones with the highest susceptibility to debris flows and debris floods are concentrated along major riverbeds, stream channels, and in areas with unconsolidated deposits and steep slopes. This spatial pattern aligns with the distribution of predominant deposits and is consistent with the location of recent events. Notably, the most recent debris flow recorded in the Arrayán creek in 2021—triggered by intense summer precipitation—occurred within areas classified with high to very high susceptibility and whose mobility is strongly influenced by local topographic conditions. Although the model indicates a strong spatial correlation between the 2021 debris flow event and areas of high to very high susceptibility, the study lacks a quantitative validation metric due to the limited availability of event data. This highlights the need to develop more complete and systematic inventories to allow for future quantitative assessments of model performance.
The susceptibility map generated through this study provides a valuable tool for land-use planning, infrastructure development, and disaster risk management. It offers a scientifically supported basis for the design of early warning systems, zoning regulations, and targeted interventions that can reduce the vulnerability of both population and infrastructure in high-susceptibility areas. To enhance its practical application, we recommend that the susceptibility map be integrated into local and regional land-use planning instruments (e.g., zoning regulations, urban development plans, and environmental impact assessments). Urban planners should consider restricting or conditioning development in areas classified as high or very high susceptibility. Emergency management agencies can use the results to prioritize monitoring efforts and implement early warning systems in critical sectors. In addition, nature-based solutions, such as slope revegetation and stabilization, can be strategically implemented in susceptible zones to reduce exposure and enhance resilience. These applications highlight the potential of geospatial tools to support preventive decision-making in mountainous and urban foothill areas of Santiago and other Andean regions.
Author Contributions
Conceptualization, B.C.-C.; methodology, W.P.-M., P.V.-P. and A.J.-S.; software, B.C.-C. and A.J.-S.; validation, B.C.-C.; formal analysis, B.C.-C. and W.P.-M.; investigation, W.P.-M. and P.V.-P.; resources, W.P.-M.; data curation, B.C.-C. and A.J.-S.; writing—original draft preparation, B.C.-C.; writing—review and editing, W.P.-M.; visualization, B.C.-C.; supervision, B.C.-C. and W.P.-M.; project administration, W.P.-M.; funding acquisition, W.P.-M. All authors have read and agreed to the published version of the manuscript.
Funding
This research was funded by Hémera Centro de Observación de la Tierra of Universidad Mayor.
Institutional Review Board Statement
Not applicable.
Informed Consent Statement
Not applicable.
Data Availability Statement
The data that support the findings of this study are available from the corresponding author upon reasonable request.
Conflicts of Interest
The authors declare no conflicts of interest.
References
- Lara, M.; Sepúlveda, S.A. Landslide susceptibility and hazard assessment in San Ramón Ravine, Santiago de Chile, from an engineering geological approach. Environ. Earth Sci. 2010, 60, 1227–1243. [Google Scholar] [CrossRef]
- Lara, M.; Sepúlveda, S.A.; Celis, C.; Rebolledo, S.; Ceballos, P. Landslide susceptibility maps of Santiago city Andean foothills, Chile. Andean Geol. 2018, 45, 433–442. [Google Scholar] [CrossRef]
- Lambiel, C.; Maillard, B.; Kummert, M.; Reynard, E. Geomorphology of the hérens valley (Swiss alps). J. Maps 2016, 12, 160–172. [Google Scholar] [CrossRef]
- Hungr, O.; Leroueil, S.; Picarelli, L. The Varnes classification of landslide types, an update. Landslides 2014, 11, 167–194. [Google Scholar] [CrossRef]
- Varnes, D.J. Slope movement types and processes. Spec. Rep. 1978, 176, 11–33. [Google Scholar]
- Sepúlveda, S.A.; Moreiras, S.M.; Lara, M.; Alfaro, A. Debris flows in the Andean ranges of central Chile and Argentina triggered by 2013 summer storms: Characteristics and consequences. Landslides 2015, 12, 115–133. [Google Scholar] [CrossRef]
- Lomnitz, C. Los terremotos del 4 de septiembre de 1958 en el Cajón del Maipo. An. De La Fac. De Cienc. Físicas Y Matemáticas 1961, 18, 275–294. [Google Scholar]
- Valenzuela, L.; Varela, J. El Alfalfal rock fall and debris flow in Chilean Andes mountain. In Proceedings of the 9th Panamerican Conference on Soil Mechanics and Foundation Engineering, Viña del Mar, Chile, 26–30 August 1991; Volume 1, pp. 357–371. [Google Scholar]
- Naranjo, J.A.; Varela, J. Flujos de detritos y barro que afectaron el sector oriente de Santiago, el 3 de mayo de 1993. Serv. Nac. Geol. Y Minería 1996, 47, 42. [Google Scholar]
- Sepúlveda, S.A.; Rebolledo, S.; Vargas, G. Recent catastrophic debris flows in Chile: Geological hazard, climatic relationships and human response. Quat. Int. 2006, 158, 83–95. [Google Scholar] [CrossRef]
- SERNAGEOMIN. Principales Desastres Ocurridos Desde 1980 en Chile; Servicio Nacional de Geología y Minería, Oficina de Comunicaciones: Santiago, Chile, 2017; p. 45. [Google Scholar]
- Hauser, A. Flujos de Barro en la Zona Preandina de la Región Metropolitana: Características, Causas, Efectos, Riesgos y Medidas Preventivas; Revista geológica de Chile: Santiago, Chile, 1985; Volume 24. [Google Scholar]
- Hauser, A. Informe Geotécnico Flujos Detríticos en Quebrada Las Amarillas, Sector Baños Morales, Región Metropolitana; unpublished report; Servicio Nacional de Geología y Minería: Santiago, Chile, 1991. [Google Scholar]
- Hauser, A. Informe Geotécnico Referido a la Evaluación de Riesgos de Remociones en Masa, Sector Villa del Valle, Baños Morales, Región Metropolitana; unpublished report; Servicio Nacional de Geología y Minería: Santiago, Chile, 1993. [Google Scholar]
- Hauser, A. Geología, Geotecnia y Evaluación de Riesgo Aluvional en Torno a la Localidad de Sal Alfonso, Región Metropolitana; unpublished report; Servicio Nacional de Geología y Minería: Santiago, Chile, 1996. [Google Scholar]
- Gajardo, A.; Garrido, N.; Falcón, F. Reconocimiento Geológico de Los Eventos de Remoción en Masa Ocurridos el 21 de Enero de 2013 en el Cajón del Maipo, Región Metropolitana; unpublished report; Servicio Nacional de Geología y Minería: Santiago, Chile, 2013. [Google Scholar]
- CR2. Análisis: Una Tormenta de Invierno en Pleno Verano? Entendiendo el Extraordinario Evento de Finales de Enero de 2021 en Chile Central. Center for Climate and Resilience Research 2021. Available online: https://www.cr2.cl/analisis-una-tormenta-de-invierno-en-pleno-verano-entendiendo-el-extraordinario-evento-de-finales-de-enero-de-2021-en-chile-central-cr2 (accessed on 21 November 2023).
- Anglo American. Minuta Flujo de Detritos Sector la Lata Cuenca del Estero Yerba Loca; unpublished report; Anglo American: London, UK, 2023. [Google Scholar]
- Reichenbach, P.; Rossi, M.; Malamud, B.D.; Mihir, M.; Guzzetti, F. A review of statistically-based landslide susceptibility models. Earth-Sci. Rev. 2018, 180, 60–91. [Google Scholar] [CrossRef]
- Viale, M.; Garreaud, R. Orographic effects of the subtropical and extratropical Andes on upwind precipitating clouds: Effects of the Andes on precipitation. J. Geophys. Res. Atmos. 2015, 120, 4962–4974. [Google Scholar] [CrossRef]
- Muñoz-Sáez, C.; Pinto, L.; Charrier, R.; Nalpas, T. Influence of depositional load on the development of a shortcut fault system during the inversión of an extensional basin: The Eocene-Oligocene Abanico Basin case, central Chile Andes (33°–35° S). Andean Geol. 2014, 41, 1–28. [Google Scholar] [CrossRef]
- DGA. Inventario Público de Glaciares de Chile. Dirección General de Aguas, Ministerios de Obras Públicas, Gobierno de Chile. 2022. Available online: https://dga.mop.gob.cl/inventario-publico-de-glaciares-actualizacion-2022/ (accessed on 29 May 2025).
- Saavedra, F.A.; Kampf, S.K.; Fassnacht, S.R.; Sibold, J.S. Changes in Andes snow cover from MODIS data, 2000–2016. Cryosphere 2018, 12, 1027–1046. [Google Scholar] [CrossRef]
- Lara, M. Metodología Para la Evaluación y Zonificación de Peligro de Remociones en Masa con Aplicación en Quebrada San Ramón, Santiago Oriente, Región Metropolitana. Master’s Thesis, Mención Geología, Universidad de Chile, Departamento de Geología, Santiago, Chile, 2007; p. 229. [Google Scholar]
- Wubalem, A. Landslide susceptibility mapping using statistical methods in Uatzau catchment area, northwestern Ethiopia. Geoenviron. Disasters 2021, 8. [Google Scholar] [CrossRef]
- Droguett, B.; Vidal-Páez, P.; Clavero, J.; Pérez-Martínez, W.; Briceño-De-Urbaneja, I.; Ramírez, V.; Tamayo, A. Heavy rain-induced debris flow/flood hazards at a geomorphologically active Andean valley: The case of the Yerba Loca basin, Central Chile. Andean Geol. 2023; review paper. [Google Scholar]
- Nohani, E.; Moharrami, M.; Sharafi, S.; Khosravi, K.; Pradhan, B.; Pham, B.T.; Lee, S.; Melesse, A.M. Landslide Susceptibility Mapping Using Different GIS-Based Bivariate Models. Water 2019, 11, 1402. [Google Scholar] [CrossRef]
- Regmi, A.D.; Devkota, K.C.; Yoshida, K.; Pradhan, B.; Pourghasemi, H.R.; Kumamoto, T.; Akgun, A. Application of frequency ratio, statistical index, and weights of evidence model sand their comparison in landslide susceptibility mapping in Central Nepal Himalaya. Arab. J. Geosci. 2014, 7, 725–742. [Google Scholar] [CrossRef]
- Pérez-Martínez, W.; Pardo-Pascual, J.E.; Briceño, I.; Vidal, P. Study of Natural Hazards in the Upper Part of the Mapocho River Basin, Metropolitan Region of Chile, Using Satellite Imagery. Proceedings 2019, 19, 4. [Google Scholar] [CrossRef]
- Abedin, J.; Rabby, Y.W.; Hasan, I.; Akter, H. An investigation of the characteristics, causes, and consequences of June 13, 2017, landslides in Rangamati District Bangladesh. Geoenviron. Disasters 2020, 7, 23. [Google Scholar] [CrossRef]
- Hansen, M.C.; Potapov, P.V.; Moore, R.; Hancher, M.; Turubanova, S.A.; Tyukavina, A.; Thau, D.; Stehman, S.V.; Goetz, S.J.; Loveland, T.R.; et al. High-Resolution Global Maps of 21st-Century Forest Cover Change. Science 2013, 342, 850–853. [Google Scholar] [CrossRef] [PubMed]
- Aleotti, P.; Chowdhury, R. Landslide hazard assessment: Summary review and new perspectives. Bull. Eng. Geol. Environ. 1999, 58, 21–44. [Google Scholar] [CrossRef]
- Vidal-Páez, P.; Clavero, J.; Droguett, D.; Pérez-Martínez, W.; Briceño-De-Urbaneja, I.; Oliva, P. Landslide Susceptibility Using Remote Sensing Data & GIS in a High Andean Area of Central Chile. In Proceedings of the IGARSS 2020-2020 IEEE International Geoscience and Remote Sensing Symposium, Waikoloa, HI, USA, 17 February 2020; pp. 6604–6607. [Google Scholar] [CrossRef]
- Intarawichian, N.; Dasananda, S. Analytical Hierarchy Process for Landslide Susceptibility Mapping in Lower Mae Chaem Watershed, Northern Thailand. Suranaree J. Sci. Technol. 2010, 17, 277–292. [Google Scholar]
- Saaty, T.L.; Vargas, L.G. Models, Methods, concepts & applications of the analytic hierarchy process. In International Series in Management Science/Operations Research; Springer: Berlin/Heidelberg, Germany, 2012. [Google Scholar] [CrossRef]
- Jenks, G.F.; Caspall, F.C. Error on choroplethic maps: Definition, measurement, reduction. Ann. Assoc. Am. Geogr. 1971, 61, 217–244. [Google Scholar] [CrossRef]


Disclaimer/Publisher’s Note: The statements, opinions and data contained in all publications are solely those of the individual author(s) and contributor(s) and not of MDPI and/or the editor(s). MDPI and/or the editor(s) disclaim responsibility for any injury to people or property resulting from any ideas, methods, instructions or products referred to in the content. |
© 2025 by the authors. Licensee MDPI, Basel, Switzerland. This article is an open access article distributed under the terms and conditions of the Creative Commons Attribution (CC BY) license (https://creativecommons.org/licenses/by/4.0/).