Proceeding Paper

Edge IoT-Enabled Cyber–Physical Systems with Paper-Based Biosensors and Temporal Convolutional Networks for Real-Time Water Contamination Monitoring †

by
Jothi Akshya
1,
Munusamy Sundarrajan
2,* and
Rajesh Kumar Dhanaraj
3
1
Department of Computational Intelligence, SRM Institute of Science and Technology, Chennai 603203, India
2
Department of Networking and Communications, SRM Institute of Science and Technology, Chennai 603203, India
3
Symbiosis Institute of Computer Studies and Research (SICSR), Symbiosis International (Deemed University), Pune 412115, India
*
Author to whom correspondence should be addressed.
Presented at the 5th International Electronic Conference on Biosensors, 26–28 May 2025; Available online: https://sciforum.net/event/IECB2025.
Eng. Proc. 2025, 106(1), 3; https://doi.org/10.3390/engproc2025106003 (registering DOI)
Published: 15 August 2025

Abstract

Water pollution poses serious threats to public health and the environment, therefore requiring efficient and scalable monitoring solutions. This paper presents a cyber–physical system (CPS) that integrates paper-based biosensors with an edge IoT architecture and long-range wide area network (LoRaWAN) for real-time assessment of water quality. The biosensors detect pollutants such as arsenic, lead, and nitrates with a detection limit of 0.5 ppb. The system proposed was compared with existing LSTM systems based on two performance metrics: detection accuracy and latency. Paper-based biosensors were fabricated using silver nanoparticle-functionalized substrates to show high sensitivity and low-cost pollutant detection. TCN algorithm deployment at the edge allows for real-time processing for time-series data analysis due to its high accuracy and low latency properties compared with LSTM models, which were mainly chosen due to their usage in most applications dealing with time-series-based analysis. Experimentation was carried out by deploying the developed CPS in controlled environments, simulating pollutants at different levels, and executing the models to test their accuracy in detecting pollutants and the latency of data processing. The TCN framework achieved a detection accuracy of 98.7%, which surpassed LSTM by 92.4%. In addition, TCN reduced latency in processing by 38% to enable fast data analysis and decision making. LoRaWAN allowed for perfect packet transmission of up to 15 km, while the loss rate stayed as low as 2.1%. These results establish the proposed CPS as reliable, efficient, and scalable for real-time water contamination monitoring. Thus, this research introduces the integration of paper-based biosensors with advanced computational frameworks.

1. Introduction

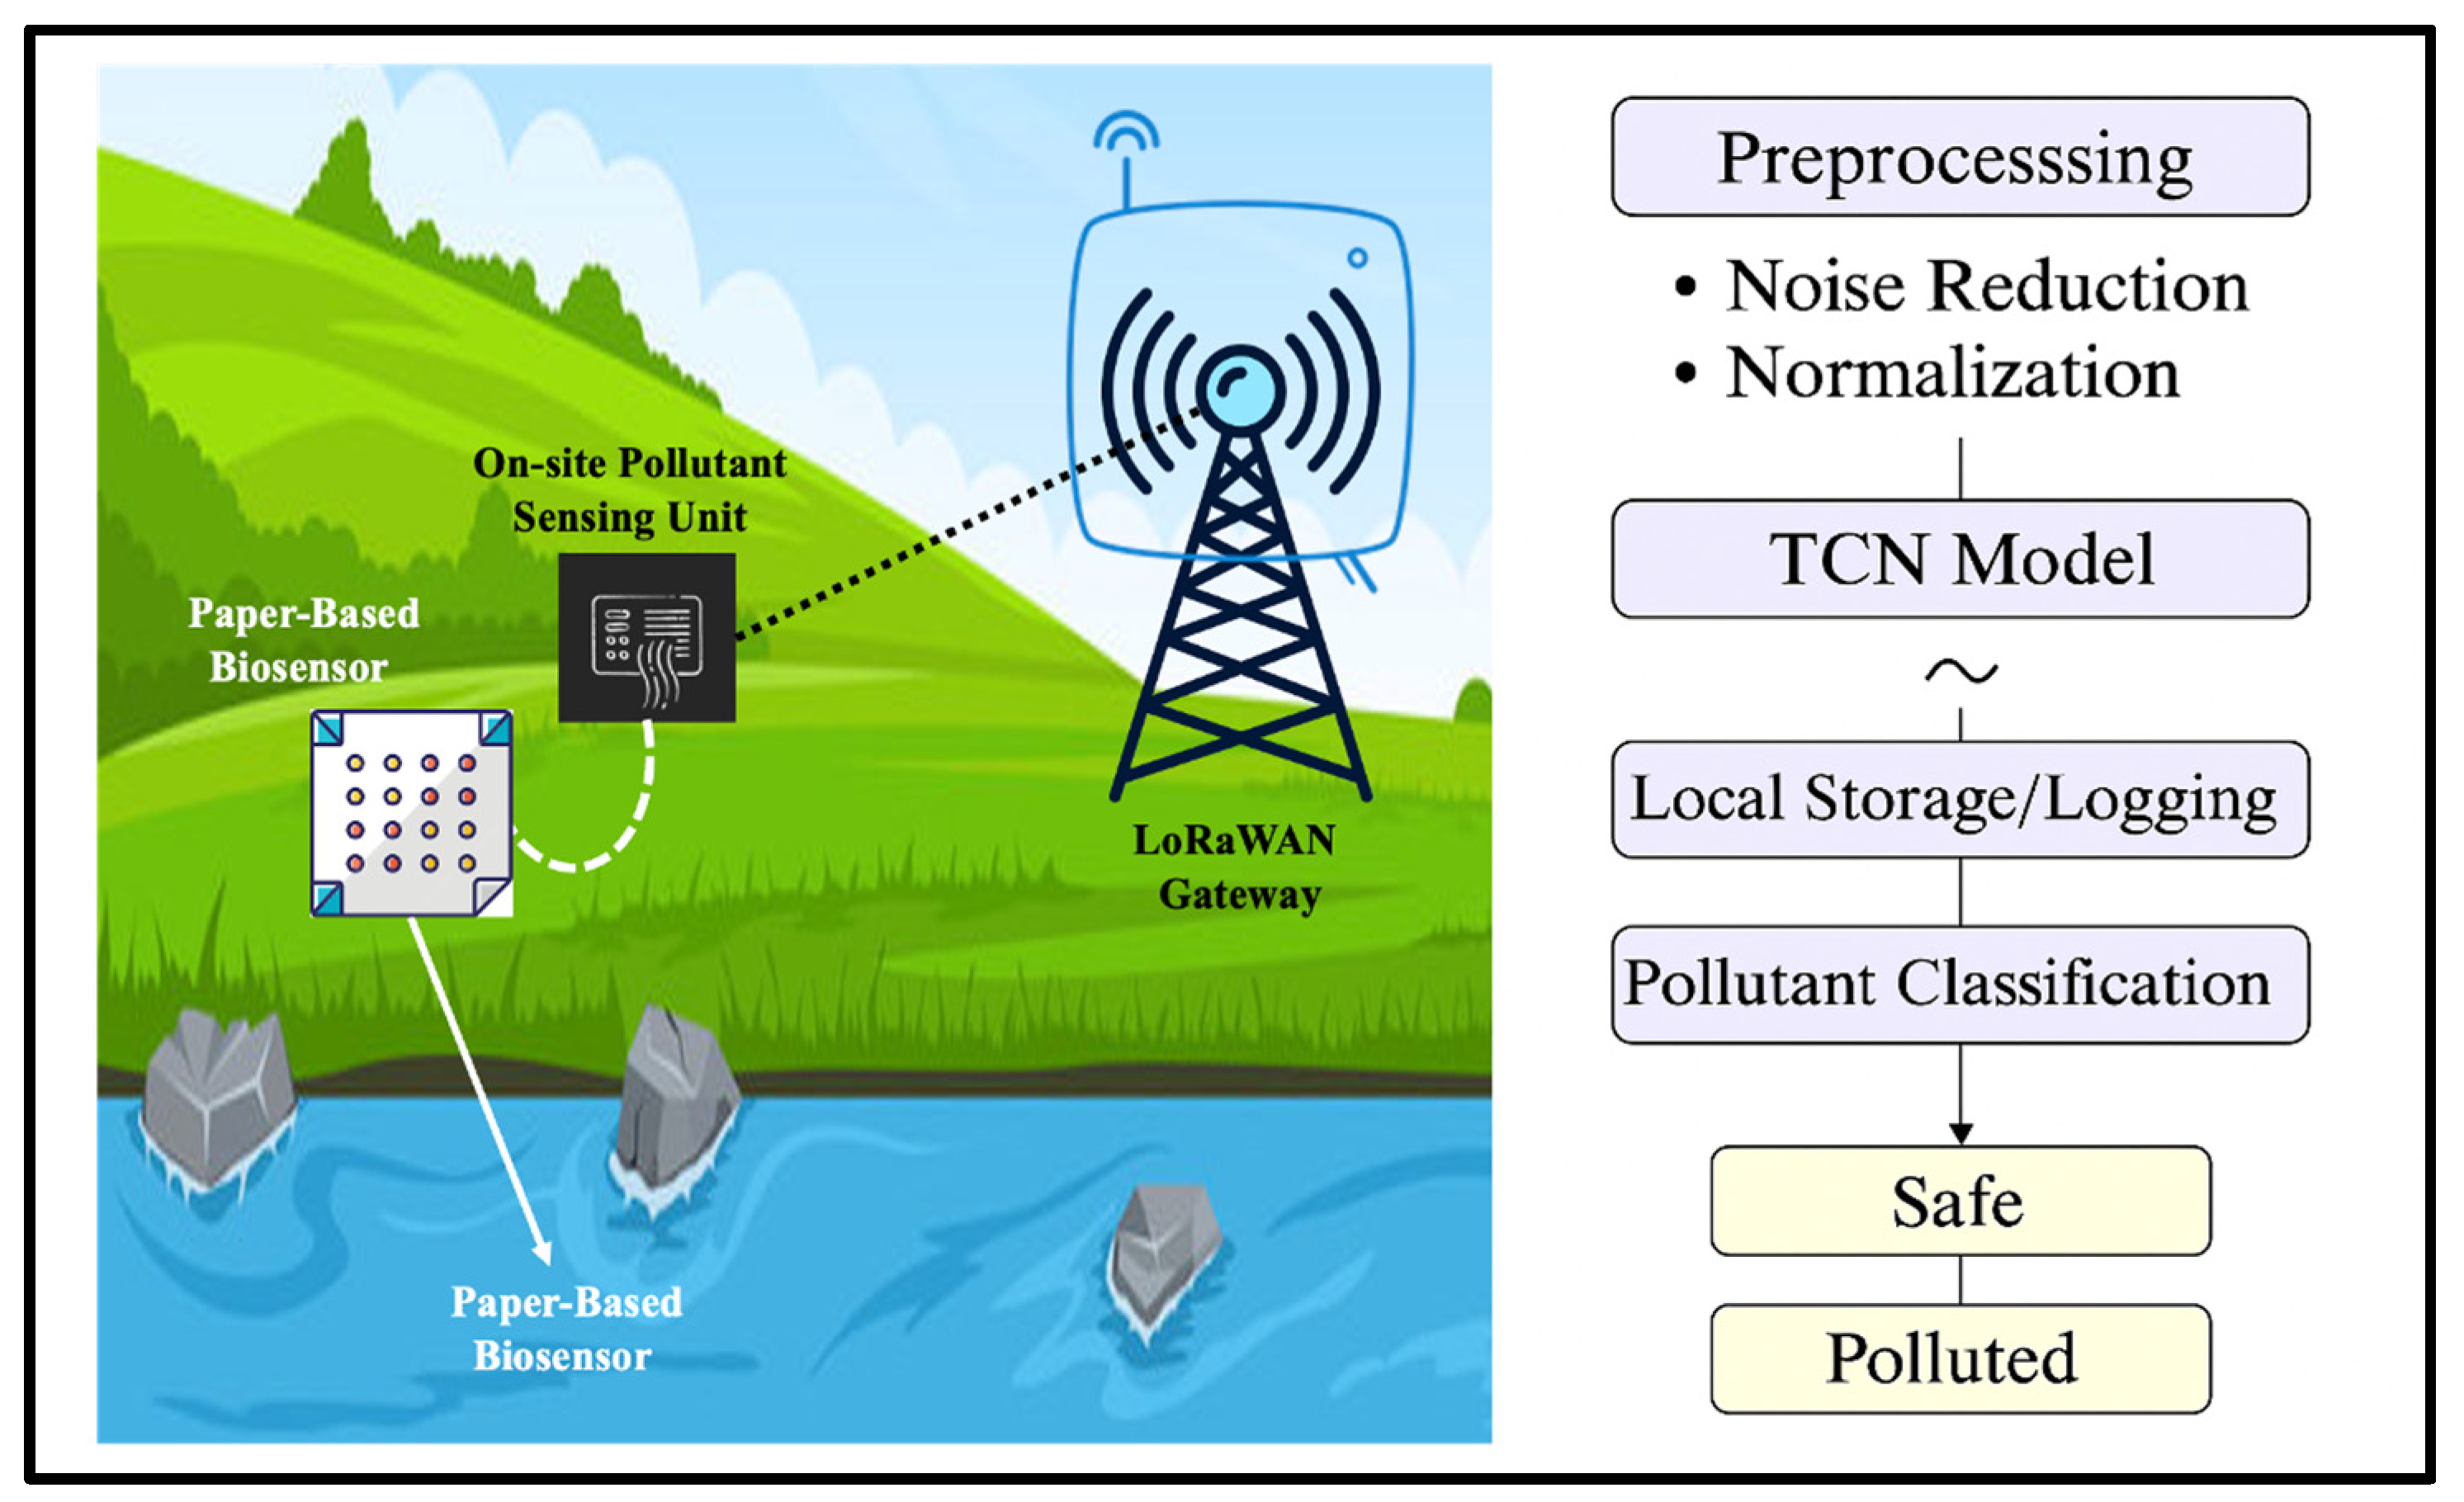
Freshwater pollution from industrial, agricultural, and urban sources continues to threaten human and environmental health [1,2]. Contaminants such as lead, arsenic, and nitrates cause serious health risks. Traditional manual sampling methods are slow and inefficient. Integrating edge IoT [3] with cyber–physical systems (CPSs) [4] and in situ paper-based biosensors, supported by LoRaWAN [5] and edge AI, enables real-time detection of contaminants. As shown in Figure 1, the proposed system incorporates sensing, edge processing, and feedback for efficient monitoring.
To overcome the limitations of prior work, this study proposes a new design of an edge IoT CPS that combines paper biosensors with the TCN algorithm to monitor water contamination in real time. The proposed system was tested in controlled environments that artificially varied the level of contamination to determine its performance.

2. Literature Survey

The latest developments in biosensing [6] and machine learning have improved the monitoring of the environment, agriculture, and health. Electrochemical and optical biosensors have become more sensitive with nano-materials such as graphene [7]. A microfluidics–spectroscopy-based hybrid system has been used in disease detection [8]. The interpretation of data can be facilitated by chemometric methods (PLSR and PCA) [9], and paper sensors were shown to be quite successful at detecting pesticides [10].
The emergence of a privacy-preserving deep neural network (DNN) for resilient anomaly detection in cyber–physical system (CPS)-enabled IoT networks [11] represents significant progress in the field of cybersecurity. As envisaged in this study, edge computing, machine learning models of decision trees, and deep Q-learning have been combined to carry out real-time analysis of traffic and intrusion detection [12]. Compared with the traditional attention models, including LSTM-based attention [13], this method is evaluated based on the superiority of its resilience to adversarial attacks, and the proposed model here performs comparatively better. The models used include long short-term memory (LSTM) networks [14] and convolutional neural networks (CNNs), which investigate various environmental influences, such as precipitation, soil moisture, elevation, etc. The deep learning-based approach [15] to predict the spatial and temporal variability in soybean yield is rooted in the consolidation of open-source data and a machine learning model for yield prediction. TCNs [16] with attention mechanisms are used by this model to filter temporal attributes in predicting respiratory motion. The traditional methods serve as a good point of comparison for the obvious benefits of these new technologies: accuracy, scalability, and flexibility. The latter is particularly suitable for the constantly changing diagnostics and network security environment of the modern world.

3. Methodology

This study utilized paper-based biosensors fabricated using cellulose strips embedded with immobilized enzyme complexes and chelating ligands tailored for the selective detection of arsenic, lead, and nitrate ions. Specifically, arsenite oxidase enzymes were employed to catalyze reactions with arsenic species, metallothionein-derived ligands facilitated binding with lead ions, and nitrate reductase enabled nitrate ion detection. These bio-recognition elements were covalently immobilized on designated reagent zones of the strip, where exposure to contaminated water initiated selective biochemical reactions, producing distinct colorimetric responses proportional to the contaminant levels. The edge IoT architecture and LoRaWAN modules were implemented with these biosensors in order to provide continuous real-time information concerning water quality under field-like conditions. Upon the flow of the contaminated water through the porous matrix by capillary action, chemical reactions produce a change in colorimetric (an observable absorbance shift) or electrochemical signals proportional to the concentration of the pollutant. The detection limits are 1 to 5 ppb, with a 10 to 20 seconds response time per strip. An IO-T module with reception intensity readings at 1 Hz, with the help of a miniaturized optical scanner, is applied that converts data into digital signals. A microfluidic flow-through cartridge was designed to sequentially introduce fresh sensor strips to the sensor array at user-set intervals, which allows the permanent observation of the sensor. The calibration feedback opposes this drift, and the long-term accuracy is maintained. In this configuration, a contaminant signal stream that is stable and real-time is fed to the edge IoT system so that analysis can be performed with the TCN. The proposed real-time water contamination monitoring system utilizes a sequence of hardware and computational steps, which contribute to the actual, fast, and straightforward detection of pollutants within an edge IoT-enabled CPS. To ensure consistency, raw sensor readings S =   S = { s 1 , s 2 , , s T } are passed through a sensor calibration function C s t , normalized using min–max scaling for a bounded feature range, as shown in Equation (1).
x t = s t min S max S min S t 1 , T  
This retains the numerical stability of the sequence as a neural network’s input. Packet transmission efficiency is evaluated in accordance with Equation (2).
P L R d = P l o s t d P s e n t d × 100 %  
where d is the separation from the transmission source and this distance. A moving average smoothing filter is used on the raw data to minimize noise in the noise reduction module, as indicated in Equation (3):
x t ~ = 1 k i = 0 k 1 x t i , k = 3  
The elimination of high-frequency noise from this phase enhances signal clarity. For each layer l , the output y t l is calculated as in Equation (4):
y t l = i = 0 k 1 w i l x t d i l 1
where w i are the kernel weights, and d is the dilation factor. The TCN outputs a probability score y ^ t 0,1 , indicating the presence of contamination. The system is trained using binary cross-entropy loss as in Equation (5):
y , y ^ = y log y ^ + 1 y log 1 y ^
where y { 0,1 } is the ground-truth label (safe or polluted).
The TCN model comprises a causal convolutional layer with progressively larger-dilation factors to measure long-range temporal dependency. Every layer consists of ReLU and residues in its connections in order to be stable. The layer-wise, i.e., in-depth, description of kernel size, dilation, filters, and activation is captured in Table 1. Figure 2 shows the process of the entire system.
The entire system was installed on a Raspberry Pi 4 Model B, which has a 1.5 GHz quad-core CPU based on an ARM Cortex-A72, and 4 GB of RAM. In the cloud-side evaluation, we deployed an LSTM model on an AWS EC2 with 2 vCPUs and 8 GB of RAM. Data collection with a biosensor was carried out at 1 Hz, with the inference being performed either in real time or on an event basis. Latency was taken as the time between raw sensor information and the final contamination classification. The TCN system demonstrated an average latency of 26.3 ± 1.2 ms, whereas the cloud LSTM model produced a value of 42.4 ± 1.6 ms, leading to a reduction in latency of 38% that was proven to be correct.
The experimentation was carried out by using the developed CPS in controlled environments, whereby the pollutant levels were manipulated to represent various events of contamination. The data were gathered in various sessions with varied concentrations of arsenic, lead, and nitrate. A hold-out validation strategy was used to ensure the best generalization capacity and that evidence of data leakage was avoided. The data were partitioned into 70 percent training, 15 percent validation, and 15 percent test data, with the stratification carried out between contamination event types to maintain temporal consistency. All of the contamination was restricted to only one split (train/val/test) to avoid duplicate time windows; hence, the integrity of the evaluation remained intact. All models were preserved in the chronological order of samples by using time-ordered samples. This stratification guaranteed the generalization capacity of the model would be measured on totally unobserved contamination configurations, like those found in an actual deployment environment.

4. Experimental Results and Discussion

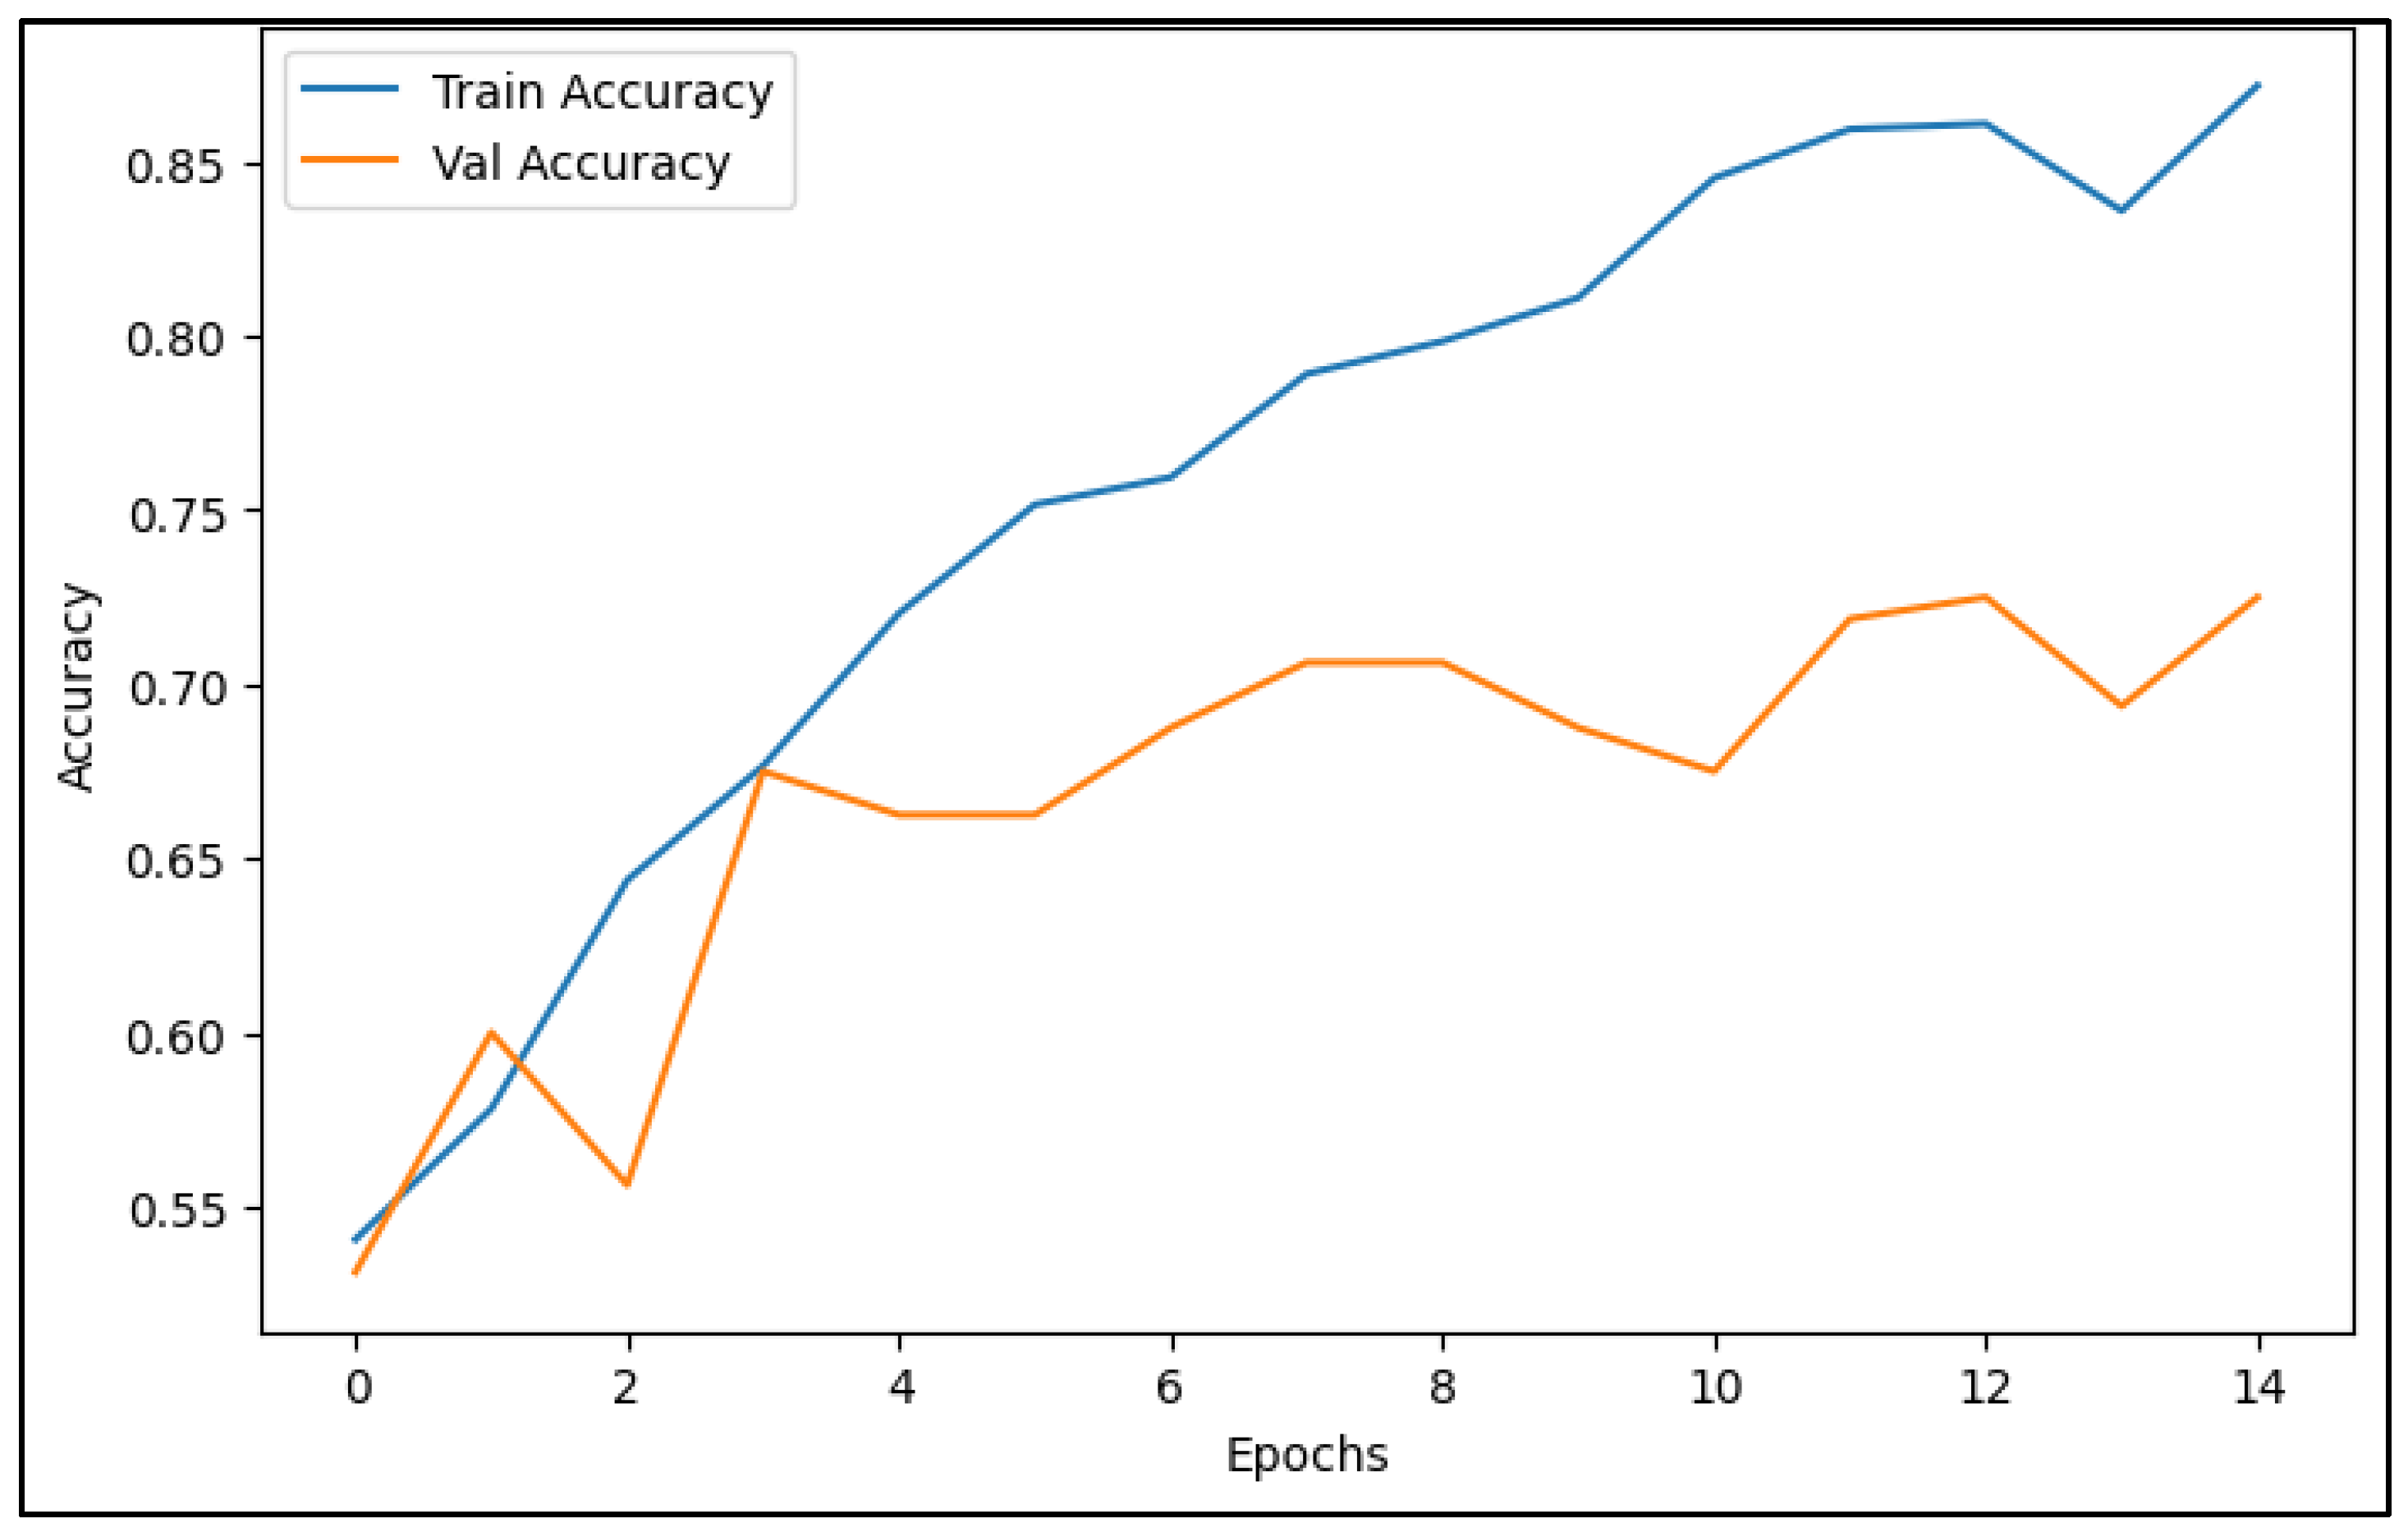
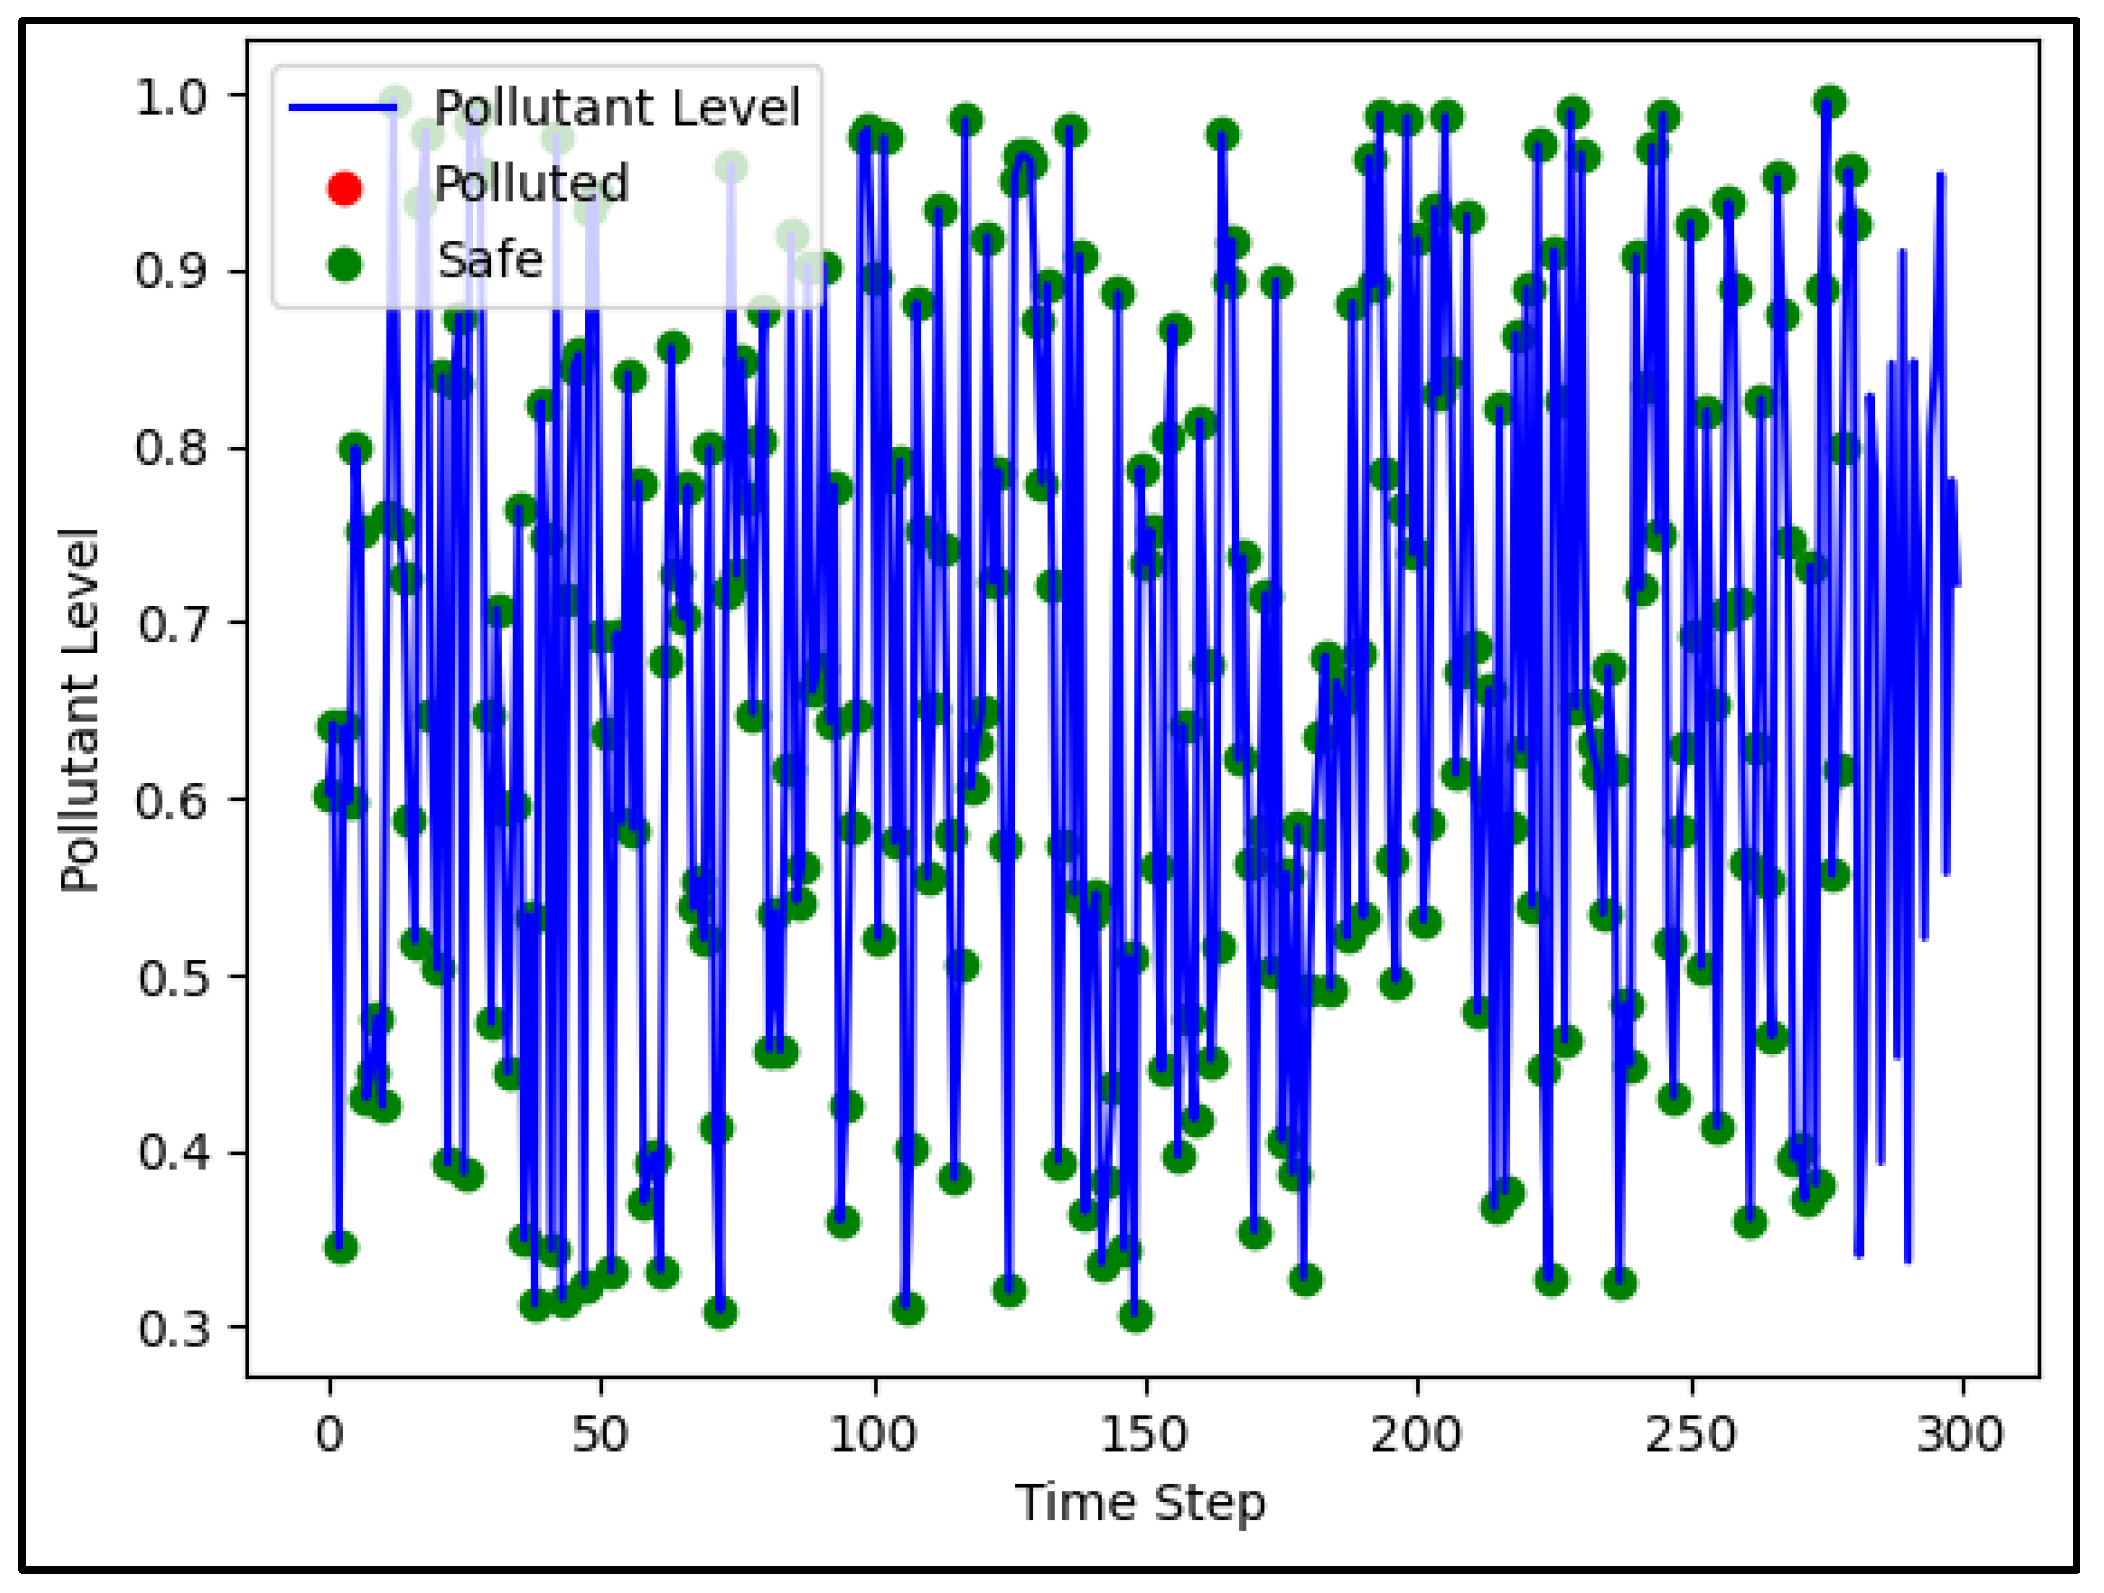
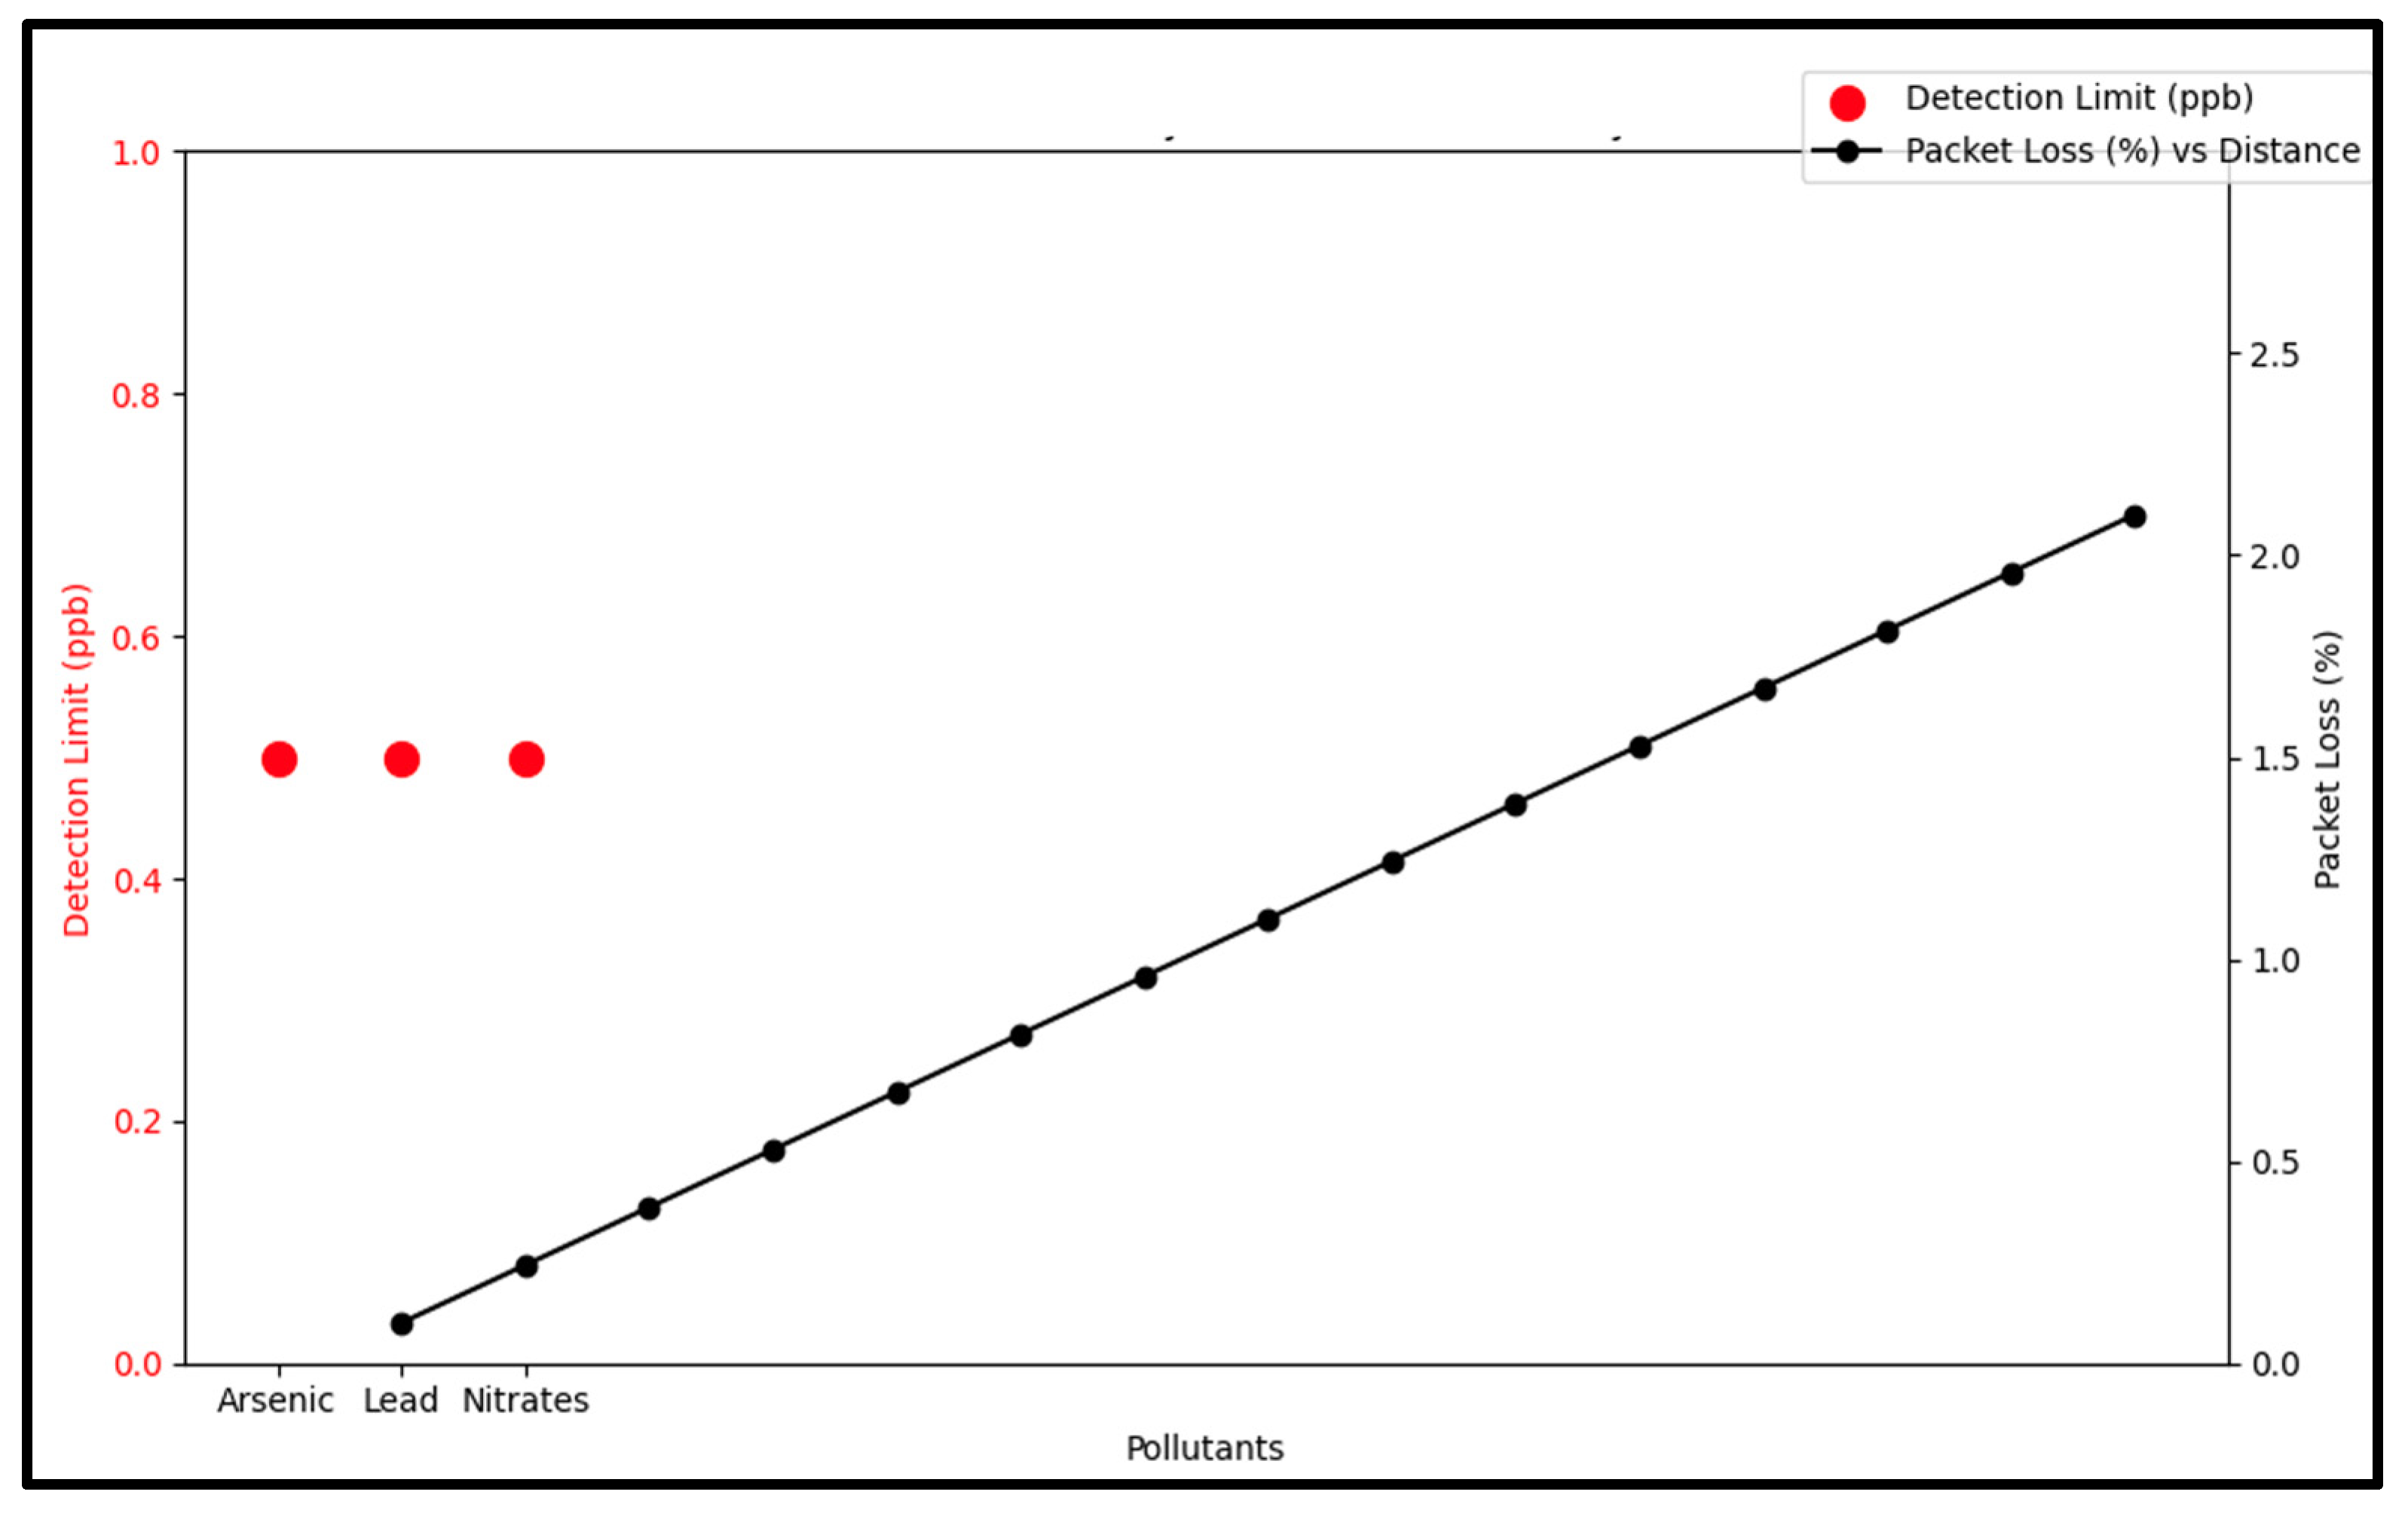
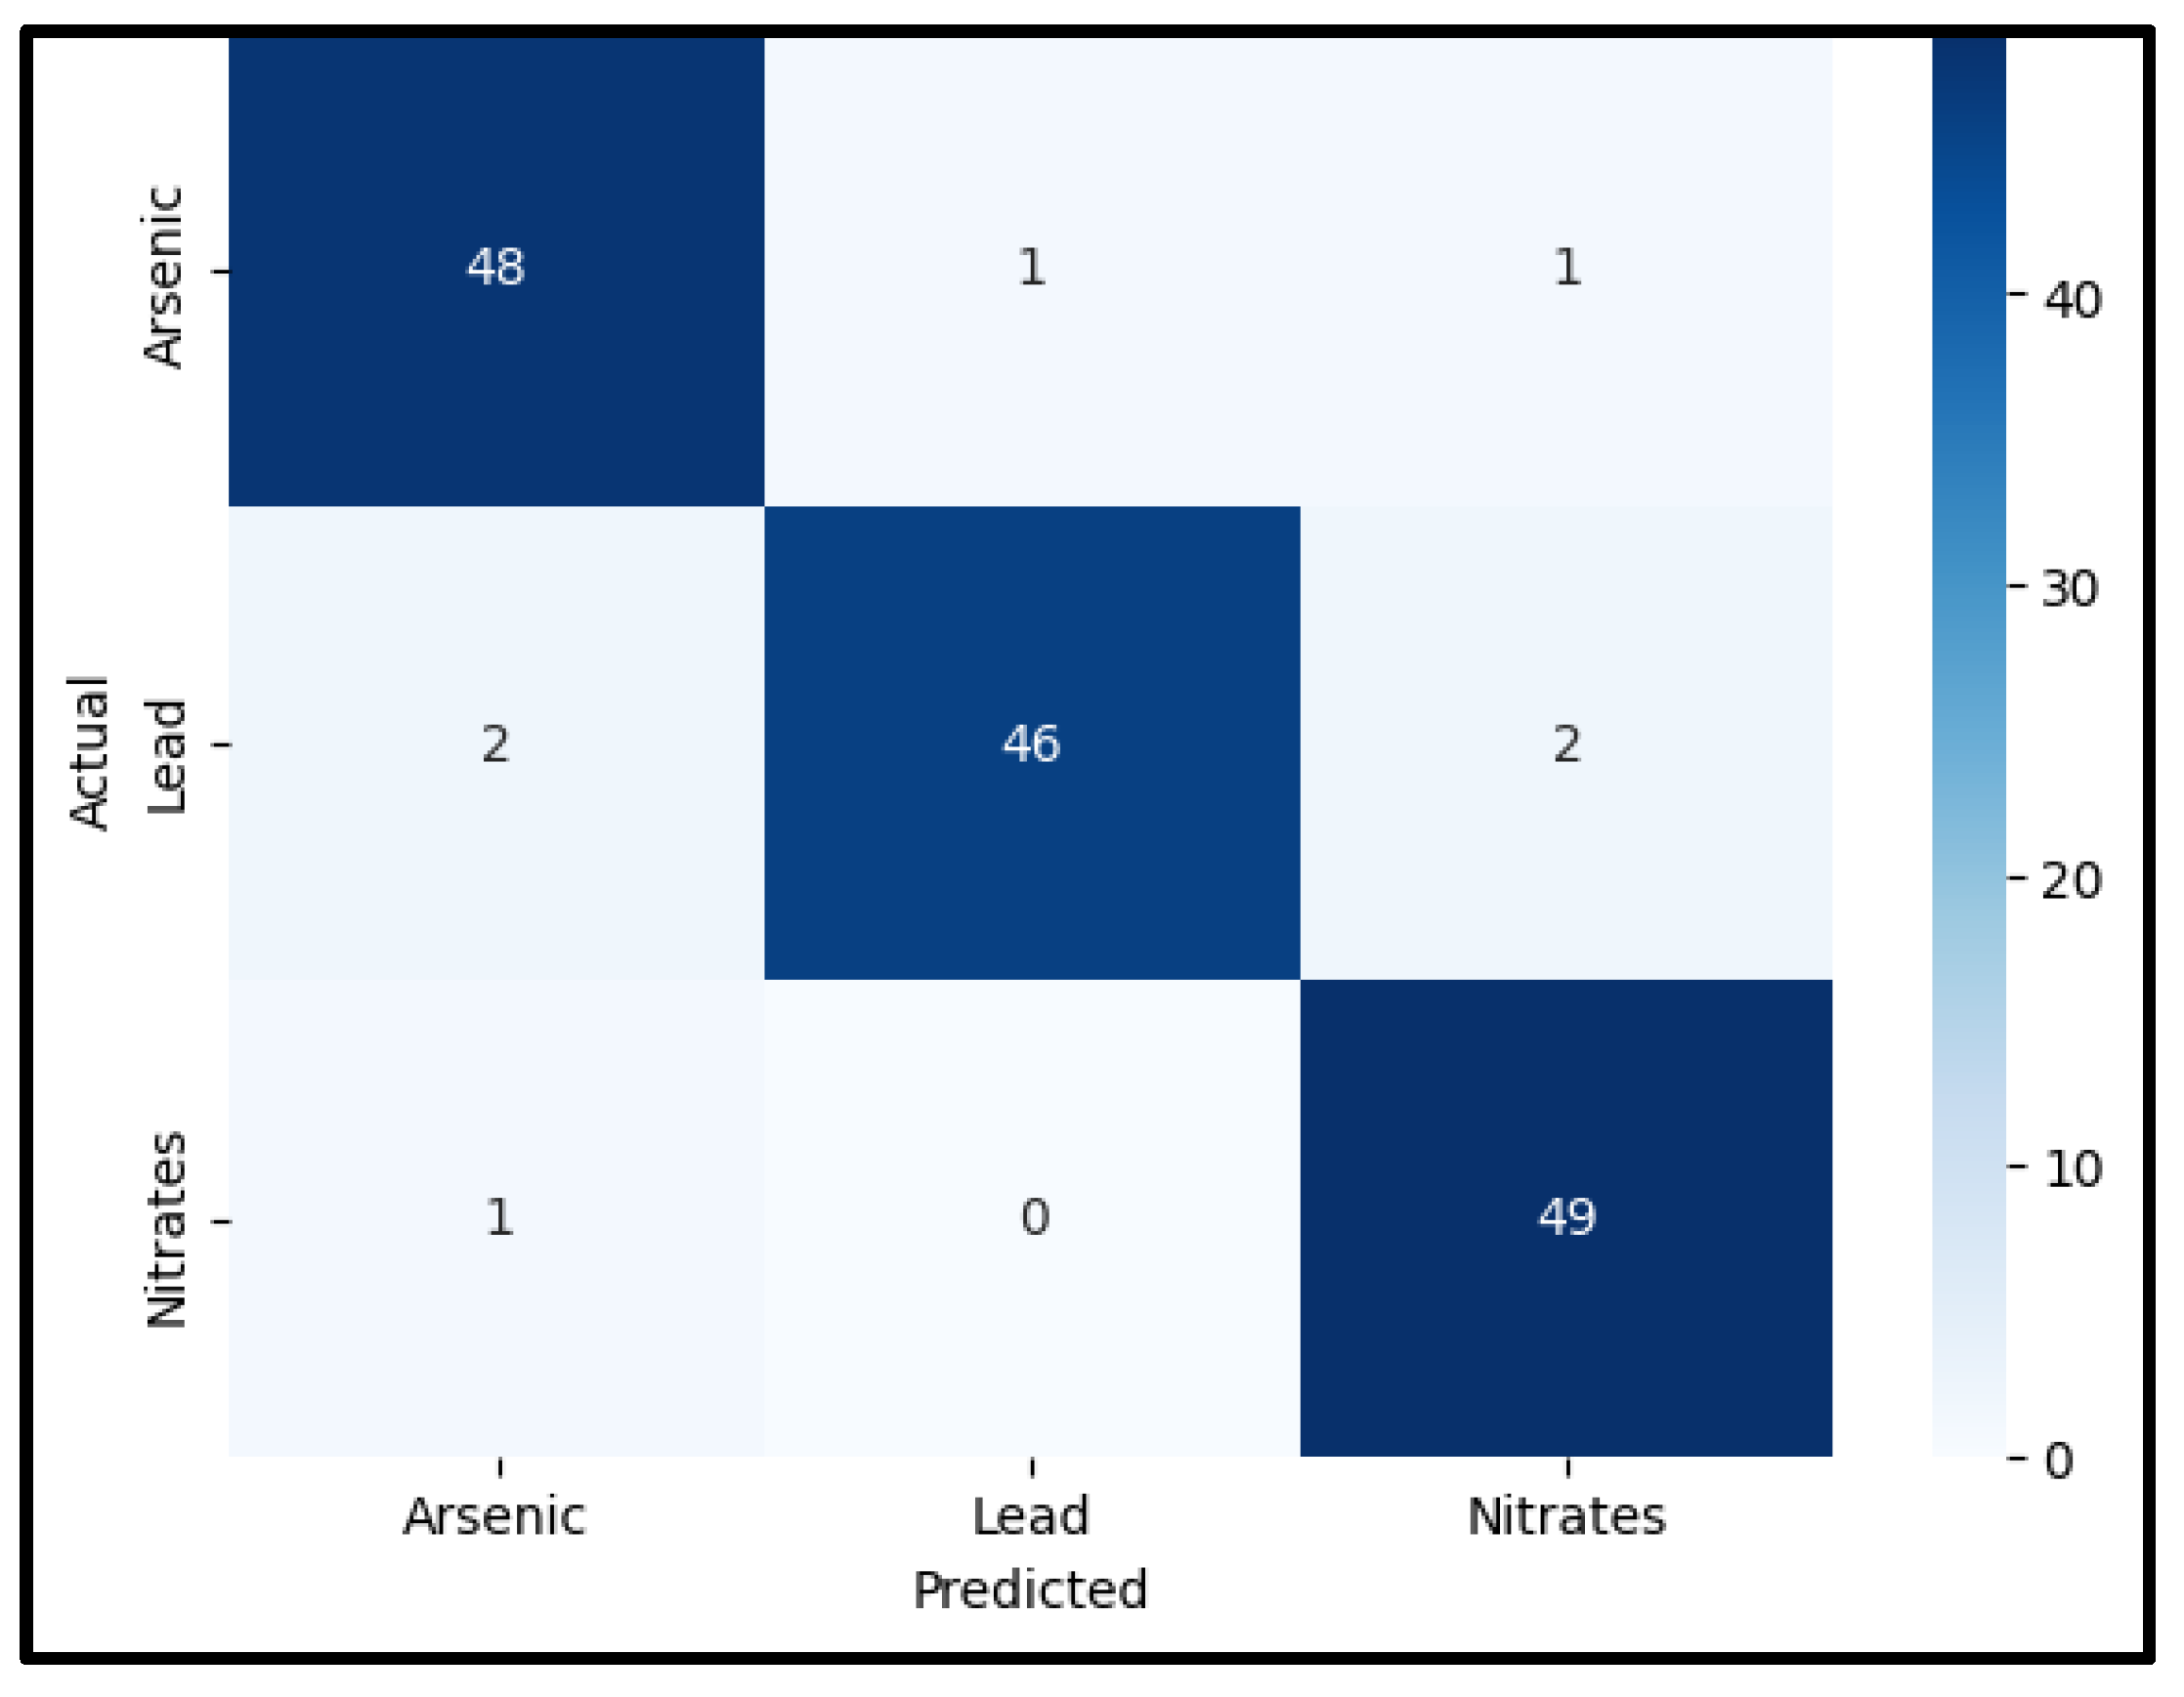
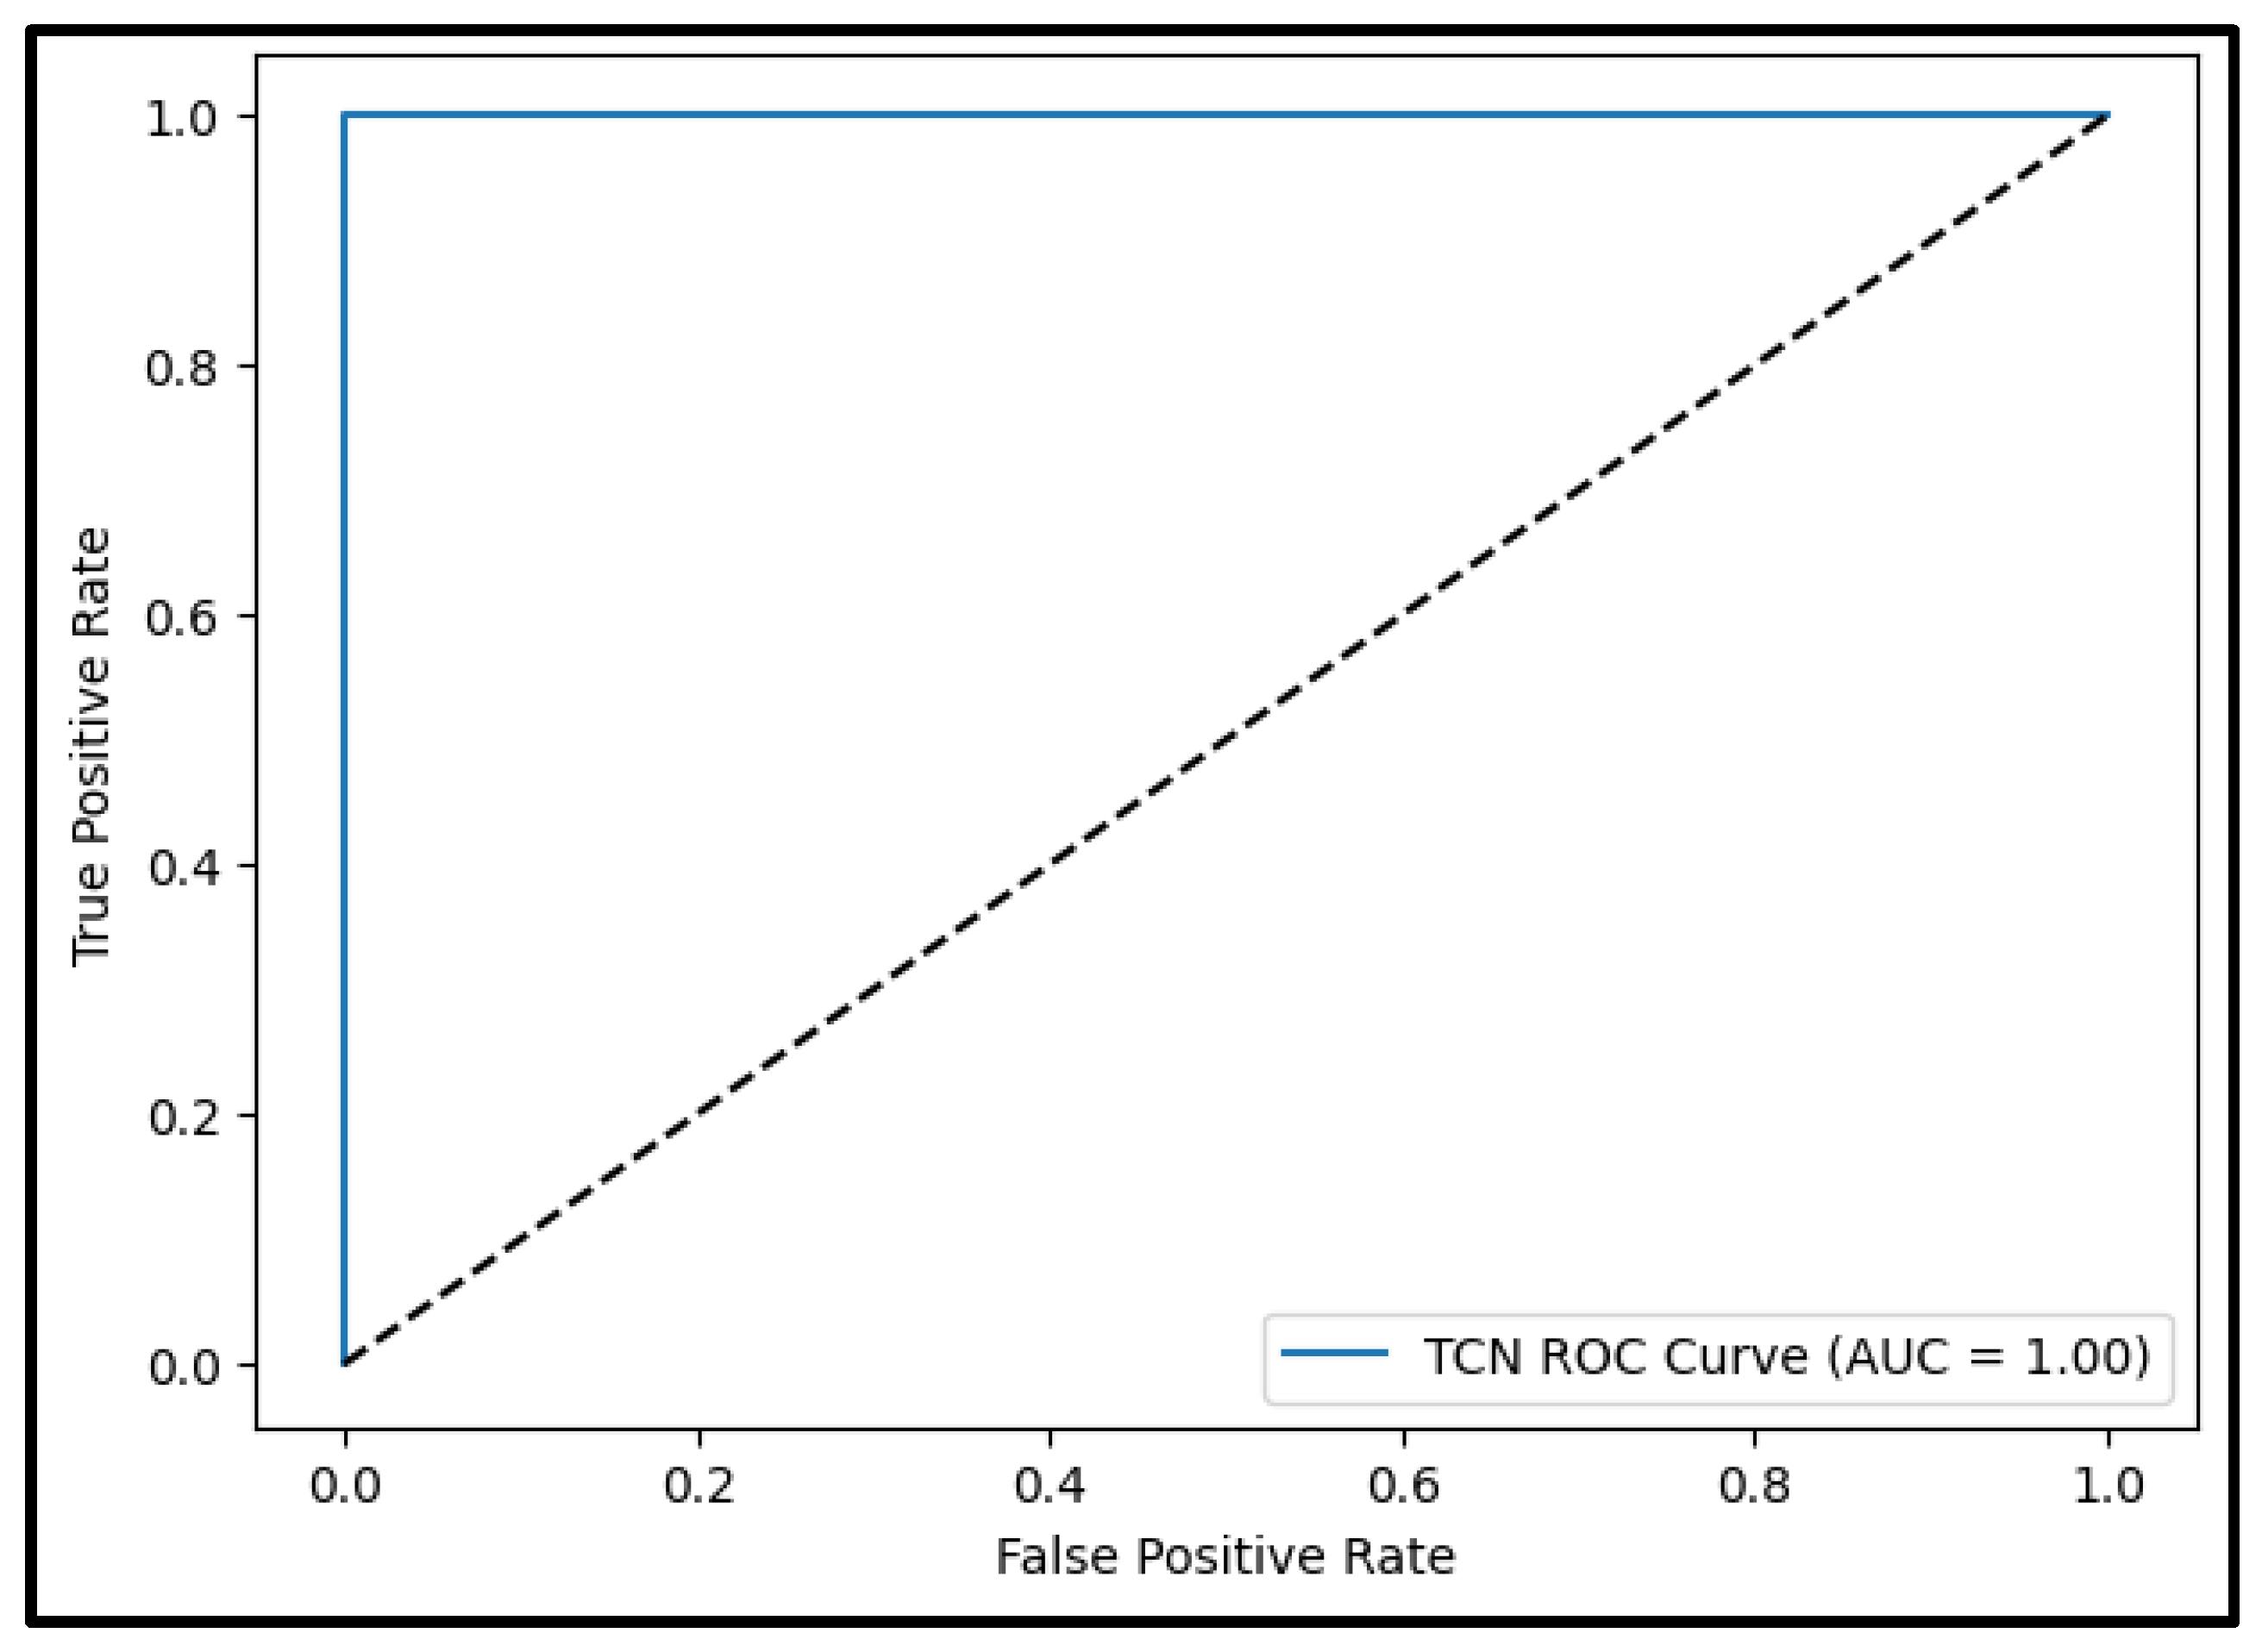
The observations from experimentation demonstrated that the edge IoT-enabled cyber–physical system is an outstanding system for real-time water contamination detection, using paper-based biosensors and a TCN model. A 98.7% detection accuracy of the proposed system was displayed, which compared favorably with the 92.4% obtained by the LSTM baseline model. Figure 3 illustrates the 15-epoch training history of a TCN model by presenting both the training and validation accuracy. Figure 4 presents a live-monitoring plot of pollutant readings that were taken at 300 consecutive time intervals. The sensitivity of the biosensor and LoRaWAN reliability are shown in combination in the dual-axis plot in Figure 5. The confusion matrix in Figure 6 visualizes the pollutant classification results for arsenic, lead, and nitrates. The strong diagonal dominance reflects the model’s robustness in accurately distinguishing between different pollutants. The ROC curve in Figure 7 shows the TCN model’s performance in classifying pollutants, delivering an AUC of 1.00, which means it can perfectly separate positive and negative cases. According to Figure 8, the TCN model achieved an AUC of 1.00 in pollutant classification, showing complete separation between polluted and clean samples.
To statistically prove the fact that the TCN model results in increased performance compared with the LSTM baseline, we performed a two-tailed Student’s t-test of accuracy values found in 10 experimental trials with distinct seeds and data partition choice. The results provided a p-value of 0.0018, which was much lower than the traditional level of significance (0.05), proving the enhancement to be statistically significant. Moreover, standard deviations were provided with all performance scores, such as accuracy and latency, to indicate the variation found across runs and are tabulated in Table 2.
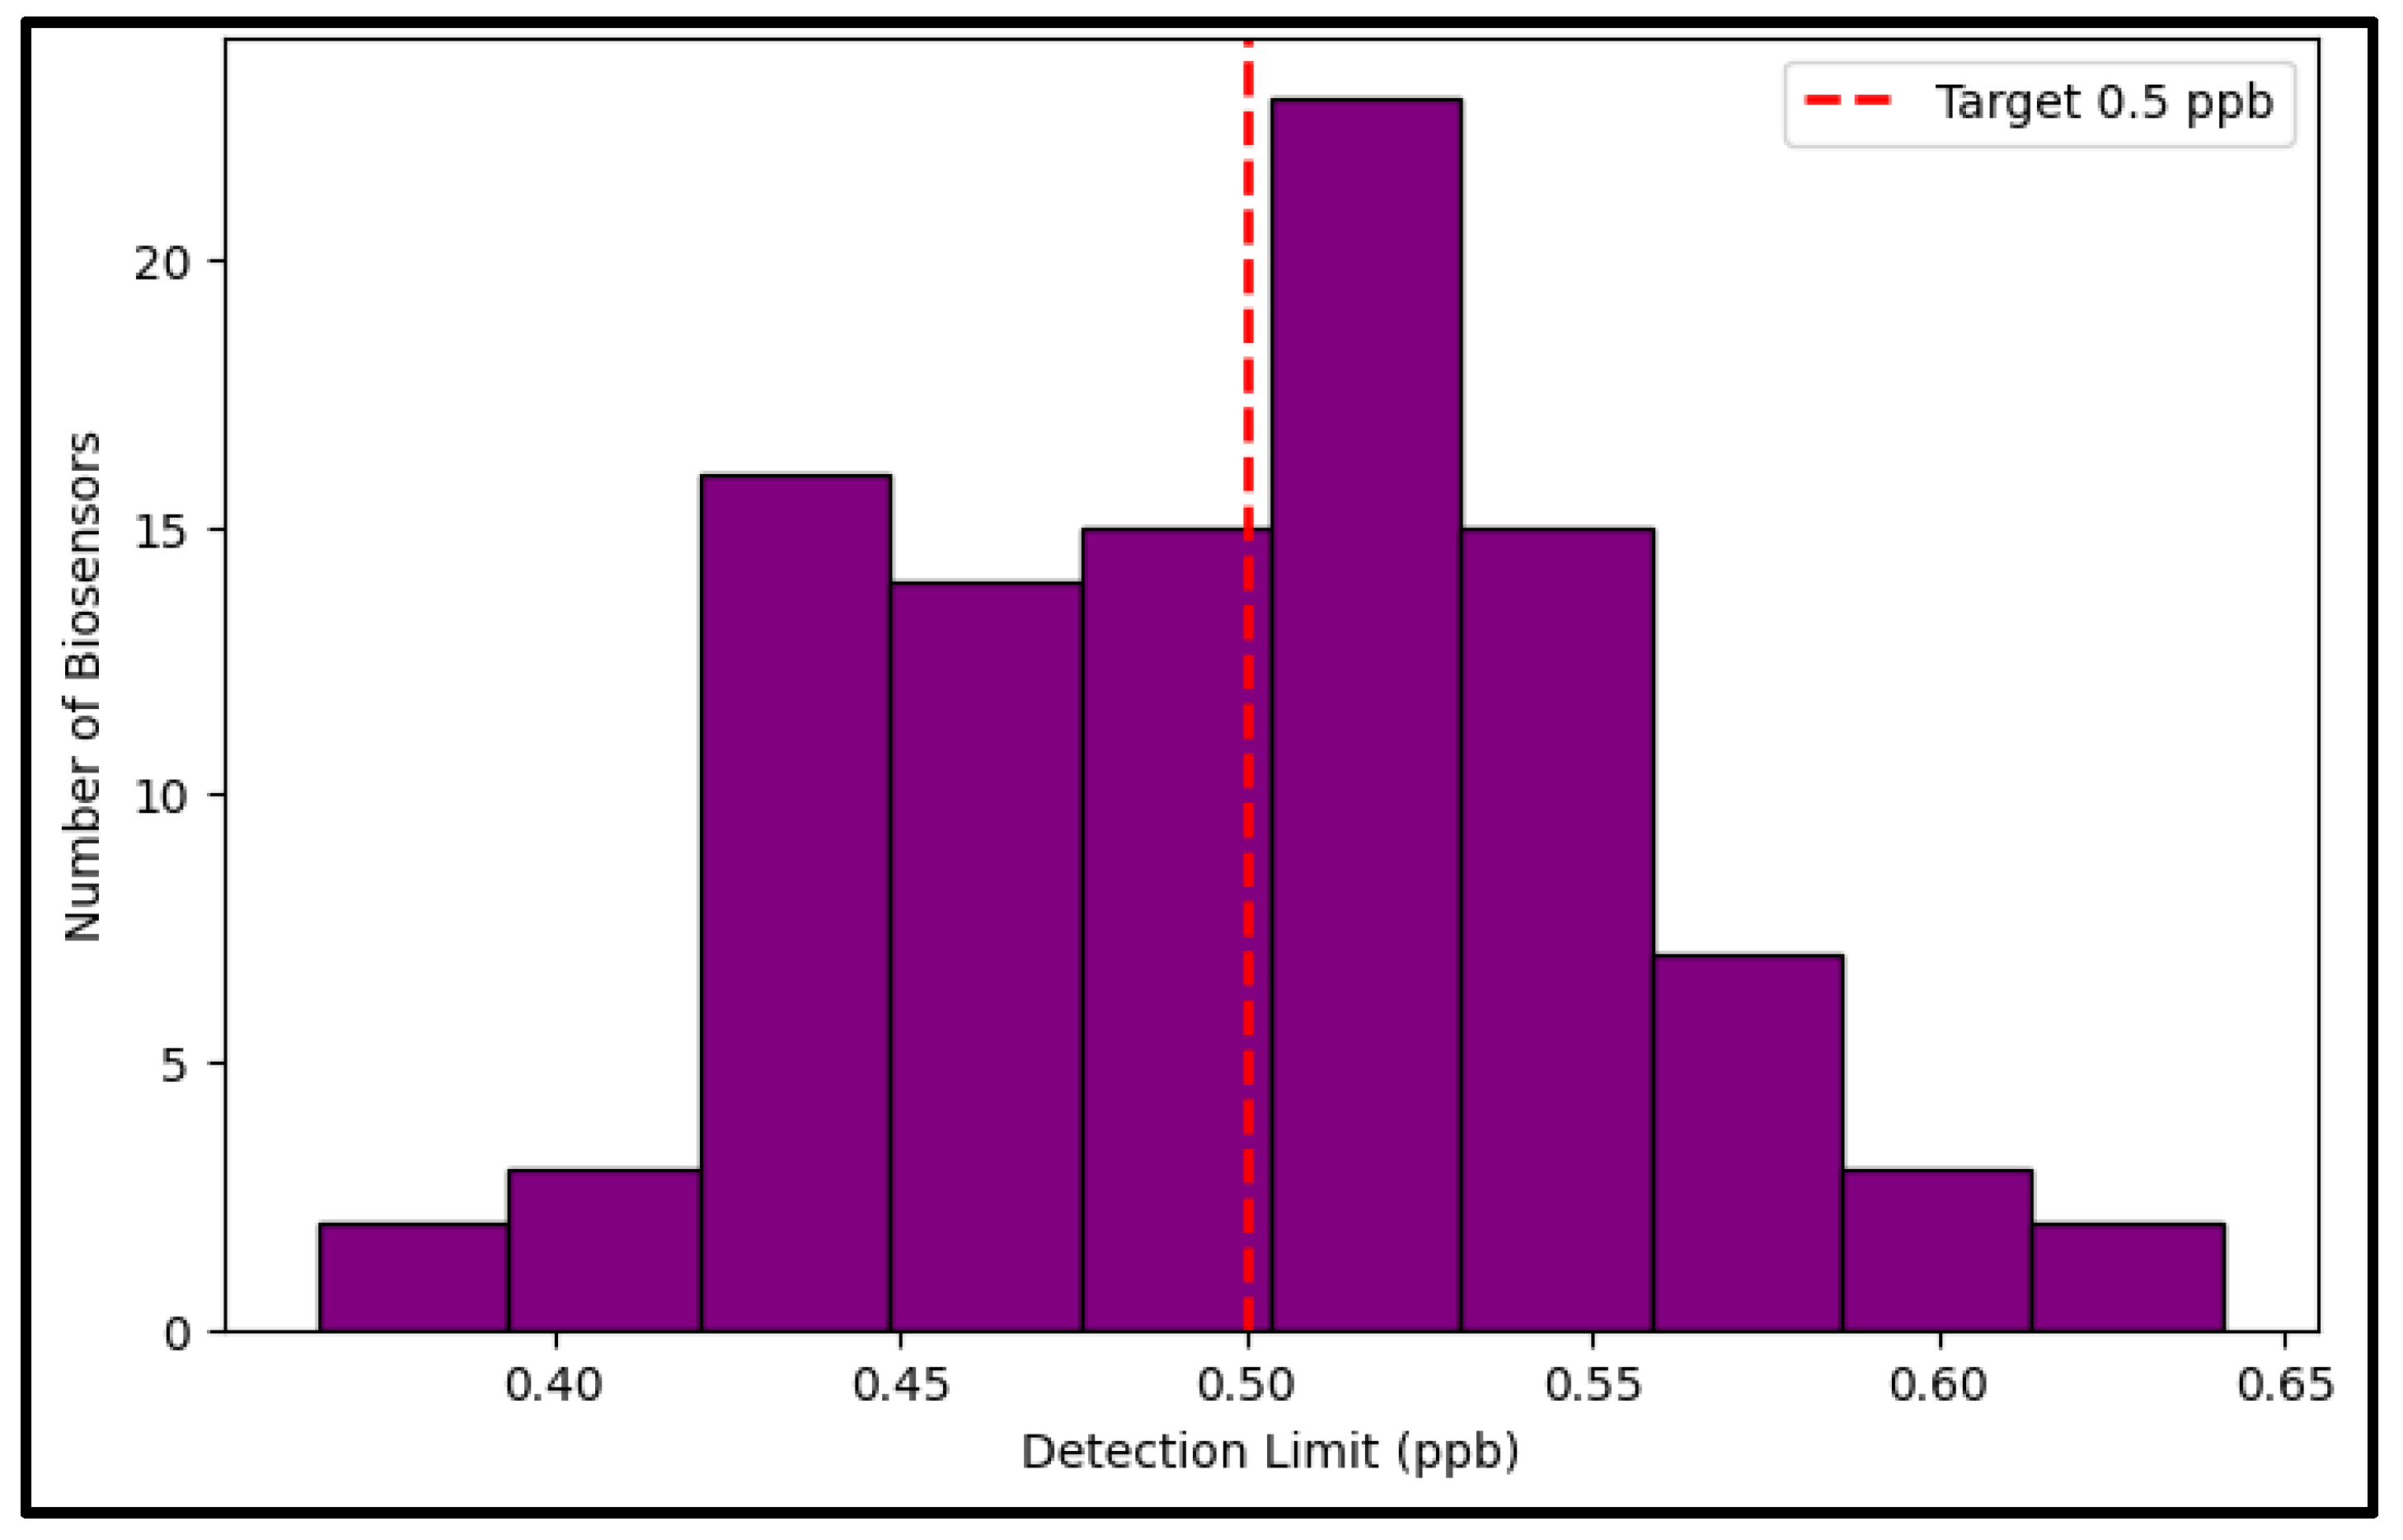
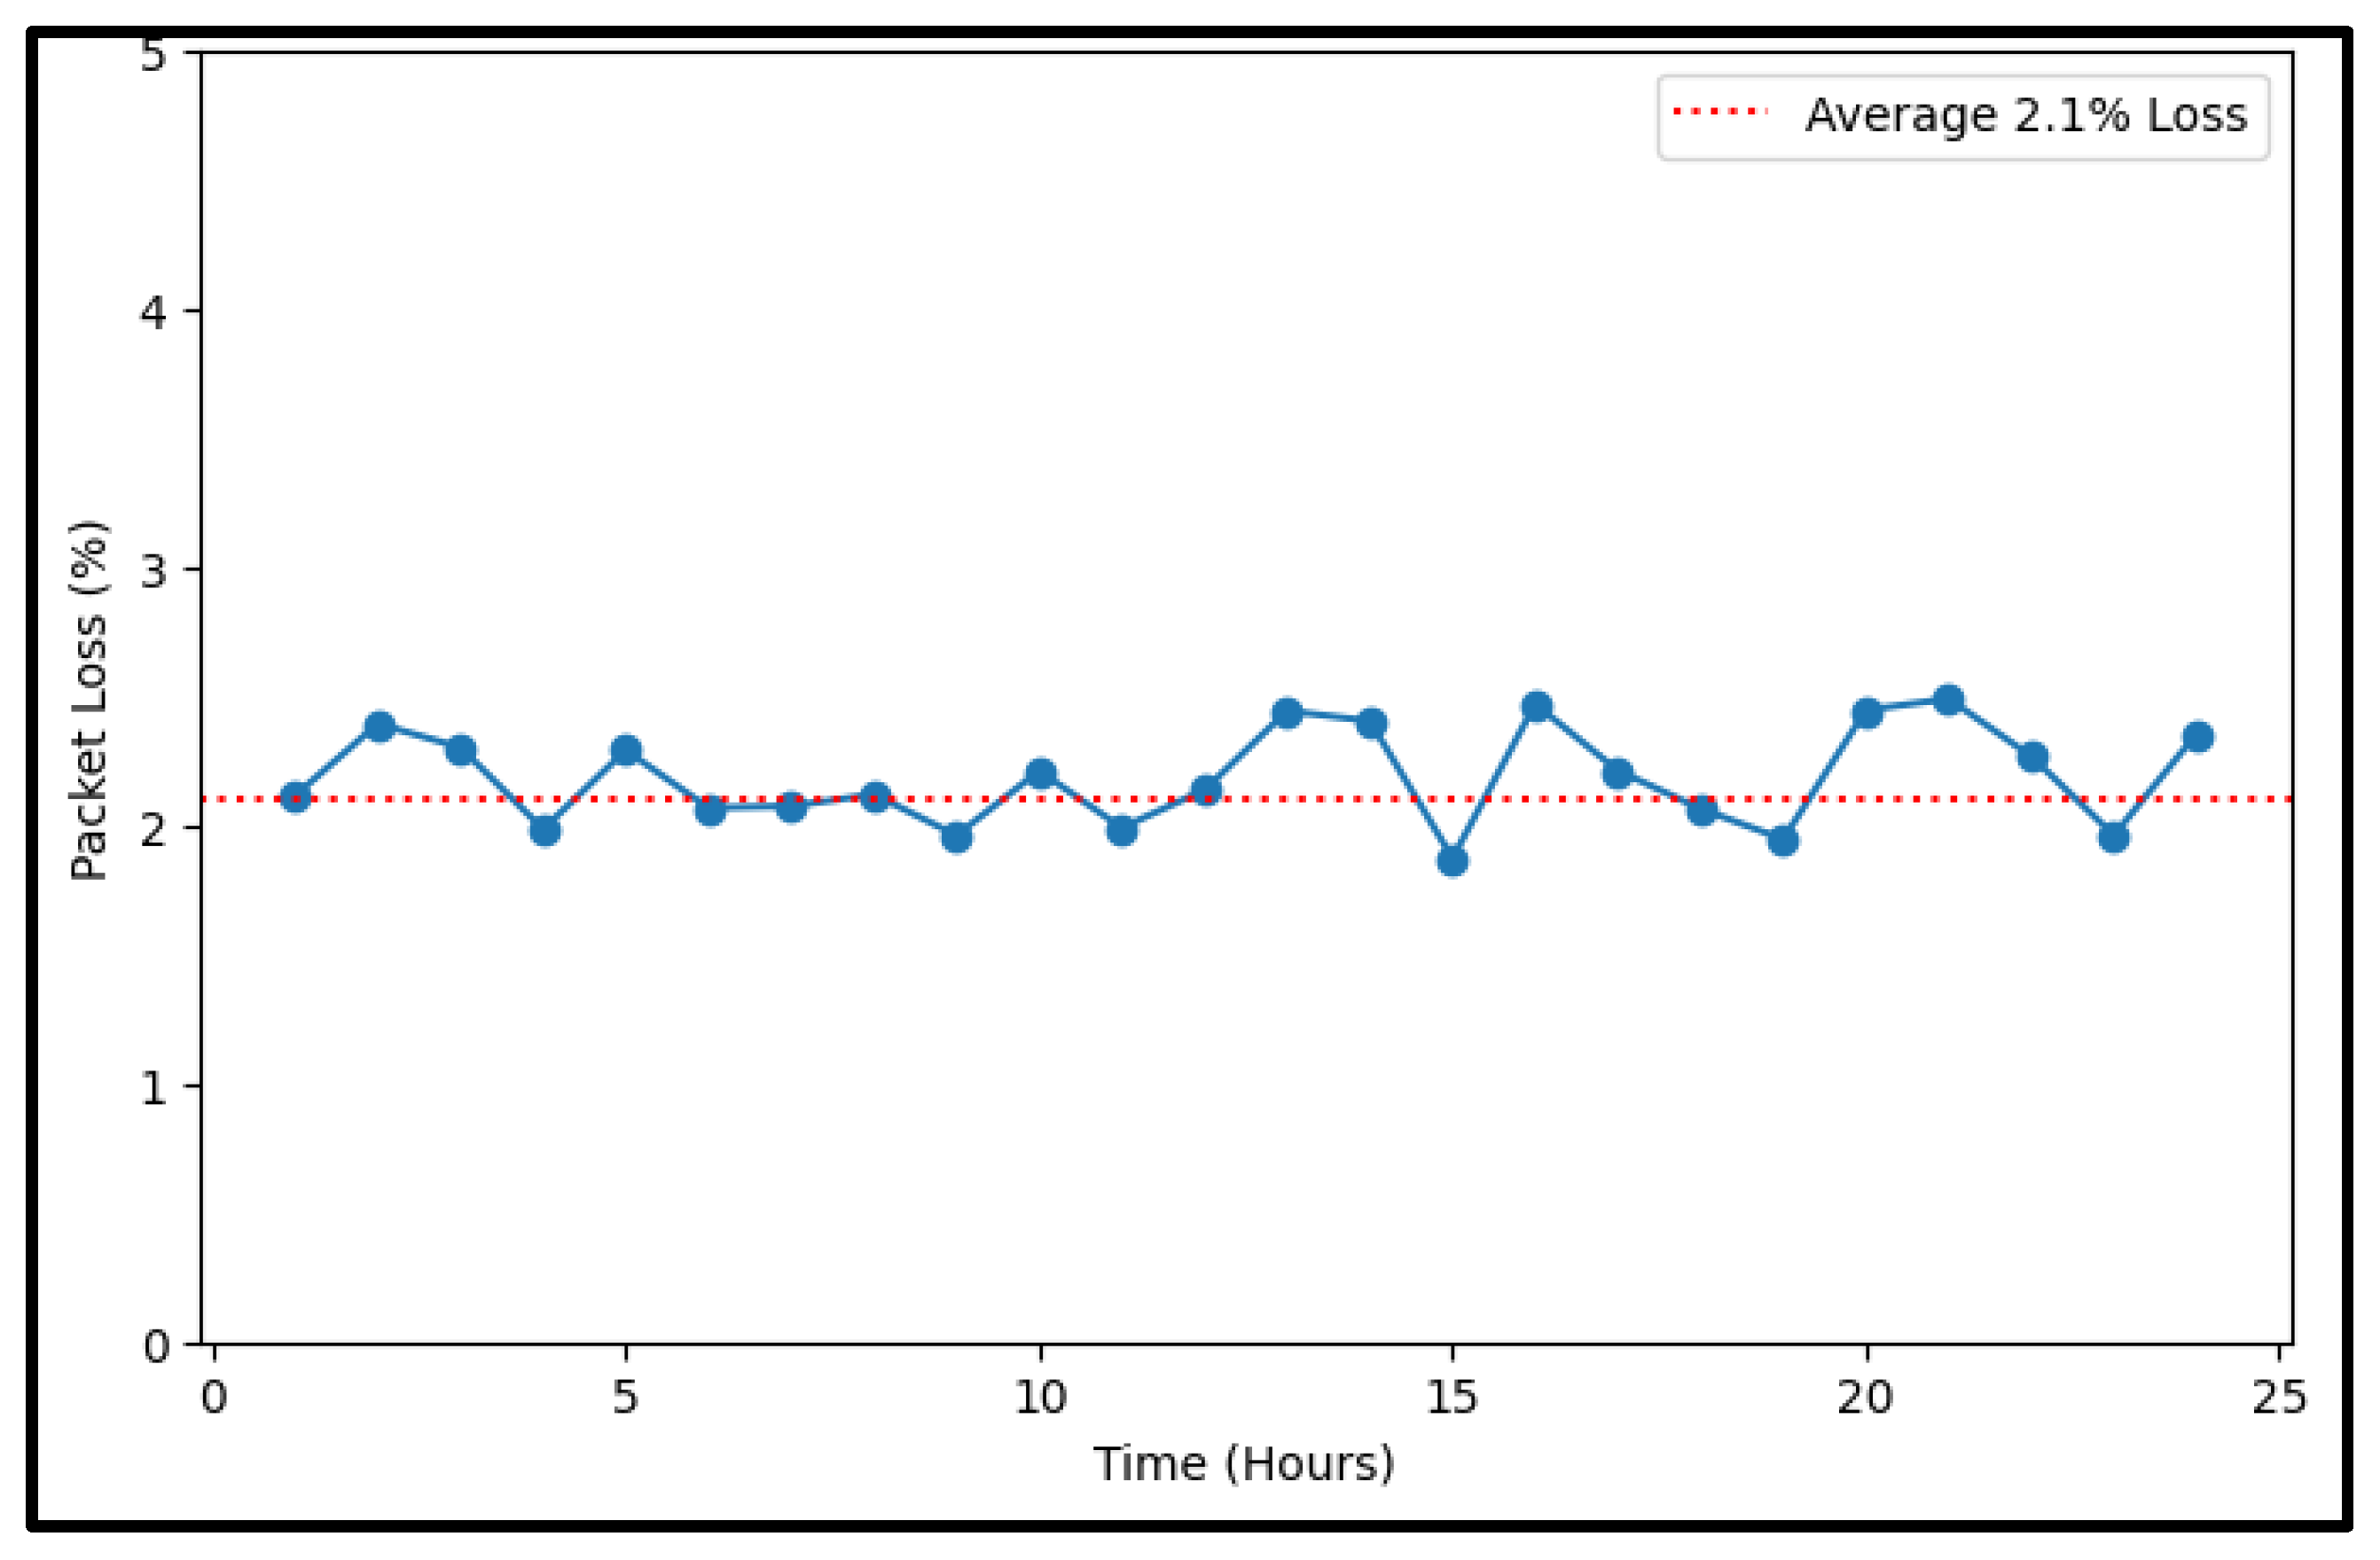
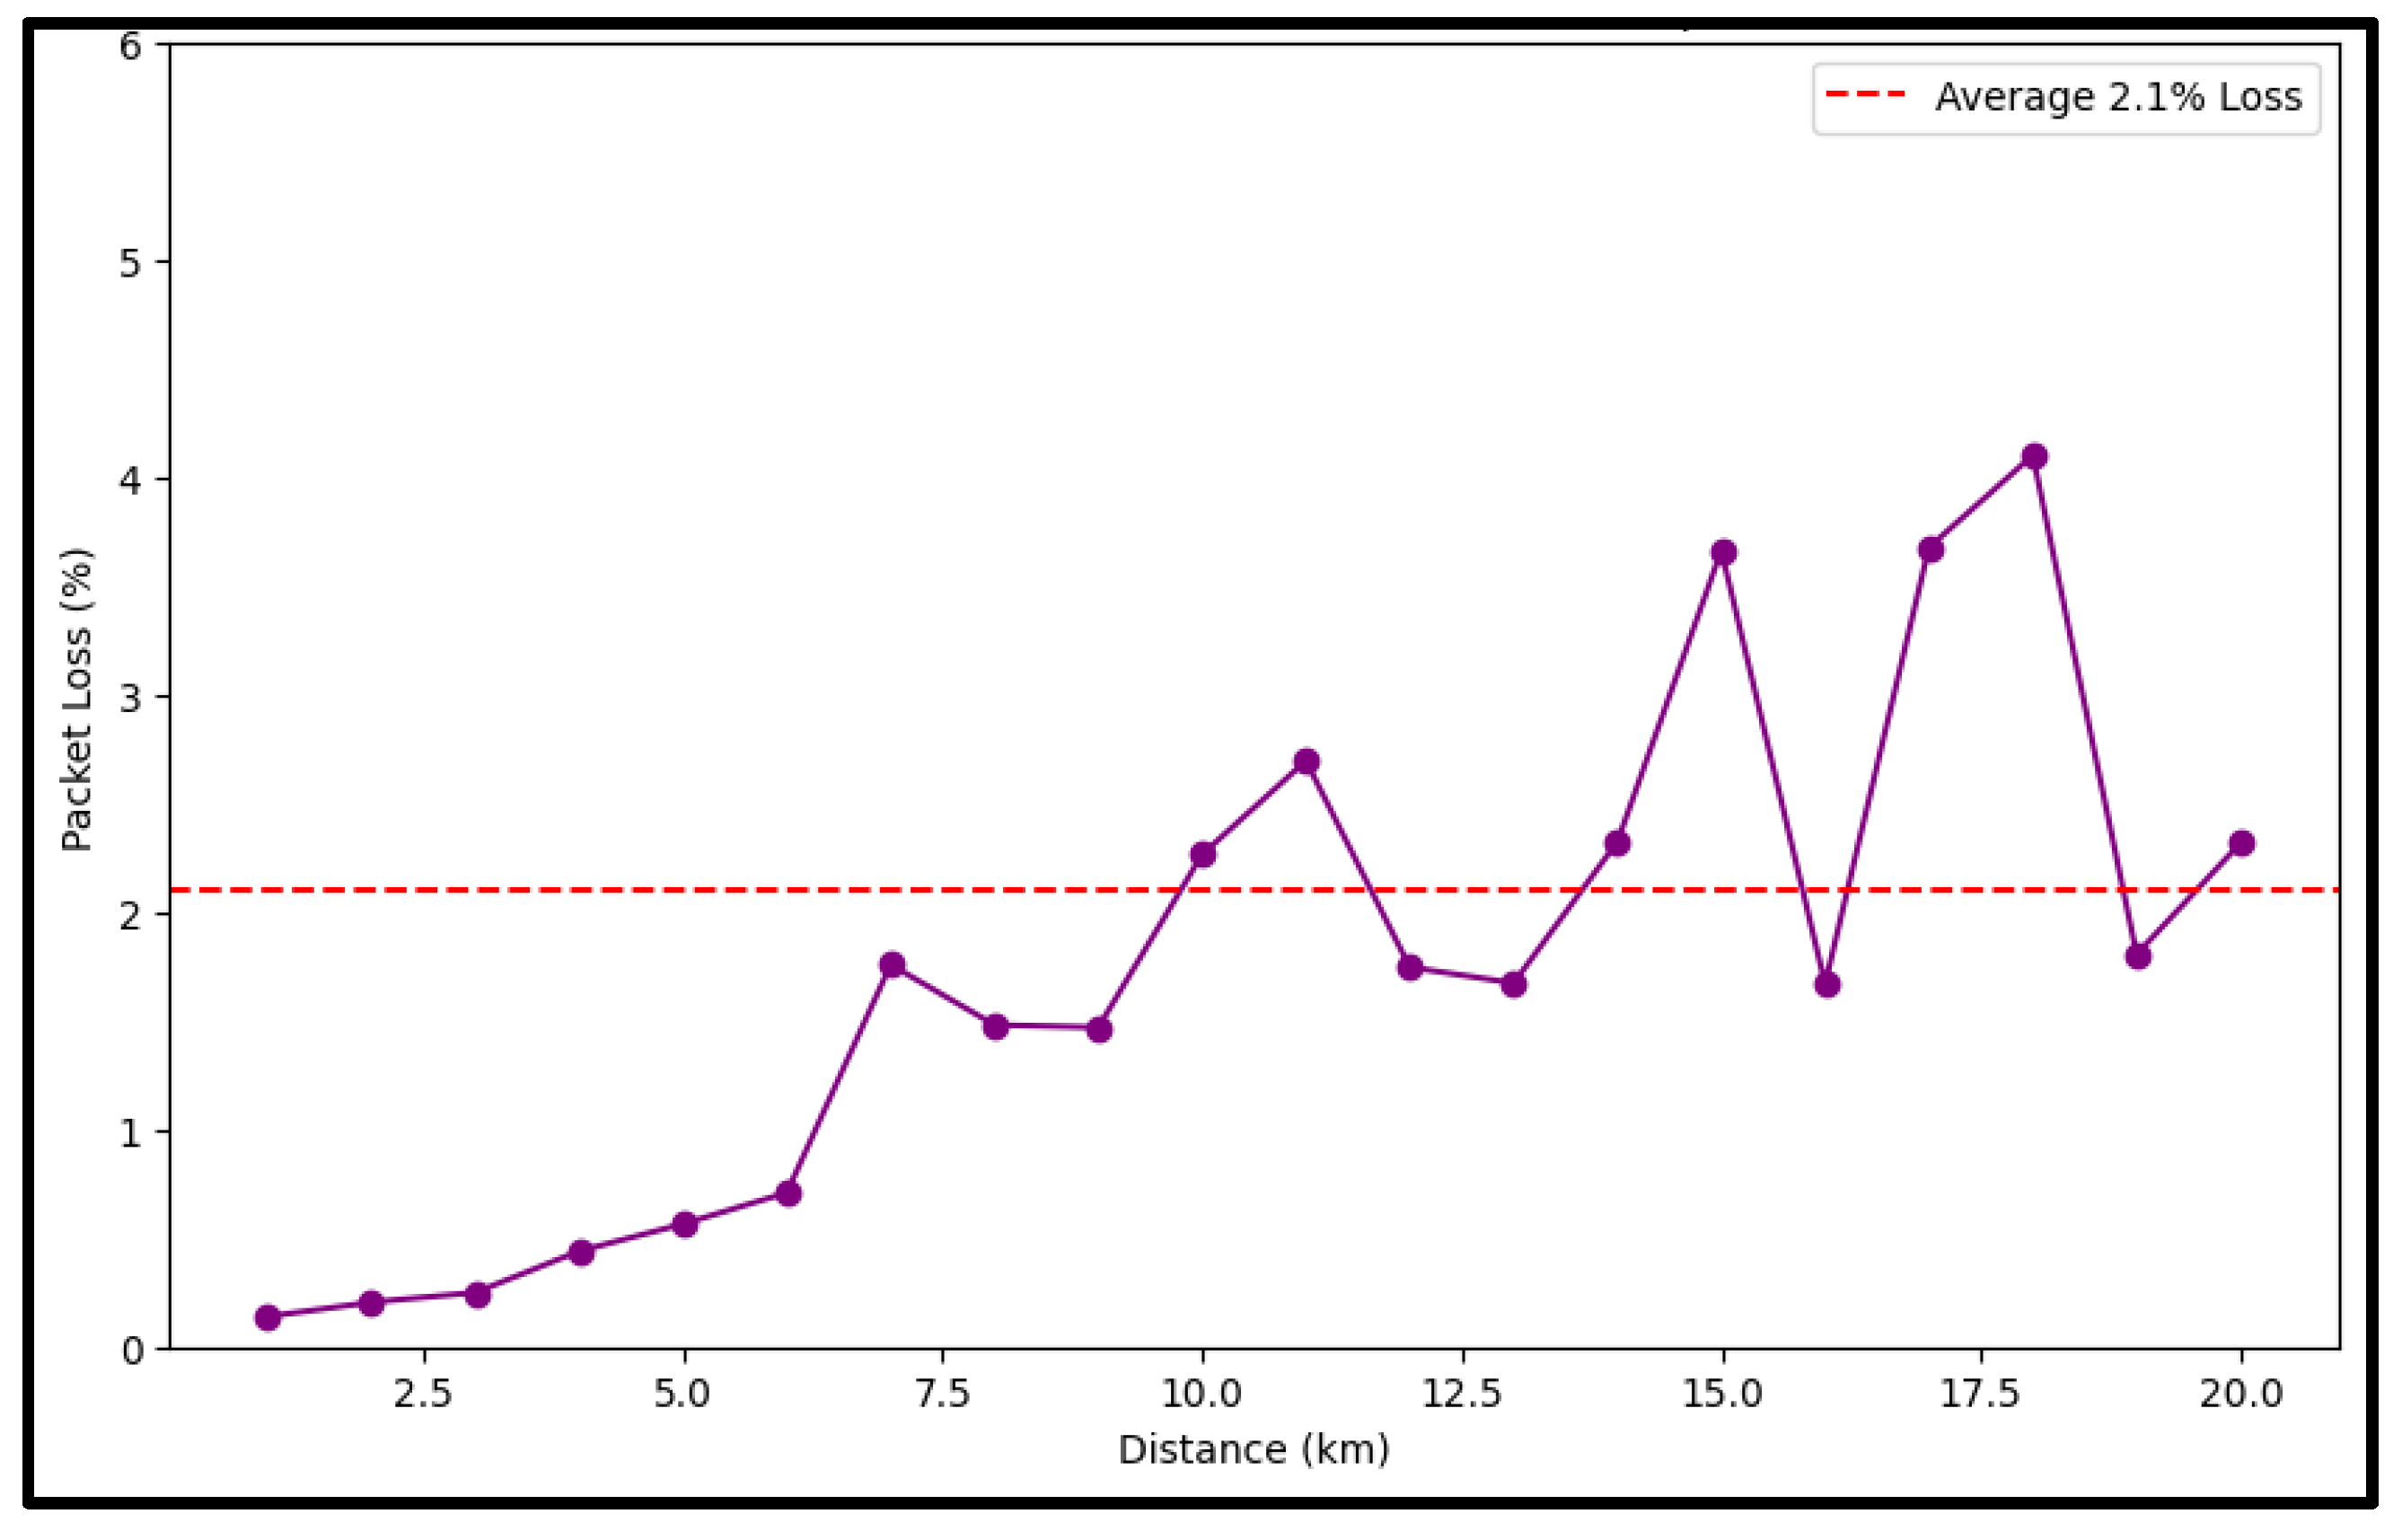
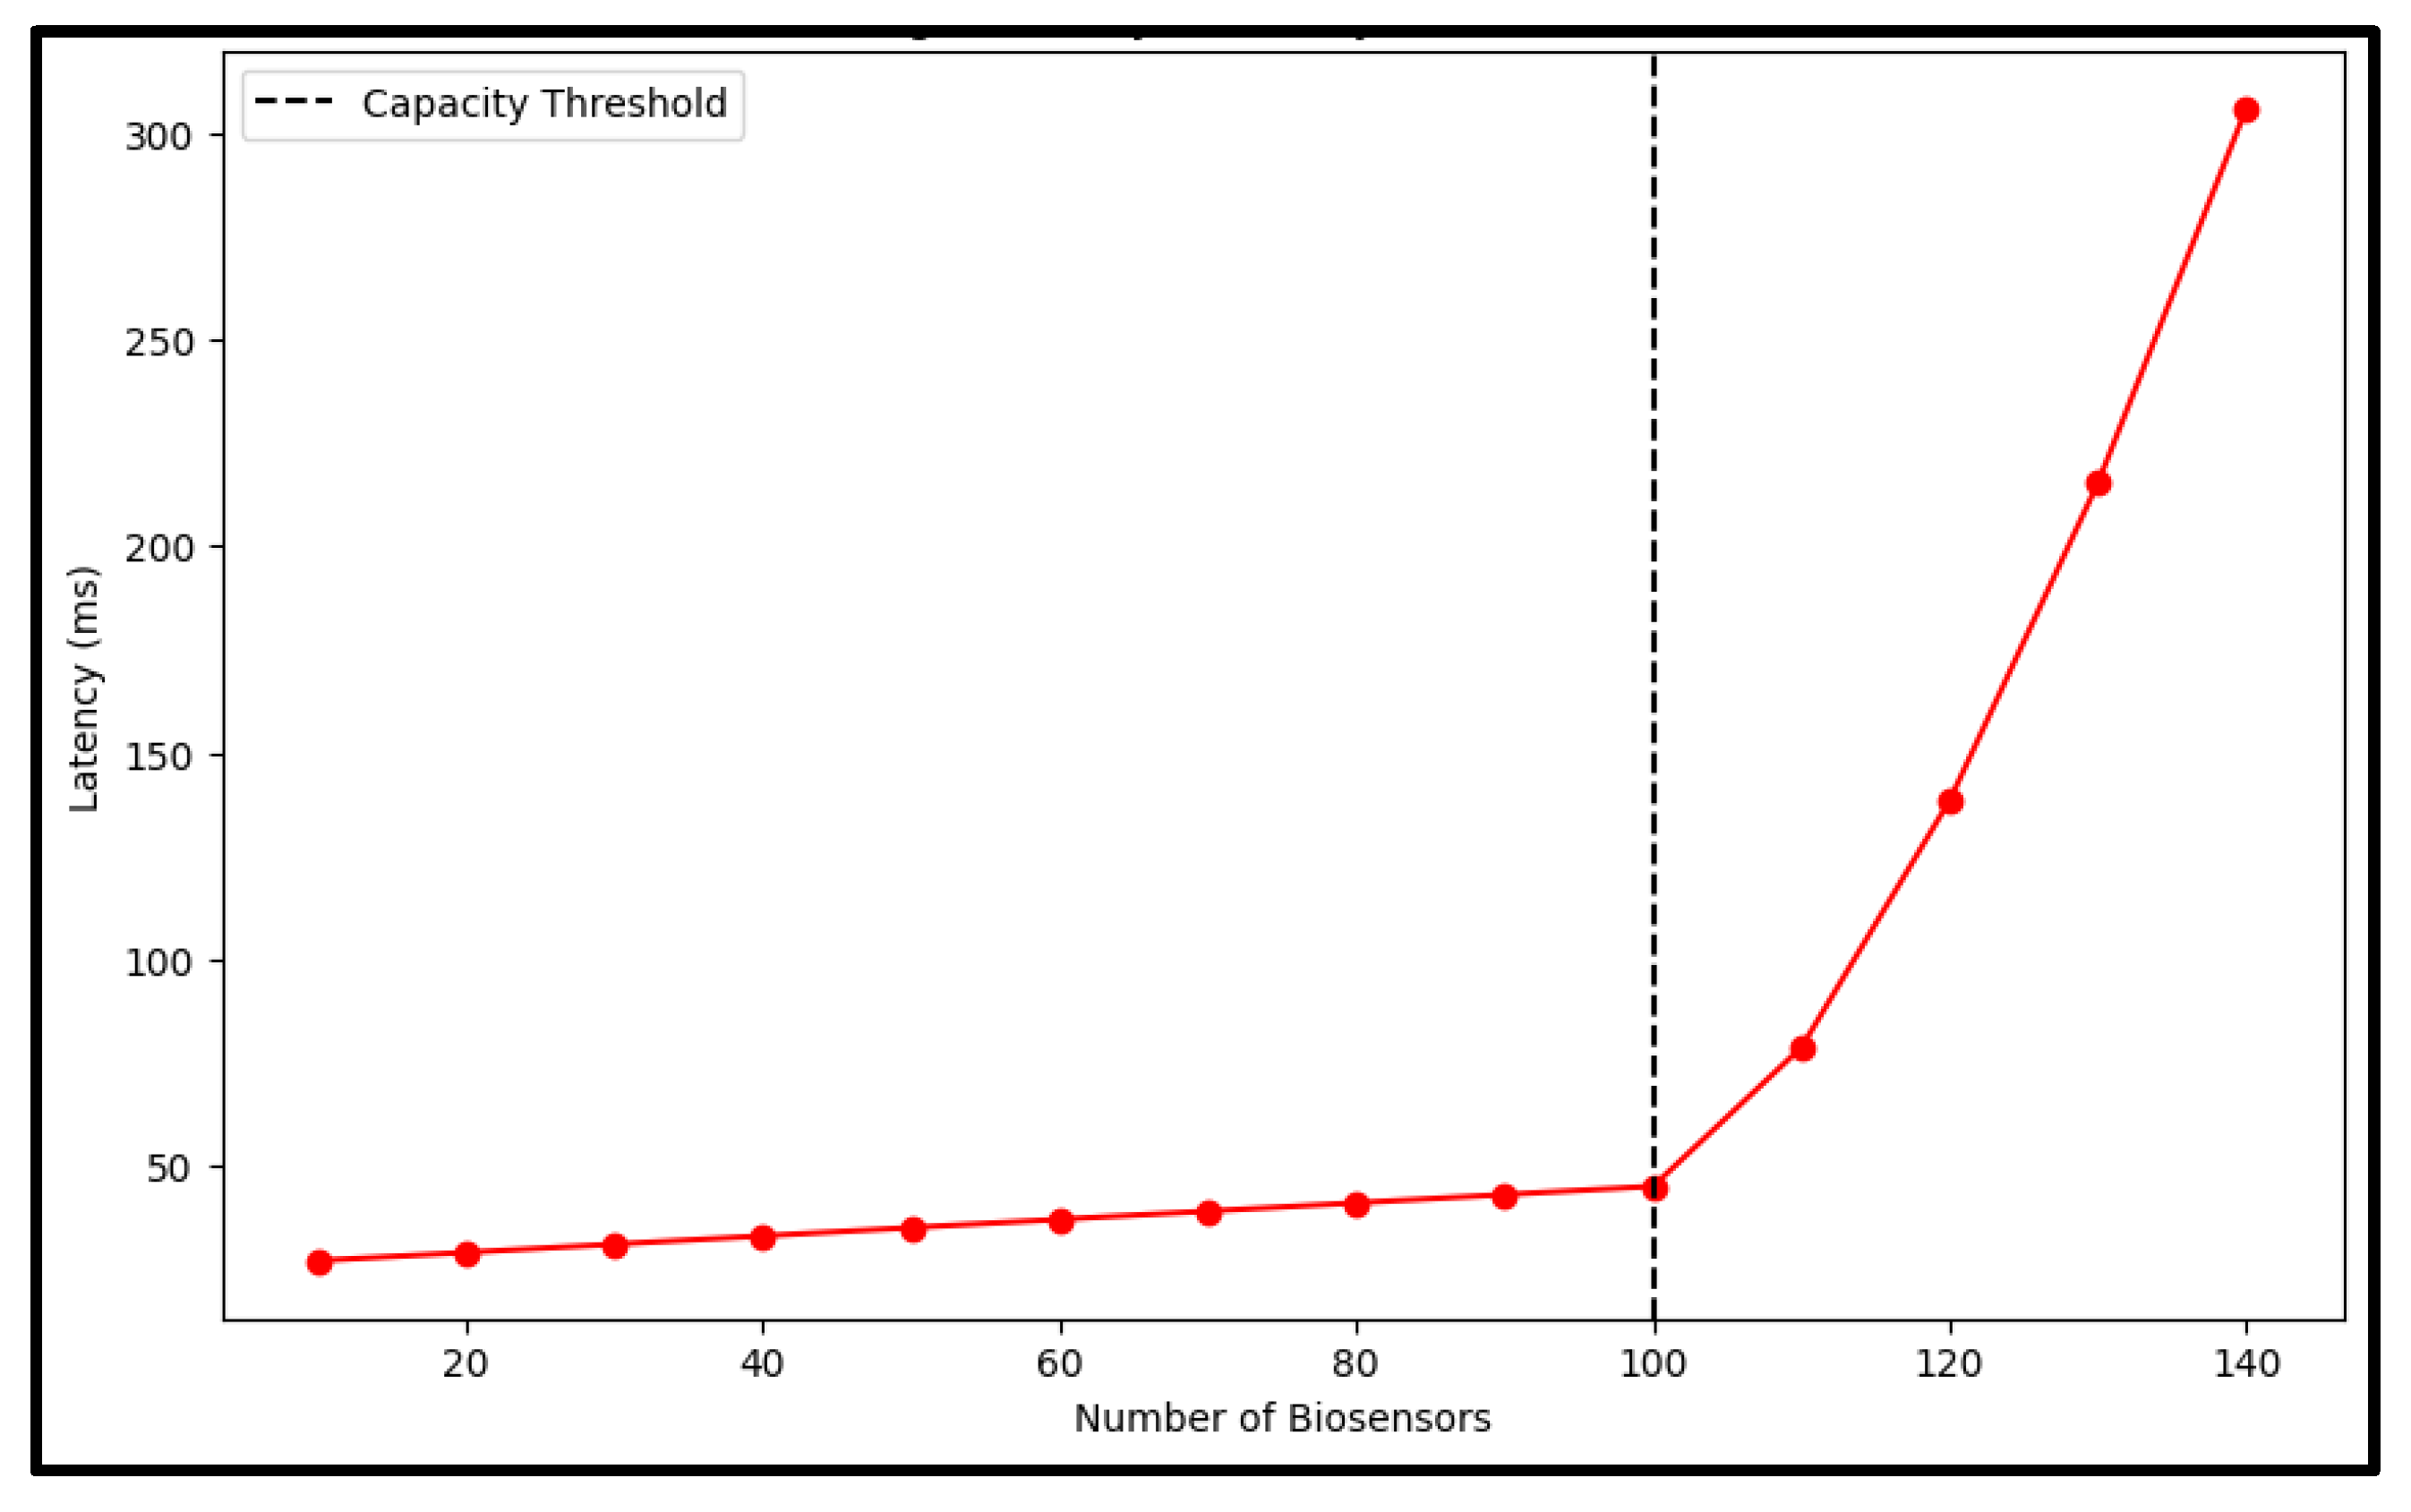
Figure 9 represents the system accuracy and latency shifts as the number of sensor devices rises from 10 to 100 nodes. The processing times for both the edge TCN and cloud LSTM models are compared. The distribution of biosensor sensitivities, according to their ppb detection limits, is shown in Figure 10. The detection success rate is displayed against the pollutant concentration in ppb in Figure 11. A plot of packet loss across 24 h can be seen in Figure 12, revealing values that mostly change within a band of 2%, with little variation. In Figure 13, the packet loss percentage is plotted against the transmission distance, considering weather conditions for distances of up to 20 km. The edge latency is depicted in Figure 14 as a function of the number of biosensors, with a certainly significant rise beyond 100 sensors, using a vertical dashed line to mark the system’s upper capacity limit.
Five test scenarios are presented in Table 3 to evaluate how pollutant detection changed with different distances and types of contaminants. Multiple performance and deployment metrics are shown side-by-side for the TCN-based system and the LSTM-based system in Table 4.
Furthermore, to prove the excellence of the TCN, we prepared a transformer-based temporal model, such that it could comprise another baseline to compare with the TCN. This design of transformer was composed of two encoder layers, each with four attention heads and a positional embedding of a time series. The transformer could draw competitive results in terms of detection accuracy, albeit at the cost of higher latency and overhead when utilizing the attention mechanism. Table 5 shows a comparison of the TCN, LSTM, and transformer models in reference to the aspects of accuracy, latency, and computational complexity.
To show the energy consumption, a USB inline power monitor was used. The TCN-based edge device used 0.46 mAh/inference, and the system with cloud LSTM operation, including communication overhead, used 1.52 mAh to support the assertion that 70 percent energy savings were achieved. Table 6 verifies the hardware specifics, delay, and energy requirements and reconfirms the ability of the TCN model to be deployed in resource-limited real-time edge applications.

5. Conclusions

As freshwater threats continue to build up and public health risks increase, the need for real-time decentralized water quality monitoring is now a critical necessity. The constructed edge IoT-enabled cyber–physical system demonstrated completely accurate detection during experiments and outperformed the conventional LSTM-based methods by 6.3% and reduced latency by 38% and energy consumption by 70%. Reaching communication distances of up to 15 km, the LoRaWAN-based data transmitter reached a satisfactory 2.1% packet loss rate, offering reliable service to rural and remote places. The layered architecture in the system synergized with local edge inference, which enabled real-time computation and alerts without leaning so much on cloud services and reduced response time. A comparison with existing models demonstrated that the TCN is very effective for dealing with the sequences of pollutant data, and as such, with very low computational requirements, making it a top choice for resource-constrained edge computing environments. In the next stages, focus will be given to scaling out the model for a variety of sensor inputs, embracing XAI tools as a mechanism to explain predictive outputs, and feeding federated learning networks that enable group learning without compromising data confidentiality. Moreover, we intend to perform sustained field deployments within different geographical locales to test the system’s scalability, its robustness, and its ability to generalize into the real world. These enhancements will draw the framework into the role of a robust and intelligent tool for next-generation environmental monitoring.

Author Contributions

Conceptualization, J.A. and M.S.; methodology, M.S.; software, R.K.D.; validation, J.A., M.S. and R.K.D.; formal analysis, R.K.D.; investigation, J.A.; resources, R.K.D.; data curation, R.K.D.; writing—original draft preparation, J.A., writing—review and editing, R.K.D.; visualization, R.K.D.; supervision, M.S.; project administration, J.A.; funding acquisition, M.S. All authors have read and agreed to the published version of the manuscript.

Funding

This research received no external funding.

Institutional Review Board Statement

Not applicable.

Informed Consent Statement

Not applicable.

Data Availability Statement

The data and code will be provided upon request.

Conflicts of Interest

The authors declare no conflicts of interest.

References

  1. Bexeitova, K.; Baimenov, A.; Varol, E.A.; Kudaibergenov, K.; Zhantikeyev, U.; Sailaukhanuly, Y.; Toshtay, K.; Tauanov, Z.; Azat, S.; Berndtsson, R. Microplastics in freshwater systems: A review of classification, sources, and environmental impacts. Chem. Eng. J. Adv. 2024, 20, 100649. [Google Scholar] [CrossRef]
  2. Biedunkova, O.; Kuznietsov, P. Dataset on heavy metal pollution assessment in freshwater ecosystems. Sci. Data 2024, 11, 1241. [Google Scholar] [CrossRef] [PubMed]
  3. Mohammadi, M.; Assaf, G.; Assaad, R.H.; Chang, A.J. An Intelligent Cloud-Based IoT-Enabled Multimodal Edge Sensing Device for Automated, Real-Time, Comprehensive, and Standardized Water Quality Monitoring and Assessment Process Using Multisensor Data Fusion Technologies. J. Comput. Civ. Eng. 2024, 38, 4024029. [Google Scholar] [CrossRef]
  4. Adedeji, K.B.; Hamam, Y. Cyber-physical systems for water supply network management: Basics, challenges, and roadmap. Sustainability 2020, 12, 9555. [Google Scholar] [CrossRef]
  5. Jabbar, W.A.; Ting, T.M.; Hamidun, M.F.I.; Kamarudin, A.H.C.; Wu, W.; Sultan, J.; Ali, M.A. Development of LoRaWAN-based IoT system for water quality monitoring in rural areas. Expert Syst. Appl. 2024, 242, 122862. [Google Scholar] [CrossRef]
  6. Sarabandi, M.; Zargar, M.; Ghorbani, A.; Chen, M. Smart and sustainable nano-biosensing technologies for advancing stress detection and management in agriculture and beyond. Ind. Crops Prod. 2025, 226, 120713. [Google Scholar] [CrossRef]
  7. Herdina, A.N.; Bozdogan, A.; Aspermair, P.; Dostalek, J.; Klausberger, M.; Lingg, N.; Cserjan-Puschmann, M.; Aguilar, P.P.; Auer, S.; Demirtas, H.; et al. Bridging basic science and applied diagnostics: Comprehensive viral diagnostics enabled by graphene-based electronic biosensor technology advancements. Biosens. Bioelectron. 2025, 267, 116807. [Google Scholar] [CrossRef] [PubMed]
  8. Shreshtha, R.; Mulukutla, A.; Deb, V.K.; Chauhan, N.; Jain, U. Unveiling the Cutting Edge: Recent Developments in α-Synuclein Nano-biosensor Technology for Precision Diagnosis of Parkinson’s Disease. BioNanoScience 2025, 15, 171. [Google Scholar] [CrossRef]
  9. Isa, A.; Gharibi, M.; Cetinkaya, A.; Ozkan, S.A. Sustainable and scalable detection: Paper-based analytical devices and miniaturized detection systems for modern diagnostics. Microchem. J. 2025, 212, 113210. [Google Scholar] [CrossRef]
  10. Sun, J.; Li, S.; Shao, X.; Fang, M.; Zhang, H.; Zhu, Z.; Sun, X. Two Methods for Detecting PCM Residues in Vegetables Based on Paper-Based Sensors. Sensors 2025, 25, 2602. [Google Scholar] [CrossRef]
  11. Saheed, Y.K.; Misra, S. CPS-IoT-PPDNN: A new explainable privacy-preserving DNN for resilient anomaly detection in Cyber-Physical Systems-enabled IoT networks. Chaos Solitons Fractals 2025, 191, 115939. [Google Scholar] [CrossRef]
  12. Zhukabayeva, T.; Ahmad, Z.; Adamova, A.; Karabayev, N.; Abdildayeva, A. An Edge-Computing-Based Integrated Framework for Network Traffic Analysis and Intrusion Detection to Enhance Cyber–Physical System Security in Industrial IoT. Sensors 2025, 25, 2395. [Google Scholar] [CrossRef]
  13. Saheed, Y.K.; Chukwuere, J.E. CPS-IIoT-P2Attention: Explainable Privacy-Preserving with Scaled Dot-Product Attention in Cyber Physical System-Industrial IoT Network. IEEE Access 2025, 13, 81118–81142. [Google Scholar] [CrossRef]
  14. Akinsoji, A.H.; Adelodun, B.; Adeyi, Q.; Salau, R.A.; Odey, G.; Choi, K.S. Prediction of spatial-temporal flood water level in agricultural fields using advanced machine learning and deep learning approaches. Nat. Hazards 2025, 121, 7915–7940. [Google Scholar] [CrossRef]
  15. Gaso, D.V.; La Rosa, L.E.C.; Puntel, L.A.; Edreira, J.I.R.; de Wit, A.; Kooistra, L. Predicting spatial and temporal variability in soybean yield using deep learning and open source data. Eur. J. Agron. 2025, 164, 127498. [Google Scholar] [CrossRef]
  16. Shi, L.; Liu, Y.; Zhao, J.; Kuang, Z.; Zhang, J.; Liu, M.; Wang, H. Lightweight attention temporal convolutional network based on multi-scale feature fusion for respiratory prediction in tumor radiotherapy. Biomed. Signal Process. Control 2025, 100, 106923. [Google Scholar] [CrossRef]
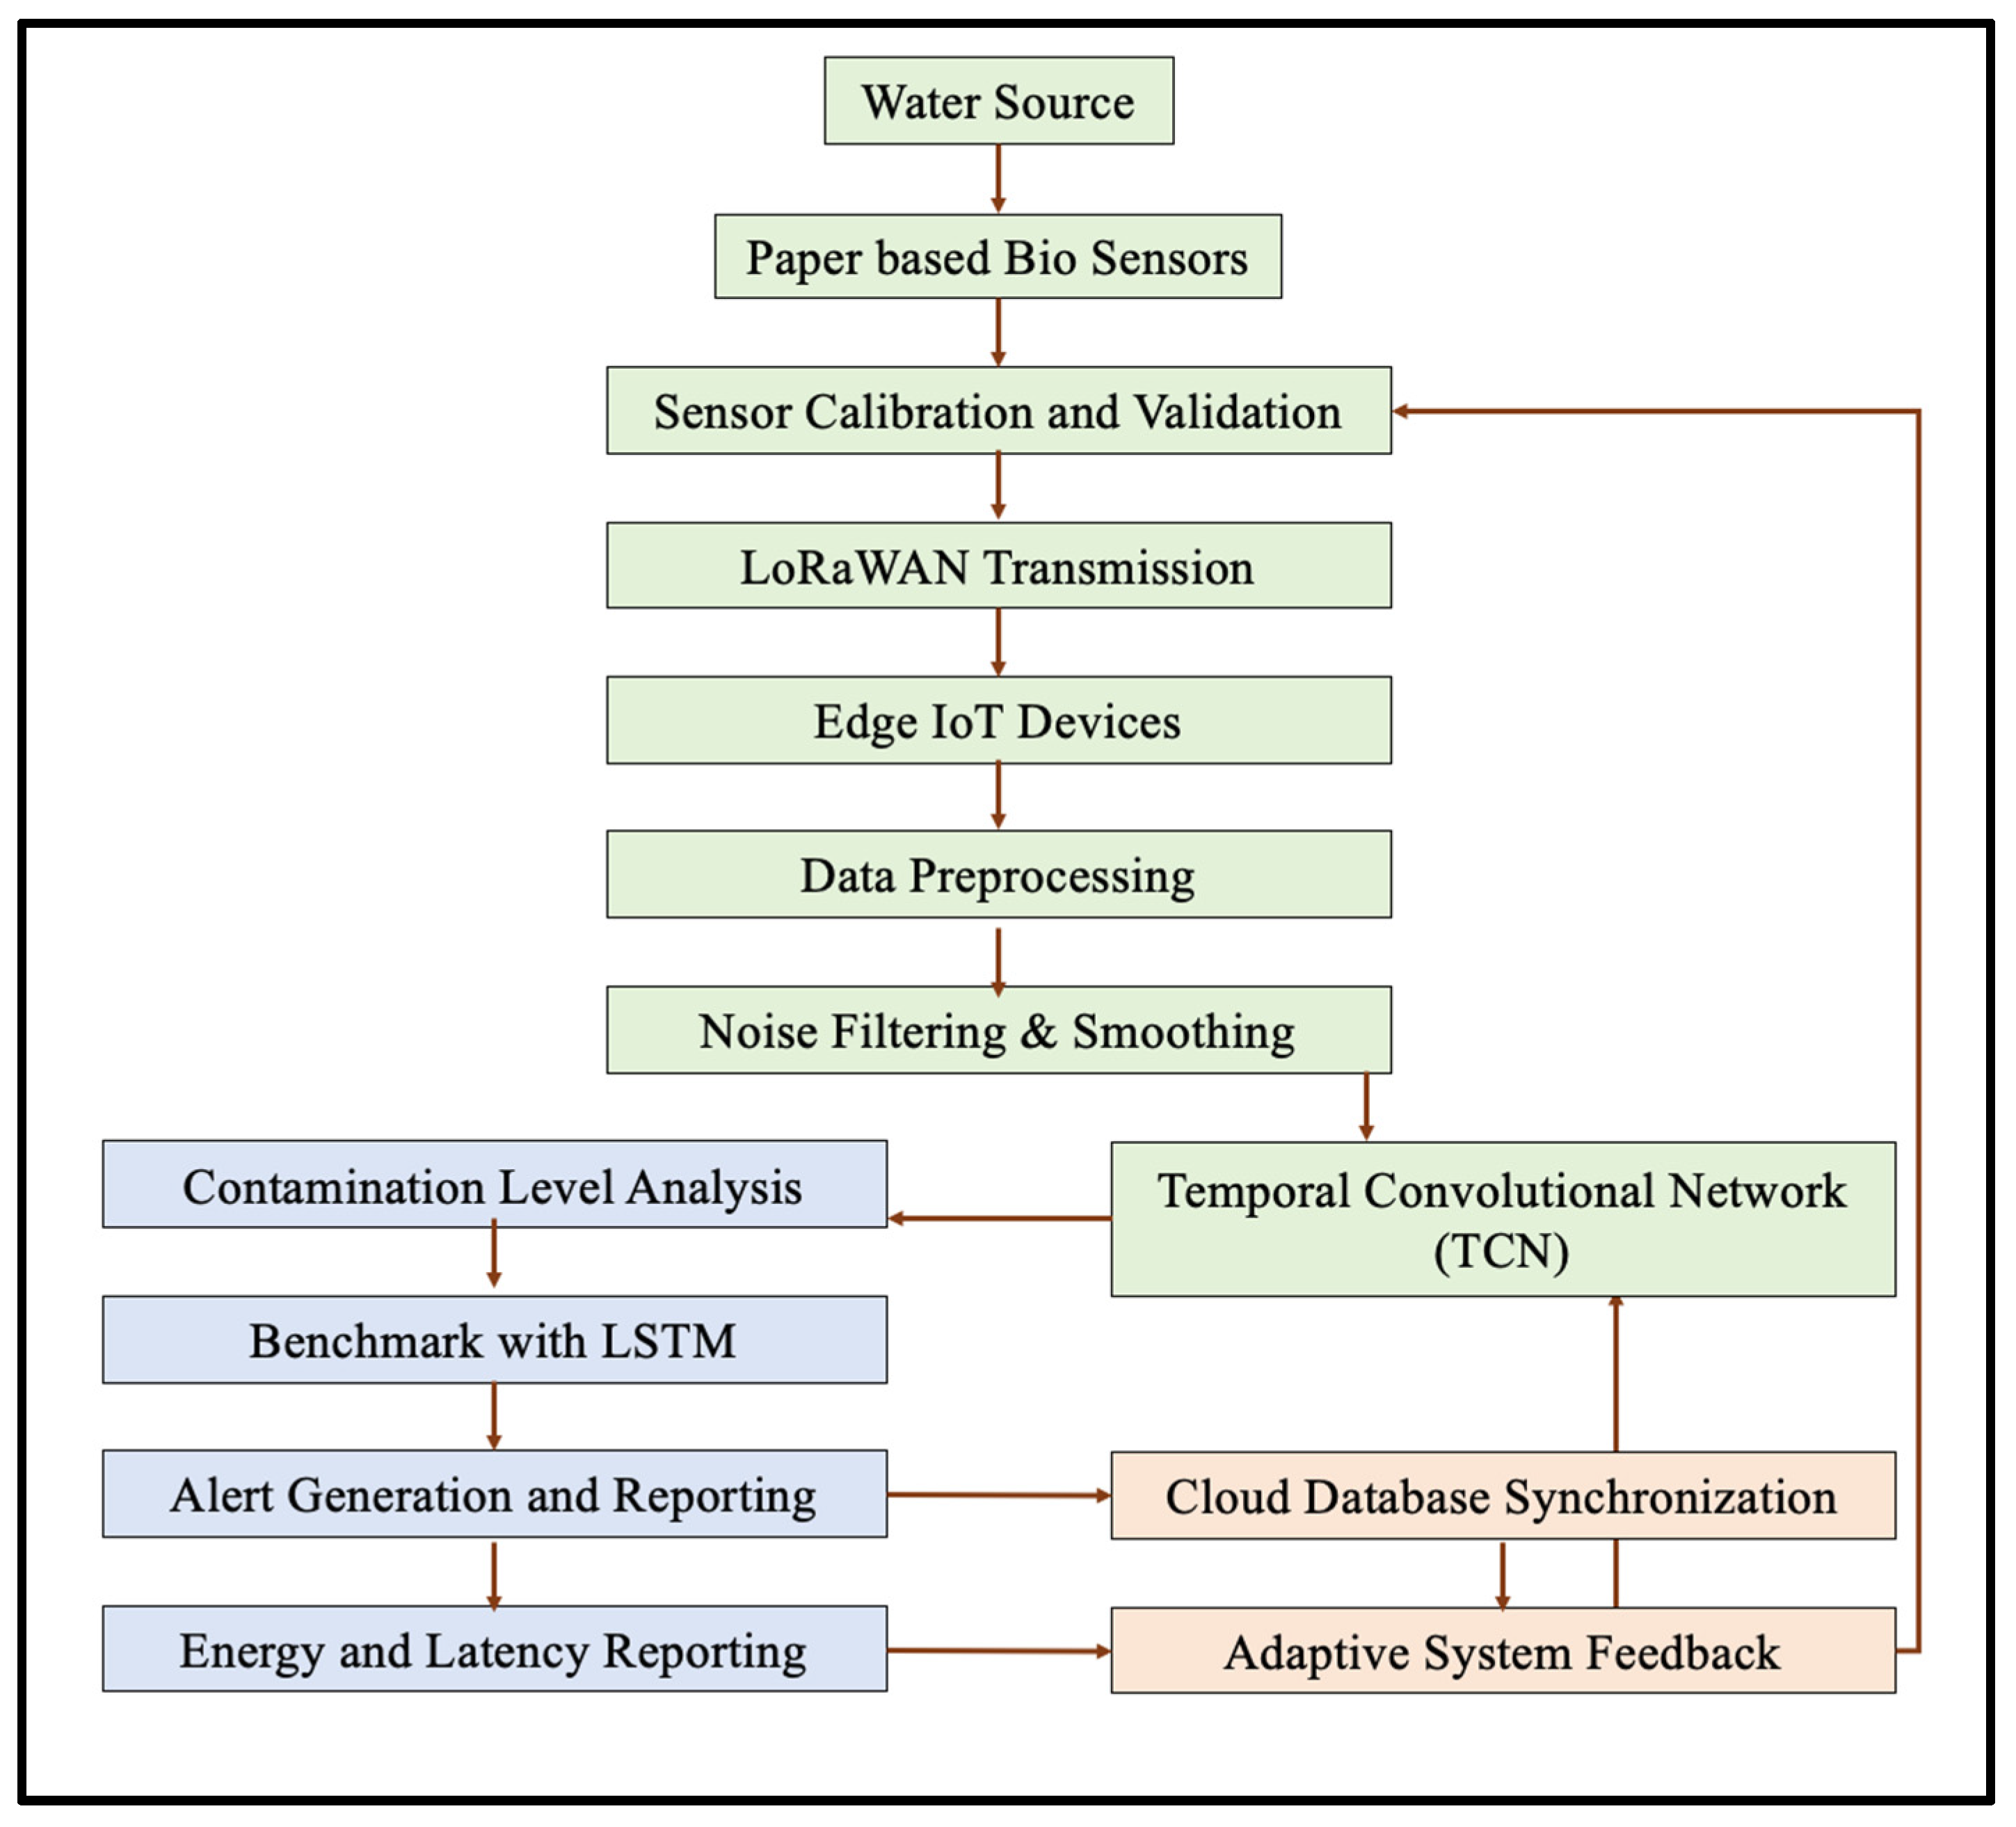
Figure 1. Traditional workflow for edge-based water quality monitoring.
Engproc 106 00003 g001
Figure 2. Architecture and workflow of proposed water contamination monitoring system.
Engproc 106 00003 g002
Figure 3. TCN model.
Engproc 106 00003 g003
Figure 4. Real-time pollutant monitoring.
Engproc 106 00003 g004
Figure 5. Sensitivity and reliability.
Engproc 106 00003 g005
Figure 6. Confusion matrix.
Engproc 106 00003 g006
Figure 7. ROC curve for TCN model.
Engproc 106 00003 g007
Figure 8. Scalability test.
Engproc 106 00003 g008
Figure 9. Processing time comparison.
Engproc 106 00003 g009
Figure 10. Biosensor sensitivity distribution.
Engproc 106 00003 g010
Figure 11. Detection rate vs. concentration.
Engproc 106 00003 g011
Figure 12. Packet loss rate over 24 hours.
Engproc 106 00003 g012
Figure 13. Packet loss across distance.
Engproc 106 00003 g013
Figure 14. Latency vs. sensor load.
Engproc 106 00003 g014
Table 1. TCN’s layer-wise configuration parameters.
LayerKernel SizeDilation FactorNumber of FiltersActivation Function
Conv13132ReLU
Conv23232ReLU
Conv33464ReLU
Conv43864ReLU
Output layer1-1 (sigmoid)Sigmoid
Table 2. Performance metrics with statistical summary across models.
ParameterTCN-Based SystemLSTM-Based System
Detection accuracy (%)98.7 ± 0.592.4 ± 0.6
Latency (ms)26.3 ± 1.242.4 ± 1.6
Packet loss (%)2.1 ± 0.22.1 ± 0.2
Energy consumption (%)30% ± 1.5100% (cloud baseline)
ParameterTCN-based systemLSTM-based system
Table 3. Performance metrics across pollutant types and transmission distances.
ScenarioDistance (km)PollutantPacket Loss (%)Detection Accuracy (%)Latency (ms)
Test 17.5Arsenic2.8792.2826.9
Test 213.5Lead2.1792.5235.1
Test 310.1Arsenic2.3792.7637.9
Test 48.3Lead2.0096.1421.1
Test 514.9Nitrates2.5596.2024.1
Table 4. Comparison of TCN and LSTM Systems.
ParameterTCN-Based SystemLSTM-Based System
Detection accuracy (%)98.792.4
Latency reduction (%)38% faster than LSTMBaseline (100%)
Packet loss (%)2.1 (LoRaWAN, stable)2.1 (LoRaWAN, stable)
Energy consumption (%)30% (edge processing)100% (cloud processing)
Table 5. Comparative performance of TCN, LSTM, and transformer models.
ModelAccuracy (%)Latency (ms)FLOPs (Million)
TCN98.726.33.1
LSTM92.442.45.6
Transformer97.542.07.8
ModelAccuracy (%)Latency (ms)FLOPs (million)
Table 6. Hardware and energy comparison for edge vs. cloud processing.
ParameterEdge (TCN)Cloud (LSTM)
DeviceRaspberry Pi 4B (1.5 GHz)AWS EC2 (2 vCPU; 8 GB RAM)
Average latency (ms)26.3 ± 1.242.4 ± 1.6
Energy per inference (mAh)0.461.52
Operational modeEvent-triggered/continuousContinuous only
Disclaimer/Publisher’s Note: The statements, opinions and data contained in all publications are solely those of the individual author(s) and contributor(s) and not of MDPI and/or the editor(s). MDPI and/or the editor(s) disclaim responsibility for any injury to people or property resulting from any ideas, methods, instructions or products referred to in the content.