Abstract
The process of extrusion is a part of many modern manufacturing technologies that are applied in various industrial productions. In the food industry, the process of extrusion is used to produce popular foods such as cereal mixes, confectionery products, pet foods, etc. The advantages of extrusion technology are continuously applied in many studies in order to develop foods with more significant functional properties that could be produced in a time-effective and cost-effective way. In recent years, computer vision has become one of the preferred technologies in the development of new methods for quality control of food product production. This paper proposes a system for the evaluation of the quality parameters of extruded foods using a computer vision method. This system combines hardware and software modules that are developed for the discussed topic. A justification of the proposed system is provided on the basis of an experiment using extruded corn snacks made with different ingredients.
1. Introduction
Regarding the importance of human vision for overall information perception, numerous processes are modeled based on computer vision in order to simulate human decision making while yielding better performance [1]. Typical tasks in this direction are related to analysis of the internal and/or external characteristics of food and classification of foods based on their quality.
Extrusion technology is often recognized as a versatile technology with popular applications in the food industry [2]. Its advantages are related to low time consumption and energy consumption, sustainability, and capacity for the adjustment of many parameters of the production process that influence desirable characteristics of the produced food. The process of extrusion involves the impact of different factors (temperature, pressure) that affect the properties of cereal foods, in such a way leading to improvement in their nutritional value and increased acceptance by consumers [2,3]. As an advanced technology with a variety of methods for information analysis, computer vision is utilized in the development of new, bioactive ingredient-enriched foods for quality control during their production [4,5,6,7]. It is reported that image processing and artificial neural networks [4] are effective for prediction of the texture characteristics of extruded foods.
Other research [5] regarding the functional properties of additive-enriched extruded corn snacks indicates that computer vision could effectively support the development of new foods. The object of exploration is extruded corn snacks with additives for fortifying their functional properties. Four types of corn snacks are produced using dried herbs—Laurus nobilis, Curcuma longa, Zingiber officinale Roscoe, and a mixture of these herbs. The analysis based on computer vision methods is performed through ImageJ software, version 1.53. The samples are cut with a Stanley knife (Stanley Black & Decker, New Britain, CT, USA), and the resulting surface (cross-section) is captured by a color digital camera (AQM-LX1, manufacturer: Huawei Technologies Co., Ltd., Shenzhen, China) positioned vertically at a fixed distance. All images are converted into grayscale, and then they are processed with ImageJ in order to evaluate the formed cells and their distribution. The cells are identified using a freehand selection tool. Examined samples are evaluated through organoleptic analysis (color, taste, texture, and aroma), physical property analysis (determination of expansion ratio and bulk density), cross-section analysis through image processing, color analysis using Chroma meter (CR-400, Konica Minolta, Konica Minolta Sensing Europe B.V., Zilverstraat 1, 2718 RP Zoetermeer, The Netherlands), and texture analysis using a Texture Analyzer (TA.XT Plus, Stable Micro Systems Ltd., Vienna Court, Lammas Road, Godalming, Surrey, GU7 1YL, UK).
A CVS (computer vision system) is used in order to develop a method for controlling the extrusion process in order to achieve better performance (controlling the width of the filament). The accuracy of the extrusion width before and after correction is measured using ImageJ software. The experiments show that the CV-based feedforward control method can provide good printing accuracy improvement [6].
The design of illumination in the CVS is a significant step [8] that influences overall system efficiency. The evolution of lighting sources is utilized in the development of lighting modules in CVSs. In recent years, LED sources have become preferred for many industrial applications based on computer vision due to their abilities to provide a rather flat intensity across the entire visible portion of the electromagnetic spectrum. Years of experience with algorithms for image enhancement have brought a lot of fundamental knowledge to this field, and thus many smoothing and filtering algorithms already exist. Such algorithms are also implemented in open-source software solutions, such as ImageJ [9,10]. The computer vision system used for our experiments can create a stable illumination condition.
The aim of this research is to develop a computer-based system for automatic evaluation of some visual characteristics, such as size and shape, of corn snacks using computer vision methods.
2. Materials and Methods
2.1. Extruded Foods
Four different brands of Bulgarian extruded corn snacks are purchased from the marketplace. The brands are differentiated from each other by several indicators—external dimensions, porosity, and overall structure—which are related to additives that are used during the production process. All of the extruded corn snacks used include some of the same main ingredients, such as cornmeal, vegetable oil, and iodized salt. Using various additives for improving the taste, different flavors of extruded snacks are produced. Extruded snacks (manufactured in Bulgaria) with natural flavor (Brand 1), dill and cream flavor (Brand 2), pepper flavor (Brand 3), and butter flavor (Brand 4) are used for computer-based evaluation of the external dimensions. Table 1 shows the nutritional value (for 100 g of the product) of each brand of extruded snack used in this research.

Table 1.
Nutritional values for all flavors of tested snacks.
2.2. Reference Method
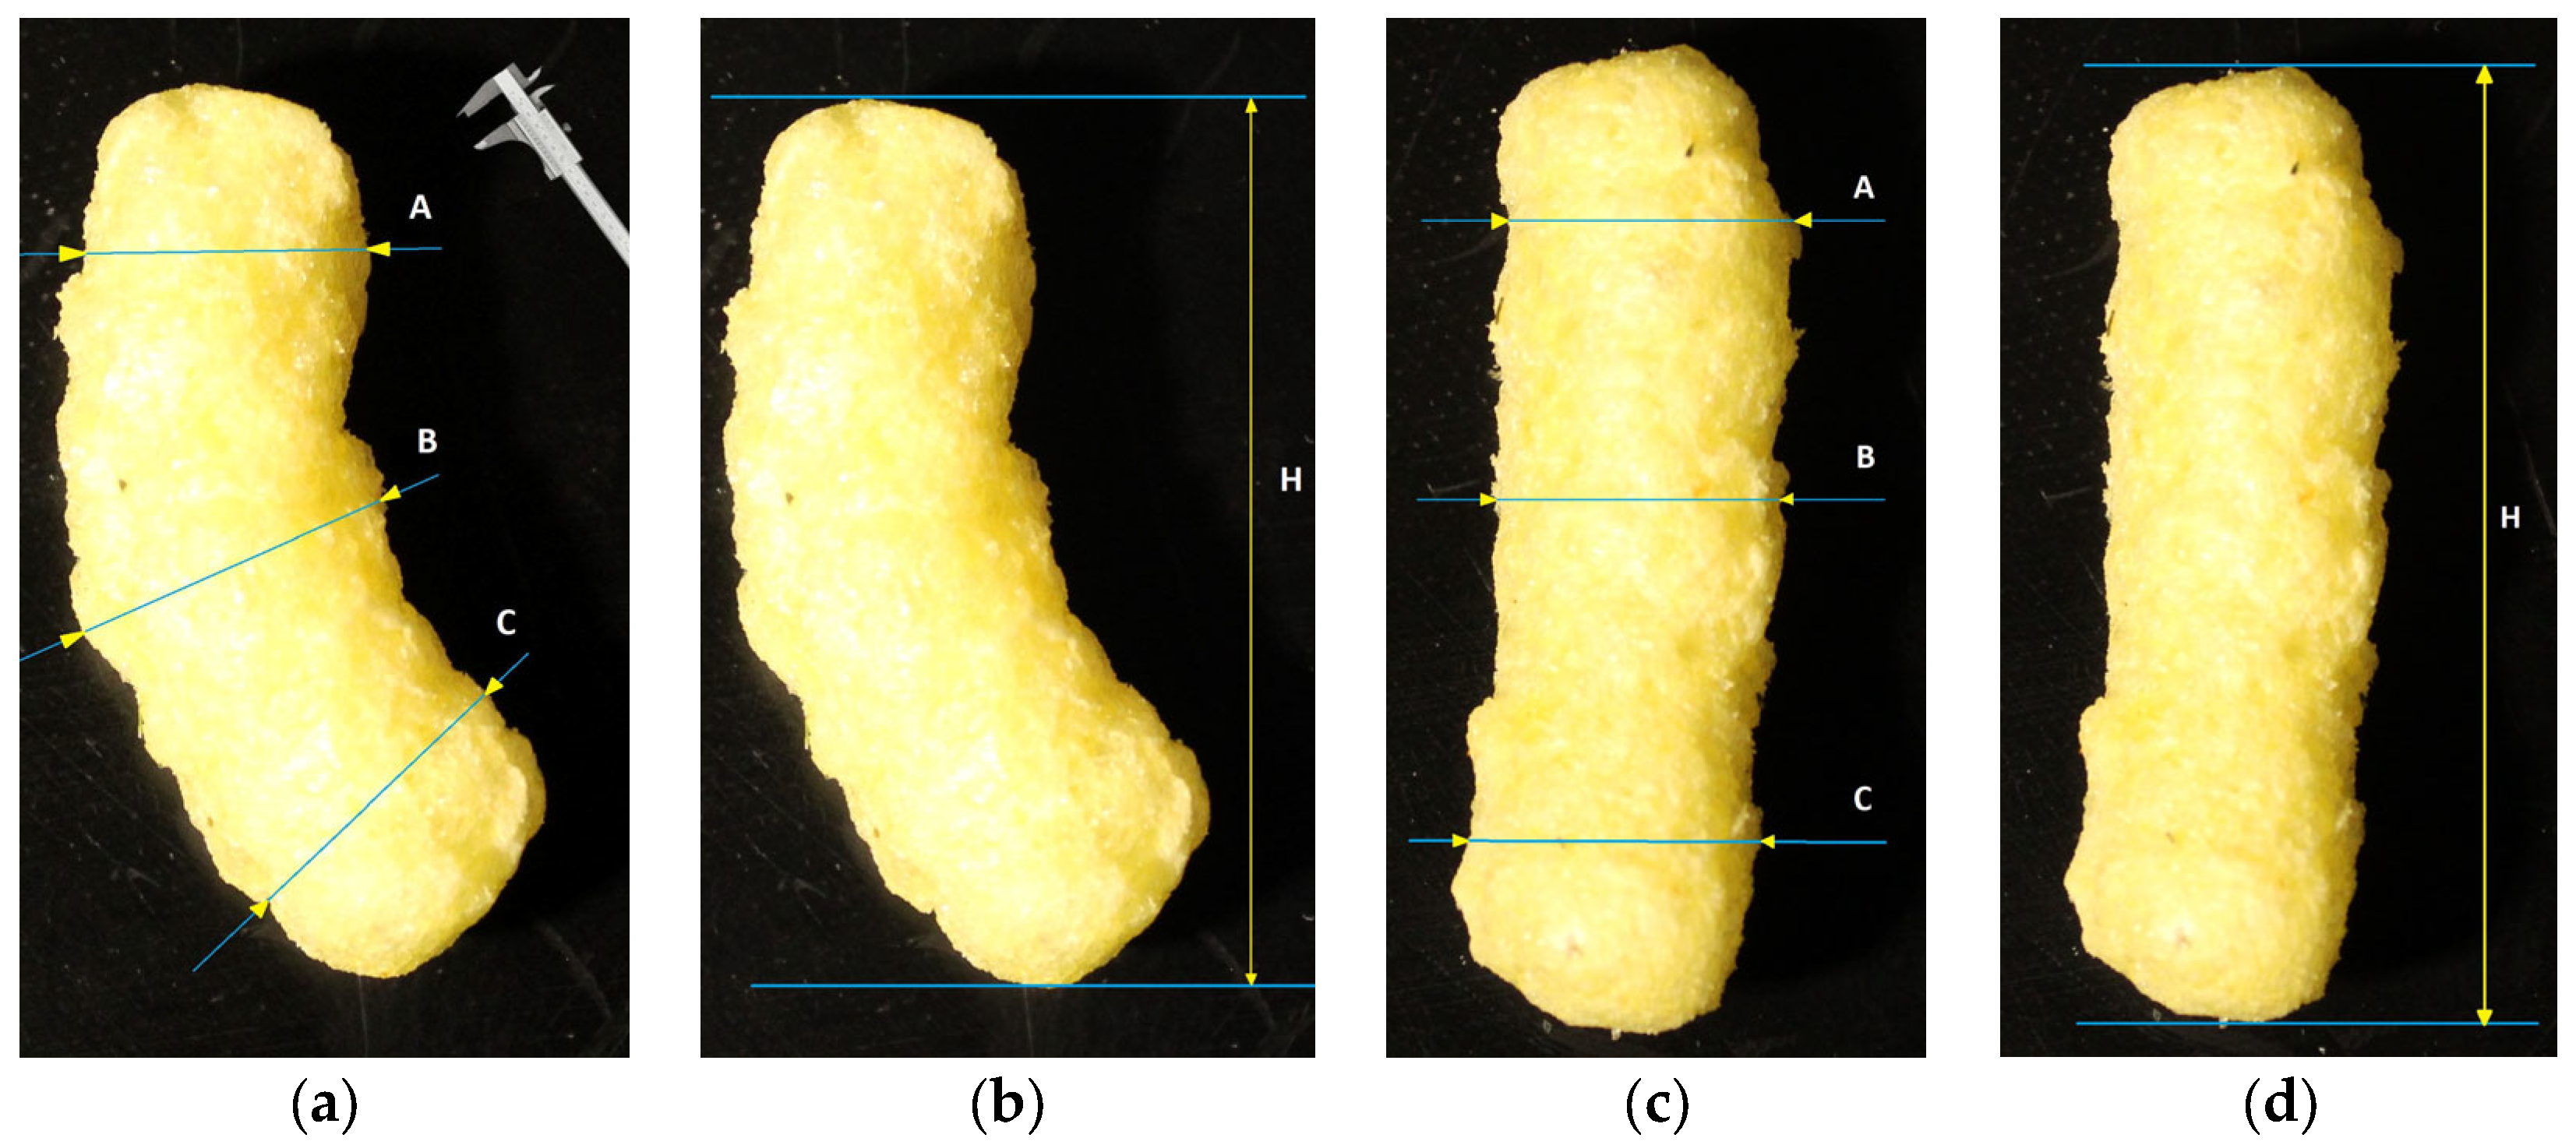
A handheld caliper (bought from a tool store in Plovdiv, Bulgaria) is used as a tool for a reference method for measuring the dimensions of the extruded snacks for each of the five randomly taken samples. The measurements are conducted with a high level of concentration and minimized pressure. Both the width and the height of the objects were measured, with the width being measured at three points—top (Figure 1a-A), middle (Figure 1a-B), and bottom (Figure 1a-C—for both curved and straight objects. In each measurement, the caliper is placed in a proper alignment in relation to the subsections of each sample. The overall width is calculated as an average of the values from points A, B, and C. The height of the objects is measured too (Figure 1b-H).
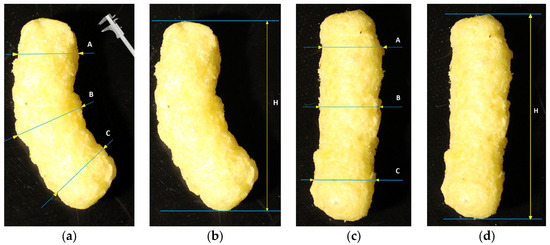
Figure 1.
Reference method based on using handheld caliper for measuring dimensions: (a) width at three points, A, B, and C, and (b) height of the object—H—on curved objects; (c,d) measurements on straight objects.
In addition to the reference method, a computer-based handheld measurement using ImageJ line-drawing and measurement tools is performed. The idea of this additional method is to measure the width and the height more precisely without disturbing the surface of the objects. The reference method based on using a handheld caliper has one disadvantage related to the subject that conducts the experiment. During the measurement, a slight deformation of the surface of the extruded object may be caused as a result of applying more force than necessary.
2.3. EFQVision—A System for Quality Control of Extruded Foods
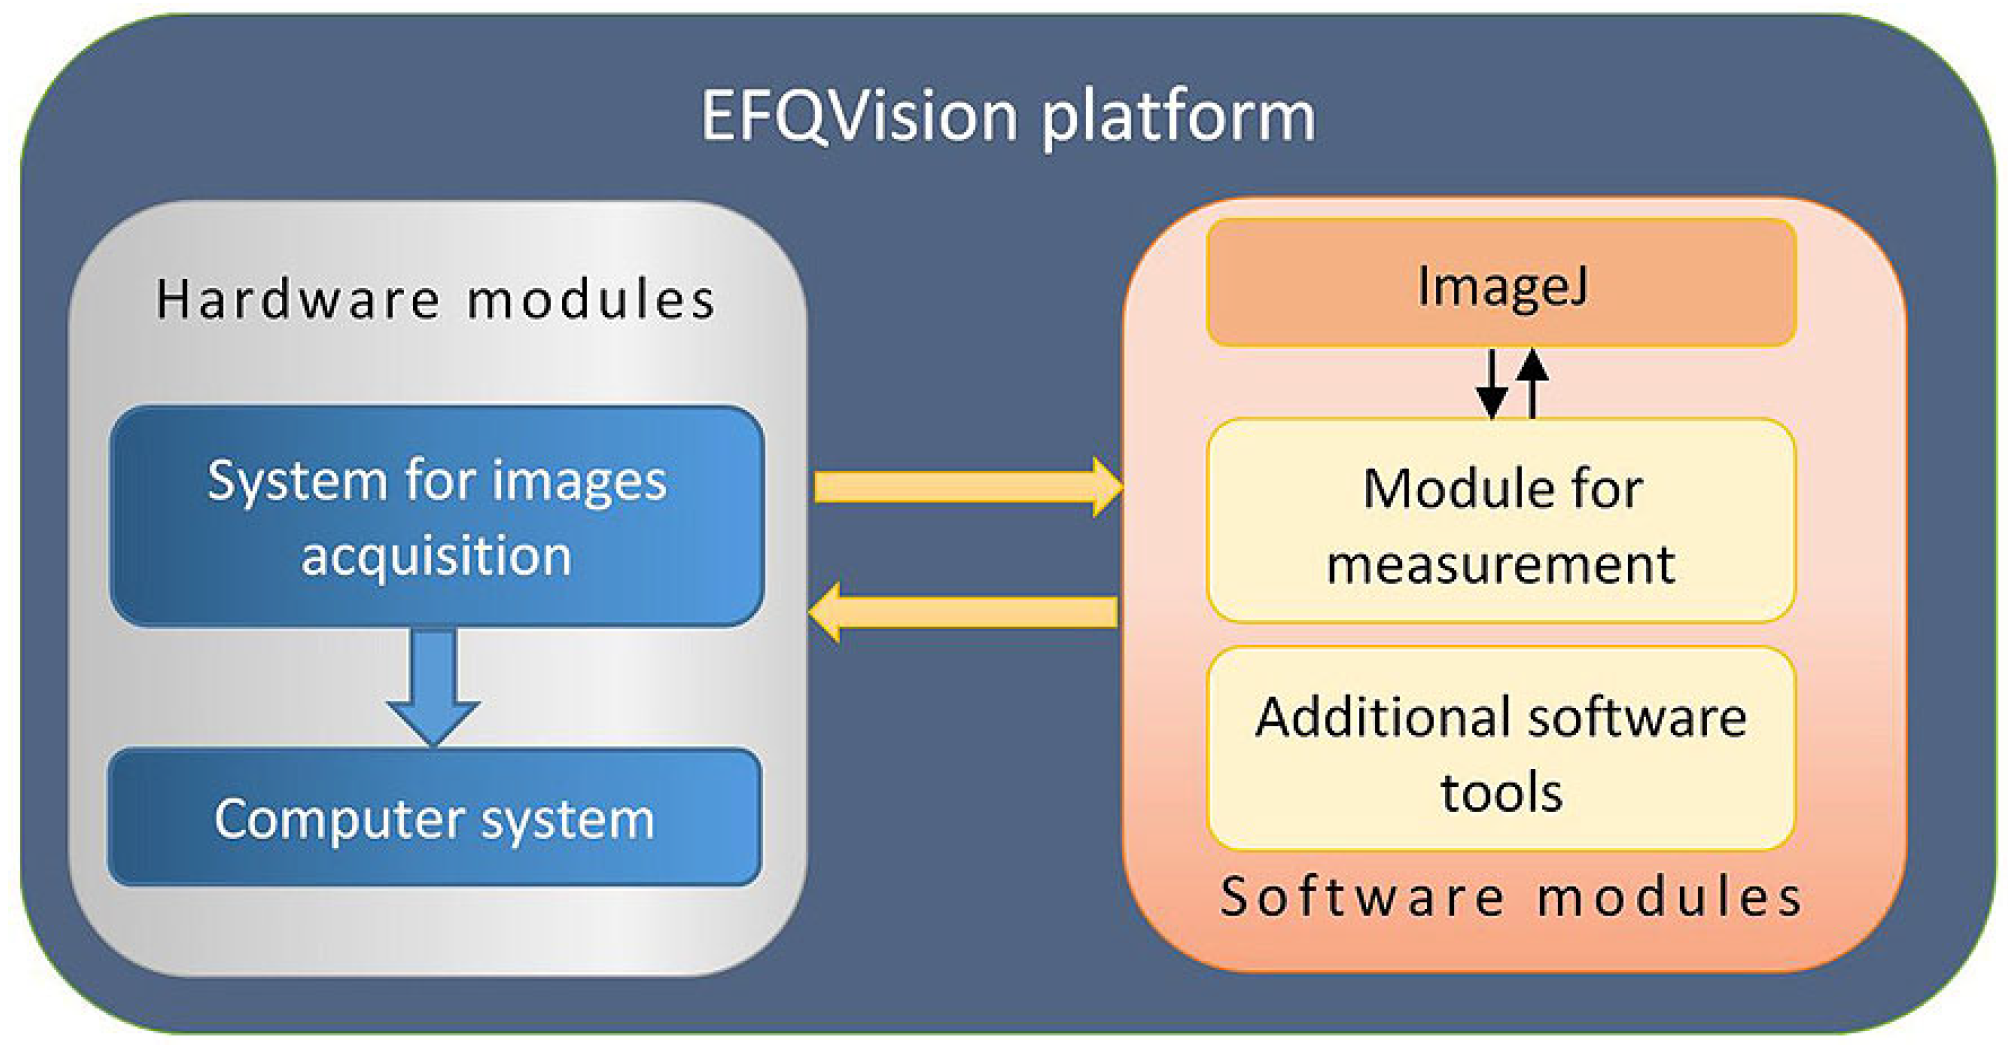
Visual characteristics of extruded foods are important for their overall consumer perception and their nature supports analysis through methods of computer vision. The structure of the developed system for quality control of extruded foods (EFQVision) is presented in Figure 2.
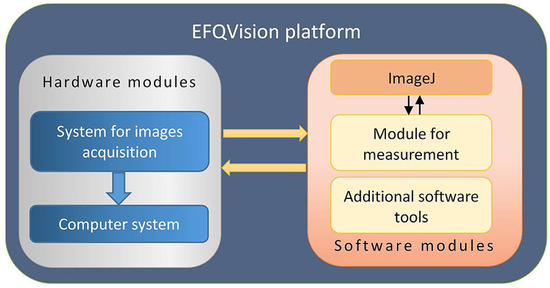
Figure 2.
EFQVision system—hardware and software modules.
The developed system consists of hardware and software modules. Hardware modules include a system for image acquisition (an experimental setting with a digital camera and appropriate lighting) and a computer system for processing initial images and analyzing the obtained results. The computer system is used for low-level image processing, image segmentation, and image analysis.
The developed software modules are implemented as macros in the environment of the well-known open-source software for digital image processing ImageJ. As a software with many useful built-in functionalities, ImageJ is efficiently used in previous research studies for developing computer-based systems for the automatic evaluation of some visual parameters of different food products.
2.4. Experimental Setting
An experimental setting, used in previous research studies for obtaining raw images of different varieties of food products is also used in this research [10]. The experimental setting consists of several components—a main structural frame made from aluminum tubes, a black pad used to unify the background of the input images, and four LED spot lights with technical characteristics: LED type SMD2835 (UltraLux, Plovdiv, Bulgaria), 3 W energy consumption, 280 lumens, 4200 K Natural light color temperature, and beam angle 120°. The Color Rendering Index (CRI) is above 80 Ra and warm-up time is less than 0.2 s. The lights are mounted at an angle of 45 degrees to the object and there is a control panel for controlling the lighting fixtures, solid light-tight sidewalls which prevent the penetration of any light from the environment, and a digital camera for obtaining the raw images. The camera is controlled remotely by using one of its built-in Wi-Fi control functions. The camera is set to make five shots in a continuous sequence. The obtained raw images are transferred from the camera into a computer system and saved as a bitmap image for further processing using a developed software tool for automatically measuring the external dimensions of each sample.
Five different samples are randomly taken from each brand of the extruded snacks, and five shots for each sample are captured by a digital camera mounted on a tripod placed into an experimental setting with controlled lighting parameters. In total, one hundred raw images are taken in order to accomplish the present research. A set of algorithms for image processing implemented as a software tool in ImageJ are used for automatic determination of a region of interest (ROI) and removal of the background; automatic detection of the shape (curved or straight); automatic detection of the position (left or right tilted); segmentation; and measuring the width and the height of each object.
2.5. Computer-Based Approach for Image Processing and Measurement
In order to achieve the aim of this research, a computer-based system for digital image processing is developed. The system combines both adapted hardware modules and a specially developed program as a macro for the open-source software ImageJ. The focus of this research is the development of an algorithm for automatic recognition of the shape and measurement of visual characteristics such as the width and height of extruded corn snacks.
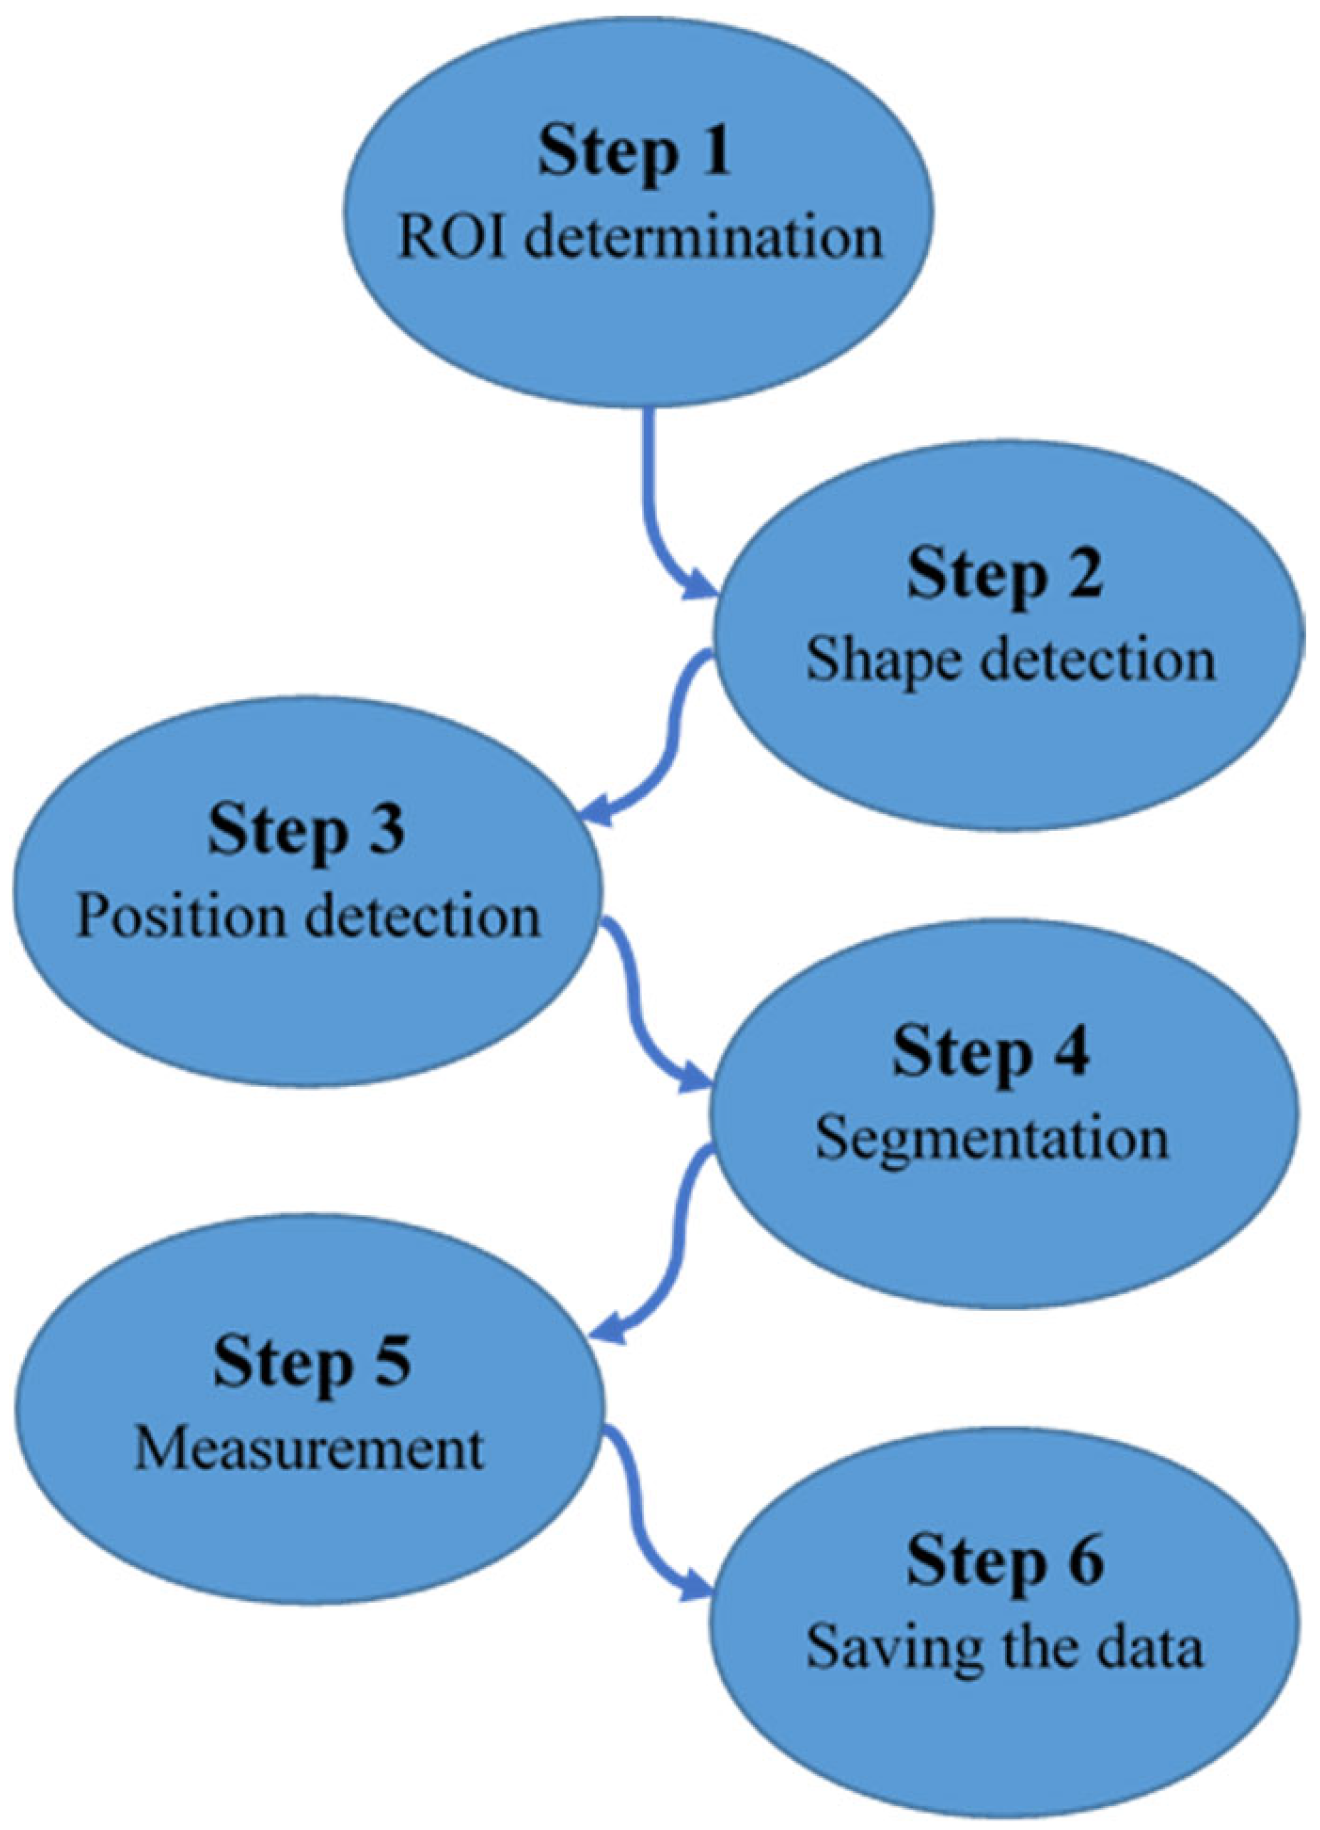
The developed software performs six main steps used for processing the input images, detecting the shape of the objects, and measuring the width and the height of the samples. The steps are graphically presented in Figure 3.
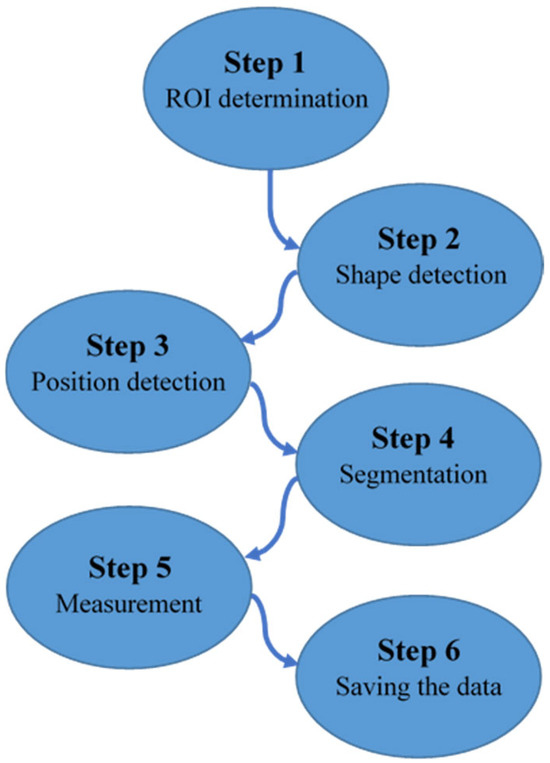
Figure 3.
Main steps of the program for automatic shape detection and size measurement.
The imperfections of the background plate, the type of the black paint that is used for covering the plate, and the directed light from the spot lights lead to the appearance of glare in the images. This necessitates the use of a method for ROI determination which covers only a small fraction of the background and the whole extruded object.
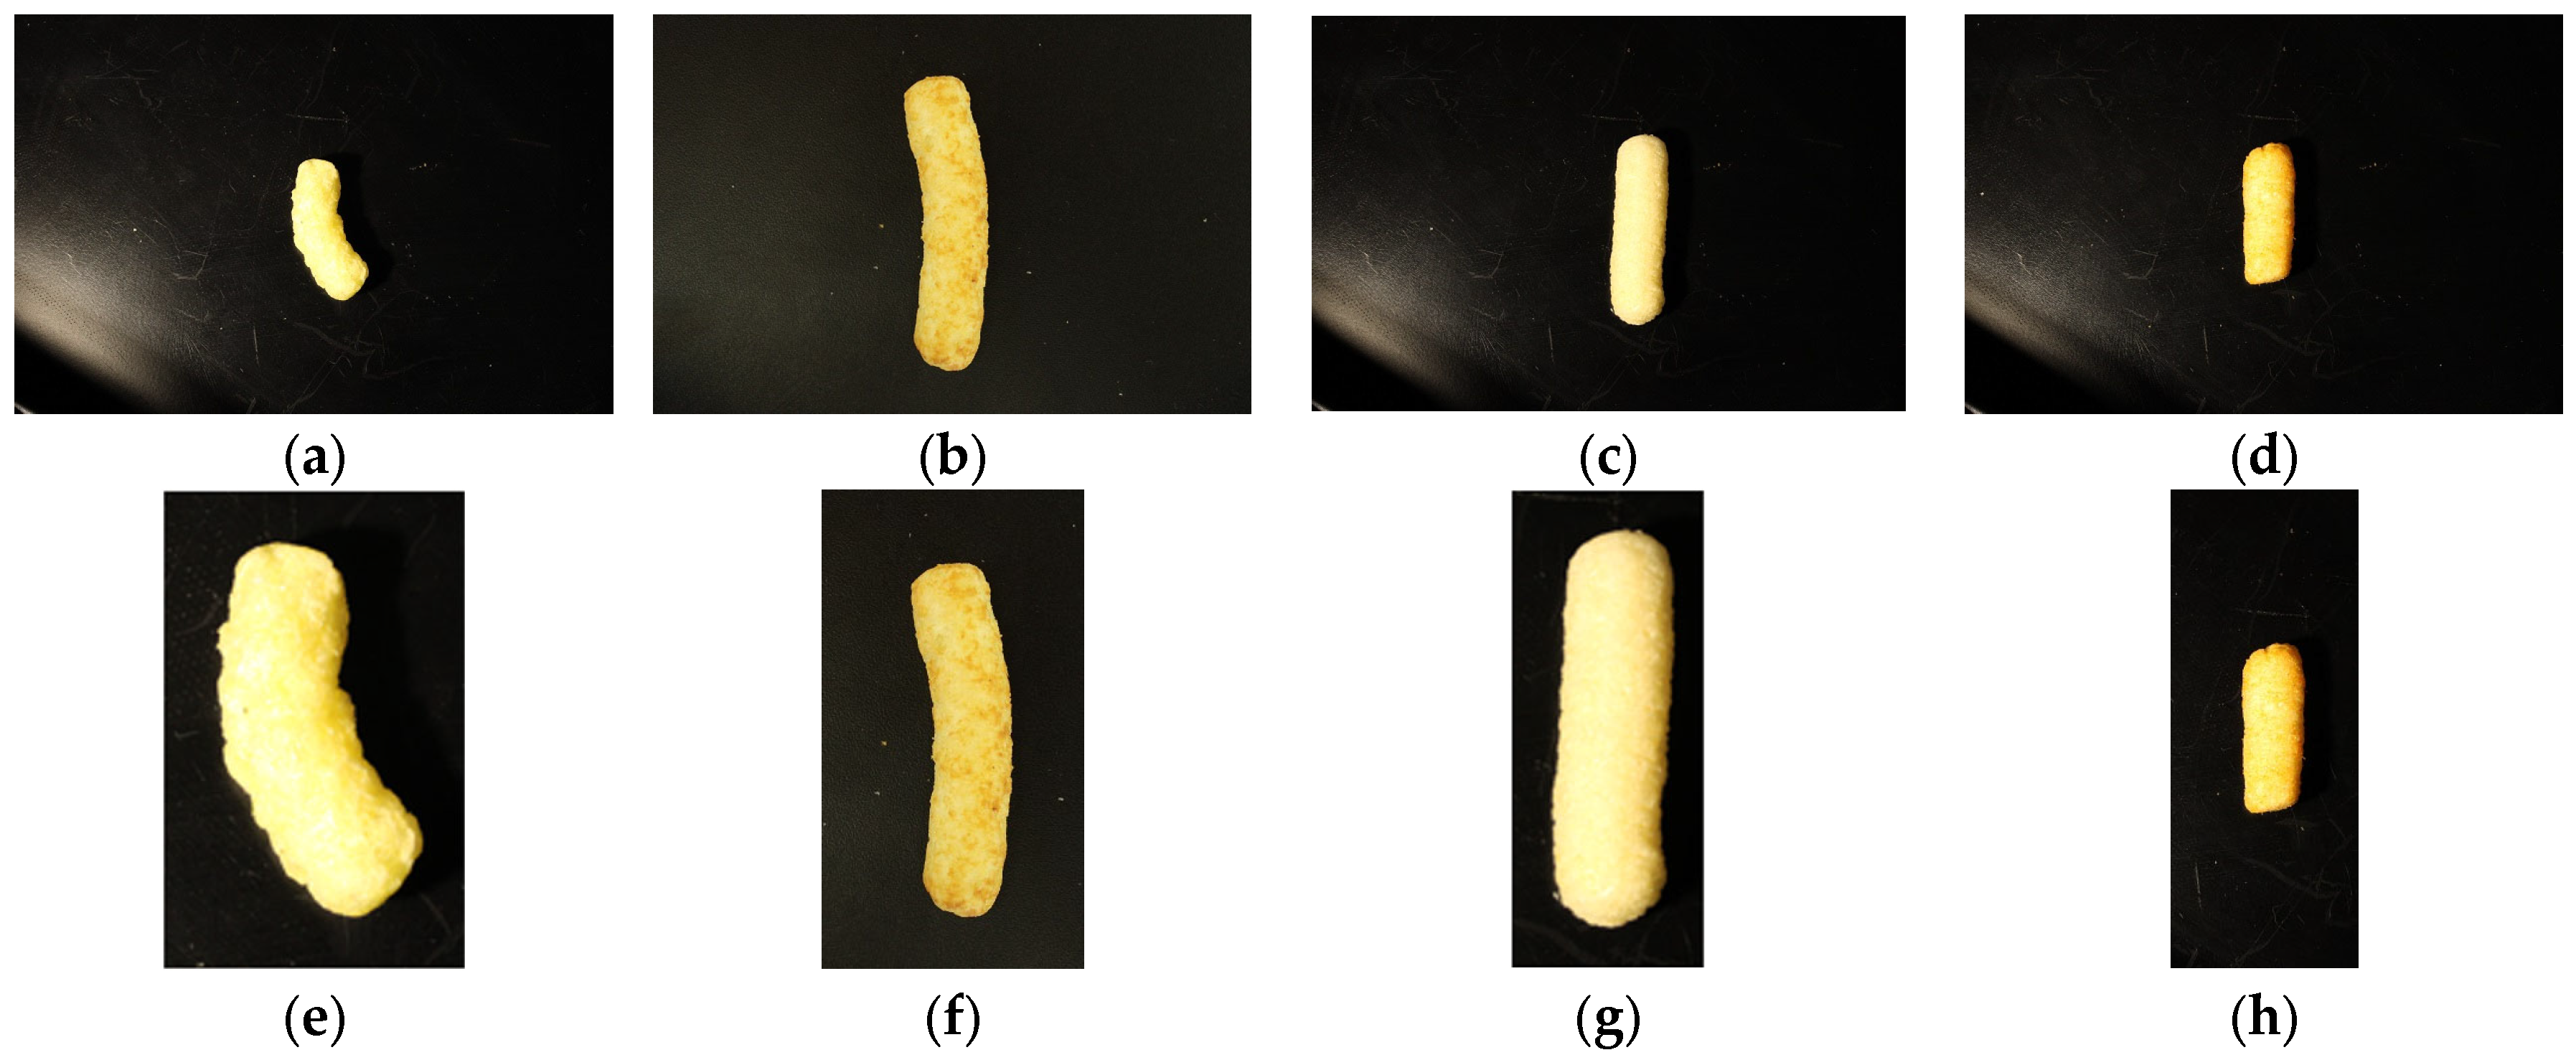
The method for automatic ROI detection is based on several well-known tools for image processing in ImageJ such as conversion from RGB to grayscale images; implementing an appropriate Auto threshold algorithm to make a binary image; using the Minimum method implemented in ImageJ [11,12] for separation of the shape of the object from the background; using Analyze particles to detect the biggest particle (object) in the scene; using tools for creating a selection based on the detected object with an irregular shape; creating a bounding box around the object and enlarging the box with a specific value; and creating a duplicate image from the selection and saving the image. Figure 4 shows a set of examples of the first step—ROI determination. The original images (a, b, c, and d) are automatically cropped based on the size and the shape of the objects, and the final images (e, f, g, and h) are used for further processing.
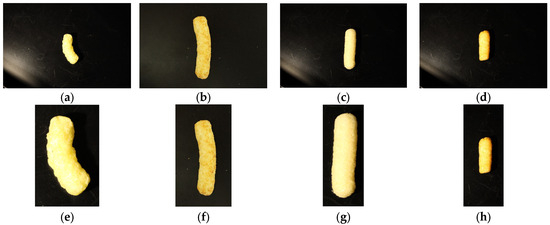
Figure 4.
Automated determination of the ROI: (a–d) initial images; (e–h) automatically cropped images.
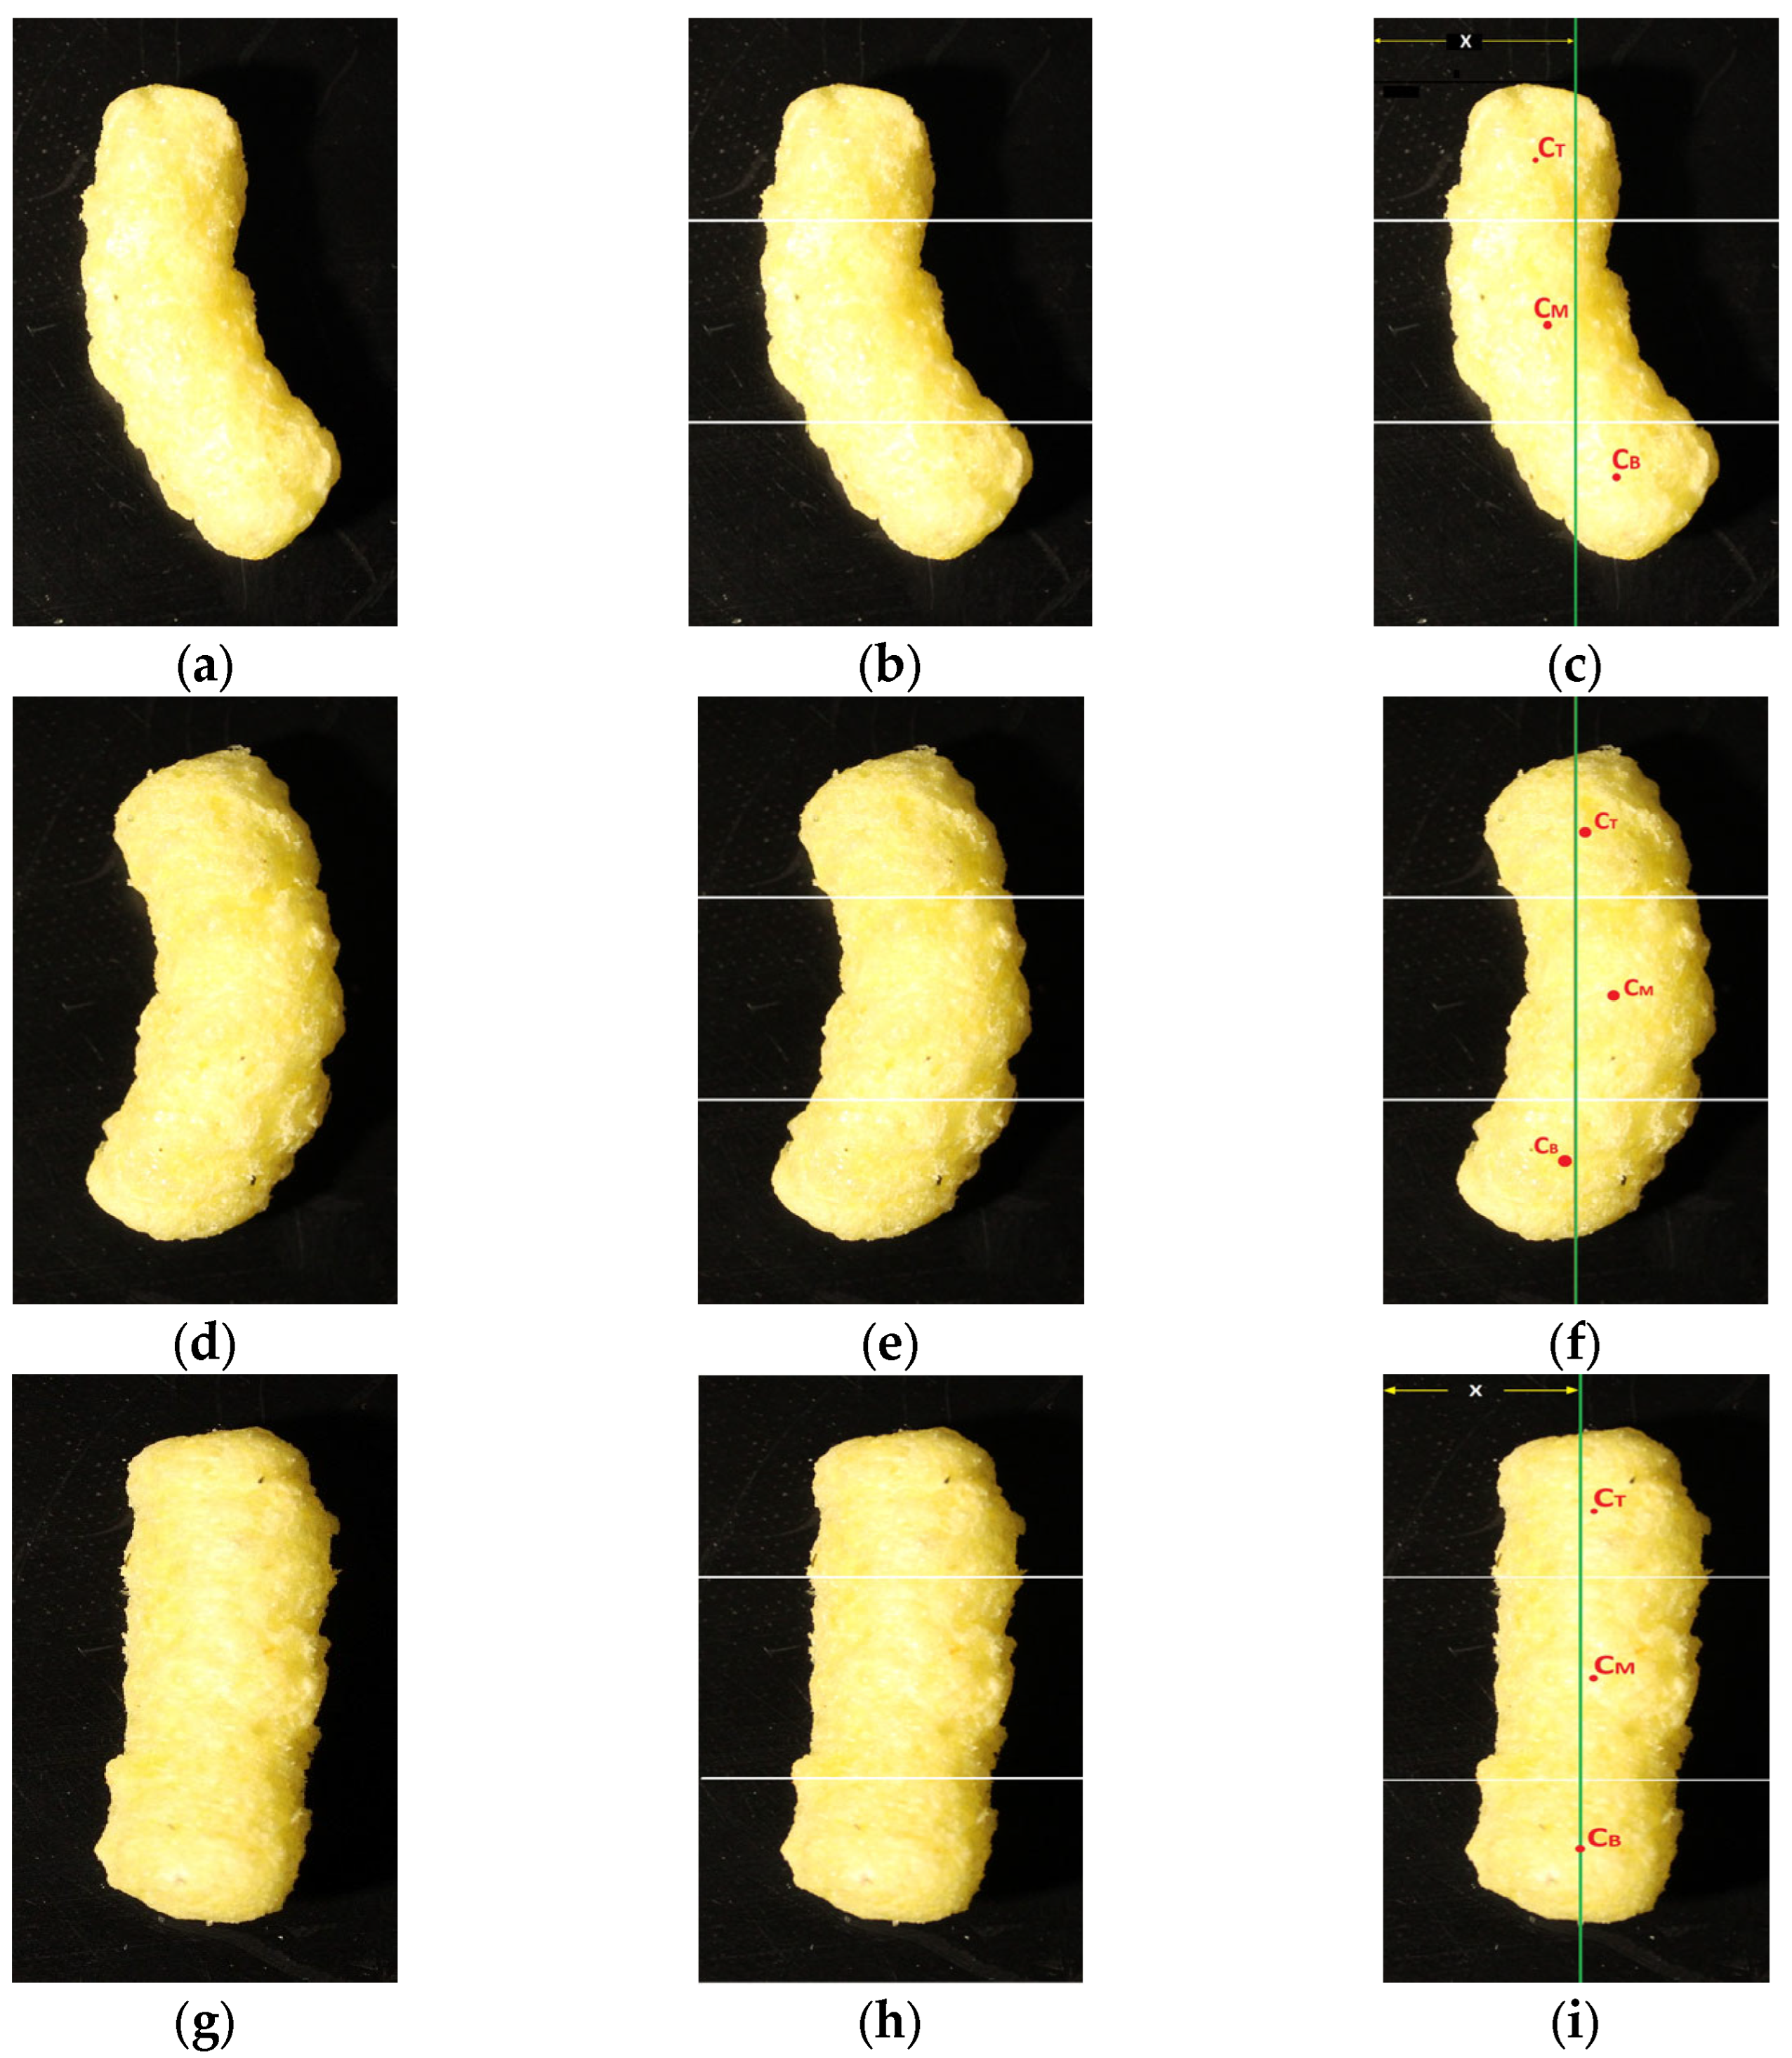
In the next step—shape detection—the original ROI images (Figure 5a,d,g) are sliced into three images (Figure 5b,e,h) with equal height.
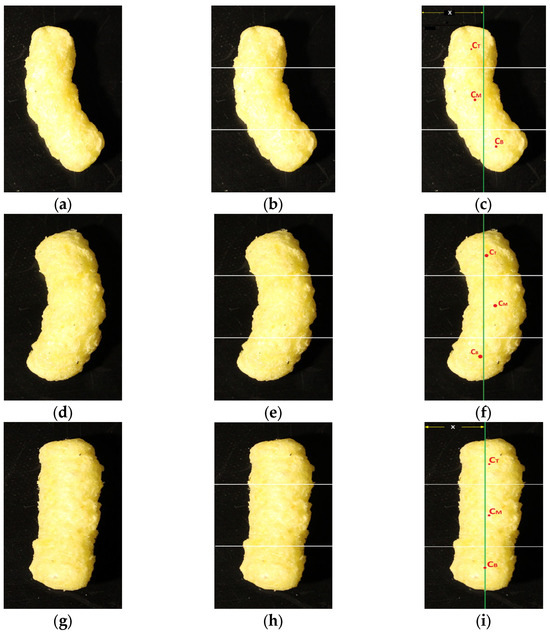
Figure 5.
Automatic shape and position detection: (a) original images, left-curved, right-curved (d), and straight (g); dividing the image into three equal parts (b,e,h); determining the position of the points CT, CM, and CB (c,f,i).
For each of the slices, the middle vertical line is generated and the X coordinate of the line (X = ½ ImageWidth) is taken. Additionally, for each slice (top, middle, and bottom), the coordinates of centroid points, respectively, CT, CM, and CB, are measured (Figure 5c,f,i). If X coordinates of points CT or CB are further away than the middle line and X coordinate of the point CM is less than or greater than X coordinate of points CT or CB, it means that the object is curved. In Figure 5c, the points CT and CB have X coordinates away from the middle line (above 60 pixels) and the X coordinate of the point CB is much further away (above 60 pixels) from the X coordinate of the central line. In Figure 5f, the points CT and CB have X coordinates very close to the middle line (below 40 pixels) but the point CM has an X coordinate away from the middle line. This means that the object is curved. Similarly, when a straight objects occurs, the values for X coordinates of the centroid points are measured and if the obtained values are in close range of the middle line (below 45 pixels) of the image it can be concluded that the objects are straight (Figure 5i). The horizontal distance between the points CT and CB with respect to the middle line is established experimentally.
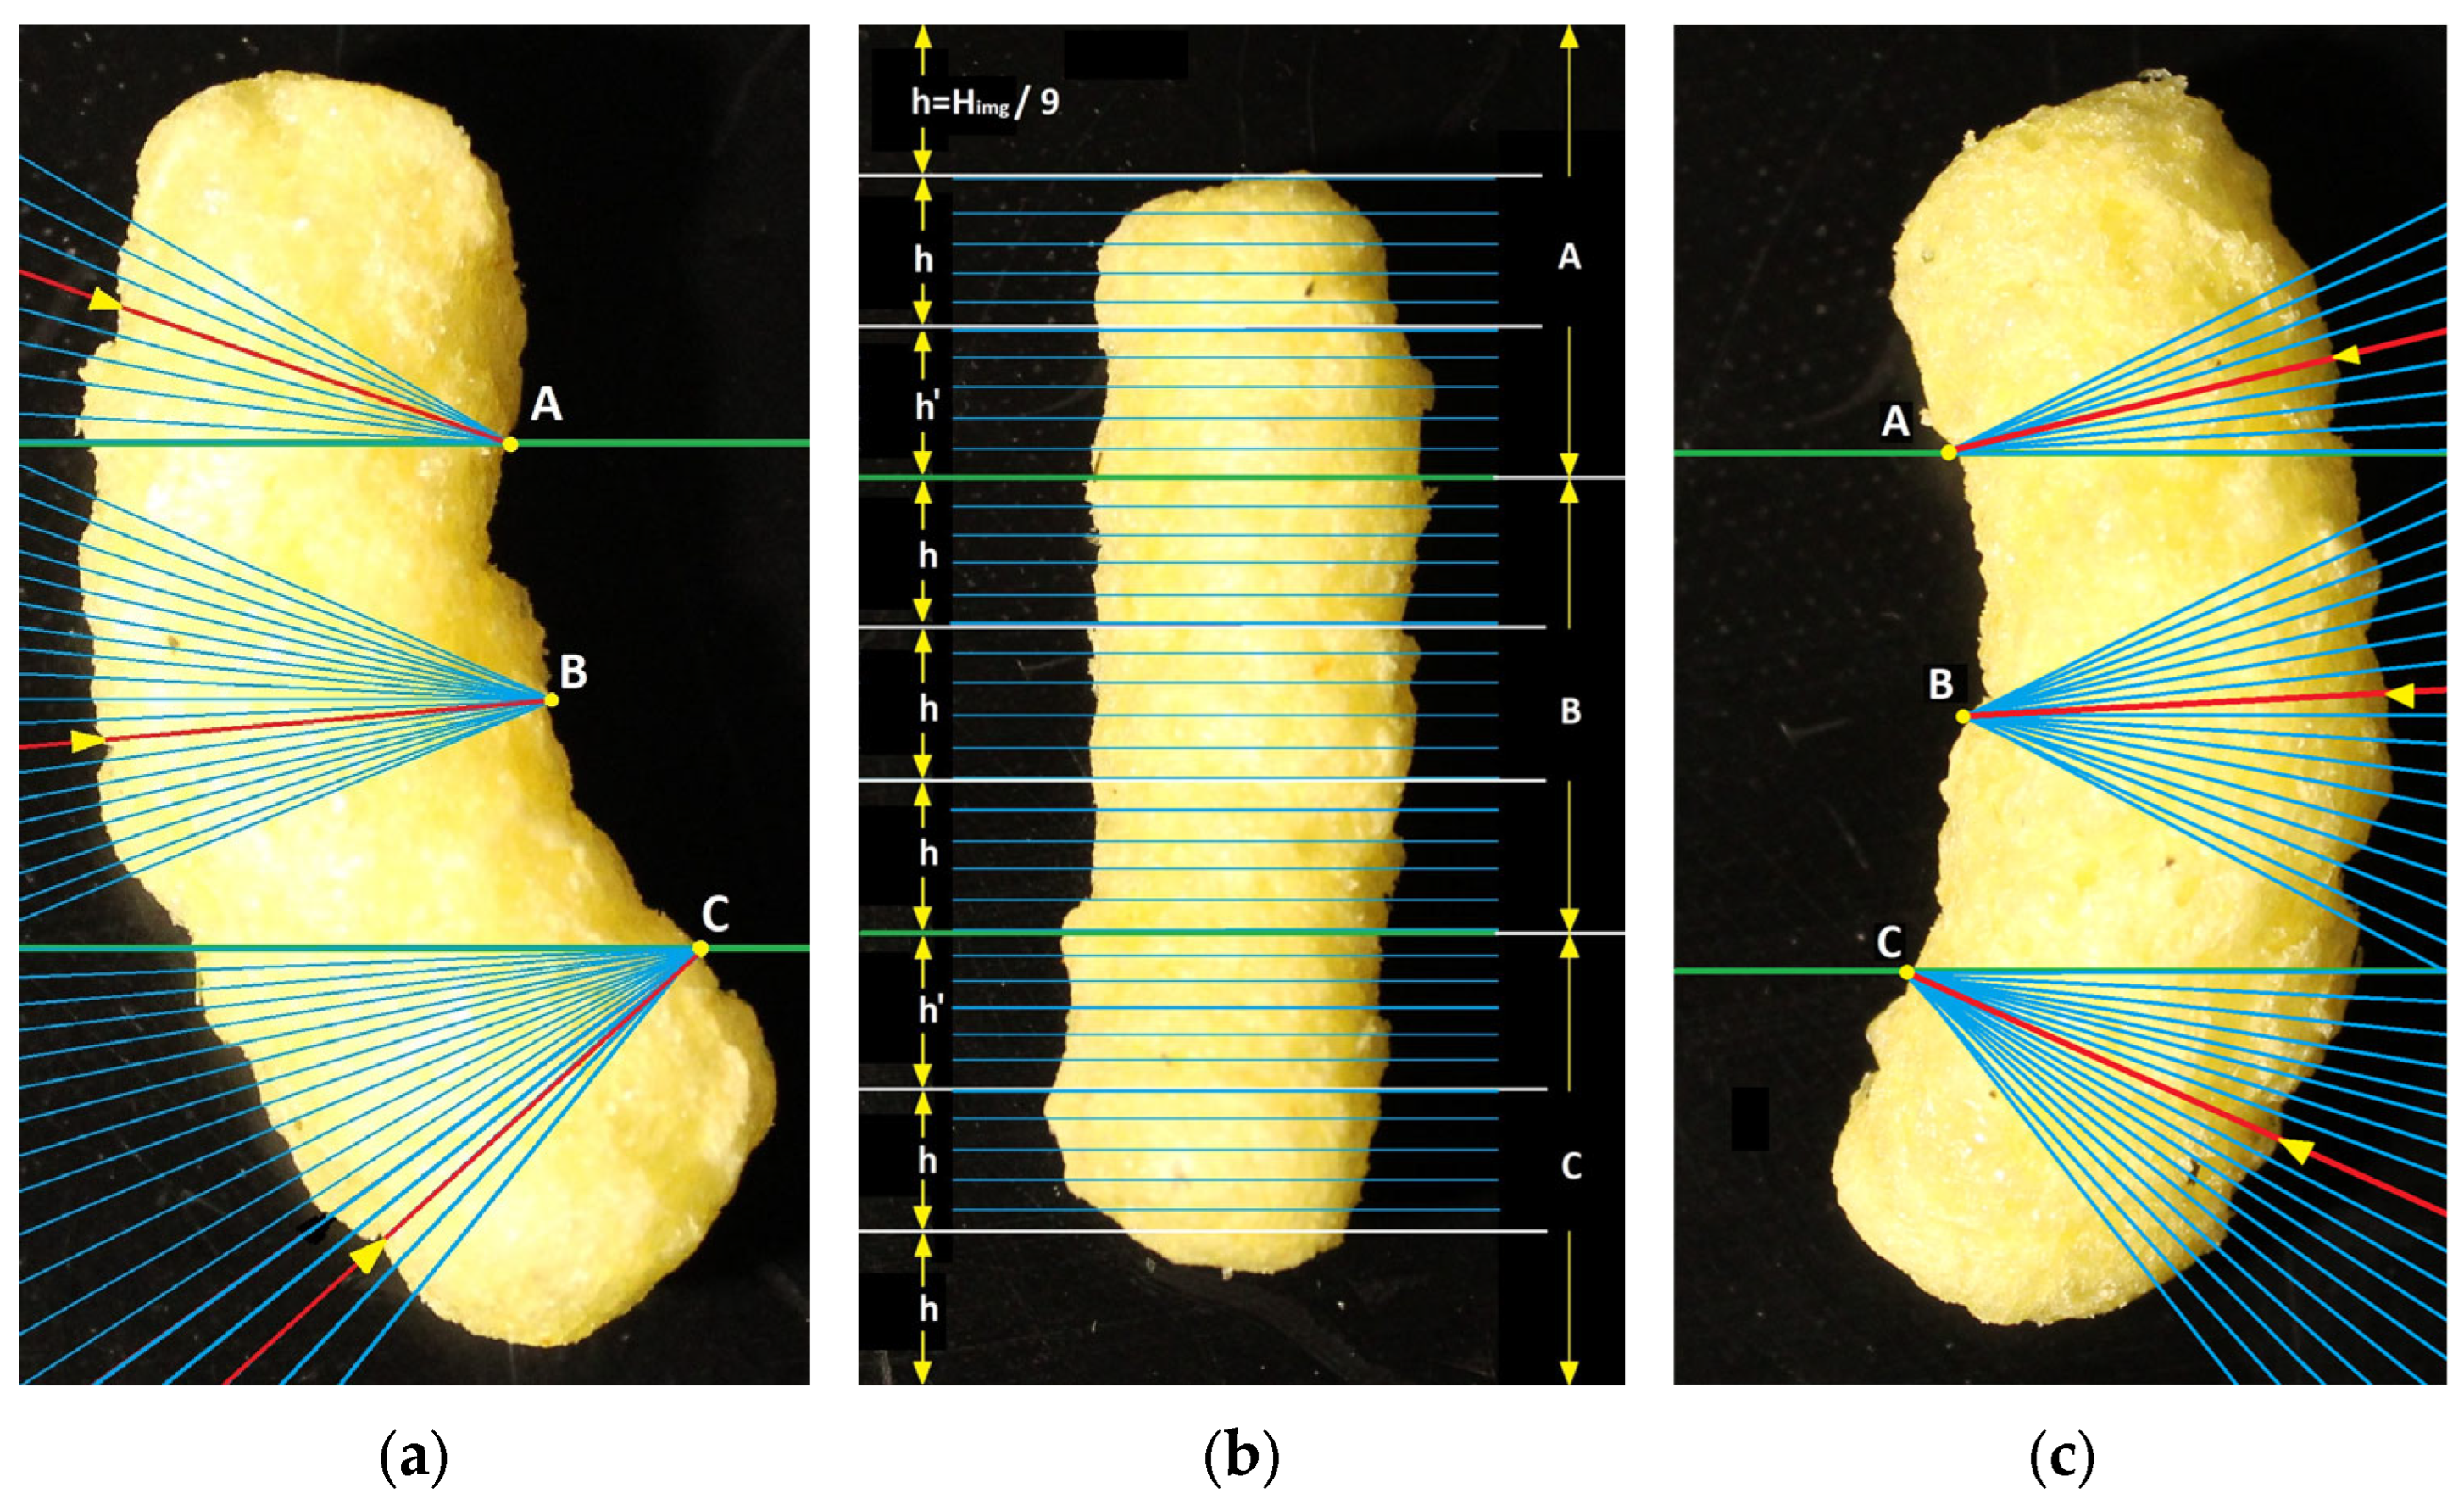
The algorithm of the program continues with the step for position detection in which the original ROI image is cut into three equal-sized sections. The pixels in each section are iterated row by row and the curvature is algorithmically determined (left-curved as shown in Figure 6a or right-curved as in Figure 6c). After shape detection, the position of the points A, B, and C is defined and they are placed in the concave part of the object. For curved objects, the top section is considered to be between point A and the upper bound of the image; the middle section is from point A to point C; and the bottom section is from point C to the lower bound of the image (Figure 6a). Similarly, the image with the straight object is divided into three equal-sized sections—A, B, and C (Figure 6b)—and in addition each section is divided three more times in order to separate the top and the bottom ends of the extruded sample. The height (h) of each subsection is equal to the height of the image (Himg) divided by 9 (Figure 6b).
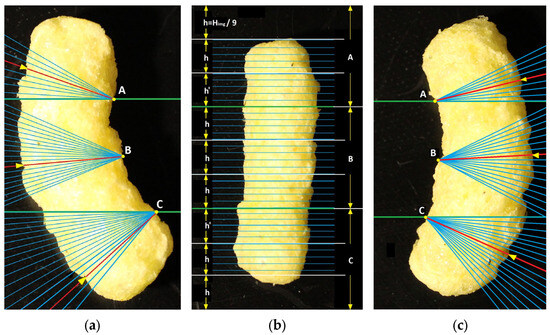
Figure 6.
Approach for automatic computer-based measurement of the width on left-curved objects (a), straight objects (b), and right-curved objects (c).
The program continues with the generation of measurement lines. When a curved object is processed, different numbers of measurement lines are generated depending on the section as follows: nine measurement lines for the top section of the image (Figure 6, point A); eighteen measurement lines for both the middle section and the bottom section. The bottom section needs double the number of lines in comparison to the top section because these types of samples are curved and inclined. When a straight object is detected and processed for each subsection of the image (except for the very top and the very bottom subsections), five measurement lines are generated and positioned at equal distance from each other (Figure 6b). In order to measure the width in sections A and C of the object, only the lines from the first one-third subsection that is close to the middle section are taken into account. The program uses all five lines from each meaningful subsection (h’) and calculates the average width. The width of the section B is calculated as the average of all fifteen lines in this section.
3. Results and Discussion
Four different brands of Bulgarian extruded corn snacks are used in this research. The tested snack brands differ from each other in their nutritional value (as shown in Table 1) and their taste. Some of the brands have additives such as pepper and dill.
From each brand, five samples are randomly taken and the first reference method based on using a handheld caliper for measuring the size of the objects is applied. The width of each extruded object is measured at three points (top, middle, and bottom) as shown in Figure 1a,c. The average values are calculated and the results for the width of each sample are shown in Table 2 in the second column from left to right (Average width, caliper [mm]). After performing the reference method, each sample is placed inside of a specially developed experimental setting with a determined light source and a digital camera. A second computer-based reference method is performed. This method is based on ImageJ tools for digital image processing and the width is manually measured by using the cropped images. Table 2 (in the third column “Average width, ImageJ tools [mm]”) shows the average results for the width obtained after performing this method.

Table 2.
Results for the width of all samples from the four brands using manual and computer-based methods.
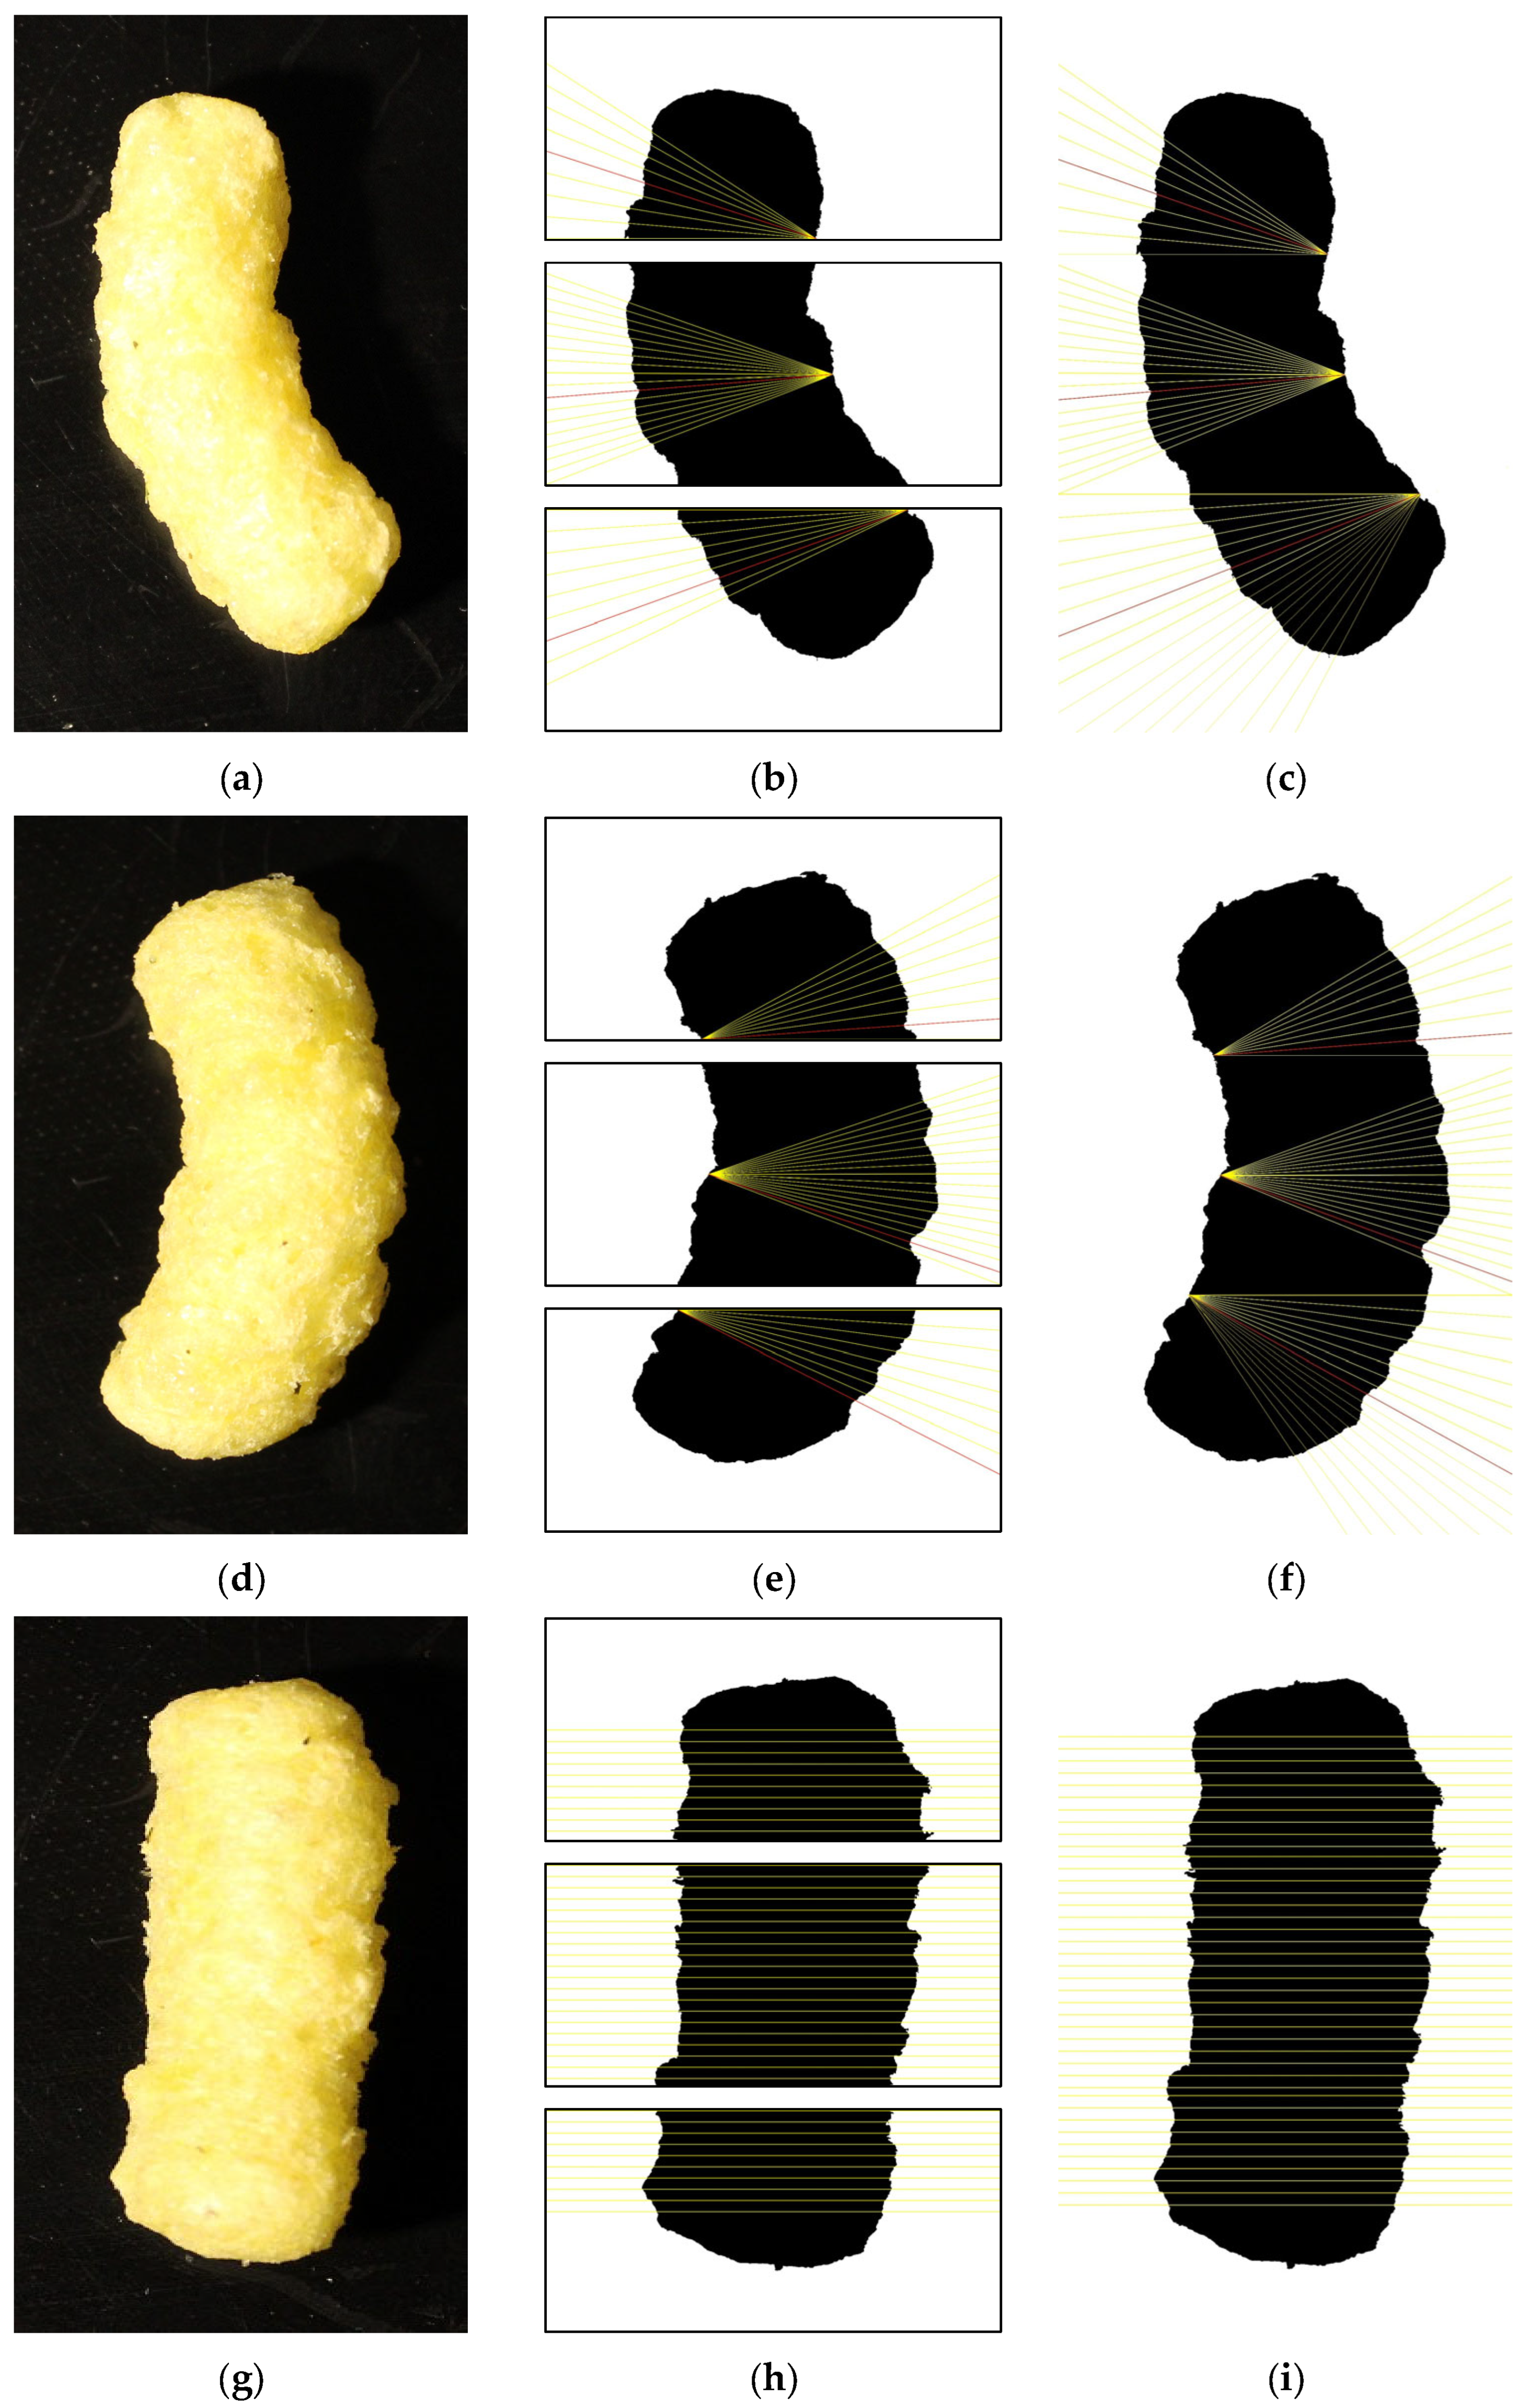
To perform the fully automatic method, the initial bitmap images are processed using the algorithm from Figure 3 and a set of resulting images are shown in Figure 7.
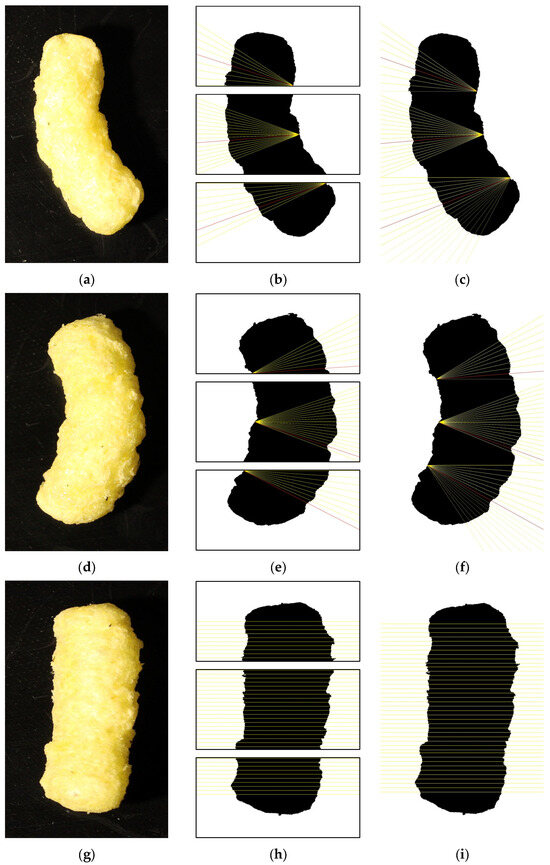
Figure 7.
Set of result images after performing the approach for automatic computer-based measurement—original images (a,d,g); left-curved objects (b,c); right-curved objects (e,f); straight objects (h,i).
The results for the fully automatic computer-based method are shown in the rightmost column in Table 2. As can be seen from the results, the average width for all samples in all four brands, obtained after performing the fully automatic method, are close to the results obtained with the two reference methods (using a handheld caliper and ImageJ tools).
In addition to the width, another visual characteristic of the extruded corn snacks is analyzed. The height of the extruded objects is measured using the same basic reference and computer-based methods as shown in Figure 1b,d. The results obtained from the three methods are shown in Table 3. As can be seen, the results obtained using ImageJ tools and the automatic method are very close to each other, but not so close to the results obtained with the caliper.

Table 3.
Results for the height of all samples from the four brands using manual and computer-based methods.
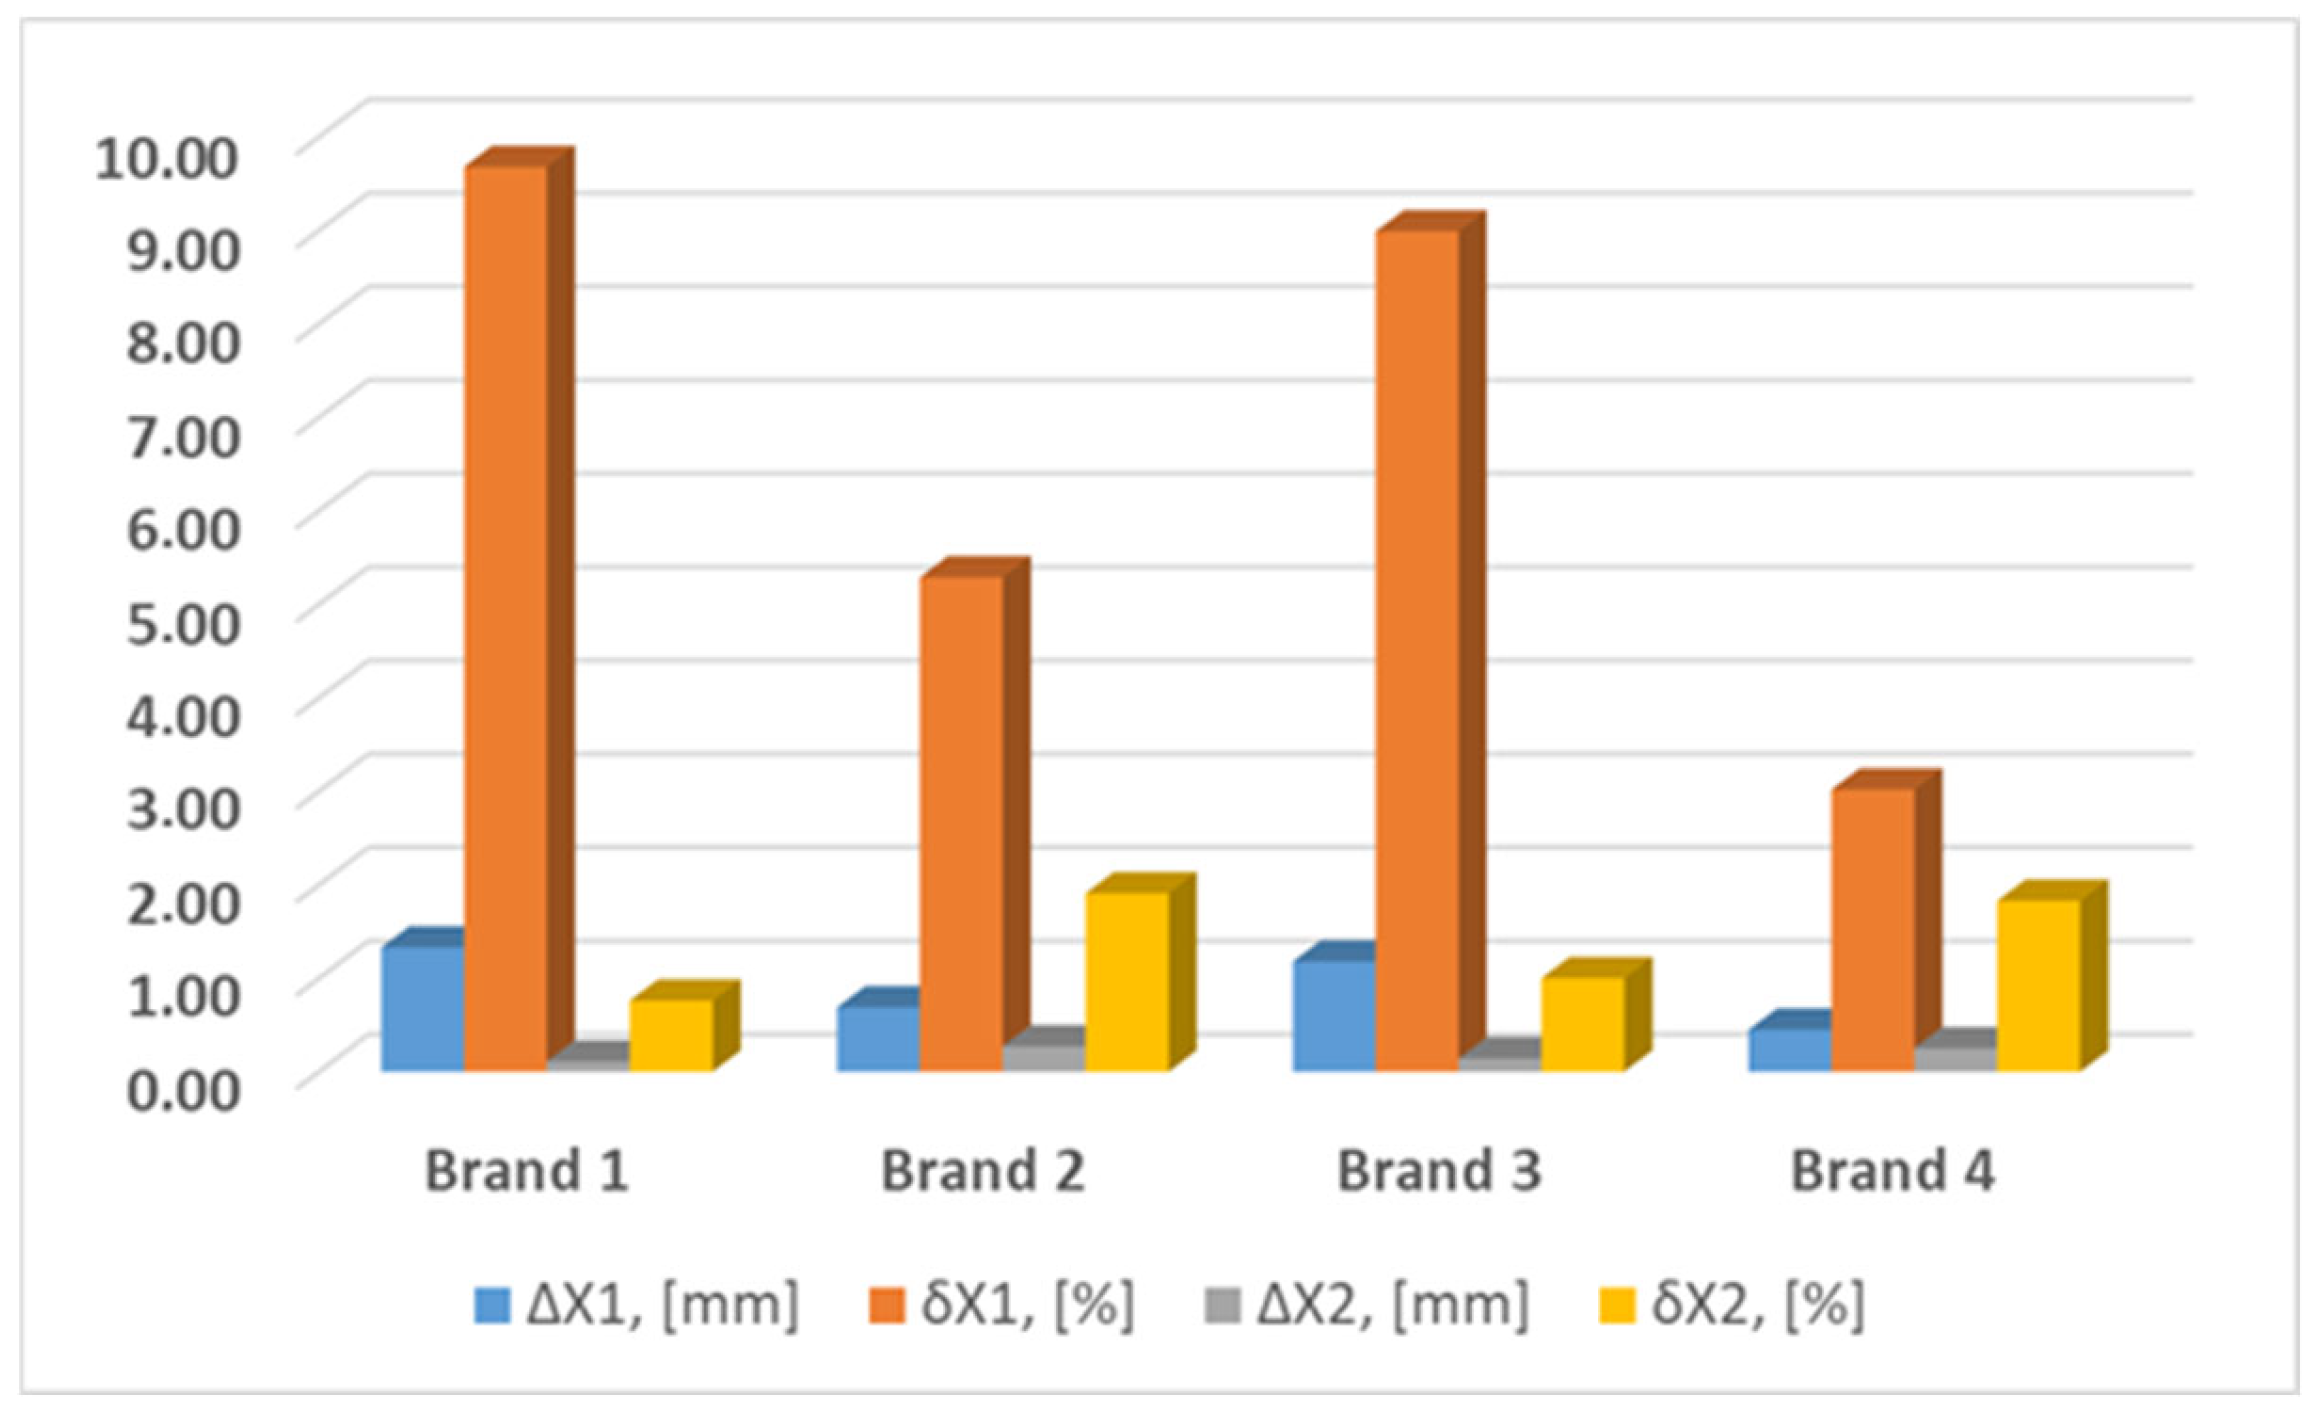
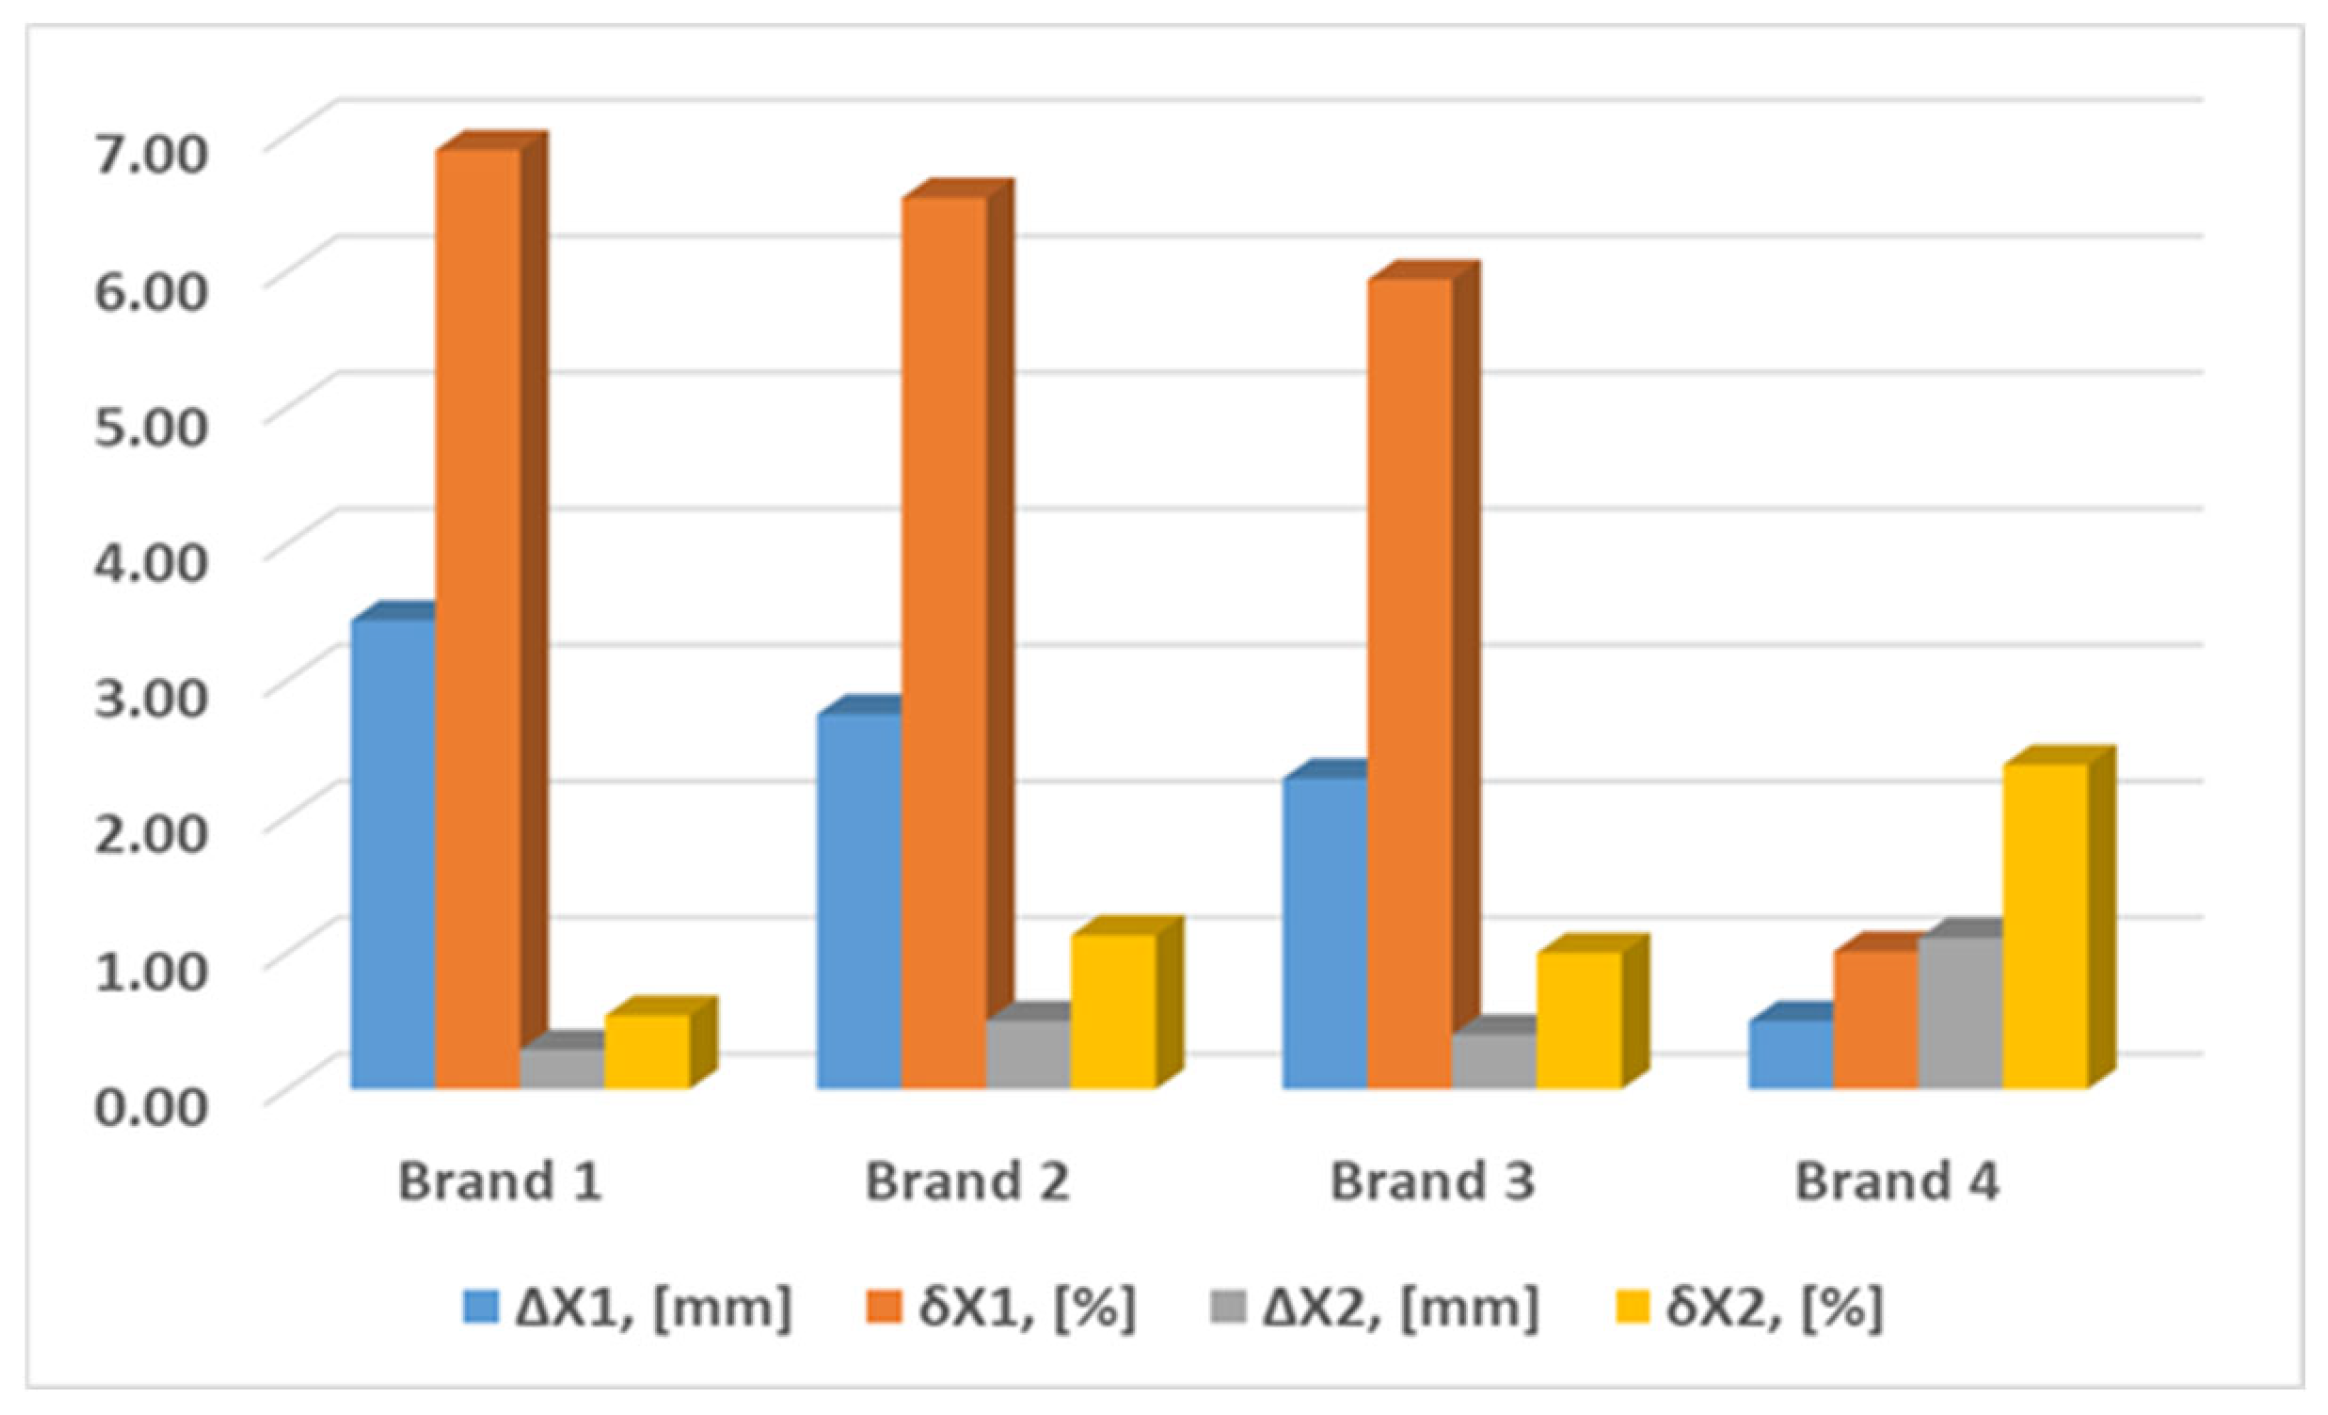
In order to determine the efficiency of the proposed approach for automatically measuring the size of extruded corn snacks, the absolute and relative errors are calculated, respectively, between the reference method with a handheld caliper and the automatic one (ΔX1, [mm]; δX1, [%]); and between the ImageJ-based method and again the automatic method (ΔX2, [mm]; δX2, [%]). The results for the width are shown in Figure 8. The graphic shows that the fully automatic method gives significant relative errors (δX1, [%]) for the samples of Brand 1 and 3 (between 8% and 10%). In contrast to this, the absolute error values for all brands are between 0 and 2 mm.
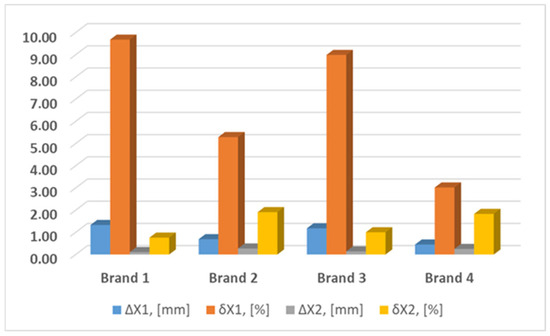
Figure 8.
Calculated errors for the width of the extruded objects.
The errors calculated based on the results obtained after performing the second ImageJ-based reference method for measuring the width of the evaluated objects are much smaller. The absolute errors ΔX2 are between 0 and 1 mm and the relative errors δX2 are between 0% and 2%.
Based on the data from Table 2, additional statistical analysis (correlation) for the average width is undertaken and the results are shown in Table 4. The correlation analysis shows that the highest coefficient (0.94) is obtained between the reference method based on ImageJ tools and the automatic one.

Table 4.
Results for the width calculated after performing correlation analyses.
After measuring the height of all tested samples by the reference method and the two computer-based methods, the same types of errors, ΔX1, δX1, ΔX2, and δX2, are calculated and the results are presented in Figure 9. The graphic shows that the absolute error (ΔX1) obtained after performing the reference method based on caliper measurement and the automatic method is between 0 mm and 3.5 mm, and the relative error (δX1) is higher—between 5% and 7% for Brand 1, Brand 2, and Brand 3. Only for Brand 4 is the relative error between these two methods smaller than 1%. In comparison, all brands have an absolute error (ΔX2) smaller than 1 mm for the measured height after performing the method based on ImageJ tools and the automatic one. The relative error (δX2) calculated for Brand 1, Brand 2, and Brand 3 is smaller than 1%. Only for Brand 4 is the error slightly above 2%.
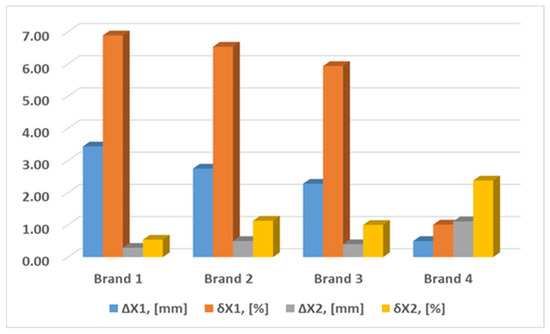
Figure 9.
Calculated errors for the height of the extruded objects.
Based on the data from Table 3, a correlation analysis for the average height is undertaken and the results are shown in Table 5.

Table 5.
Results for the height calculated after performing correlation analyses.
The results show that the two computer-based methods (based on ImageJ tools and the automatic one) give coefficients of correlation close to 1.
4. Conclusions
The current research proposes a computer-based approach for automatic determination of some visual characteristics of extruded foods with specific irregular shape (corn snacks) using methods of computer vison that are adapted and implemented in the open-source software ImageJ. Thus, the current research supports contemporary trends for wide accessibility of software tools, which help to provide significant advancement in science and practice.
The main contributions of this research are the adaptation of mathematical approaches and well-known digital image processing methods and their implementation in a system for nondestructive determination of shape and dimensions of corn snacks. The flexibility of the open-source software ImageJ and the methods for image segmentation and measurement, which are built into it, gives the opportunity to develop a system that eliminates the subjective effects of manual measurements.
Based on the results from this research and both the calculated errors for the width and the height, and obtained coefficients after performing correlation analyses, the conclusion can be that the automatic method and the measurement method based on using ImageJ tools can be effectively used to determine the width and the height of extruded snack foods. The computer-based manual method (based on ImageJ tools) for measuring the dimensions of extruded snacks can replace and significantly improve the accuracy of the method based on using a handheld caliper.
The higher error ΔX1 calculated between the reference method using a handheld caliper and the automatic method, obtained after measuring the width of the samples, can be assumed to be due to the uneven surface of the extruded foods and the subjective effect of the manual measurement. The ImageJ tools for digital image processing and the presented automatic approach allow the performance of precise measurements and the subjective effect is eliminated.
In the future, the work will continue with the accumulation of more experimental data in order to improve the method for shape determination of each extruded snack sample placed at a different angle in a horizontal relation to the experimental setting bottom plate. In addition, future work will continue to study opportunities for the evaluation of other visual characteristics of extruded foods.
Author Contributions
Conceptualization, A.D., A.B.-A., R.G. and H.A.; methodology, software, validation, formal analysis, investigation, resources, A.D., A.B.-A. and R.G.; data curation, A.D. and H.A.; writing—original draft preparation, A.D.; writing—review and editing, A.B.-A., R.G. and H.A.; visualization, A.D. and H.A. supervision, A.B.-A. and R.G.; project administration, A.D.; funding acquisition, A.D. All authors have read and agreed to the published version of the manuscript.
Funding
This research is funded by grants from the national program “Young scientists and post-PhD students-2”, module “Young scientists”, according to the project “Application of computer vision methods in determining visual characteristics of extruded foods”.
Institutional Review Board Statement
Not applicable.
Informed Consent Statement
Not applicable.
Data Availability Statement
Any data not contained within this article can be provided by the authors on request.
Acknowledgments
The authors would like to express their gratitude to the management team of the University of Food Technologies–Plovdiv for the opportunity to participate in the national program “Young scientists and post-PhD students-2”.
Conflicts of Interest
The authors declare no conflicts of interest.
References
- Zhu, L.; Spachos, P.; Pensini, E.; Plataniotis, K.N. Deep learning and machine vision for food processing: A survey. Curr. Res. Food Sci. 2021, 4, 233–249. [Google Scholar] [CrossRef] [PubMed]
- Yi, C.; Qiang, N.; Zhu, H.; Xiao, Q.; Li, Z. Extrusion processing: A strategy for improving the functional components, physicochemical properties, and health benefits of whole grains. Food Res. Int. 2022, 160, 111681. [Google Scholar] [CrossRef] [PubMed]
- Kojić, J.; Belović, M.; Krulj, J.; Pezo, L.; Teslić, N.; Kojić, P.; Tukuljac, L.P.; Šeregelj, V.; Ilić, N. Textural, Color and Sensory Features of Spelt Wholegrain Snack Enriched with Betaine. Foods 2022, 11, 475. [Google Scholar] [CrossRef] [PubMed]
- Fan, F.H.; Ma, Q.; Ge, J.; Peng, Q.Y.; William, W.R.; Tang, S.Z. Prediction of texture characteristics from extrusion food surface images using a computer vision system and artificial neural networks. J. Food Eng. 2013, 118, 426–433. [Google Scholar] [CrossRef]
- Amer, S.A.; Rizk, A.E. Production and evaluation of novel functional extruded corn snacks fortified with ginger, bay leaves and turmeric powder. Food Prod. Process. Nutr. 2022, 4, 4. [Google Scholar] [CrossRef]
- Yizhou, M.; Potappel, J.; Chauhan, A.; Maarten, A.I.S.; Boom, R.M.; Zhang, L. Improving 3D food printing performance using computer vision and feedforward nozzle motion control. J. Food Eng. 2023, 339, 111277. [Google Scholar] [CrossRef]
- Chalamov, Y.; Simitchiev, A.; Nenov, V.; Danev, A.; Andreeva, H. Effect of propeller use on residence time distribution (rtd) in single-screw cam-flow rice semolina extrusion. BIO Web Conf. 2024, 102, 03003. [Google Scholar] [CrossRef]
- Finlayson, G.D. Colour and illumination in computer vision. Interface Focus 2018, 8, 4. [Google Scholar] [CrossRef] [PubMed]
- Ketelaere, B.D.; Wouters, N.; Kalfas, I.; Belleghem, R.V.; Saeys, W. A fresh look at computer vision for industrial quality control. Qual. Eng. 2022, 34, 152–158. [Google Scholar] [CrossRef]
- Schneider, C.A.; Rasband, W.S.; Eliceiri, K.W. NIH Image to ImageJ: 25 years of image analysis. Nat. Methods 2012, 9, 671–675. [Google Scholar] [CrossRef] [PubMed]
- Gabrova, R.; Danev, A.; Ganchovska, V.; Andreeva, H. Explore the possibilities for objective assessment of some beer quality indicators. IOP Conf. Ser. Mater. Sci. Eng. 2021, 1031, 012070. [Google Scholar] [CrossRef]
- Prodanov, D.; Verstreken, K. Automated Segmentation and Morphometry of Cell and Tissue Structures. Selected Algorithms in ImageJ. In Molecular Imaging; Schaller, B., Ed.; University of Paris-Sud: Gif-sur-Yvette, France, 2012; pp. 183–208. [Google Scholar] [CrossRef]
Disclaimer/Publisher’s Note: The statements, opinions and data contained in all publications are solely those of the individual author(s) and contributor(s) and not of MDPI and/or the editor(s). MDPI and/or the editor(s) disclaim responsibility for any injury to people or property resulting from any ideas, methods, instructions or products referred to in the content. |
© 2025 by the authors. Licensee MDPI, Basel, Switzerland. This article is an open access article distributed under the terms and conditions of the Creative Commons Attribution (CC BY) license (https://creativecommons.org/licenses/by/4.0/).

