Abstract
The MTM-1 analysis has a very high level of detail and takes a very long time for to perform. A possible way to reduce the performance time while maintaining accuracy is by using Industry 4.0 technologies. The goal of the article is to investigate the potential for the implementation of Industry 4.0 technologies in the preparation of MTM-1 analysis for improving its speed and accuracy in the automotive industry, based on a unique survey. The results indicate that speed reduction and accuracy increase mainly depend on which Industry 4.0 technology is chosen and its capabilities.
1. Introduction
One of the main tasks of industrial engineering when creating a new product line during a project is determining the cycle time for product assembly. It is known that when the product design is clarified, the following is implemented to determine the assembly process, process time execution and the assembly line design. These three tasks are interrelated—the determination of the process includes consideration of all variants for the assembly of the product, the execution time (cycle time) for each variant and, lastly, defining the number of workstations and distribution of each variant step to the individual workstations so that the production line is balanced. The cycle time is the time for which the process is executed on every individual workstation and on the production line as a whole. The line is balanced when all its stations have equal (or nearly equal) cycle time, which is also the cycle time of the line itself. It is also known that the cycle time must be less than the takt time in order to fulfill a customer order. It also depends on the number of workstations—more workstations mean less cycle time but also higher investment costs. It can be seen from the above described so far that the determination of the production line cycle time is a very complicated task, but it is also essential for defining line productivity and capacity, and therefore, the investment costs and revenues.
During the project, in the engineering design phase, there are different ways to determine the cycle time of a manual or semi-automated assembly process. The predetermined motion time systems (PMTSs) have found the widest usage because in the beginning of the design phase, often, there were no physically manufactured single components and products (in the best case scenario, only a 3D-printed prototype of the product is available). There are mainly two PMTS—Methods-Time Measurement analysis (MTM) and Maynard Operation Sequence Technique analysis (MOST). The MTM analysis was created in 1948 by Maynard and his team after 8 years of video analysis of industrial processes [1]. In the years after that, different variants of MTM analysis have been developed as the Maynard-created first one was renamed MTM-1.
The MTM-1 analysis includes 17 basic motions incorporated into three groups:
- Fingers/Hands—Reach, Grasp, Move, Turn, Position, Release, Disengage and Apply Pressure;
- Eye Motions—Eye Focus and Eye Travel;
- Body Motions—Foot Motion, Leg Motion, Side Step, Turn Body, Bend/Stoop/Kneel, Sit/Stand and Walk.
Every single action is a combination of these basic motions. Each single basic motion is influenced by certain factors such as distance to the part, shape, dimensions, weight of the part, etc. The result of the analysis of the video-recorded industrial processes by Maynard and his team is the creation of matrices with unique codes for each of the individual motions where the codes take into account the factors affecting the particular motion. In these matrices, the time to perform the motion is written to each unique code.
A characteristic feature of MTM-1 analysis is that it includes 17 basic motions, has a very high level of detail and takes a very long time to perform. In ideal conditions, it takes 1 h to perform the analysis for a cycle time of 10.8 s [2]. Taking into account the features of the analysis, despite the great advantage of the very high accuracy of the determination of the cycle time—the long time taken for performing the analysis is its biggest disadvantage. As a result, it is replaced with another type of analysis with a shorter time to perform despite its known relative inaccuracy.
A possible way to reduce the time for preparing the MTM-1 analysis while maintaining its accuracy is by using Industry 4.0 technologies. This has also been marked as an opportunity by MTM Association e. V. in their blog article [3]. There are many types of Industry 4.0 technologies. Some of the most widely known include Additive Manufacturing (3D printing), advanced robotics and cobots, artificial intelligence, augmented reality, virtual reality, human–machine interfaces, machine-to-machine and machine-to-human communication, blockchain, Internet of Things, cloud-stored data, internet of services, digital transformation, big data, virtual simulations, autonomous vehicles and drones. Analyzing the main Industry 4.0 technologies, the following two variants can be used in the engineering design phase to determine the cycle time of a production line for manual or semi-automated assembly:
- Artificial Intelligence in combination with Big Data;
- Virtual Reality in combination with Virtual Simulations.
The introduction of Industry 4.0 technologies provides many opportunities for development, such as speed improvement, accuracy improvement, quality improvement, productivity improvement, etc. The goal of the article is to investigate the potential for the implementation of Industry 4.0 technologies in the preparation of MTM-1 analysis to improve its speed and accuracy in the automotive industry, based on a unique survey that has been conducted by 50 automotive industrial engineers in a total of 10 automotive OEMs and component supplier companies.
The paper is structured as follows: the review of the related work is performed in the next section, Section 3 shows our approach to conducting a unique survey by automotive industrial engineers and Section 4 describes an analysis of the results of the survey. The conclusion of the study is placed at the end of the paper.
2. Related Work
In modern times, as well as in the recent past, CAD design programs with the ability to create 3D models give the possibility for the use of virtual reality and artificial intelligence to perform MTM analysis. On the basis of the above and taking into account the novelty of the topic, a few studies have been carried out on the advantages and the problems of their use in the preparation of the MTM analysis of cycle time determination for assembling product.
Some of the investigations study the direct measurement of cycle time by virtual reality, motion recording devices and computer processing software. One of the articles investigates virtual reality-based time and motion study with support for real walking [4]. According to the authors of this research, the use of virtual reality will allow designers to automatically create track by sensors, and automatically analyze and validate the worker’s movement and the cycle time for any workstation, including the real walking between the stations, and it will happen for shorter time and with lower costs. The drawbacks of the research are that it is not pointed out which MTM analysis type is used (it can be assumed it is MTM-1) and which is the source of the recorded cycle times. If the source is the direct recording from the sensors, which are analyzed automatically by the system instead of using MTM-1 code matrices, this means the cycle times are not accurate. It has to also be noted that the automotive companies highly recommend avoiding walking, because according to the principles of motion economy, it is a loss of time. Another article examines the derivation of MTM-UAS analyses from virtual reality tools using MTMmotion [5]. The author has pointed out the completeness of VR data, the quality of the motion capture algorithm in the VR tool and the translation of motion data without checking the critical aspects which, if they are properly addressed, the suggested approach would help industrial engineers make it easier to proceed with analysis and plan workplaces. In another article, Gorobets et al. [6] explore a virtual reality-based approach in conducting MTM for manual workplaces. In this research, 21 participants have completed a task in a real and virtual workplace and their operational times were analyzed with MTM-2. The authors state as results that the MTM-2 values achieved in virtual reality and the real workplace are comparable. The drawbacks in this article are that the authors take the mean values of time for the task execution and, despite it being visible, do not take into account that for the same task there is a big time difference between the slowest and fastest participants for task execution in both the real workplace and virtual reality.
There are also investigations which implement the sensors as tools for detecting and tracking worker movements and the process cycle time. One of them proposes a system for sensor-based automatic analysis and evaluation of manual assembly processes [7]. A big issue in this research is that the sensors are positioned on parts, products, tools and operation materials instead of on the worker. This means the worker’s movements are not fully detected and tracked for analysis. It is also visible that MTM analysis in the system is used only for movements determination, but the cycle times are not measured. Some investigations use visual sensors and neural networks in order to detect, record and digitalize the operator’s hands movements or gestures movements of the hands using MTM analysis as a basis for it without cycle time determination [8,9,10,11]. In another article, Bellarbi et al. [12] propose an approach for the automatic generation of MTM-UAS codes using virtual reality and gesture recognition. It should be noted that the MTM-UAS codes are 29 while MTM-1 codes are more than 1600, which means it is an easily achievable investigation goal.
Another type of investigation examines the joint application of simulations and MTM. Breznik et al. [13] present an approach to solving the assembly line balancing problem using MTM-UAS and computer simulation software. The authors of this research have found the joint application can help minimize idle time and improve assembly line performance, resulting in cost reduction and efficiency increase. Kampa et al. [14] investigated workers’ operations in assembly line digital twin using MTM-UAS in computer simulation software.
There are very few articles about cycle time determination by the usage of artificial intelligence. Miller et al. [15] studied a manufacturing assembly time estimation using structural complexity metric trained artificial neural networks. Although the authors use the connectivity assembly time estimation methods, they use the MTM-based time values associated with the connectivity graphs. The main issues with the proposed neural network are that it is company-specific, which means it needs training in every single product within the companies and there is a 15% error in the time estimations if the engineers rely only on geometric parts information. In other research, Prinz et al. [16] introduced the hypothesis that human activity recognition in combination with artificial intelligence can be used for manual assembly to analyze cycle time as possibility for real-time and personalized measurement, which MTM is not able to provide. However, it has to be noted that real-time and personal measurements are not the purpose of MTM. The authors propose an approach where the time measurements are formulated as time series classification, which is a machine learning subdomain. Ansari et al. [17] examine human productivity through digital assistance system, where one of the research tasks is the measurement of operating time using the assistance system using MTM-UAS as a source.
The related work review shows that, despite the conducted research, there is no investigation of the needs, wants and expectations of the automotive industrial engineers or, in other words, the voice of customers about the implementation of Industry 4.0 technologies in preparing MTM analysis. This research is going to solve this investigation gap.
3. Resources and Methods
Surveys are a very commonly used method for obtaining the voice of customers. This research uses a specially designed survey which covers the most important questions about the Industry 4.0 technologies and their use as tools in determining the cycle time of assembly/production line. It consists of nine questions in total (including six closed and three open) and one Likert scale, which includes five questions with four possible options each. In order to avoid repeating the questions and Likert scale with their proposed answers and options are presented directly in the result and discussion section.
The survey was voluntary and anonymous, and it required respondents to have prior knowledge of the MTM method and Industry 4.0 technologies. This imposed careful searching for the right companies from the automotive industry and sending them a request to participate in the study. The companies which confirmed their participation were 10, including 3 automotive OEMs (from Europe-located plants) and 7 automotive components suppliers (5 of them from Bulgaria-located plants and 2 of them from Europe-located plants). All companies are global despite their plant locations. The survey was completed by 50 industrial engineers from the participating companies. General information about the respondents is shown in Figure 1, Figure 2, Figure 3 and Figure 4.
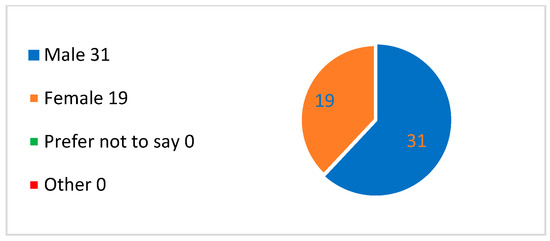
Figure 1.
Gender of the respondents.
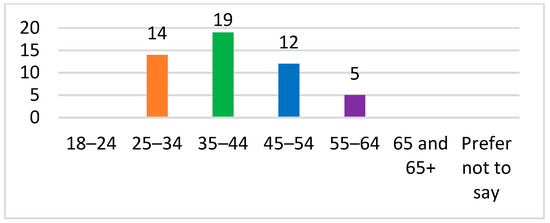
Figure 2.
Respondents’ age groups.
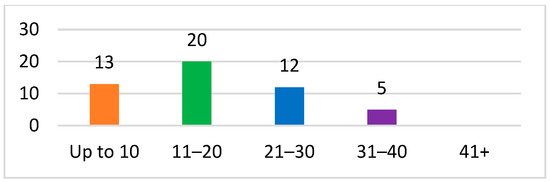
Figure 3.
Respondents’ years of engineering experience.
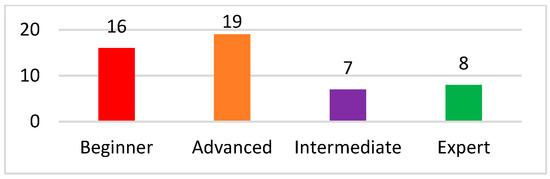
Figure 4.
Respondents’ level of knowledge for the Industry 4.0 technologies.
The general information about the respondents shows a good ratio of gender equality (62% of the respondents are males, 38% of the respondents are females); the age groups of respondents correspond to their engineering experience and 30% of the respondents have a higher level of knowledge about the Industry 4.0 technologies.
4. Results and Discussion
For better visualization, the survey questions and the results will be presented in several consecutive groups with the following discussion after each of them. The first group consists of closed-type questions with several proposed answers about the general respondents’ expectations about the accuracy and time for preparation of the MTM-1 analysis conducted with the use of Industry 4.0 technologies. The results are shown in Figure 5, Figure 6, Figure 7 and Figure 8.
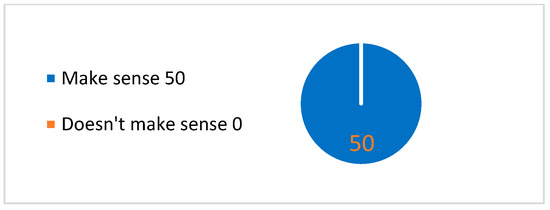
Figure 5.
Does it make sense to use Industry 4.0 technologies in determining the cycle time of a production line?
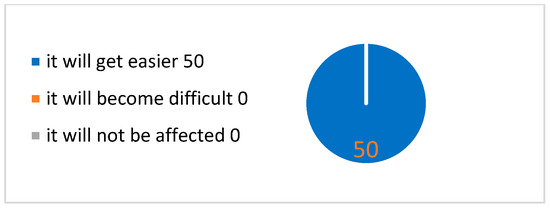
Figure 6.
How will the use of Industry 4.0 technologies affect the work of the industrial engineer when performing MTM-1 analysis?
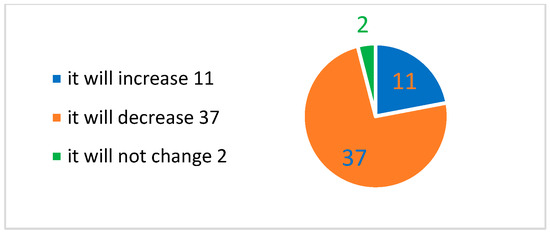
Figure 7.
How will the use of Industry 4.0 technologies affect the time to create the MTM-1 analysis?
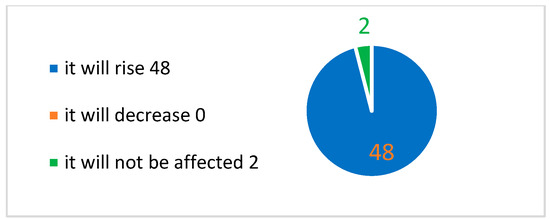
Figure 8.
How will the use of Industry 4.0 technologies affect the accuracy of the MTM-1 analysis?
The results of the first group of questions show that all respondents are completely sure of the meaning of Industry 4.0 technologies usage in the cycle time determination and all of them expect a positive effect on the industrial engineering work. Most of the respondents (37 engineers or 74% of the answers) state that using these technologies would decrease the time for preparing the MTM-1 analysis, but 11 engineers (22%) expect an increase in the time for preparing and 2 engineers (4%) expect the time to be the same. This result can be explained with the generally asked question—it is for the whole Industry 4.0 technologies and not for a specific one. It will be evident in the answers later that these percentages will change as specific technology is pointed. The same explanation refers to the result of the next question, where 96% of the respondents (48 engineers) stated the accuracy of the MTM-1 analysis would increase when Industry 4.0 technologies are used while 2 engineers (4%) expect no effect on the accuracy.
The second group consists of open-type questions about the benefits and challenges in front of introducing the Industry 4.0 technologies for determining the cycle time with MTM-1 analysis. The respondents were free to select more than answer. The results are shown in Figure 9, Figure 10 and Figure 11.
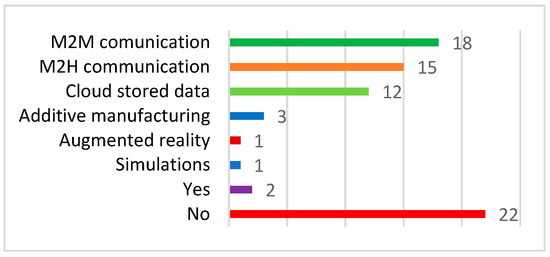
Figure 9.
Do you think other Industry 4.0 technologies besides the ones mentioned in the previous section can be used in performing MTM-1 analysis? Is so, please write it.
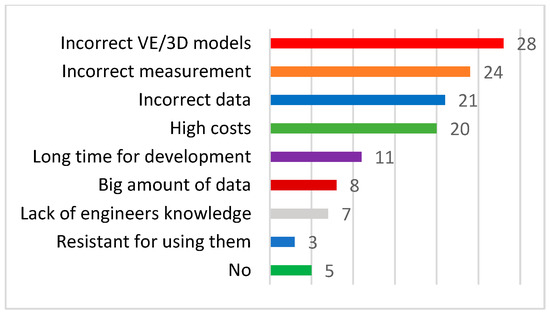
Figure 10.
What are the difficulties in front of introducing of Industry 4.0 technologies to determine cycle time by MTM-1?
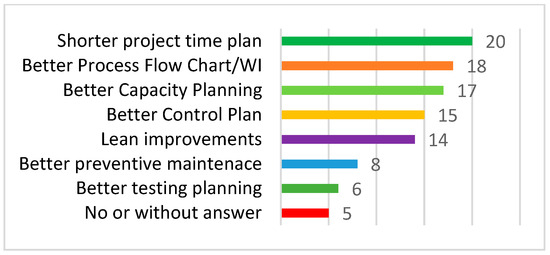
Figure 11.
Besides those in the previous questions, do you think there are other benefits of introducing Industry 4.0 technologies to determine cycle time by MTM-1?
As shown in Figure 9, the machine-to-machine communication, the machine-to-human communication and cloud-stored data are pointed with high scores by the respondents. These results are somewhat expected because the mentioned technologies complement the ones suggested at the end of the introduction. However, they cannot be used alone during the preparation of MTM-1 analysis, and they can work only in combinations with the suggested. The other three pointed out technologies that received low scores do not appear to have the potential for such tasks as cycle time determination. As can also be seen in the figure, 22 engineers (44% answers) state there is no other Industry 4.0 technology which can be used.
There are four challenges pointed by the engineers with high scores. The highest scored, that is also vital for a task such as defining cycle time, is the correctness and effectiveness of the Virtual Environment or 3D model designs. Without correct designs, it is absolutely sure that the measurements and data sets will be incorrect, which are the second and third scored pointed challenges. The task of Virtual Environment creating is further complicated by the need to embed various 3D models—single components, product, workstations/line, tools and fixtures, all of them with their properties. The high costs are scored at fourth place. However, this is a common underestimation or misunderstanding of these technologies because they can bring more benefits as revenues than the costs which are paid for. This answer was expected, so the benefits/costs ratio question was included in the survey and the results will be seen in the next group. The next four answers are with lower scores and have relatively low impact.
There are seven other benefits to introducing Industry 4.0 technologies in performing MTM-1 analysis which are marked by the respondents. The shorter project time plan or time buffers in the plan have the highest score as this result is mainly because of the expected decrease in the time for the analysis performing. Another group of three highly scored benefits are the better process flow chart/work instructions, control plan and capacity planning development. To this group two more answers with lower scores can be added—better testing and preventive maintenance planning. These two groups explain the engineers’ expectation that the Industry 4.0 technologies would make their work easier. This is reasonable even without cycle time defining. If these technologies record the process, some of the documents such as the process flow chart and work instructions will be almost ready while the control plan, test planning and preventive maintenance planning will be partially ready. Including cycle time determination with these technologies will help in solving the assembly line balancing problem and would improve capacity planning calculations. However, it needs to be noted that all these potentials majorly depend on the type of technology used and its capability. It is possible to complicate the work of the engineers in some cases. Another marked benefit is the Lean improvements, which are the result of the obvious optimizations due to the expected positive effect on time and accuracy. Excluding the yes and no answers, the last four pointed out benefits are scored low and have low impact or merely reiterate previously mentioned benefits.
The next group consists of closed-type questions with several proposed answers about the economic motivation of the respondents for the Industry 4.0 proposal for defining cycle time and time period of implementation of these technologies to assist in this task. The results are shown in Figure 12 and Figure 13.
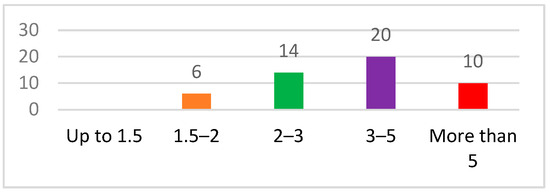
Figure 12.
What benefits/cost ratio would motivate you to propose implementing Industry 4.0 for cycle time determination by MTM-1?
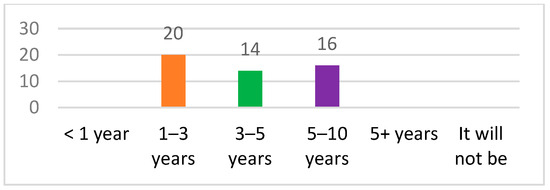
Figure 13.
In what period do you think Industry 4.0 technologies would be implemented for cycle time determination by MTM-1?
As shown in Figure 12, 40% of respondents would be motivated by a 3–5 benefits/costs ratio to propose the usage of Industry 4.0 technologies in cycle time determination by MTM-1, while another 28% and 20% of them would be motivated by a 2–3 ratio and a more than 5 ratio, respectively. The benefits highly depend on the type and capabilities of the technology and the knowledge and skills of the engineer using it.
As can be seen in Figure 13, a majority of the engineers expect that implementing these technologies would happen in one to three years, while the other engineers almost equally expect it to happen in three to five or five to ten years. Again, the time period highly depends on the type of the technology.
The last part of the survey is Likert scale, which includes five questions with four possible options each. The questions focus on the two suggested variants with the specific Industry 4.0 technologies in the introduction section, which means the results would be somewhat more accurate. The results are shown in Figure 14.
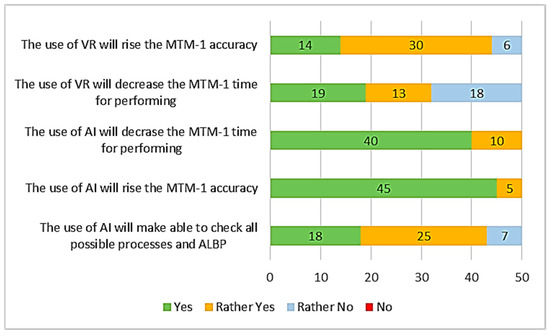
Figure 14.
How specific Industry 4.0 technology would affect the performing of MTM-1 analysis?
The results for the Virtual Reality questions show that the most of the respondents expect an increase in the accuracy (88% in total) and decrease in time for performing (64% in total) when using it for defining the cycle time by MTM-1, while the other engineers do not expect these effects (with 12% and 36%, respectively). It can be seen that the negative percentage for the time is higher than those in Figure 7. The reason for this is that choosing the best design of the process requires the engineer to check different processes one by one, and it takes time. This also refers to the assembly line balancing using this technology. In order to be fully used, except for the correct 3D models, the visual arms and body need to be included in the virtual simulation, along with hardware with high characteristics, a fully immersive display with gloves and body-worn sensors, weight sensors, tracking and recording systems and a centralized computer system. The speed of performing the analysis would increase and the time would decrease when, except for the above-mentioned items, there are also databases with the individual movements, MTM-1 codes and their assigned time unit values, movement type database (simultaneous, combined, limited) and the principle of motion economy, and all of them are embedded in the virtual reality simulation, tracked automatically and recorded in the computer system or embedded directly in the computer system. Critical for analysis correctness is the availability of the weight sensor (or weight information about the components, tools, and fixtures in the system), movement type databases and the principle of motion economy. If all these requirements are completed, the analysis will have high correctness and a very correct decision regarding the assembly line balancing problem.
The results of the Artificial Intelligence questions show that all engineers expect an increase in accuracy and decrease in time for performing when using it for defining cycle time by MTM-1. This will happen when all requirements, which were indicated for virtual reality, are fulfilled and additional large training of the algorithm is conducted, which is critical. Without proper training, the correctness of the analysis would be low, which explains the expectation of seven engineers (14% of the answers) on the inability of the Artificial Intelligence to check all possible processes and to solve the assembly line balancing problem. If all stated requirements are completed, the cycle time and assembly line balancing would be completed with high correctness for a very short time.
5. Conclusions
The article investigated the potential for the implementation of Industry 4.0 technologies in the preparation of MTM-1 analysis for improving its speed and accuracy in the automotive industry, based on a unique survey. The results indicated that speed reduction and accuracy increase mainly depend on which Industry 4.0 technology is chosen and its capabilities.
In conclusion, all research findings of the engineers’ opinions can be used in Virtual Reality, Artificial Intelligence or other Industry 4.0 technology development for cycle time determination by MTM-1 analysis. They can contribute to a more accurate definition of company’s costs and revenues.
Author Contributions
Conceptualization, K.M.; methodology, K.M. and P.V.; investigation, K.M. and P.V.; resources, K.M.; writing—original draft preparation, K.M.; writing—review and editing, P.V.; visualization, K.M. and P.V.; funding acquisition, K.M. and P.V. All authors have read and agreed to the published version of the manuscript.
Funding
This research was conducted within the framework of project No. 2025-BM-01 “Transformation of Socio-Economic Systems through Integration and Digitalization”, funder “The University of Ruse “Angel Kanchev” Scientific Research Fund”.
Institutional Review Board Statement
Not applicable.
Informed Consent Statement
Not applicable.
Data Availability Statement
No new data were created or analyzed in this study. Data sharing is not applicable to this article.
Conflicts of Interest
The authors declare no conflicts of interest.
References
- Maynard, H.B.; Stegemerten, G.J.; Schwab, J.L. Methods-Time Measurement; McGraw-Hill: New York, NY, USA, 1948. [Google Scholar]
- Zandin, K.B.; Schmidt, T.M. MOST Work Measurement Systems, 4th ed.; CRC Press: Boca Raton, FL, USA, 2021. [Google Scholar]
- MTM Association e. V. Augmented Reality and AI in Industrial Work Management—MTM Association Website Blog Article 2022. Available online: https://blog.mtm.org/?p=3864&lang=en (accessed on 15 January 2024).
- Kunz, A.; Zank, M.; Nescher, T.; Wegener, K. Virtual reality based time and motion study with support for real walking. Procedia CIRP 2016, 57, 303–308. [Google Scholar] [CrossRef]
- Benter, M. Derivation of MTM-UAS analysis from virtual reality tools using MTMmotion. In Proceedings of the Conference of Production Systems and Logistics (CPSL), Stellenbosch, South Africa, 14–17 November 2023; Publish-Ing: Hannover, Germany, 2023. [Google Scholar]
- Gorobets, V.; Holzwarth, V.; Hirt, C.; Jufer, N.; Kunz, A. A VR-based approach in conducting MTM for manual workplaces. Int. J. Adv. Manuf. Technol. 2021, 117, 2501–2510. [Google Scholar] [CrossRef]
- Kärcher, S.; Cuk, E.; Denner, T.; Görzig, D.; Günther, L.C.; Hansmersmann, A.; Riexinger, G.; Bauernhansl, T. Sensor-driven analysis of manual assembly systems. Procedia CIRP 2018, 72, 1142–1147. [Google Scholar] [CrossRef]
- Rückert, P.; Papenberg, B.; Tracht, K. Classification of assembly operations using machine learning algorithms based on visual sensor data. Procedia CIRP 2020, 97, 110–116. [Google Scholar] [CrossRef]
- Riedel, A.; Brehm, N.; Pfeifroth, T. Hand gesture recognition of Methods-Time-Measurement-1 motions in manual assembly tasks using graph convolutional networks. Appl. Artif. Intell. 2022, 36, 2014191. [Google Scholar] [CrossRef]
- Koch, J.; Büsch, L.; Gomse, M.; Schüppstuhl, T. A Methods-Time-Measurement based approach to enable action recognition for multi-variant assembly in Human-Robot Collaboration. Procedia CIRP 2022, 106, 233–238. [Google Scholar] [CrossRef]
- Roth, E.; Möncks, M.; Bohné, T.; Pumplun, L. Context-aware cyber-physical assistance systems in industrial systems: A human activity recognition approach. In Proceedings of the IEEE International Conference on Human-Machine Systems (ICHMS), Rome, Italy, 7–9 September 2020; pp. 1–6. [Google Scholar]
- Bellarbi, A.; Jessel, J.-P.; Da Dalto, L. Towards Method Time Measurement identification using virtual reality and gesture recognition. In Proceedings of the IEEE International Conference on Artificial Intelligence and Virtual Reality (AIVR), San Diego, CA, USA, 9–11 December 2019. [Google Scholar]
- Breznik, M.; Buchmeister, B.; Herzog, N.V. Assembly line optimization using MTM time standard and simulation modeling—A case study. Appl. Sci. 2023, 13, 6265. [Google Scholar] [CrossRef]
- Kampa, A.; Golda, G.; Konysz, D. Design of production systems using computer modelling of human-robot interaction. IOP Conf. Ser. Mater. Sci. Eng. 2021, 1182, 012034. [Google Scholar] [CrossRef]
- Miller, M.G.; Summers, J.D.; Mathieson, J.L.; Mocko, G.M. Manufacturing assembly time estimation using structural complexity metric trained artificial neural networks. J. Comput. Inf. Sci. Eng. 2014, 14, 011005. [Google Scholar] [CrossRef]
- Prinz, C.; Fahle, S.; Kuhlenkötter, B.; Losacker, N.; Zhang, W.; Cai, W. Human-centered artificial intelligence application: Recognition of manual assembly movements for skill-based enhancement. In Proceedings of the Conference on Learning Factories (CFL), Graz, Austria, 1–2 July 2021. [Google Scholar]
- Ansari, F.; Hold, P.; Sihn, W. Human-centered cyber physical production system: How does the Industry 4.0 impact on decision-making tasks? In Proceedings of the IEEE Technology and Engineering Management Conference (TEMSCON), Evanston, IL, USA, 28 June–1 July 2018. [Google Scholar]
Disclaimer/Publisher’s Note: The statements, opinions and data contained in all publications are solely those of the individual author(s) and contributor(s) and not of MDPI and/or the editor(s). MDPI and/or the editor(s) disclaim responsibility for any injury to people or property resulting from any ideas, methods, instructions or products referred to in the content. |
© 2025 by the authors. Licensee MDPI, Basel, Switzerland. This article is an open access article distributed under the terms and conditions of the Creative Commons Attribution (CC BY) license (https://creativecommons.org/licenses/by/4.0/).