Proceeding Paper

Portable Vision Testing and Optometry Technology †

by
Feng-Ming Yeh
1,
Wei-Hsin Chen
2,
Ya-Hui Hsieh
3,*,
Ching-Hui Yeh
4,
Kuang-Min Chen
1 and
Der-Chin Chen
1
1
Department of Optometry, Yuanpei University of Medical Technology, Hsinchu 300102, Taiwan
2
Department of Optometry, Hsin Sheng Junior College of Medical Care and Management, Taoyuan 325004, Taiwan
3
Department of Healthcare Information and Management, Ming Chuan University, Taoyuan 111105, Taiwan
4
Department of Business Administration, Yuanpei University of Medical Technology, Hsinchu 300102, Taiwan
*
Author to whom correspondence should be addressed.
Presented at the 8th Eurasian Conference on Educational Innovation 2025, Bali, Indonesia, 7–9 February 2025.
Eng. Proc. 2025, 103(1), 28; https://doi.org/10.3390/engproc2025103028
Published: 15 September 2025

Abstract

We developed an innovative method using the focal length change in the zoom lens to enable subjects with refractive errors to see the E chart image. For myopes, the distant E chart image is in front of the retina. By using the focal length change in the zoom lens, the E chart is located inside the first focal point of the zoom, diverging light. The E chart image is formed on the retina, and the myopes can clearly see the E chart. For hyperopia, the distant E chart image is behind the retina. Similarly, by using the focal length change in the zoom lens, the E chart is located outside the first focal point of the zoom lens and converges light, and the E chart image is formed on the retina. Hyperopia patients can clearly see the converged E chart. The test for myopia was repeated 30 times. The average of the two test values was −0.7, and the rest were −0.8. The error in the two test datasets can be minimized by optimizing the zoom lens, reducing the optical image value, and expanding the field of view (FOV).

1. Introduction

At present, many people have problems caused by refractive error. Myopia is observed in elementary school students in grades 5 and 6. Even though school nurses have been vigorously promoting and tracking students’ vision care, the number of myopic children is still increasing. Due to the increase in academic burdens and excessive use of smart devices, the myopia rate of junior high school and high school students has reached nearly 90% in Taiwan. In addition, as the average life expectancy increases, the elderly population has increased rapidly, and the number of patients with presbyopia has also increased. Most of the subjects with refractive errors are examined and corrected in optometry rooms. The vision test device and optometry used in optometry rooms are independent devices, which require a large space and a professional optometrist to operate, and are time-consuming and labor-intensive. Therefore, we developed a portable optometry device that combines vision testing with optometry. When projecting an E chart through a zoom lens, its effective focal length changes, allowing subjects with refractive errors to see the E chart image and complete refractive error testing. As zoom lenses are widely used in various industries, the development of technology is accelerated [1,2,3,4,5]. We used advanced zoom lenses and digital image processing technology to reduce reliance on professional techniques and improve the efficiency of detection and optometry. The developed device is portable for medical consultations in rural and remote areas.

2. Principle

In contrast to a fixed-focus lens, a zoom lens is a camera element whose effective focal length and viewing angle are adjustable. Figure 1 shows a simple three-element zoom lens. The center lens is fixed in position, and the left and right lenses are movable relative to the center lens. In this case, the effective focal length and back focal length of the system are variable, but the image point is fixed [6,7,8,9,10,11,12]. There are various ways to design a zoom lens. In this study, a two-lens telephoto zoom is used to illustrate the zoom principle.
The paraxial design of a telephoto zoom lens covers a range of effective focal lengths, from a short focal length of f1 to a long focal length of f2. Parallel light propagates from left to right along the optical axis of the optical system, with positive lens 1 and negative lens 2 arranged from left to right. When positive lens 1 is fixed, there are two focal length scenarios, each briefly described below: At f1, negative lens 2 moves to the right to position L1. At the intermediate focal length f, the distance between the two lenses decreases to t. Finally, at f2, the distance between lenses 1 and 2 remains at t, and both lenses move to the left simultaneously, with positive lens 1 now at position L2. As the focal length changes, the image position remains fixed at position I. Two effective focal lengths are achieved when the moving lens is in two different positions, and the image plane remains at the same position I. Two lenses separating t determine the effective focal length of the telephoto lens. Image position I houses a piece of film or a charge-coupled device (CCD) and a complementary metal-oxide-semiconductor (CMOS) digital sensor chip. When changing t by an amount Δt, the effective focal length (efl) and the back focal length (bfl) also change. The change in bfl is represented by ΔI. To keep the focus at I, the two lenses are displaced as a unit by a distance equal to ΔI so that the new distance between L2 and the image I is equal to the new back focal length (bfl). t and bfl are calculated as follows:
t = f1 + f2 − (f1 × f2/efl)
bfl = efl × (f1 − t)/f1
The position of the image plane I is fixed to calculate the location of the two lenses L1 and L2. Given I on the optical rail, L1 and L2 can be obtained as follows:
L1 = I − bfl − t
L2 = I − bfl
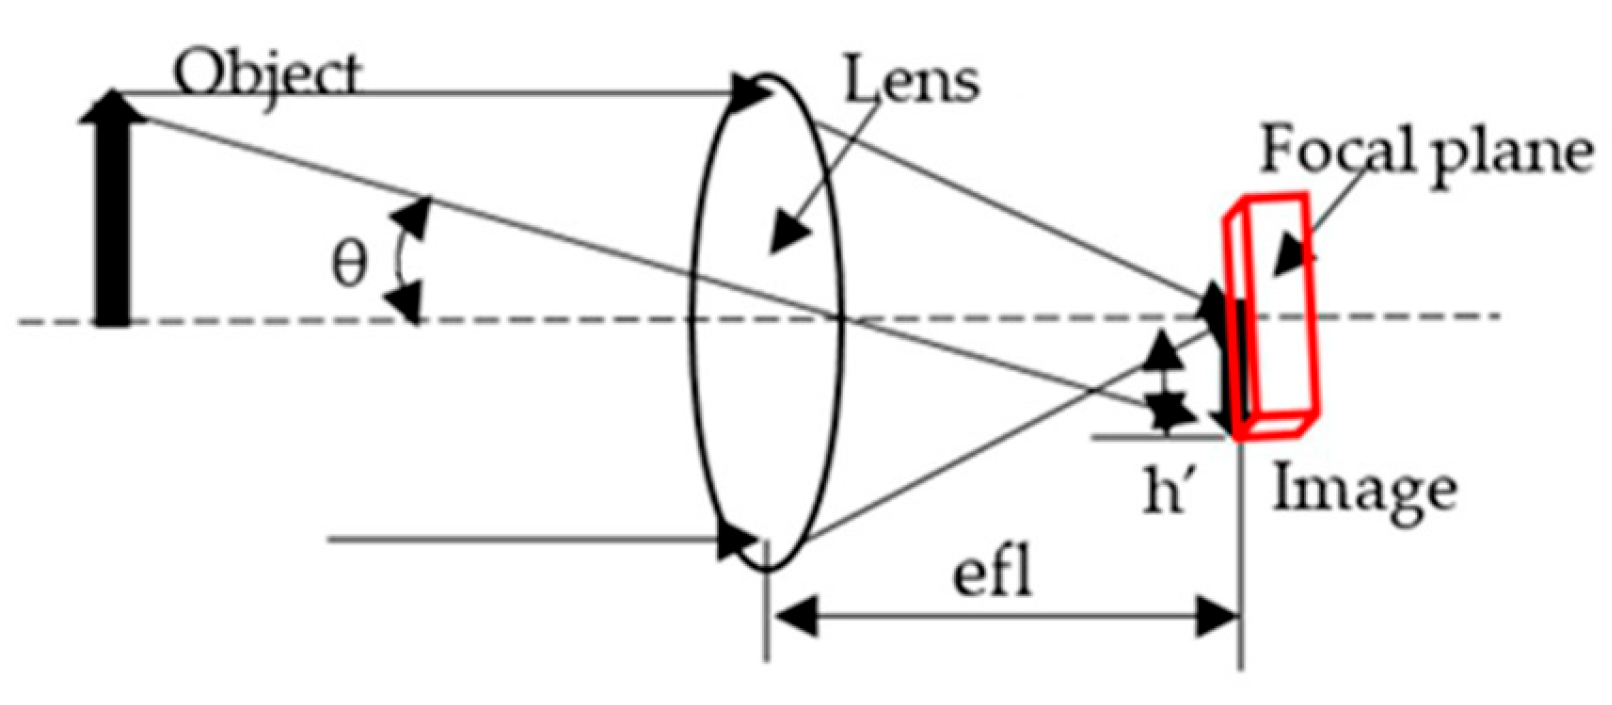
After understanding the optical design principle of the zoom lens, we introduced the imaging calculation formula related to the research. Figure 2 shows a schematic diagram of a digital camera. The side length of the square CCD surface sensor located on the focal plane of the lens is h′, and the effective focal length of the lens is efl. The angle of the view calculation formula of the digital camera is as follows:
θ = h′/efl
Figure 3 shows a general lens meter system, which is used in this system. Lens 1 of the optical projection system projects the object E to lens 2 of the human eye. The object E is located on focal plane 1 of lens 1. At this time, the image E at infinity of the projection system is formed at focal plane 2 through lens 2, which is also on the retina of the human eye. The optical imaging relationship between the two imaging systems is as follows:
h1/f1 = h2/f2

3. Experiment Results

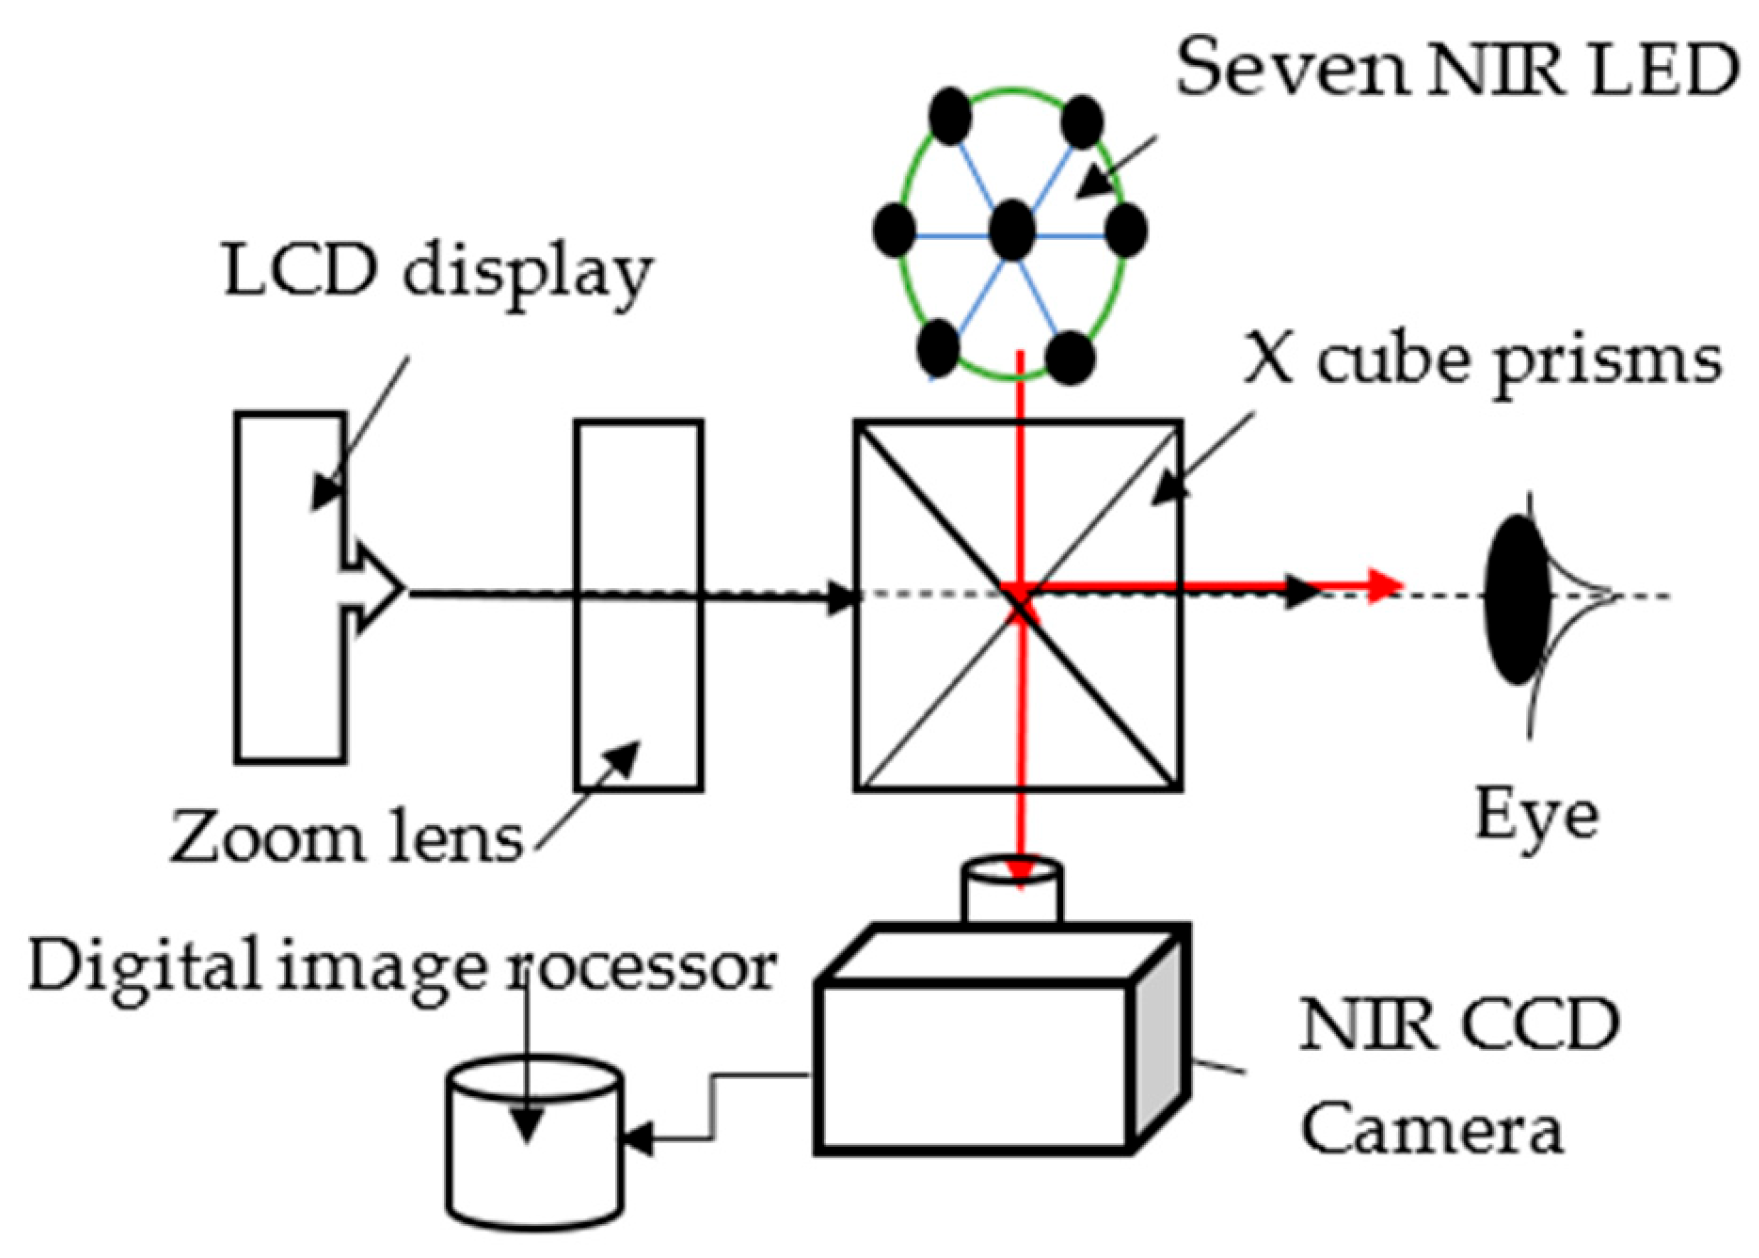
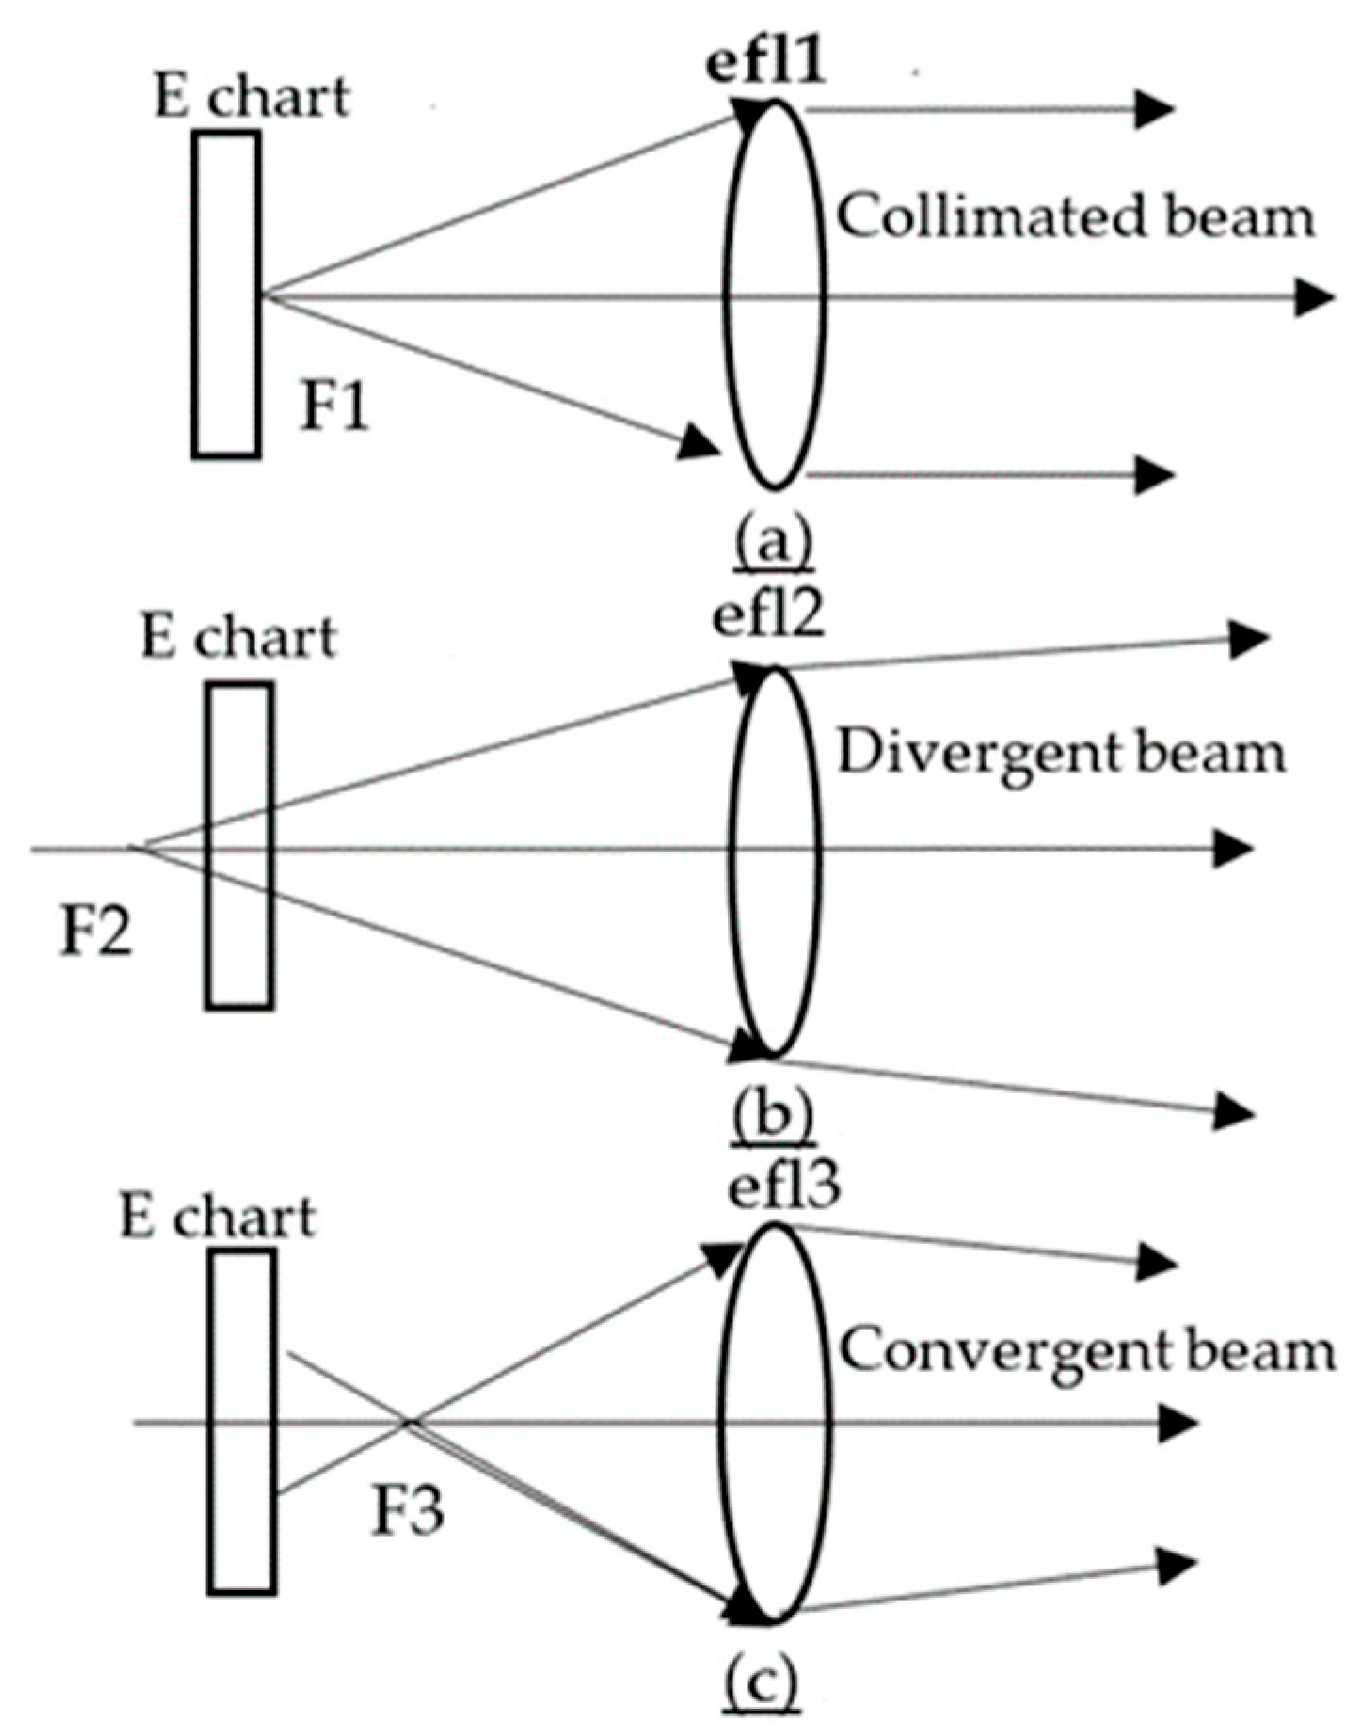
The system includes an LCD, a zoom lens, an X-cube prism, a near-infrared (NIR) camera, seven NIR light-emitting diodes (LEDs) arranged in a honeycomb pattern, and a digital image processor as shown in Figure 4. The LCD, the zoom lens, and the seven NIR LEDs form the transmitting module, and the NIR camera is responsible for detecting the image from the retina. The X-cube prism integrates four optical paths into one system, including the elements and the subject’s eye, so that the subject can view the E chart and the NIR camera can capture the retinal image. In the vision test, the LCD is located on the focal plane of the zoom lens as a display of the E chart and the fixation target [13,14,15,16,17,18,19,20,21]. The E chart consists of a sequence of letters E from large to small. The fixation target is a yellow house surrounded by green trees, which is used to relax the eyes before vision testing and optometry. The seven NIR LEDs with a honeycomb pattern, the central NIR LED, are used as a light source for the reflected signal of the cornea when the eyeball is aligned with the optical axis of the optometry system. The six NIR LEDs around the central NIR LED are arranged in a circle and are used to test subjects with astigmatism. They are projected onto the retina of the subject through an X-cube prism. The NIR camera captures the image of the six NIR LEDs on the retina of the subject with astigmatism. This image is processed by a digital image processor to obtain data related to astigmatism. When the LCD is located on the focal plane of the zoom lens, the projected image of the E chart is projected at infinity and is used for vision testing. When the focal length of the zoom lens changes, the E chart is located inside or outside the focus of the zoom lens, and the E image diverges or converges after projection, which is used to test myopia and hyperopia. When the LCD is located within the focus of a long focal length zoom lens, the projected E chart image diverges; when the LCD is located outside the focus of a short focal length zoom lens, the projected E chart image converges, as shown in Figure 5. In the figure, the zoom lens at the medium, long, and short focal lengths are presented in Figure 5a–c. The output light in Figure 5a is a collimated beam for vision testing, and the output lights in Figure 5b,c are divergent beams and convergent beams for myopia and hyperopia testing, respectively.
An autorefractor generally needs to have basic measurement parameters such as spherical power, cylindrical power, a corneal refractive radius, and a corneal diopter. The tolerances of these parameters vary according to the measurement range. The tolerances of other parameters, such as the cylindrical axis and pupillary distance (PD), are ≤±5° and ≤±1 mm, respectively.
After determining the system architecture and the optometrist’s basic requirements, the size of the LCD and the focal length of the zoom lens are calculated using optical imaging formulas based on the structure of the human eye. Assuming that the normal vision of the subject is 1.0, the effective focal length (efl) and retinal width are 2.5 cm and 0.545 mm, respectively. Using the paraxial formula, the efl of the zoom lens is calculated as 14.5 cm, and the screen size is calculated as 3.1 cm. The efl of the zoom length shortens from 14.5 to 11.5 cm, and the middle efl is 13 cm.
In this study, we conducted system development and vision test optometry. The first phase of system development included system construction, optical axis alignment, and system calibration, which includes two sub-steps. After the system was constructed, the visible light laser was placed on the eye to be tested. The collimated laser beam passing through the X-cube prism is divided into three laser beams. These three laser beams are used to integrate the three optical axes of the LCD, NIR camera, and seven NIR LEDs on the same plane, and they confirm that the four optical axes are perpendicular to each other, completing optical axis alignment and artificial eye correction. Twenty subjects with no physiological diseases and a visual acuity of 1.0 were selected for system testing. The second phase of the vision test and optometry is briefly described as follow:.
(1)
Look directly at the house on the LCD in front of you to make sure that your line of sight is consistent with the system’s optical axis.
(2)
Replace the house pattern with a honeycomb pattern. Look directly at the honeycomb pattern to relax your eyes.
(3)
Observe the distance E chart for each eye separately to test the VA value of each eye.
(4)
Play the E letters of the E chart displayed on the LCD from large to small. Stop playing when the subject cannot clearly see a smaller letter E.
(5)
When the subject can clearly see the letter E in front of the small letter E, record the VA value at this time, and the VA test of this eye is completed.
(6)
Change the focal length of the zoom lens. If the small "E" in the previous step can be clearly seen at the longest focal length, then this eye is hyperopia.
(7)
If the small E in the previous step can be clearly seen at a short focal length, then that eye is myopia.
(8)
The preliminary eye examination results obtained in steps (6) and (7) are used as the reference value for the focal length in step (6) or (7). With further fine-tuning, the letter E will change from blurry to clear or clear to blurry. The best focal length value is when the letter E is the clearest.
For the vision test and optometry experiment, we selected a myopic subject with a visual acuity of −0.8 for the vision test. The letter E was displayed on the LCD screen, gradually decreasing in its size from large to small until the subject could not see the letter. Then, we paused and replayed the test to confirm that the previous letter smaller E was still visible. The test was repeated 30 times and the test data were recorded. The results are listed in Table 1. The value at this time was recorded, and the test was repeated 30 times. The test results showed that there were two test results of −0.7, and the rest were −0.8. According to statistical analysis, −0.8 was selected in this study. These two errors can be improved in the future by optimizing the optical image value of the zoom lens and expanding the field of view (FOV).
After confirming the visual acuity, the refractive examination of subject was continued. Due to myopia, the zoom lens was set to a long focal length to focus on the letter E, and the LCD was set to the letter E for 1.0. The position of the LCD screen was adjusted so that the examinee could see the letter E for 1.0 and the yellow house picture on the green background. At this time, the focal length and the LCD screen position were recorded. The position data of the LCD screen is listed in Table 2. The focal length of 0.21 mm was mainly used with 0.22 mm. The reason is because the FOV is small, the aberration of the zoom lens is large, and the subject cannot adapt to the test equipment.

4. Conclusions

Based on the previous testing technology of portable vision and optometry, we developed a miniaturized and portable eye examination device whose application range is broader than the current auto refractometer. The complex structure of the existing auto refractometer is simplified by using a zoom lens to diverge and converge the projected E chart for myopia and hyperopia testing. For the current advanced technology of optics, optoelectronics, and information, many difficulties are found, but the device can address them. Because it is used at a near distance, the space of the optometry room is reduced. The experimental results showed there are fewer abnormal data points. After analysis, a zoom lens with larger aberration is used. The inconvenience of the developed device made test subjects feel uncomfortable when watching the E chart for a long time, which affected the test results. Currently, we have tested myopia at −0.8 with the developed device. The general range of myopia diopters is from −0.1 to −11, so this device was established based on a look-up table (LUT) to explore the relationship between diopters and LCD at the adjusted distance. At this stage, we conducted monocular and long-distance vision and optometry tests, and in the future, it is necessary to develop the device for astigmatism and binocular testing.

Author Contributions

Conceptualization, F.-M.Y. and W.-H.C.; methodology, Y.-H.H. and C.-H.Y.; validation, K.-M.C. and D.-C.C.; investigation, Y.-H.H.; data curation, F.-M.Y.; writing—review and editing, W.-H.C. and D.-C.C. All authors have read and agreed to the published version of the manuscript.

Funding

This research project was supported by the Far Eastern Memorial Hospital under Grant No. S11345.

Institutional Review Board Statement

Not applicable.

Informed Consent Statement

Not applicable.

Data Availability Statement

The original contributions presented in this study are included in the article. Further inquiries can be directed to the corresponding author.

Conflicts of Interest

The authors declare no conflict of interest.

References

  1. Blahnik, V.; Schindelbeck, O. Smartphone imaging technology and its applications. Adv. Opt. Technol. 2021, 10, 145–232. [Google Scholar] [CrossRef]
  2. Kreitzer, M.; Moskovich, J. Optical design of a smartphone zoom lens. In Proceedings of the SPIE 11106, Zoom Lenses VI, San Diego, CA, USA, 9 September 2019; p. 111060D. [Google Scholar] [CrossRef]
  3. Sun, W.-S.; Tien, C.-L.; Pan, J.-W.; Chao, Y.-H.; Chu, P.-Y. Optimization design of periscope type 3× zoom lens design for a five-megapixel cellphone camera. In Proceedings of the Second International Seminar on Photonics, Optics and Its Applications, Bali, Indonesia, 24–25 August 2016; p. 1015005. [Google Scholar]
  4. Hou, C.; Ren, Y.; Tan, Y.; Xin, Q.; Zang, Y. Compact optical zoom camera module based on Alvarez elements. Opt. Eng. 2020, 59, 025104. [Google Scholar] [CrossRef]
  5. Yang, T.; Jin, G.; Zhu, J. Automated design of freeform imaging systems. Light Sci. Appl. 2017, 6, e17081. [Google Scholar] [CrossRef] [PubMed]
  6. Fan, C.; Yang, B.; Liu, Y.; Gu, P.; Zong, H. Zoom lens with high zoom ratio design based on Gaussian bracket and particle swarm optimization. Appl. Opt. 2021, 60, 3217–3223. [Google Scholar] [CrossRef] [PubMed]
  7. Neil, I.A. Evolution of zoom lens optical design technology and manufacture. Opt. Eng. 2021, 60, 051211. [Google Scholar] [CrossRef]
  8. Lippman, D.H.; Teverovsky, D.S.; Bentley, J.L. Monte Carlo first-order design method for anamorphic cinema zoom lenses. Opt. Eng. 2021, 60, 051203. [Google Scholar] [CrossRef]
  9. Smith, W.J. Modern Optical Engineering, 5th ed.; McGraw-Hill Companies, Inc.: New York, NY, USA, 2008. [Google Scholar]
  10. Hecht, E.; Zajac, A. Optics, 5th ed.; Reading, Addison Wesley Publishing Company: Reading, MA, USA, 2017. [Google Scholar]
  11. Pedrotti, F.L.; Pedrotti, L.M.; Pedrotti, L.S. Introduction to Optics, 3rd ed.; Cambridge University Press: New York, NY, USA, 2018. [Google Scholar]
  12. Côté, G.; Lalonde, J.; Thibault, S. Deep learning-enabled framework for automatic lens design starting point generation. Opt. Express 2021, 29, 3841–3854. [Google Scholar] [CrossRef] [PubMed]
  13. Duerr, F.; Thienpont, H. Freeform imaging systems: Fermat’s principle unlocks “first time right” design. Light: Sci. Appl. 2021, 10, 95. [Google Scholar] [CrossRef] [PubMed]
  14. Hered, R.W.; Murphy, S.; Clancy, M. Comparison of the HOTV and Lea Symbols charts for preschool vision screening. J. Pediatr. Opht. Strab. 1997, 34, 24. [Google Scholar] [CrossRef] [PubMed]
  15. Reich, L.N.; Ekabutr, M. The Effects of Optical Defocus on the Legibility of the Tumbling-E and Landolt-C. Optom Vis Sci. 2002, 79, 389. [Google Scholar] [CrossRef] [PubMed]
  16. Smart home technology creates Independence for patients with disabilities. Available online: https://www.optometrytimes.com/view/smart-home-technology-creates-independence-patients-disabilities (accessed on 30 October 2023).
  17. Jiang, Y.; Zhu, Z.; Tan, X.; Kong, X.; Zhong, H.; Zhang, J.; Xiong, R.; Yuan, Y.; Zeng, J.; Morgan, I.G.; et al. Effect of repeated low-level red-light therapy for myopia control in children: A multicenter randomized controlled trial. Ophthalmology 2022, 129, 509–519. [Google Scholar] [CrossRef] [PubMed]
  18. Suo, L.; Ke, X.; Zhang, D.; Qin, X.; Chen, X.; Hong, Y.; Dai, W.; Wu, D.; Zhang, C.; Zhang, D. Use of Mobile Apps for Visual Acuity Assessment: Systematic Review and Meta-analysis. JMIR mHealth uHealth. 2022, 10, e26275. [Google Scholar] [CrossRef] [PubMed]
  19. Abdul Rahman, S.N.A.; Naing, N.N.; Othman, A.M.; Mohamad, Z.; Ibrahim, T.M.M.; Hashim, S.E.; Baig, A.A.; Wong, L.S.; Dewadas, H.D.; Selvaraj, S. Validity and Reliability of Vis-Screen Application: A Smartphone-Based Distance Vision Testing for Visual Impairment and Blindness Vision Screening. Medicina 2023, 59, 912. [Google Scholar] [CrossRef] [PubMed]
  20. Hanyuda, A.; Kubota, M.; Kubota, S.; Masui, S.; Yuki, K.; Tsubota, K.; Negishi, K. Validation of a novel iPhone application for evaluating near functional visual acuity. Sci Rep. 2022, 12, 22342. [Google Scholar] [CrossRef] [PubMed]
  21. Raffa, L.H.; Balbaid, N.T.; Ageel, M.M. Smart Optometry” phone-based application as a visual acuity testing tool among pediatric population. Saudi Med J. 2022, 43, 946–953. [Google Scholar] [CrossRef] [PubMed]
Figure 1. Schematic diagram of a three-lens zoom lens.
Engproc 103 00028 g001
Figure 2. Schematic diagram of the digital camera.
Engproc 103 00028 g002
Figure 3. Schematic diagram of the lens meter system.
Engproc 103 00028 g003
Figure 4. Schematic diagram of portable vision testing and the optometry device.
Engproc 103 00028 g004
Figure 5. E chart characteristics of light output inside and outside the zoom lens’s first focal point (ac).
Engproc 103 00028 g005
Table 1. Test data of visual acuity.
−0.8−0.8−0.8−0.8−0.8−0.8−0.8
−0.7−0.8−0.8−08−0.8−0.8−0.7
−0.8−0.8−0.8−0.8−0.8−0.8−0.8
−0.8−0.8−0.8−0.8−0.8−0.8−0.8
−0.8−0.8
Table 2. Distance of movement of the LCD in mm.
0.210.210.210.210.210.210.21
0.220.210.210.210.210.210.20
0.210.210.210.220.210.21
Disclaimer/Publisher’s Note: The statements, opinions and data contained in all publications are solely those of the individual author(s) and contributor(s) and not of MDPI and/or the editor(s). MDPI and/or the editor(s) disclaim responsibility for any injury to people or property resulting from any ideas, methods, instructions or products referred to in the content.