1. Introduction
In recent years, subways have gained renewed attention as a key component of sustainable urban transportation systems due to their environmental benefits and operational reliability. Enhancing the service quality of subway systems requires a balanced approach that encompasses both network-level expansions—such as new lines and transfer hub—and improvements to the physical environment within subway stations themselves. However, most prior research has predominantly focused on the former, addressing line extensions and intermodal connectivity, while studies examining the internal dynamics of pedestrian flow and operational efficiency within subway stations remain relatively scarce.
This research gap is increasingly problematic in the context of current urban transportation trends, which emphasize the complexification and upscaling of transit nodes. Modern subway stations are evolving into multi-functional complexes that integrate commercial, business, and cultural spaces, forming highly intricate pedestrian environments. A prominent example is the study site of this paper, Samseong Station in Seoul, which is currently undergoing development into a large-scale intermodal transit center scheduled for completion in 2028 [
1]. Once completed, the station will feature a vertically and horizontally layered spatial structure that connects underground and aboveground facilities. These structural transformations are expected to generate non-linear and highly variable pedestrian flow patterns, necessitating precise modeling and monitoring capabilities to ensure operational safety and efficiency [
2,
3].
Moreover, as urban populations age and demand for inclusive mobility increases, ensuring safe and comfortable access for transportation-disadvantaged groups, such as older adults and people with disabilities, has become a critical objective. Key infrastructure components—such as elevators, ramps, and navigational aids—must be continuously monitored and maintained. This requires a high-fidelity pedestrian flow model capable of accurately reproducing real-world movement patterns and dynamic crowd interactions within complex station environments [
4].
In sustainability-oriented transportation research, evaluation criteria must extend beyond environmental considerations such as greenhouse gas emissions or air pollutant reduction. A comprehensive framework must also account for pedestrian safety, inclusive accessibility, temporal demand variability, and adaptive service quality [
5]. Pedestrian demand in subway stations exhibits substantial temporal variation. During the morning and evening peaks (07:00–09:00 and 18:00–19:00), stations—particularly those adjacent to major office and commercial complexes—tend to experience high levels of crowding and congestion due to concentrated commuting activity. In contrast, during midday leisure hours (14:00–14:30), which represent off-peak periods, pedestrian volumes are relatively lower, and individual walking behaviors become more pronounced, often reflecting personal spatial preferences rather than collective movement patterns.
These temporal differences highlight the importance of modeling pedestrian flow separately by time period, as pedestrian patterns vary significantly across different hours of the day [
6]. Conducting simulations based on distinct time-of-day scenarios allows for more accurate prediction of crowd dynamics and individual walking behavior [
7]. Moreover, incorporating external factors—such as weather conditions, local events, and infrastructure malfunctions—can further enhance the realism of the model and improve its applicability for planning and operational policy development.
To address these challenges, this study employs the Social Force Model (SFM) to develop a calibrated, data-driven simulation of pedestrian flow within Samseong Station. By leveraging real-world pedestrian trajectory data, the study conducts time-of-day-specific parameter optimization to reproduce observed patterns of interaction and congestion. Through this process, the model aims to evaluate and improve pedestrian safety, walking comfort, and operational resilience within complex subway station environments. The objective of this study aligns with the promotion of sustainable urban transport strategies in accordance with the guidelines of Sustainable Urban Mobility Plans (SUMPs), particularly in the context of the growing adoption of Intelligent Info-mobility Systems. Ultimately, this research contributes to the development of sustainable, inclusive, and intelligently managed urban transportation systems. Unlike conventional studies that focus primarily on transit network expansions, this work emphasizes in-station pedestrian dynamics as a vital dimension of sustainability, offering practical insights into efficient facility operation and user-centered design in large-scale, multifunctional transit hubs.
2. Literature Review
2.1. Social Force Model: Structure and Extensions
Originally proposed by Helbing and Molnár (1995), the Social Force Model (SFM) remains a foundational framework in pedestrian dynamics research [
8]. The model describes pedestrian motion as the result of three core forces: a driving force, which reflects the pedestrian’s intention to reach a destination at a desired speed; a repulsive force, which accounts for collision avoidance with other pedestrians and obstacles; and an attractive force, which models tendencies to approach companions, shops, or other points of interest. Owing to its intuitive formulation and interpretability grounded in physical analogies, the SFM has been widely adopted in both academic studies and commercial simulation platforms such as VISSIM.
However, the original SFM adopts a deterministic approach, applying uniform parameter values across all pedestrians regardless of individual differences. As a result, the model fails to account for heterogeneity in physical capacity, psychological preferences, or contextual behavior, limiting its predictive accuracy in real-world environments. To address this limitation, Han et al. (2022) proposed an extended version of the SFM that incorporates fuzzy inference, enabling the model to simulate individual decision-making under uncertainty [
7]. This enhancement allows the model to capture more realistic interpersonal interactions by incorporating linguistic variables and fuzzy logic into the force-based framework.
Recent advancements have further expanded the scope of SFM by applying it to shared spaces involving vehicle–pedestrian interactions. In particular, Yang et al. (2020) introduced a force component framework that differentiates interaction effects based on direction (e.g., front, rear, lateral) [
9]. Their model, calibrated and validated using empirical trajectory data, demonstrated credible performance in replicating various types of interactions. However, it relied on the assumption of homogeneous parameters across all pedestrians, which limited its ability to accurately represent individual-level behavioral responses to vehicle interactions.
These findings underscore the importance of adapting model parameters based on contextual factors such as time-of-day congestion levels or travel purposes. Yang et al. recommended several improvements, including individual parameter calibration, customized loss functions, and interaction-type-specific formulations. These directions highlight the growing recognition that pedestrians should no longer be treated as reactive particles governed by uniform rules, but rather as adaptive agents interacting with heterogeneous and dynamic environments.
Consequently, advancing the SFM requires embedding behavioral heterogeneity, contextual sensitivity, and task-specific optimization strategies into the modeling process. Such enhancements will improve the realism, generalizability, and applicability of pedestrian simulations in complex urban scenarios.
2.2. Data-Driven Approaches: Machine Learning and Deep Learning
While rule-based pedestrian models such as the Social Force Model (SFM) provide interpretability and a clear physical foundation, they are limited in their ability to capture the full complexity and variability of pedestrian behavior—particularly in dynamic and non-standard environments. To address these limitations, data-driven approaches leveraging machine learning (ML) and deep learning (DL) have emerged as powerful alternatives capable of learning pedestrian patterns directly from trajectory data.
In the realm of machine learning, a wide range of supervised algorithms has been applied to enhance the realism of pedestrian simulations. Decision Trees and Random Forests have also been utilized to infer decision-making logic in complex environments [
10]. These models typically convert features such as speed, direction, and local density into structured inputs for learning, and they often demonstrate high predictive accuracy even with relatively small datasets.
Deep learning further advances pedestrian modeling by enabling the capture of high-dimensional, nonlinear relationships in large-scale data. Convolutional Neural Networks (CNNs) are frequently employed to extract spatial features and predict pedestrian flow fields [
11], whereas Long Short-Term Memory (LSTM) networks excel in learning temporal patterns and forecasting future trajectories [
12]. Generative Adversarial Networks (GANs) have also been used to augment trajectory datasets by synthesizing realistic movements [
13], and Reinforcement Learning (RL) has been applied to simulate adaptive decision-making under dynamic conditions, such as emergency evacuations [
14].
Collectively, ML and DL approaches offer an expanded modeling capacity by supporting adaptive, probabilistic, and individualized representations of pedestrian behavior. However, these approaches come with trade-offs. DL-based models often require substantial computational resources and large annotated datasets. Therefore, balancing model fidelity with deployment efficiency remains a key concern when applying such methods in real-world contexts.
Given the deterministic limitations of the classical SFM and its sensitivity to uniform parameter settings, the integration of ML and DL into pedestrian modeling is not only promising but necessary. These data-driven methods can complement the interpretable structure of physics-based models like SFM, enhancing their behavioral realism and predictive accuracy. In complex urban environments where pedestrian movement is influenced by diverse contextual factors, a hybrid framework that combines SFM with ML/DL-based components—such as parameter calibration, trajectory prediction, or decision modeling—can provide a more flexible and scalable solution for pedestrian simulation.
3. Analysis of Pedestrian Behavior in Subway Stations
3.1. Study Area
Samseong Station, located at the intersection of Teheran-ro and Yeongdong-daero in Gangnam-gu, Seoul, is a major subway hub characterized by a multi-level structure that integrates both underground and above-ground facilities. Its strong connectivity to surrounding commercial zones, including COEX, has made it a critical node for pedestrian activity in the city’s transit network. The focus area of this study is the passenger concourse adjacent to the turnstiles leading to Seolleung-bound trains—recognized as a high-density pedestrian zone due to its proximity to transfer points and commercial accessways. As such, this area is expected to exhibit diverse and dynamic pedestrian behaviors.
According to public smart card transaction data released by the Seoul Open Data Plaza in 2024, Samseong Station ranks as the seventh most heavily used subway station in South Korea among 338 stations analyzed [
15]. With over 100,000 daily boarding and alighting events, the station consistently handles substantial pedestrian volumes. Given the presence of extensive underground corridors that connect the station directly to COEX and other major commercial complexes, the actual pedestrian flow through the underground space is likely even higher. These conditions make Samseong Station particularly suitable for studying time-sensitive and spatially complex pedestrian dynamics in an urban transit setting
To further contextualize the study, pedestrian traffic on Wednesday, 12 July 2017—a typical weekday during the high-travel summer vacation period—was analyzed using public data from the Seoul Open Data Portal. As shown in
Table 1, the station recorded 64,847 boardings and 67,206 alightings on that day. During the morning peak (07:00–09:00), 90.4% of trips were alightings, reflecting intense inbound commuter flows. In contrast, during the midday leisure hours (14:00–15:00), boarding and alighting were nearly balanced, suggesting movement patterns shaped by shopping and tourism. In the evening peak (17:00–19:00), 78.5% of transactions were boardings, indicating high outbound demand.
These temporal asymmetries in boarding–alighting patterns emphasize the importance of time-sensitive pedestrian management strategies, particularly near major exits. The observed midday movement toward COEX also underscores the potential for coordination between transit infrastructure and adjacent commercial entities. By incorporating such time-dependent behavioral variations into simulation models, this study aims to improve the predictive accuracy and operational relevance of pedestrian flow modeling in complex subway environments.
3.2. LiDAR Data Collection and Preprocessing
In combination with the passenger flow data, this paper also utilizes pedestrian trajectory data collected via LiDAR (Light Detection and Ranging, Model: L-T1103-MRS57B, Manufacturer: SICK Ltd., Waldkirch, Germany) sensors on the same day (12 July 2017). The pedestrian trajectory data used in this study were collected inside a subway station in Seoul, as part of a prior study by Jo et al. (2018), which aimed to analyze pedestrian trajectory patterns based on LiDAR-based pedestrian tracking [
16]. LiDAR technology enables high-resolution capture of pedestrian positions, velocities, accelerations, and movement directions. LiDAR data were collected near the turnstiles leading to Seolleung-bound trains.
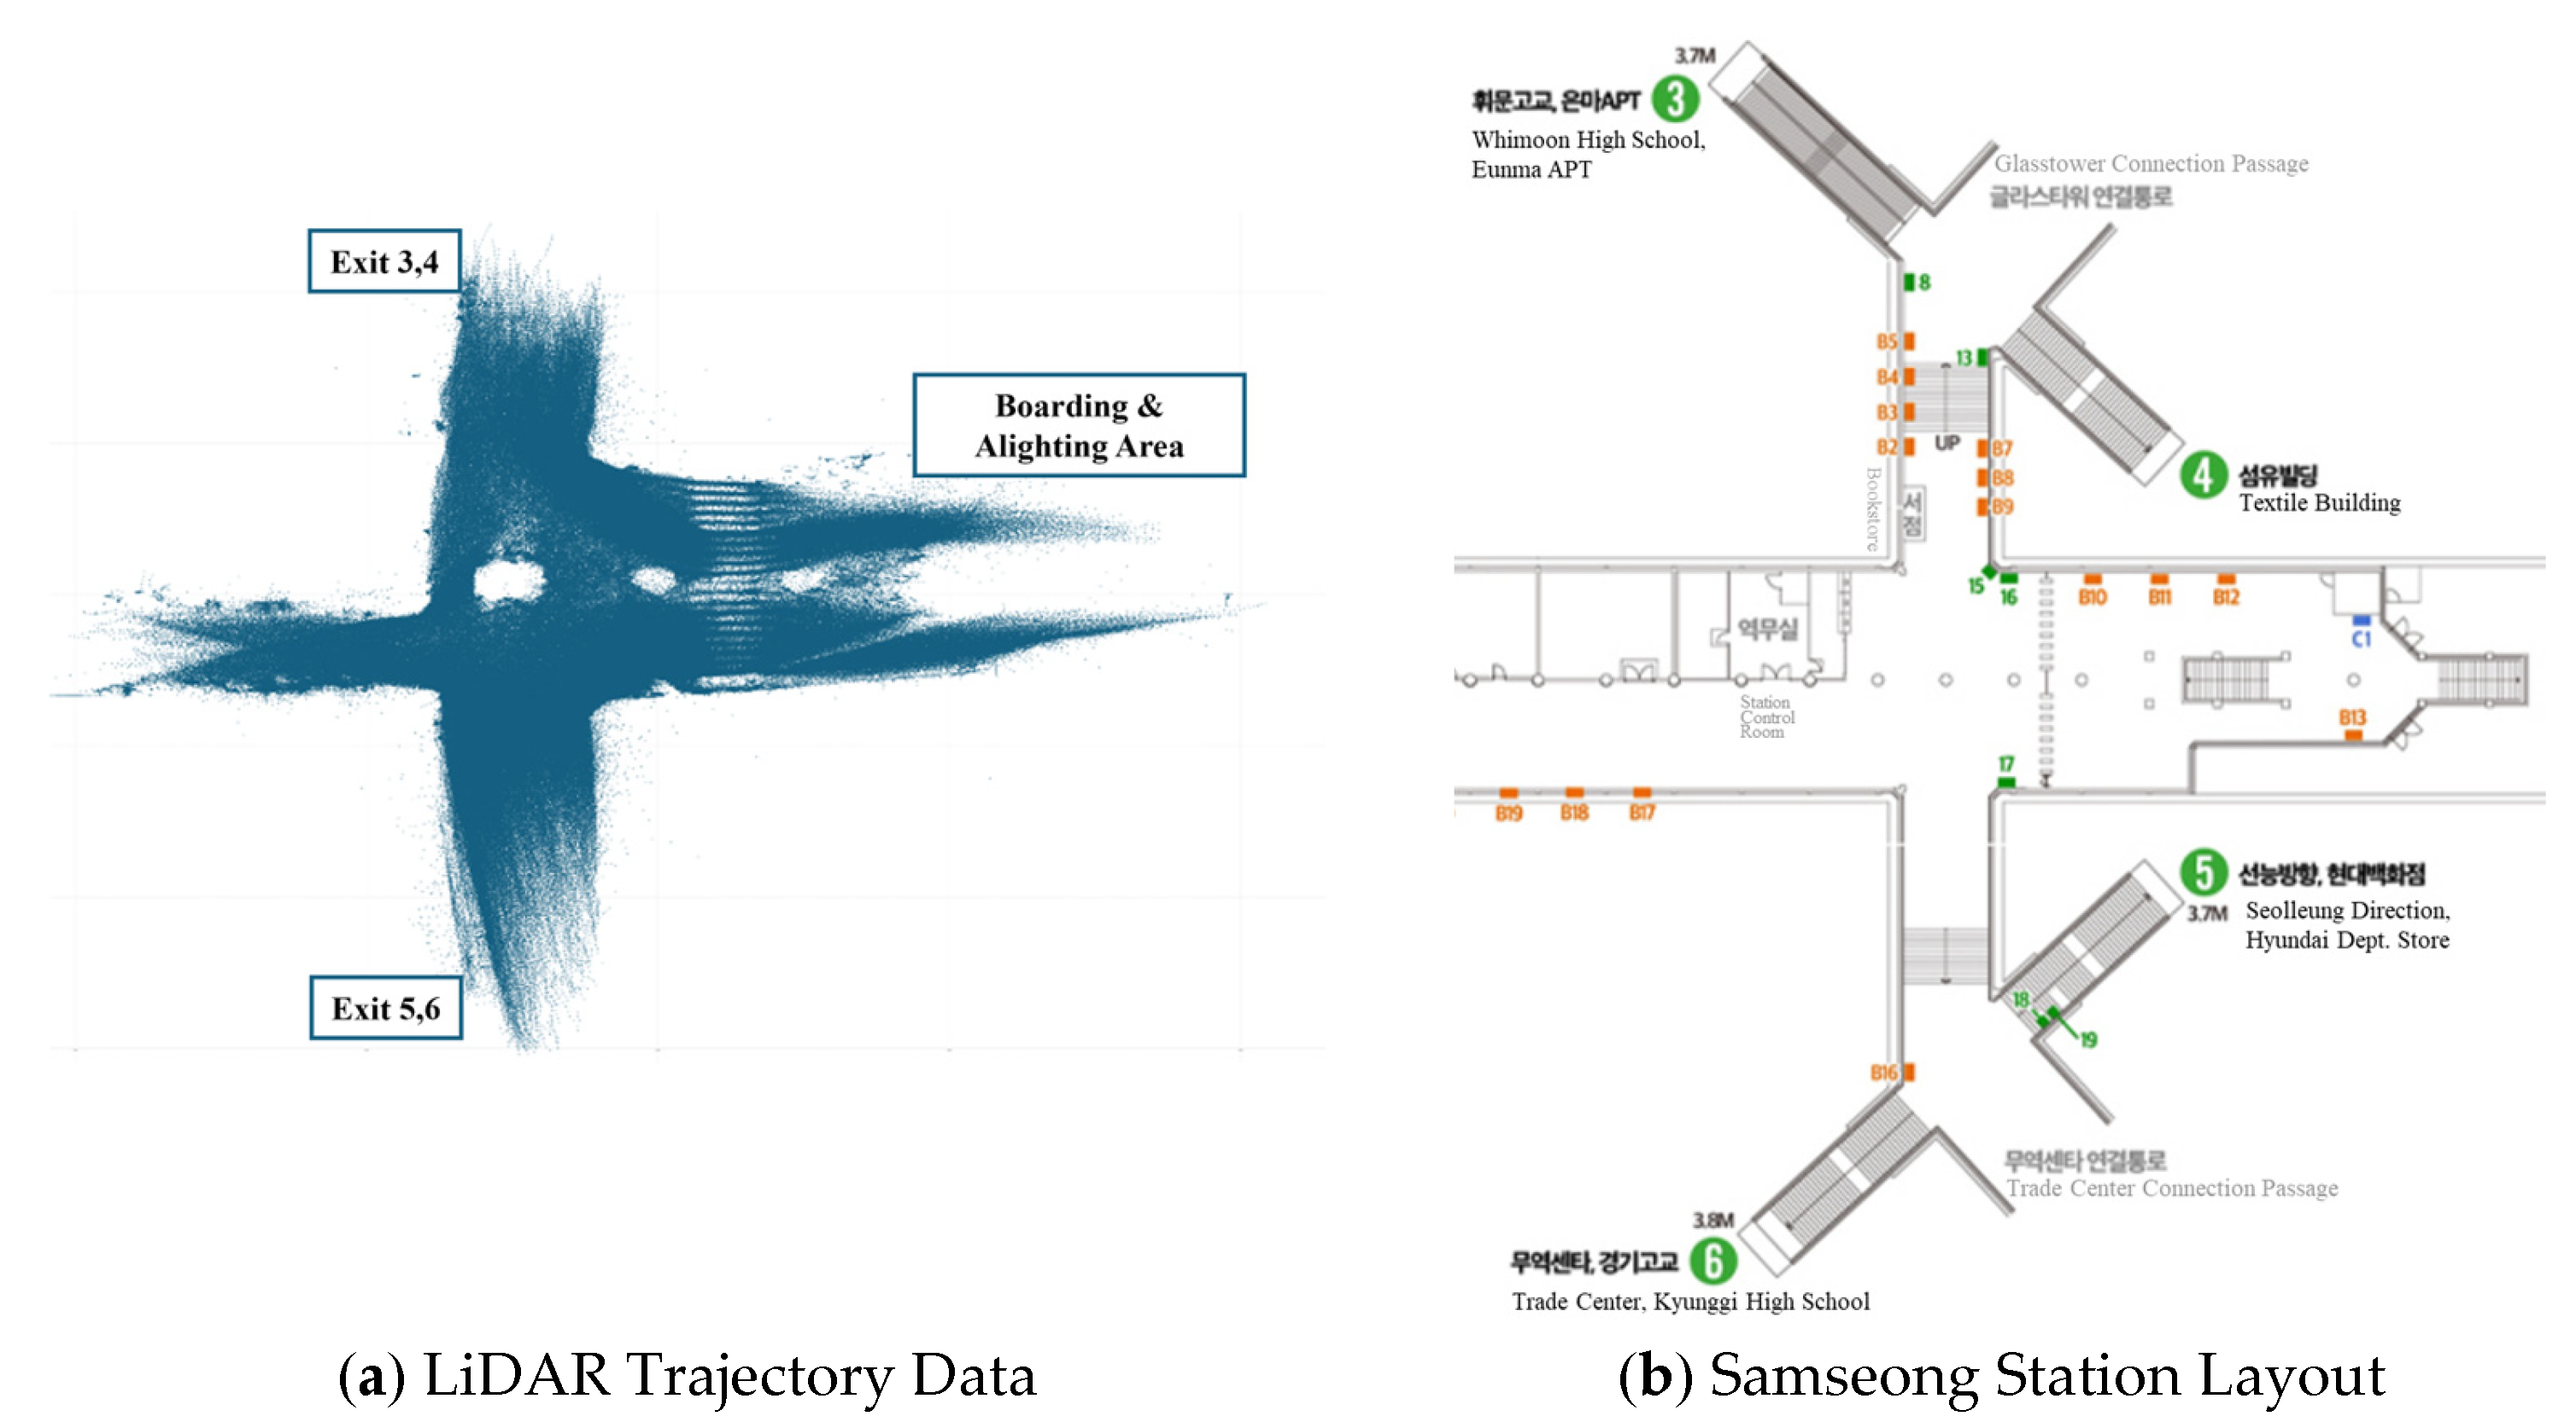
Figure 1a illustrates the trajectory data collected via LiDAR, while
Figure 1b presents the detailed station layout of Samseong Station. The dataset includes Unix time, trajectory ID, x, y, and z coordinates, velocity, acceleration, direction, and angular velocity. Kalman filtering was applied to refine trajectory data and correct occlusions near the flap gate.
In
Figure 1b, the numbers within green circles indicate the subway exits at Samseong Station, and the gray-colored text represents various facilities located within the underground station area.
From the LiDAR trajectory data, the characteristics of subway passengers at Samseong Station can be analyzed in relation to their connectivity with surrounding facilities. Pedestrians choosing specific exits tend to reflect the characteristics of the destinations connected to those exits. For example, exits 3 and 4 of Samseong Station are directly connected to the COEX shopping complex, suggesting that passengers using these exits are likely traveling for shopping and leisure activities. In contrast, exits 5 and 6 are connected to major office buildings, indicating that passengers using these exits are predominantly commuting to and from work.
Trajectory analysis revealed that during the morning peak hours, approximately 51% of pedestrian flow was directed toward exits 3 and 4. During leisure hours, pedestrian movement to exits 3 and 4 accounted for only 22%. In the evening peak hours, approximately 25% of passengers used exits 3 and 4. These findings highlight the correlation between exit selection and travel purpose, demonstrating how subway passenger behavior is influenced by the surrounding environment.
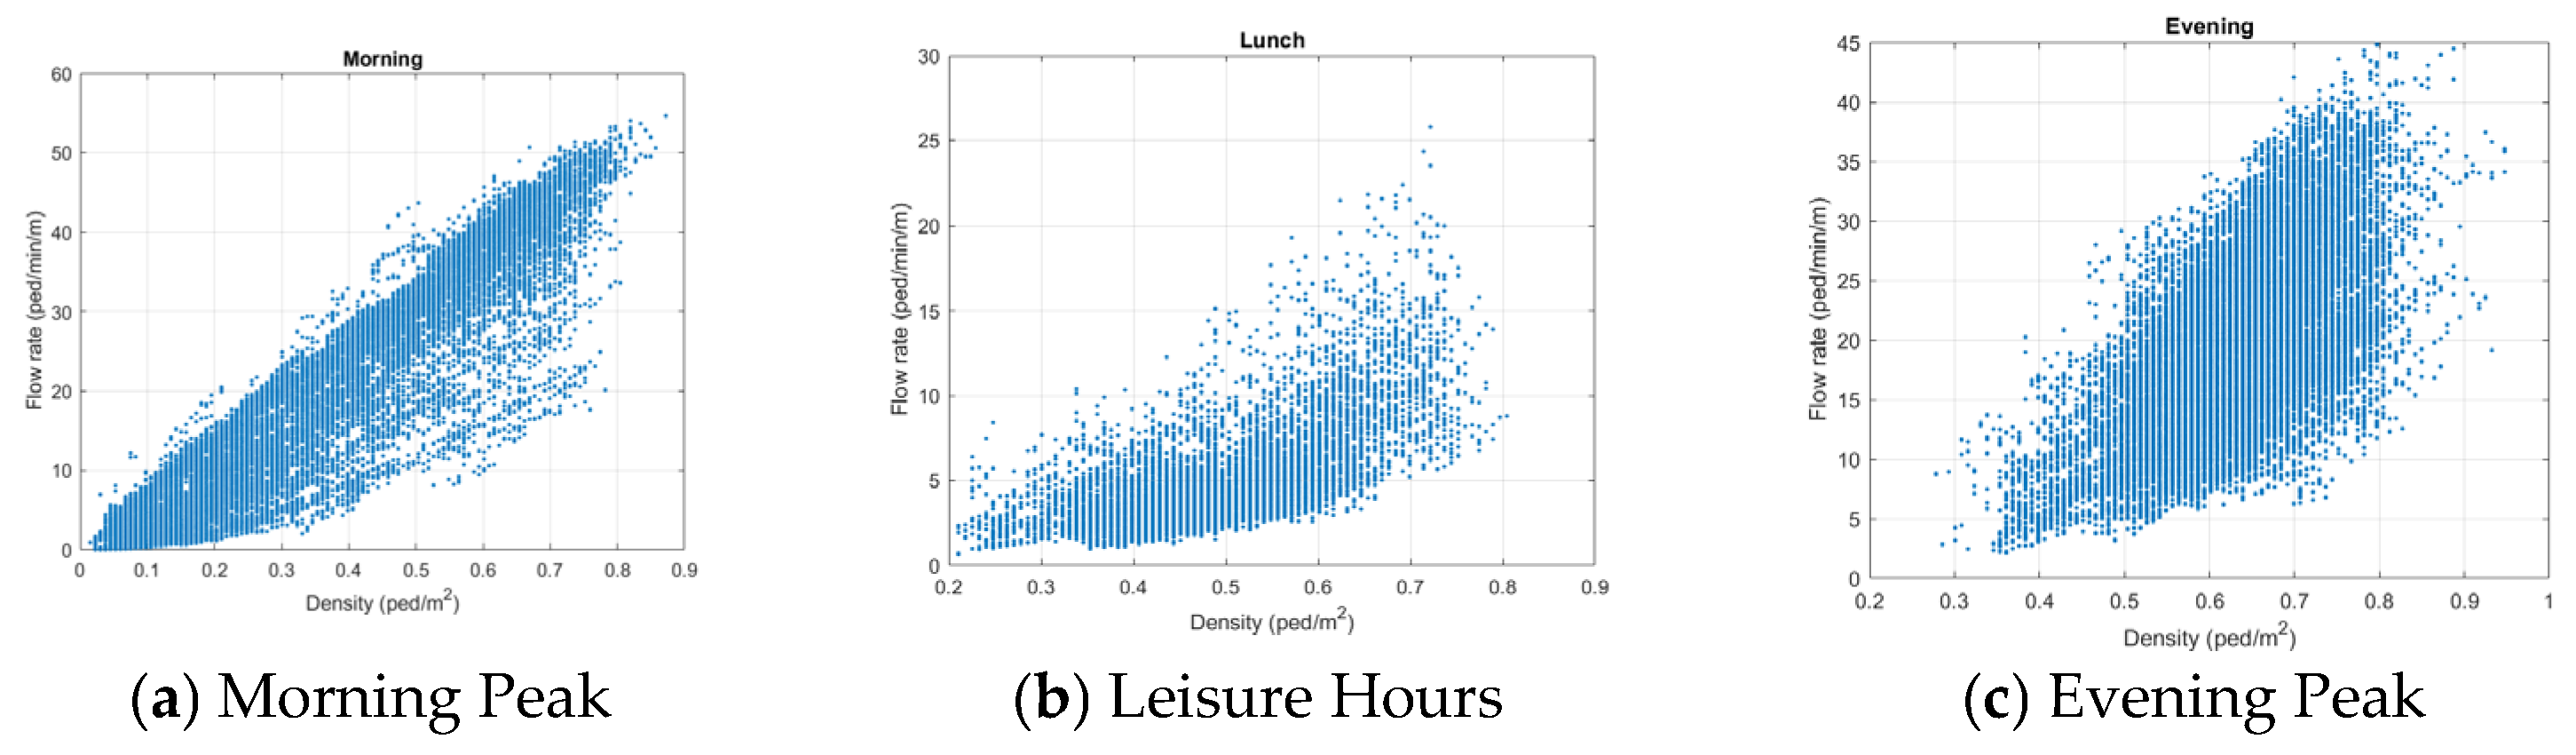
The fundamental flow–density relationship was used to analyze pedestrian traffic flow with the equation
q =
u·
k, where
Q represents the pedestrian flow rate (person/min/m),
u is the average pedestrian velocity (m/s), and
k is the pedestrian density (person/m
2). The pedestrian density was estimated based on a total walkable area of 133 m
2, while velocity values were derived from LiDAR trajectory data.
Figure 2 illustrates the flow–density relationship.
The results show that during the morning peak hours (07:00–09:00), the Level of Service (LOS) ranged from C to D, indicating moderate to high congestion. During leisure hours (14:00–15:00), the LOS ranged from A to B, suggesting relatively smooth pedestrian movement. In the evening peak hours (17:00–19:00), the LOS ranged from B to C, highlighting increasing congestion due to high boarding rates.
4. Model Development
4.1. Mathematical Formulation of the Social Force Model
Pedestrian movement in complex environments is influenced by various factors, including individual intention, interactions with other pedestrians, and environmental constraints. The Social Force Model (SFM) provides a force-based approach to simulate these dynamics, capturing both self-propulsion and repulsive interactions [
8]. By formulating pedestrian motion as a function of social forces, the model effectively represents realistic walking behaviors in high-density areas [
17,
18].
In this model, the total force
fi acting on pedestrian
i is given by:
where:
- -
denotes the total force acting on pedestrian i
- -
is the pedestrian’s mass
- -
is the current velocity at time t
- -
is the desired velocity at time t
- -
represents the relaxation time (i.e., how quickly a pedestrian adapts to the desired velocity)
- -
is the repulsive force from another pedestrian j
- -
is the repulsive force from a wall or obstacle W
The repulsive interaction force with other pedestrians is modeled as:
Similarly, the repulsive interaction with walls or obstacles, modeled as a psychological avoidance behavior, is given by:
where:
- -
and are distances from pedestrian i to pedestrian j or wall W, respectively
- -
the sum of their radii
- -
are unit normal vectors (pointing from j or W toward i)
- -
are tangential direction vectors
- -
, the tangential component of the relative velocity
- -
is a ramp function defined as:
This formulation captures both intentional and reactive components of pedestrian behavior, making the SFM particularly suitable for simulating complex environments such as subway stations. To enhance model fidelity, six parameters are calibrated using empirical trajectory data: reaction time (τᵢ), desired velocity (vᵢ0(t)), social force constant (), distance scale (), body force (φ), and sliding friction force (ω). A dedicated optimization strategy is introduced in the following section to estimate these parameters effectively based on real-world trajectory data.
Since the Social Force Model generates different pedestrian trajectories depending on the parameter settings, accurate calibration of these parameters is essential for achieving high simulation accuracy [
19]. Improper parameter configurations can lead to unrealistic behaviors, such as unnatural acceleration or collision patterns, especially in dense and dynamic environments. Therefore, the optimization process plays a critical role in ensuring that the model faithfully replicates the nuanced variations in pedestrian flow observed in actual subway station contexts.
4.2. RMSProp-Based Optimization Strategy
To calibrate the SFM parameters, this study proposes an integrated optimization framework that combines adaptive learning rates (RMSProp), mini-batch training, and L2 regularization.
RMSProp dynamically adjusts the learning rate for each parameter based on the variance of recent gradients, making it particularly well-suited for problems involving a large number of parameters, as is the case in the current study [
20]. The algorithm provides stable convergence in regions with dense pedestrian interactions while enabling rapid optimization in sparse data environments, making it an effective calibration method for large-scale pedestrian dynamics simulations [
17].
Unlike conventional optimization techniques such as Genetic Algorithms (GA) or Differential Evolution (DE), which are often computationally intensive and slow to converge, RMSProp has been widely recognized in deep learning for its efficiency and robustness. Leveraging these strengths, the algorithm is used in this study to calibrate the key parameters of the Social Force Model (SFM) using empirical pedestrian trajectory data.
To further improve optimization efficiency and generalization performance, several complementary strategies are incorporated, including mini-batch training, L2 regularization, and early stopping. Mini-batch training allows for stable and scalable handling of large trajectory datasets, while L2 regularization suppresses excessive parameter magnitudes and mitigates overfitting. In addition, the early stopping technique automatically terminates training when the validation loss fails to improve over a fixed number of iterations, reducing redundant computation and enhancing the model’s generalizability.
The loss function is defined as the mean squared error (MSE) between the predicted and observed pedestrian velocity vectors, serving as a quantitative measure of how accurately the model replicates real-world movement patterns. The complete RMSProp-based optimization procedure is summarized as a pseudo-code in
Table 2.
4.3. Simulation Setup
The simulation environment was constructed to replicate the physical layout of the observed pedestrian space. Four rectangular exits were placed along the domain boundaries, corresponding to real-world egress points at Samseong Station. To represent physical constraints, two vertical and two horizontal static walls were added. Each pedestrian was assigned a mass of 80 kg, and the simulation time step (Δt) was set to 0.2 s.
Initial values for the six SFM parameters—reaction time (τᵢ), desired speed (vᵢ0), social force constant (Aᵢ), distance scale (Bᵢ), body force (φ), and sliding friction force (ω)—were set based on prior literature (0.5, 1.3, 2000, 0.08, 1.2 × 10⁵, 2.4 × 10⁵) and randomly perturbed within predefined bounds informed by domain expertise. The RMSProp-based optimization was conducted separately for three time segments—morning peak (07:00–09:00), leisure hours (14:00–15:00), and evening peak (17:00–19:00)—using trajectory data collected via LiDAR sensors.
To ensure efficiency and generalization, a mini-batch size of 1024 was used. RMSProp parameters included a learning rate of 1 × 10⁻⁴, decay rate (β) of 0.9, and ε = 1 × 10⁻⁸. Parameter updates were bounded within plausible ranges, and L2 regularization (λ = 1 × 10⁻⁴) was applied to prevent overfitting.
5. Simulation Results
5.1. Training and Validation Loss Analysis
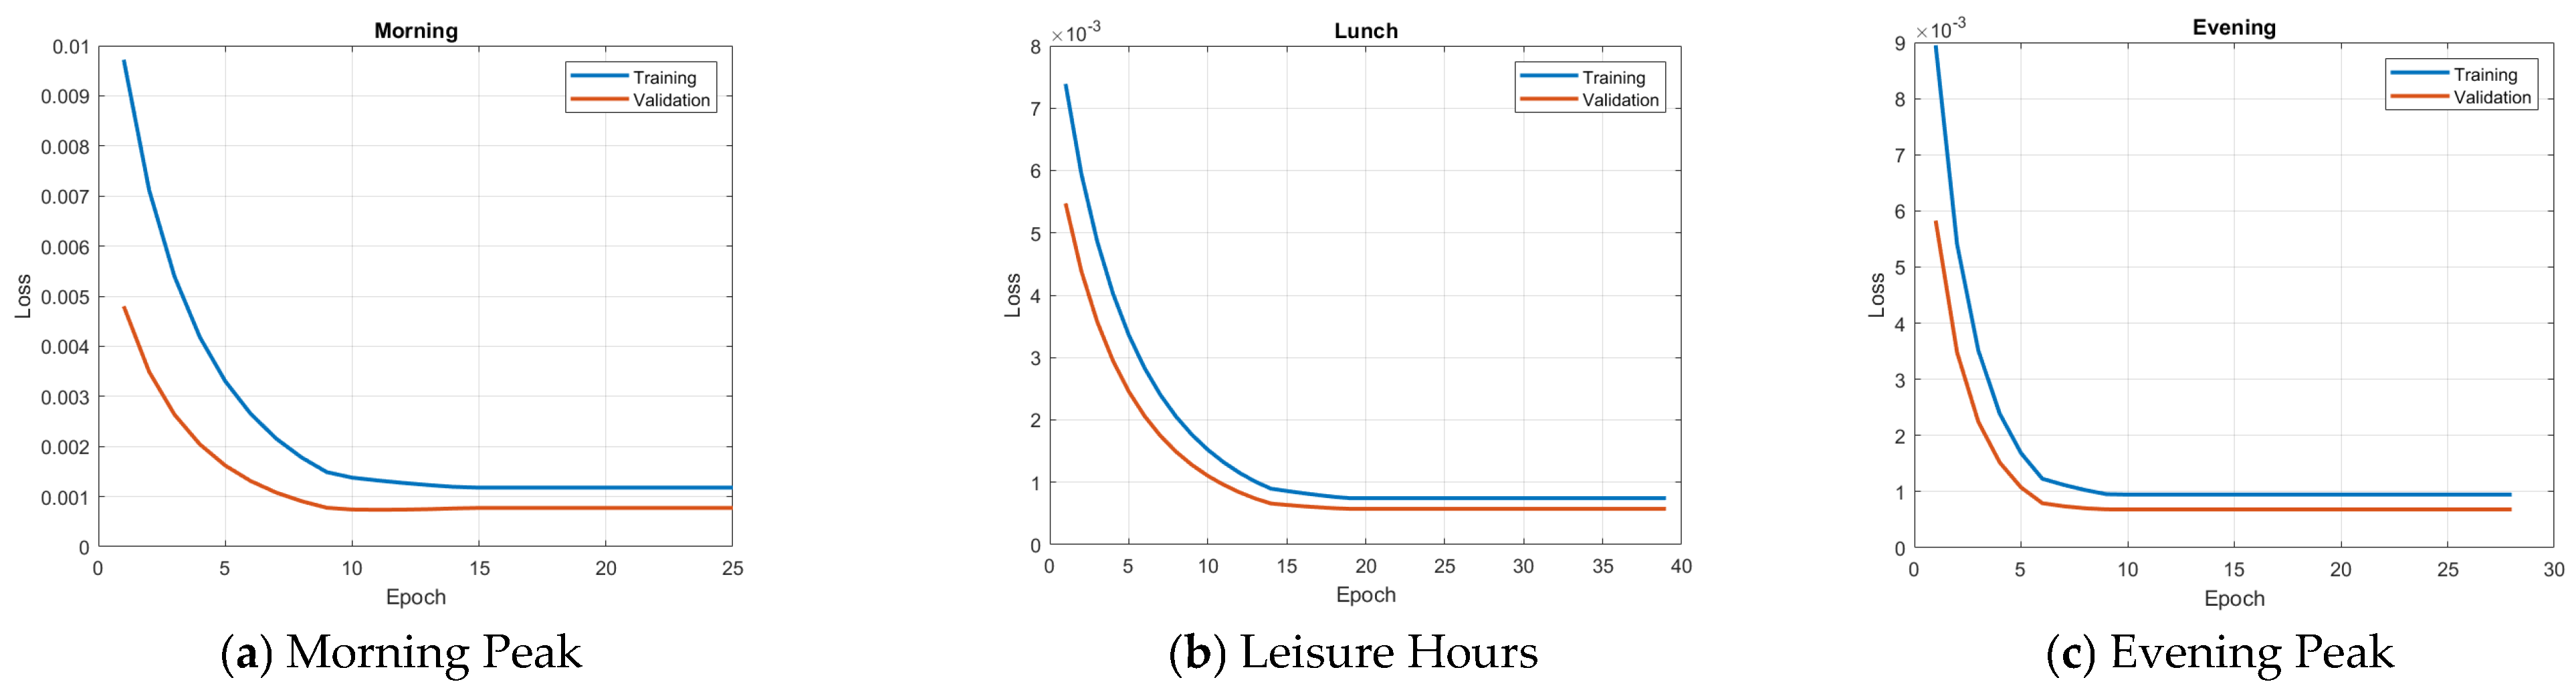
Model performance was evaluated by computing the mean squared error (MSE) between predicted and observed pedestrian velocity vectors in both the x and y directions. The training and validation loss curves for each time segment are presented in
Figure 3, illustrating stable convergence under varying pedestrian flow conditions. These results indicate that the RMSProp-based calibration effectively reduced prediction errors without overfitting, thereby supporting the reliability of the simulation results.
The optimization algorithm was applied to three datasets corresponding to distinct time periods: the morning peak (07:00–09:00), leisure hours (14:00–14:30), and the evening peak (18:00–19:00). Each period exhibited different pedestrian dynamics, suggesting the potential need for time-specific parameter optimization. Nevertheless, a uniform model structure was applied across all datasets. The learning curves revealed three consistent patterns:
- i.
rapid convergence in the early phase due to adaptive learning rate adjustment;
- ii.
stable decline in both training and validation losses during the mid phase;
- iii.
early stopping in the final phase to prevent overfitting.
Figure 3 illustrates these learning and validation curves for each time of day, highlighting the model’s adaptability to various levels of crowd density.
5.2. Time-Specific SFM Parameter Analysis
The optimized parameters of the Social Force Model varied significantly by time period. During the morning peak, the desired velocity was relatively high at 0.66 m/s, reflecting the urgency of commuter behavior. In contrast, the leisure period exhibited lower interaction intensity and more balanced movement patterns. During the evening peak, the social force coefficients increased, indicating the need to capture complex pedestrian interactions and congestion patterns during that time.
Table 3 presents the optimized parameter values for different time periods. The parameter optimization results revealed variations across different time periods. During the morning peak, commuters exhibited a higher desired velocity (0.66 m/s) due to their urgency to reach their destinations. In leisure hours, pedestrian interactions were relatively lower, resulting in more balanced movement patterns. In the evening peak, the social force parameters increased, reflecting complex pedestrian interactions and congestion management needs.
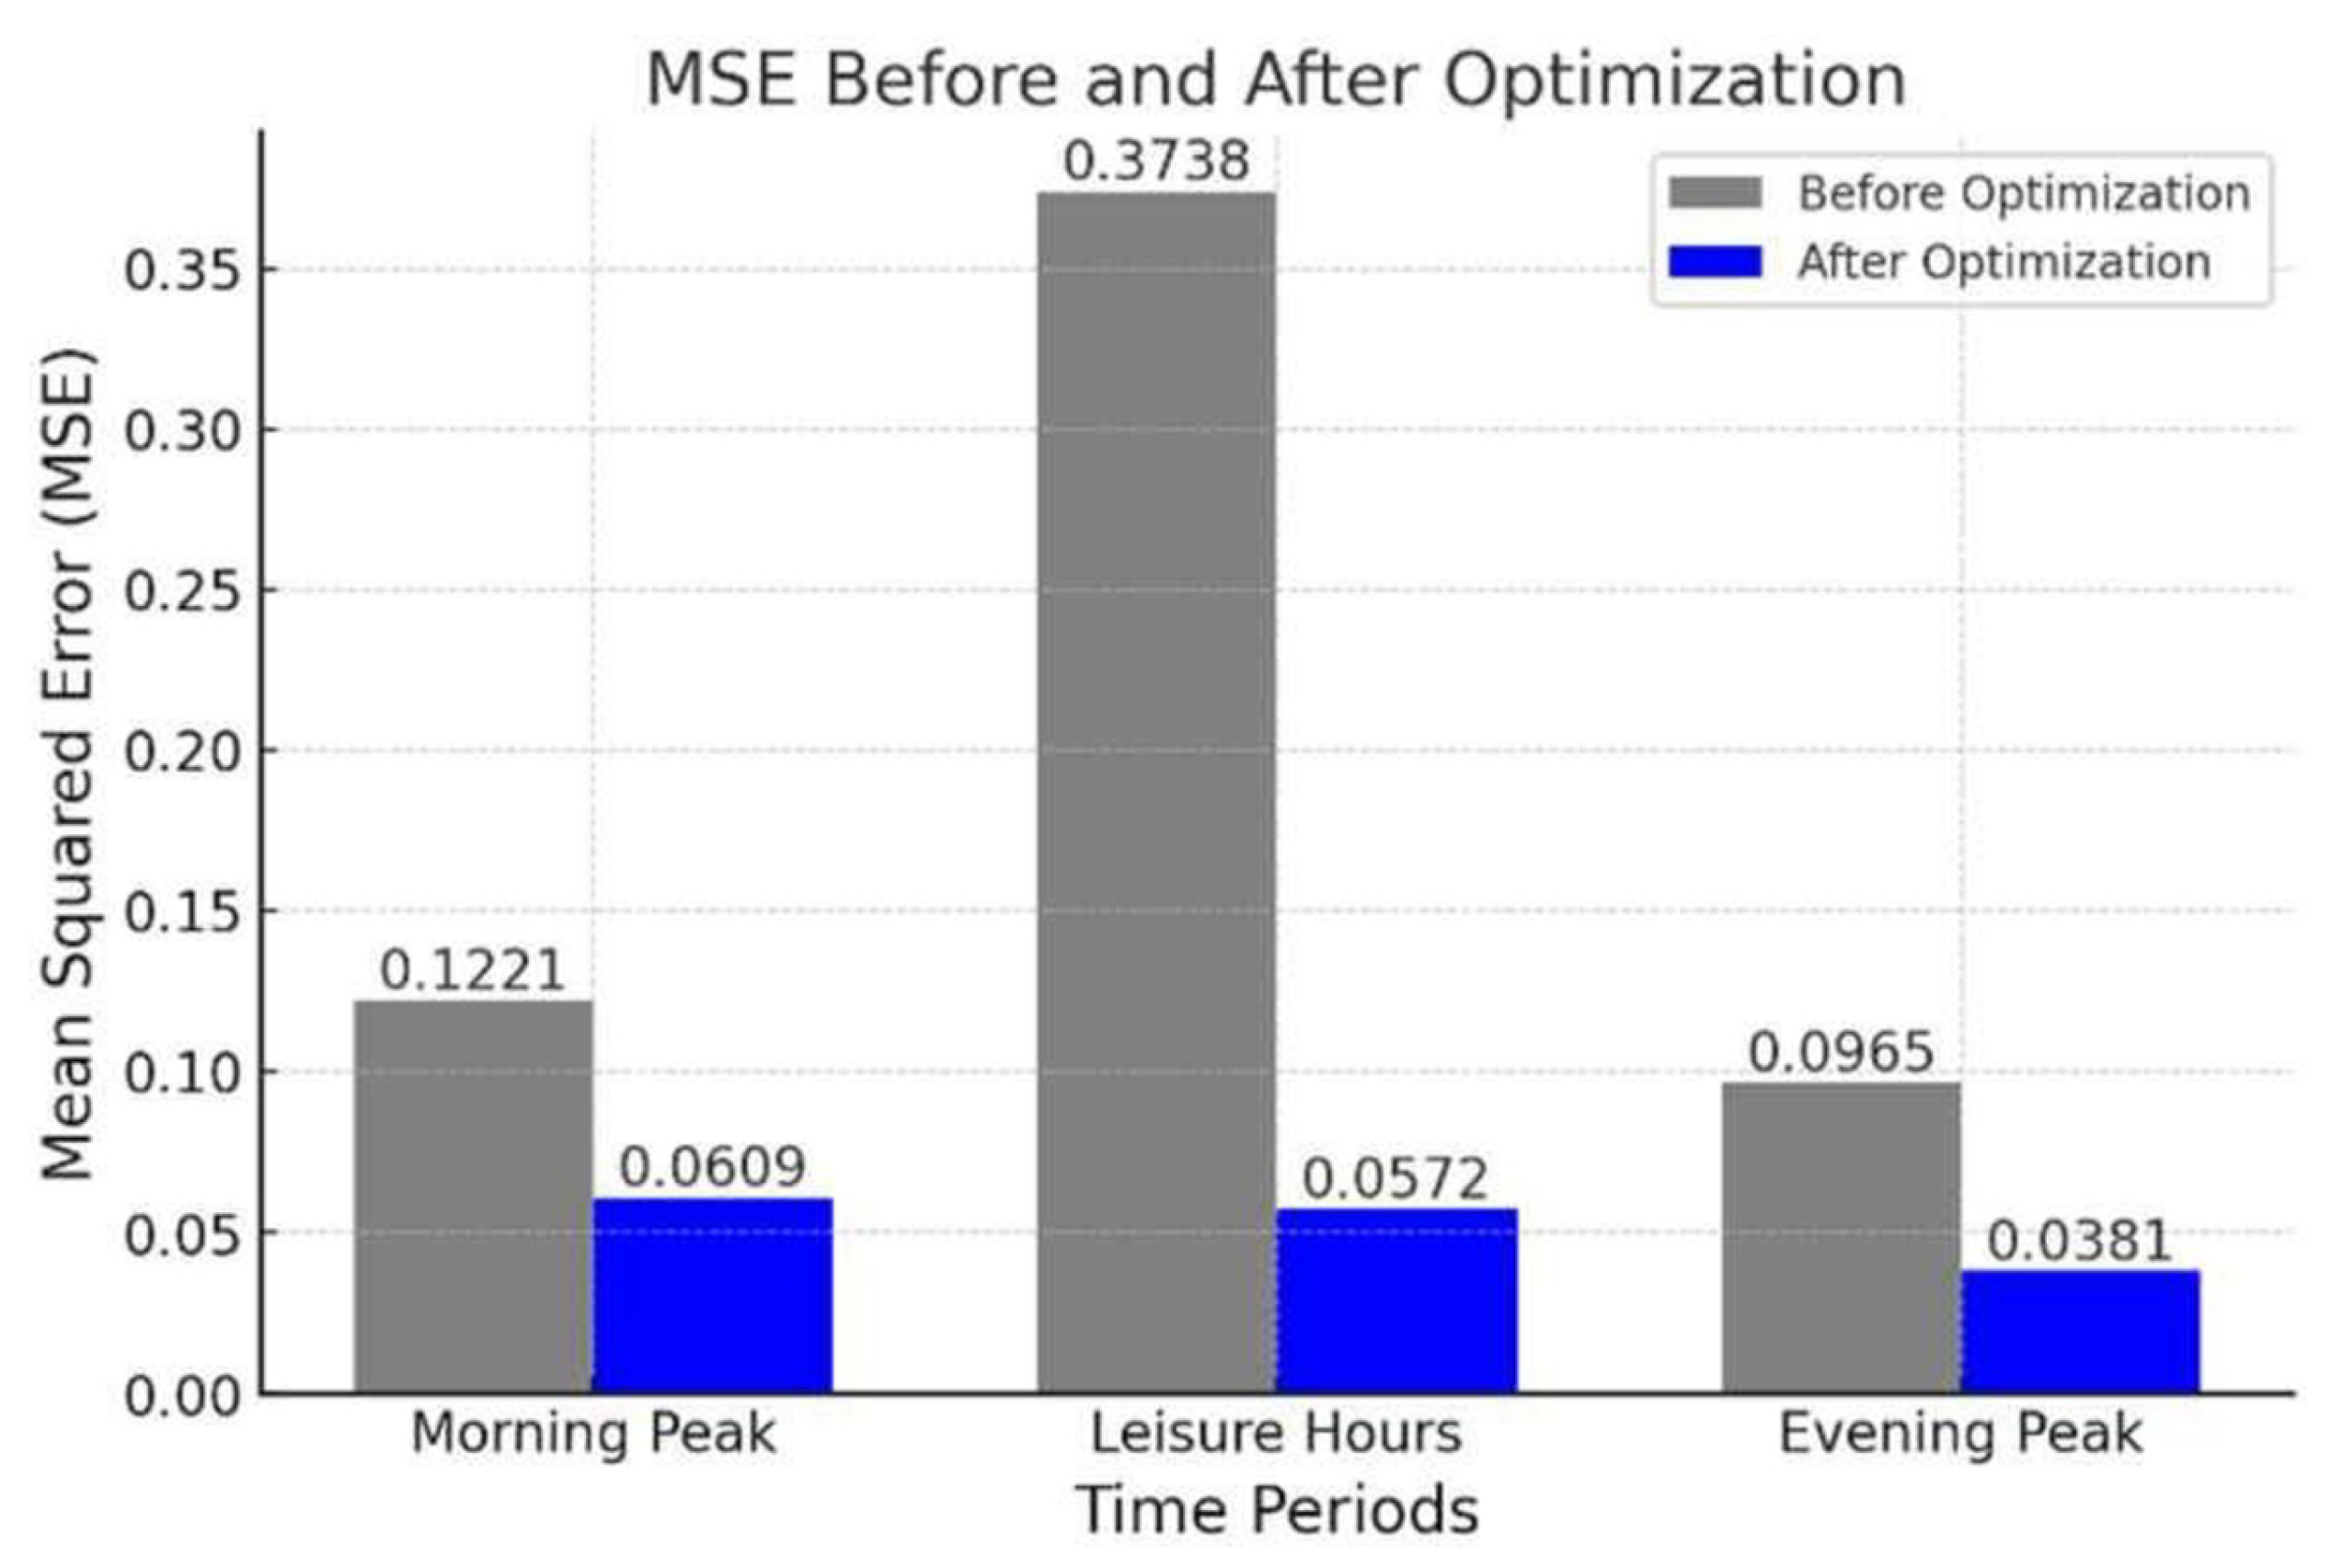
5.3. Comparing MSE Between Before and After Optimization
The effectiveness of the optimization was further assessed by comparing MSE values before and after training. As illustrated in
Figure 4, the MSE decreased from 0.1221 to 0.0609 during the morning peak, from 0.3738 to 0.0572 during leisure hours, and from 0.0965 to 0.0381 during the evening peak. This represents a reduction ranging from a minimum of 50.1% to a maximum of 84.7%, demonstrating an enhanced explanatory power in capturing pedestrian behavior. This result suggests that the MSE before optimization varies by time of day, indicating that the default SFM’s performance depends on specific pedestrian flow characteristics. In contrast, the MSE after optimization suggests that similar performance can be achieved for each time-of-day dataset once the optimization is completed, thereby enhancing the model’s reliability and credibility.
The overall accuracy of the model’s prediction performance improved after optimization, as further illustrated in
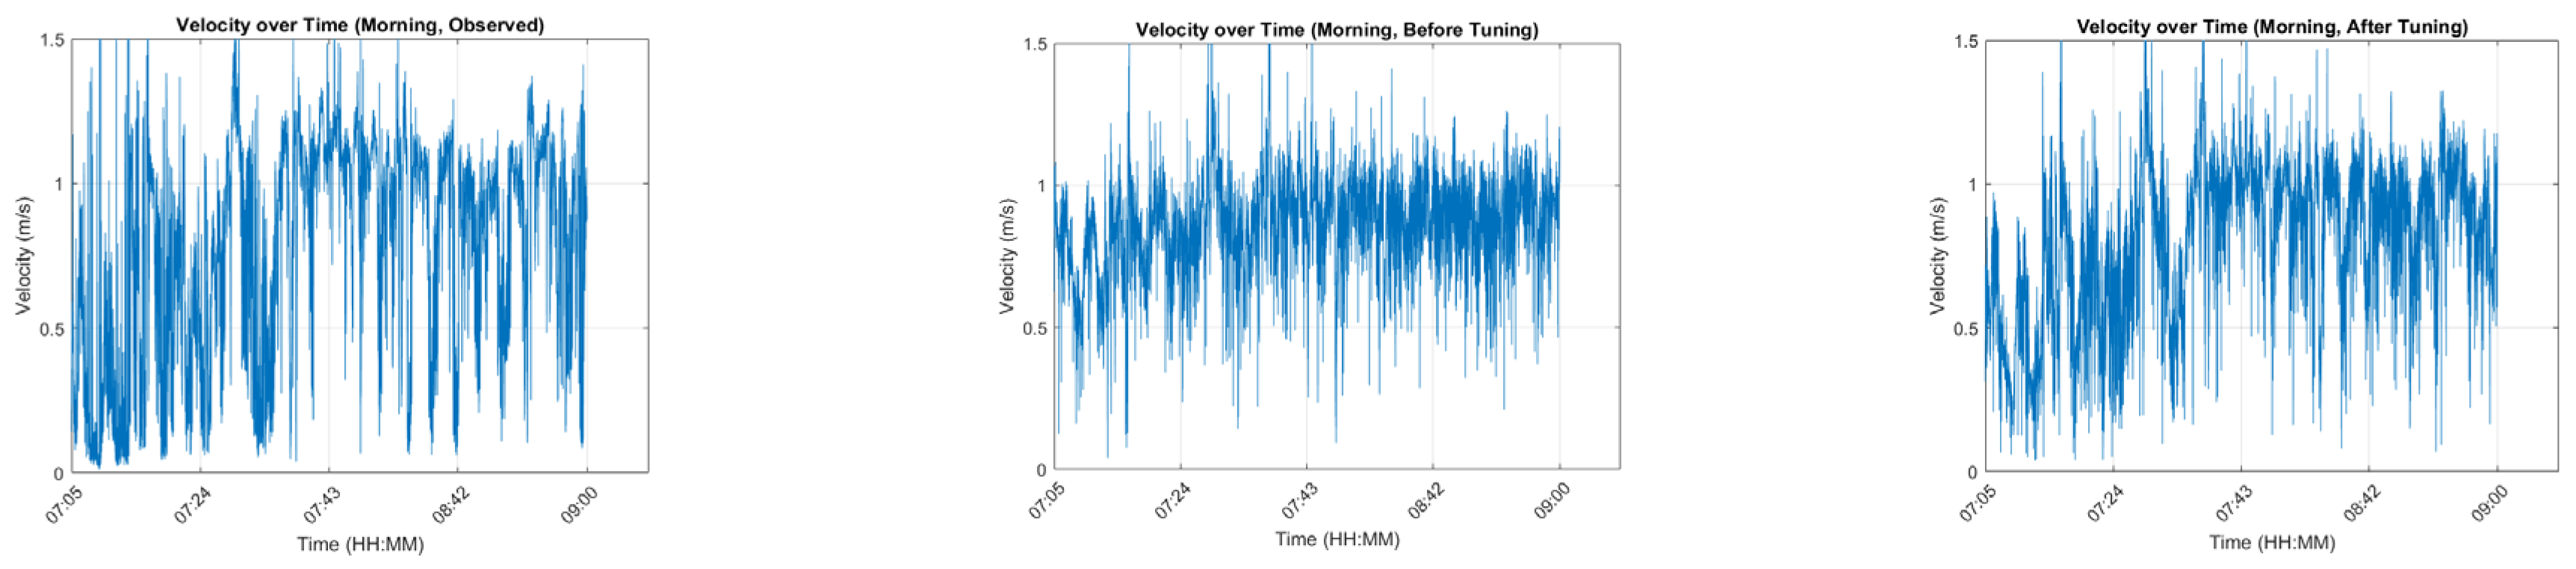
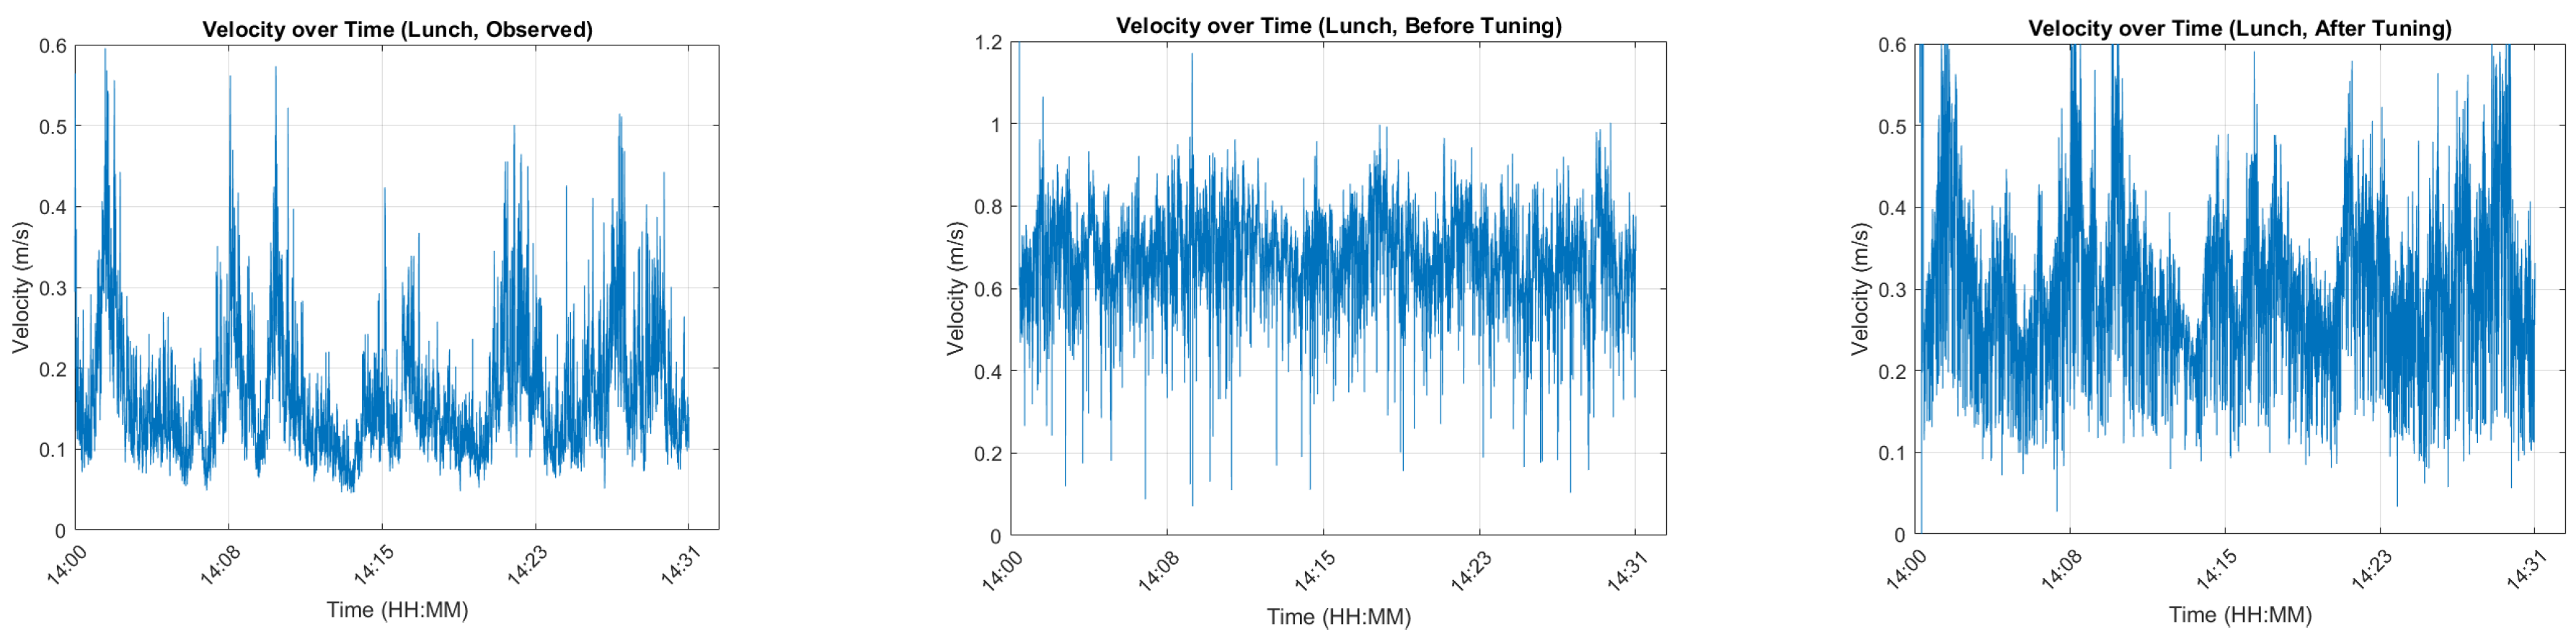
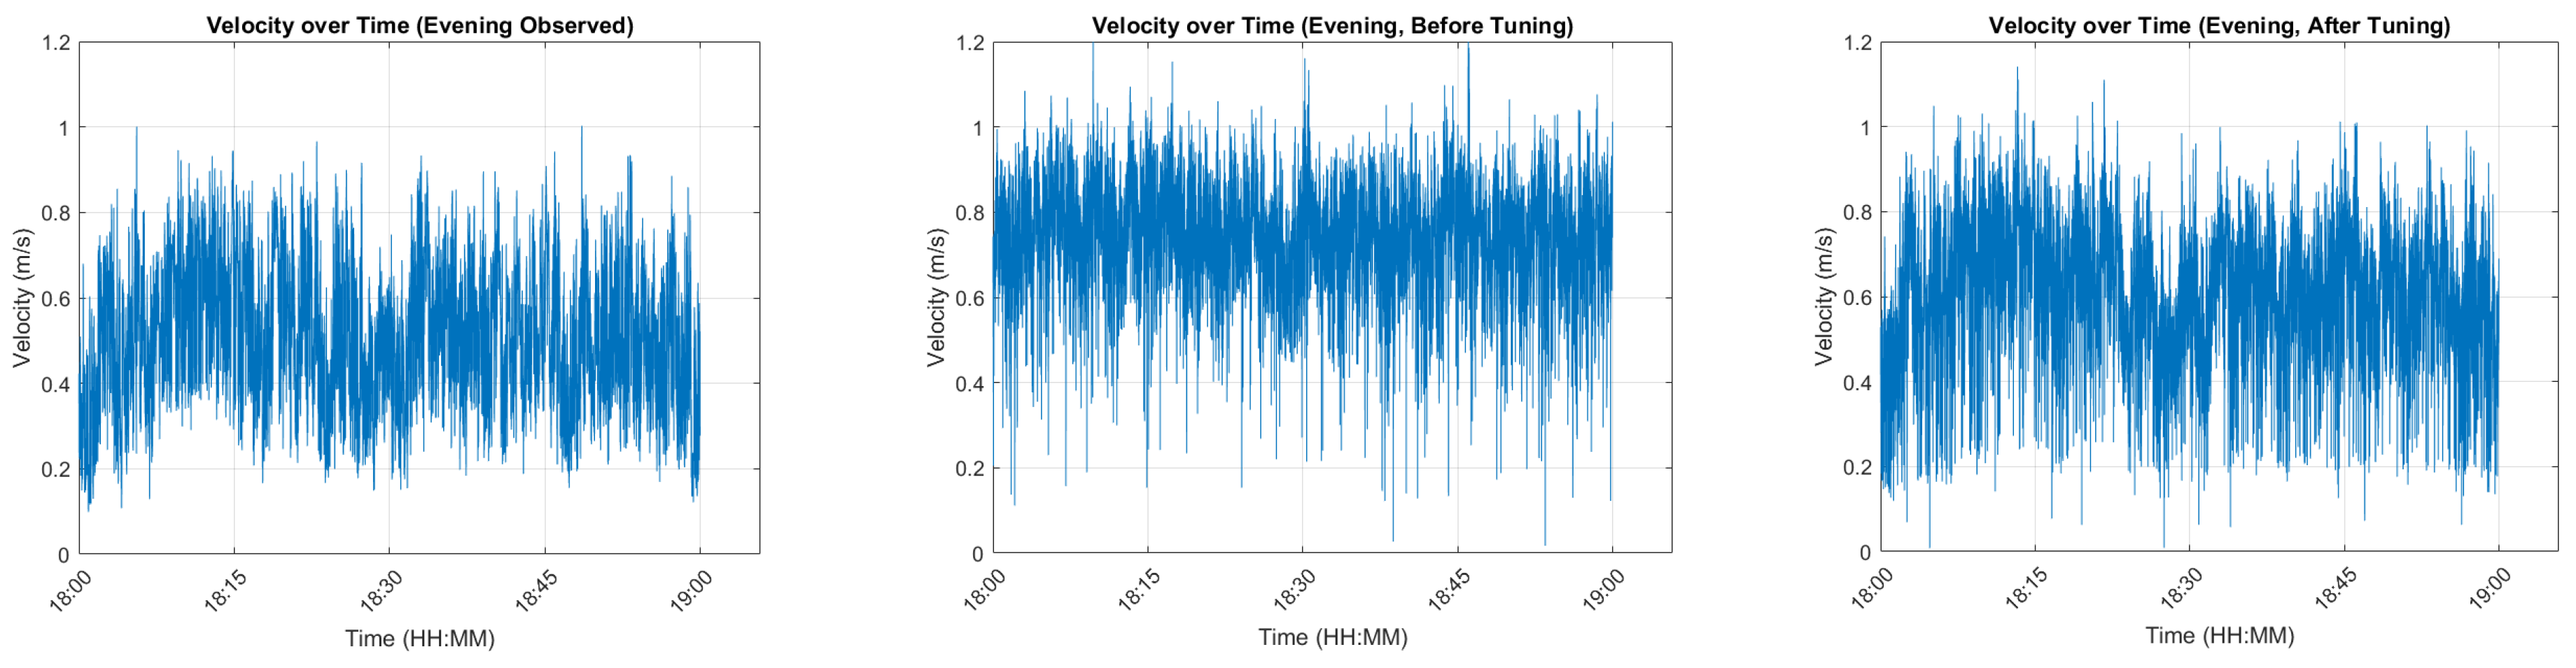
Figure 5. A time-series comparative analysis revealed several key findings: During the morning peak, the optimized model generated predictions that closely aligned with the observed average speed, accurately capturing the initial low-speed walking state. During leisure hours, the predicted speed better reflected variations in observed speed and exhibited greater sensitivity to periodic fluctuations in walking velocity. In the evening peak, the pre-optimization model struggled to represent atypical walking patterns accurately.
5.4. Velocity Prediction Accuracy Analysis
To assess the temporal accuracy of the model, the predicted pedestrian speeds (both before and after optimization) were compared with the observed speeds for each time of day. The velocity-over-time plots for each period are presented in
Figure 5,
Figure 6 and
Figure 7, where each figure consists of three panels: the left panel shows the observed pedestrian speeds, the middle panel shows the speeds predicted by the before-optimization model, and the right panel shows the speeds predicted by the after-optimization model. Specifically,
Figure 5 presents results for the morning peak and for the leisure hours, and
Figure 7 presents results for the evening peak period.
During the morning peak, the optimized model more accurately captured the initial low-speed walking state observed in the empirical data. For the leisure period, the model effectively reproduced periodic fluctuations in walking speed. Notably, the observed trajectory data revealed a recurring pattern in which walking speeds increased at intervals of approximately 2–3 min. The optimized model successfully predicted this phenomenon, reflecting a realistic response to train arrival schedules in the subway station—an important feature of pedestrian dynamics during this period. In the evening peak, the pre-optimization model failed to capture irregular walking behaviors. However, after optimization, the model was able to reflect such atypical patterns more clearly. Visual inspection of the velocity curves confirms that the optimized model produced significantly more accurate predictions under complex evening conditions.
Overall, the before-optimization model exhibited noticeable errors in segments characterized by periodic speed fluctuations, whereas the after-optimization model substantially reduced these errors and accurately reproduced time-dependent walking dynamics across all time periods. These findings confirm that the Social Force Model can effectively capture pedestrian behavior in diverse subway station environments when its parameters are rigorously calibrated through an appropriate optimization process.
6. Conclusions
This study developed a pedestrian-flow simulation tailored to the intricacies of Samseong Station in Seoul by fusing high-resolution LiDAR trajectories with a Social Force Model (SFM) whose parameters were rigorously calibrated via an RMSProp optimization scheme. Segmenting the dataset into three distinct time-of-day intervals—morning peak, leisure hours, and evening peak—enabled the model to reproduce the pronounced temporal heterogeneity in walking behavior that arises from shifting trip purposes and fluctuating density levels.
The RMSProp-based calibration markedly enhanced predictive fidelity, most notably in velocity estimation. The optimized model faithfully replicated gradual acceleration patterns characteristic of the morning commute, cyclic speed oscillations during midday leisure activity, and the erratic dynamics associated with evening congestion. Crucially, it retained high reliability under dense, unstable flow conditions, underscoring its robustness for real-world deployment.
Beyond its empirical accuracy, the model offers immediate operational value for congestion mitigation and real-time station management, and its computational efficiency makes it well-suited for integration into digital twin platforms that support dynamic scenario analysis and emergency-response training. Ultimately, the proposed modeling approach serves as a foundational tool for the implementation of Sustainable Urban Mobility Plans (SUMPs), particularly as Intelligent Info-mobility Systems gain momentum in urban infrastructure. By aligning data-driven simulation with policy-oriented objectives, this research contributes to the creation of mobility strategies that are inclusive, adaptive, and sustainable.
Nevertheless, this study primarily focused on conventional pedestrian interactions. Future research should aim to incorporate more complex behavioral mechanisms, including responses to environmental cues such as signage, spatial constraints, and real-time congestion feedback. Furthermore, accounting for individual-level heterogeneity—such as age, baggage possession, and other personal attributes—along with group-based dynamics will be essential for enhancing the model’s descriptive richness and applicability. The establishment of standardized benchmarking frameworks is also crucial for evaluating model performance across diverse subway station types and structural configurations. Addressing these research directions will substantially improve the predictive accuracy, scalability, and generalizability of pedestrian simulation models, thereby advancing the design of safer, more intelligent, and operationally efficient subway systems.
Author Contributions
Conceptualization, G.H.K. and J.L.; methodology, G.H.K.; software, G.H.K.; validation, G.H.K. and J.L.; formal analysis, G.H.K.; writing—original draft preparation, G.H.K.; writing—review and editing, J.L.; supervision, J.L. All authors have read and agreed to the published version of the manuscript.
Funding
This work was supported by the IITP (Institute of Information & Communications Technology Planning & Evaluation)-ICAN (ICT Challenge and Advanced Network of HRD) grant funded by the Korea government (Ministry of Science and ICT) (IITP-2025-RS-2024-00436954).
Institutional Review Board Statement
Not applicable.
Informed Consent Statement
Not applicable.
Data Availability Statement
Data is not available due to privacy issues of observed pedestrians.
Conflicts of Interest
The authors declare no conflict of interest.
References
- Yeongdong-Daero Underground Space Complex Development. Available online: https://uri.seoul.go.kr/web/contents/57.do?mid=1149 (accessed on 10 April 2025).
- Seok, Y.S.; Kang, C.H. A study on planning of multi-modal transfer centers in railway stations. Proc. Archit. Inst. Korea Conf. 2018, 38, 255–258. (In Korean) [Google Scholar]
- Kim, J.H.; Han, S.Y.; Lee, U.D. A study on congestion levels in subway station environments. Korean Soc. Railw. Conf. 2008, 6, 1810–1816. (In Korean) [Google Scholar]
- Wang, S.; Wang, Z. Collaborative development and transportation volume regulation strategy for an urban agglomeration. Sustain. 2023, 15, 14742. [Google Scholar] [CrossRef]
- Zhao, H.T.; Yang, S.; Chen, X.X. Cellular automata model for urban road traffic flow considering pedestrian crossing street. Phys. A Stat. Mech. Its Appl. 2016, 462, 1301–1313. [Google Scholar] [CrossRef]
- Calabrò, G. A new agent-based model to simulate demand-responsive transit in small-sized cities. Sustainability 2025, 17, 5279. [Google Scholar] [CrossRef]
- Han, M.J. A pedestrian space analysis program reflecting pedestrian behavior. Railw. J. 2015, 18, 103–108. (In Korean) [Google Scholar]
- Helbing, D.; Molnar, P. Social force model for pedestrian dynamics. Phys. Rev. E 1995, 51, 4282. [Google Scholar] [CrossRef]
- Yang, D.; Özgüner, Ü.; Redmill, K. A social force based pedestrian motion model considering multi-pedestrian interaction with a vehicle. ACM Trans. Spat. Algorithms Syst. 2020, 6, 1–27. [Google Scholar] [CrossRef]
- Shafaghat, A. Path walkability assessment framework based on decision tree analysis of pedestrian travelers’ retail walking. Ph.D. Thesis, Universiti Teknologi Malaysia, Skudai, Malaysis, March 2013. [Google Scholar]
- Zamboni, S.; Kefato, Z.T.; Girdzijauskas, S.; Norén, C.; Dal Col, L. Pedestrian trajectory prediction with convolutional neural networks. Pattern Recognit. 2022, 121, 108252. [Google Scholar] [CrossRef]
- Xue, H.; Huynh, D.Q.; Reynolds, M. SS-LSTM: A hierarchical LSTM model for pedestrian trajectory prediction. In Proceedings of the IEEE Winter Conference on Applications of Computer Vision (WACV), Lake Tahoe, NV, USA, 12–15 March 2018; pp. 1186–1194. [Google Scholar]
- Fang, F.; Zhang, P.; Zhou, B.; Qian, K.; Gan, Y. Atten-GAN: Pedestrian trajectory prediction with GAN based on attention mechanism. Cogn. Comput. 2022, 14, 2296–2305. [Google Scholar] [CrossRef]
- Everett, M.; Chen, Y.F.; How, J.P. Collision avoidance in pedestrian-rich environments with deep reinforcement learning. IEEE Access. 2021, 9, 10357–10377. [Google Scholar] [CrossRef]
- Seoul Metropolitan City. Transportation Policy Division. Available online: https://data.seoul.go.kr/dataList/OA-12914/S/1/datasetView.do (accessed on 10 April 2025).
- Jo, Y.; Jeong, E.; You, S.I.; Oh, C. Trajectory pattern analysis using LiDAR-based pedestrian tracking. J. Korean Soc. Transp. 2018, 36, 503–518. (In Korean) [Google Scholar] [CrossRef]
- Lee, J.; Kim, T.; Chung, J.H.; Kim, J. Modeling lane formation in pedestrian counter flow and its effect on capacity. KSCE J. Civ. Eng. 2016, 20, 1099–1108. [Google Scholar] [CrossRef]
- Zeng, W.; Chen, P.; Nakamura, H.; Iryo-Asano, M. Application of social force model to pedestrian behavior analysis at signalized crosswalk. Transp. Res. Part C Emerg. Technol. 2014, 40, 143–159. [Google Scholar] [CrossRef]
- Sticco, I.M.; Frank, G.A.; Dorso, C.O. Social force model parameter testing and optimization using a high stress real-life situation. Phys. A: Stat. Mech. Its Appl. 2021, 561, 125299. [Google Scholar] [CrossRef]
- Zou, F.; Shen, L.; Jie, Z.; Zhang, W.; Liu, W. A sufficient condition for convergences of adam and rmsprop. In Proceedings of the IEEE/CVF Conference on Computer Vision and Pattern Recognition (CVPR), Long Beach, CA, USA, 15–20 June 2019; pp. 11119–11127. [Google Scholar]
| Disclaimer/Publisher’s Note: The statements, opinions and data contained in all publications are solely those of the individual author(s) and contributor(s) and not of MDPI and/or the editor(s). MDPI and/or the editor(s) disclaim responsibility for any injury to people or property resulting from any ideas, methods, instructions or products referred to in the content. |
© 2025 by the authors. Licensee MDPI, Basel, Switzerland. This article is an open access article distributed under the terms and conditions of the Creative Commons Attribution (CC BY) license (https://creativecommons.org/licenses/by/4.0/).


