Abstract
Intensive energy consumption in the building sector remains one of the primary contributors to climate change and global warming. Within Renewable Energy Communities (RECs), improving energy management is essential for promoting sustainability and reducing environmental impact. Accurate forecasting of energy consumption at the community level is a key tool in this effort. Traditionally, engineering-based methods grounded in thermodynamic principles have been employed, offering high accuracy under controlled conditions. However, their reliance on exhaustive building-level data and high computational costs limits their scalability in dynamic REC settings. In contrast, Artificial Intelligence (AI)-driven methods provide flexible and scalable alternatives by learning patterns from historical consumption and environmental data. This study investigates three Machine Learning (ML) models, Decision Tree (DT), Random Forest (RF), and CatBoost, and one Deep Learning (DL) model, Convolutional Neural Network (CNN), to forecast community electricity consumption using real smart meter data and local meteorological variables. The study focuses on a REC in Loureiro, Portugal, consisting of 172 residential users from whom 16 months of 15 min interval electricity consumption data were collected. Temporal features (hour of the day, day of the week, month) were combined with lag-based usage patterns, including features representing energy consumption at the corresponding time in the previous hour and on the previous day, to enhance model accuracy by leveraging short-term dependencies and daily repetition in usage behavior. Models were evaluated using Mean Squared Error (MSE), Mean Absolute Percentage Error (MAPE), and the Coefficient of Determination . Among all models, CatBoost achieved the best performance, with an MSE of 0.1262, MAPE of 4.77%, and an of 0.9018. These results highlight the potential of ensemble learning approaches for improving energy demand forecasting in RECs, supporting smarter energy management and contributing to energy and environmental performance.
1. Introduction
Energy consumption in buildings significantly contributes to the rise in greenhouse gas emissions, a major driver of global warming. According to the United Nations Global Status Report 2022, approximately 37% of global carbon dioxide (CO2) emissions originate from the built environment sector, with 27% specifically attributed to energy use in buildings. This increase is primarily due to growing demands for heating, cooling, cookin, and electricity, much of which continues to be powered by fossil fuels [1]. In response, considerable global efforts are focused on achieving net-zero emissions and full decarbonisation. Given the strong correlation between energy use and CO2 emissions, systematic monitoring and management of energy consumption are essential for meeting these sustainability goals [2]. RECs, defined under the European Union’s Renewable Energy Directive (RED II), have emerged as a promising solution to these challenges. They are legal entities based on open and voluntary participation, autonomy, and local control. Their primary goal is to deliver environmental, economic, and social benefits to the local area rather than generate profits [3]. RECs operate within decentralized and citizen-driven frameworks, promoting energy sharing and local renewable generation. This study focuses on a real-world example of such a community, a local electricity cooperative in Loureiro, Portugal, comprising 172 residential buildings equipped with smart meters that record electricity consumption at 15 min intervals [4]. The community’s structure and operation align with the REC model as it is geographically localized, cooperatively managed, and oriented toward energy sustainability. This data-rich environment provides a valuable case for exploring AI-based forecasting methods within RECs. Throughout this paper, the term ’energy consumption’ refers specifically to electricity usage as measured by smart meters. AI has increasingly been applied to energy management systems (EMS), where it significantly enhances efficiency and operational performance [5]. In REC, AI technologies support key functions such as energy scheduling optimization, load forecasting, battery management, weather prediction, emissions reduction, network security, and predictive maintenance [6]. Among these functions, accurate forecasting of energy consumption is critical. It enables the optimization and coordination of energy supply and demand, supports emissions estimation, and facilitates cost-effective energy management strategies between communities and energy providers [7]. The integration of big data and AI techniques further empowers researchers to analyze consumption behavior across communities and develop robust forecasting models [8]. Achieving high forecasting accuracy in RECs relies on the availability of high-quality data, consideration of seasonal trends, external influences such as weather, and alignment of model complexity with forecasting objectives within decentralized energy systems.
The intersection of AI, machine learning (ML), Deep Learning (DL), and renewable energy systems has attracted increasing attention in recent years. Numerous studies have explored how advanced data-driven models can support EMS by enhancing forecasting accuracy, demand-side flexibility, and integration of renewable sources into power grids [5,6,8]. In particular, forecasting energy consumption plays a vital role in optimising load balancing, reducing operational costs, and improving the self-sufficiency of RECs. Existing literature presents a range of ML and DL approaches, such as DT, ensemble learning, Support Vector Machines (SVMs), Long Short-Term Memory (LSTM) networks, and CNNs, to forecast energy consumption at the household or community level. These models have been applied to various contexts, from single-building monitoring to city-scale smart grid scenarios. However, their performance is highly dependent on the quality of the data, the temporal resolution, and the presence of influential characteristics such as weather conditions, use patterns over time, and sociodemographic factors [7,8].
Recent research has increasingly applied CNN to short-term energy forecasting tasks in both building and community energy systems. Originally developed for computer vision, CNNs have shown strong capabilities in capturing spatial dependencies within multivariate time series data, making them well-suited for energy forecasting applications [9]. CNN models have been successfully used to predict energy consumption at both the building and community levels, offering fast computation and efficient pattern extraction from complex datasets [10].
Further contributions have extended these methods to the domain of RECs, where decentralized consumers collectively generate and consume renewable energy. Studies such as [3] demonstrate how RECs can serve as a practical framework for deploying optimized forecasting and scheduling tools aimed at improving local energy self-consumption and minimizing interaction with the power grid. Similarly, ref. [11] proposed a structured roadmap for REC implementation, covering phases such as feasibility analysis, member aggregation, energy system deployment, and operational energy management. Despite these advances, a gap remains in evaluating and comparing forecasting model performance in real-world REC settings using high-resolution data. Many prior studies rely on simulated datasets or overlook the influence of temporal lag features, which have shown potential to significantly enhance prediction accuracy. In addition, limited research has focused on local energy cooperatives in rural or semi-urban European contexts, which often exhibit unique consumption behaviours shaped by community structure, microclimate, and socioeconomic factors.
To address these gaps, this study develops and compares multiple ML and DL models using real-world REC data from Loureiro, Portugal. The objective is to evaluate the impact of temporal and lag-based features on forecasting accuracy in community-level energy planning. By doing so, the study contributes to the ongoing discourse on data-driven energy management in RECs and provides actionable insights for improving energy self-sufficiency and operational sustainability. The remainder of the paper is structured as follows. Section 2 describes the materials and methods, including data collection, preprocessing, and model development. Section 3 presents the results and discussion. Finally, Section 4 concludes the paper and outlines directions for future research.
2. Materials and Methods
2.1. Data Collection
The energy consumption data, recorded at 15 min intervals from 172 residential users in a local energy cooperative in Loureiro, Portugal, is accompanied by meteorological variables. The complete dataset spans 46,608 time-stamped entries and is publicly available for research use [4]. As is common in real-world datasets, it contains missing values and potential outliers that can significantly affect the performance of models.
2.2. Data Preprocessing
Data preprocessing prepared the dataset for model development. As is typical of real-world energy datasets, the raw data contained missing values and potential outliers, which can significantly impact the accuracy of predictive models. To ensure data quality, all columns and rows with more than 75% missing values were eliminated. This preprocessing step resulted in the removal of approximately 12% of the original time-stamped entries. As shown in Figure 1, extended periods of missing data, particularly during the summer of 2023, were visually identified and confirmed during statistical validation. These gaps contributed to the removal of 28 complete days with missing or unreliable data as part of the cleaning process. To impute missing values, meteorological variables were filled using column means, while missing values in energy consumption were addressed using a forward-fill method, supplemented by backward fill for initial gaps. This two-step approach ensured that there were no missing values in the dataset. Outlier detection was performed using the interquartile range method, and extreme values were clipped to fall within the lower and upper bounds, minimizing their influence on model performance [12]. Finally, standard score normalization was applied to all numerical features to ensure uniform scaling. Normalization was applied using the StandardScaler function in Python’s scikit-learn library [13].
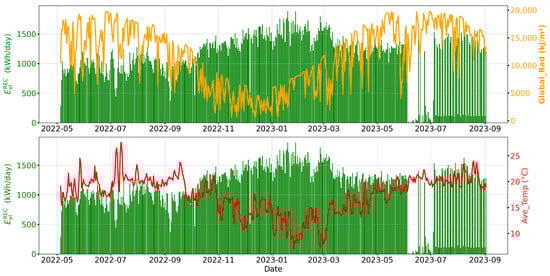
Figure 1.
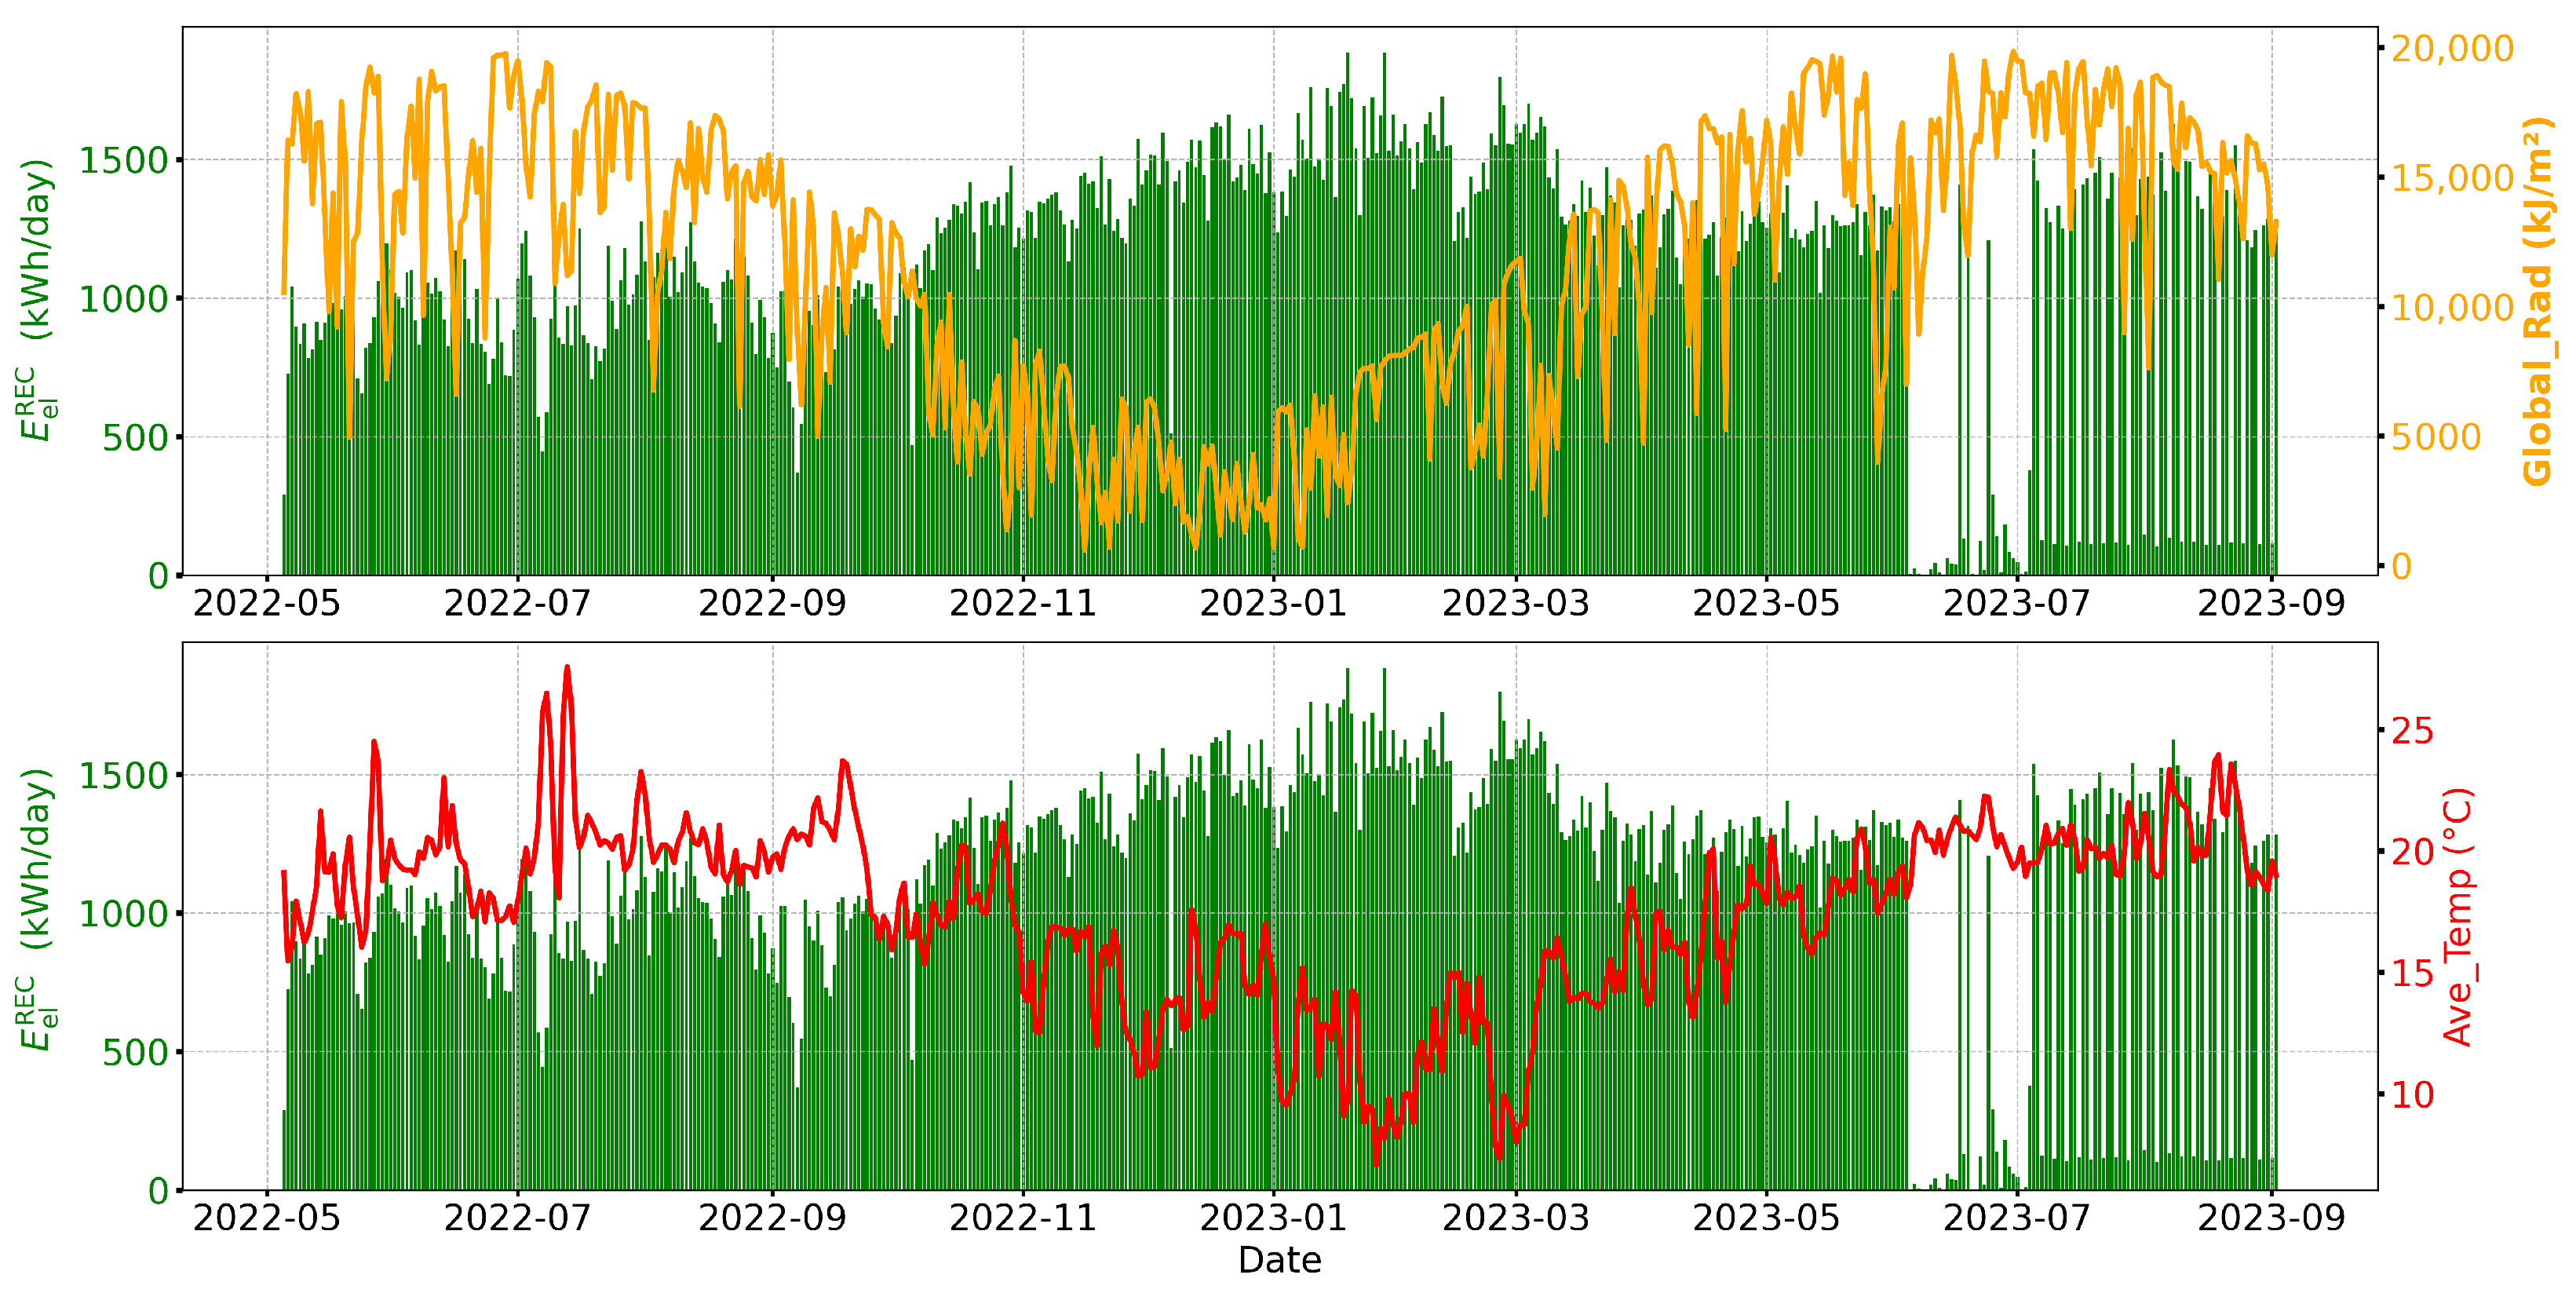
Daily variation of community energy consumption (kWh), solar radiation (KJ/m2), and average temperature (°C) from 5 May 2022 to 2 September 2023.
2.3. Exploratory Data Analysis and Feature Selection
The original time series data were aggregated daily to facilitate seasonal and environmental analysis. The daily energy consumption of the community was calculated by adding individual readings from the energy meters for all users for each day. Similarly, daily solar radiation and average daily temperatures were calculated to support environmental correlation analysis. This aggregation enabled the investigation of seasonal effects on energy use, particularly whether consumption increases during periods of lower sunlight, such as in winter or on cloudy days. As Figure 1 illustrates, REC energy consumption exhibits a clear inverse pattern concerning solar radiation and temperature, suggesting reduced dependence on artificial lighting, heating, and cooling systems during warmer and brighter months.
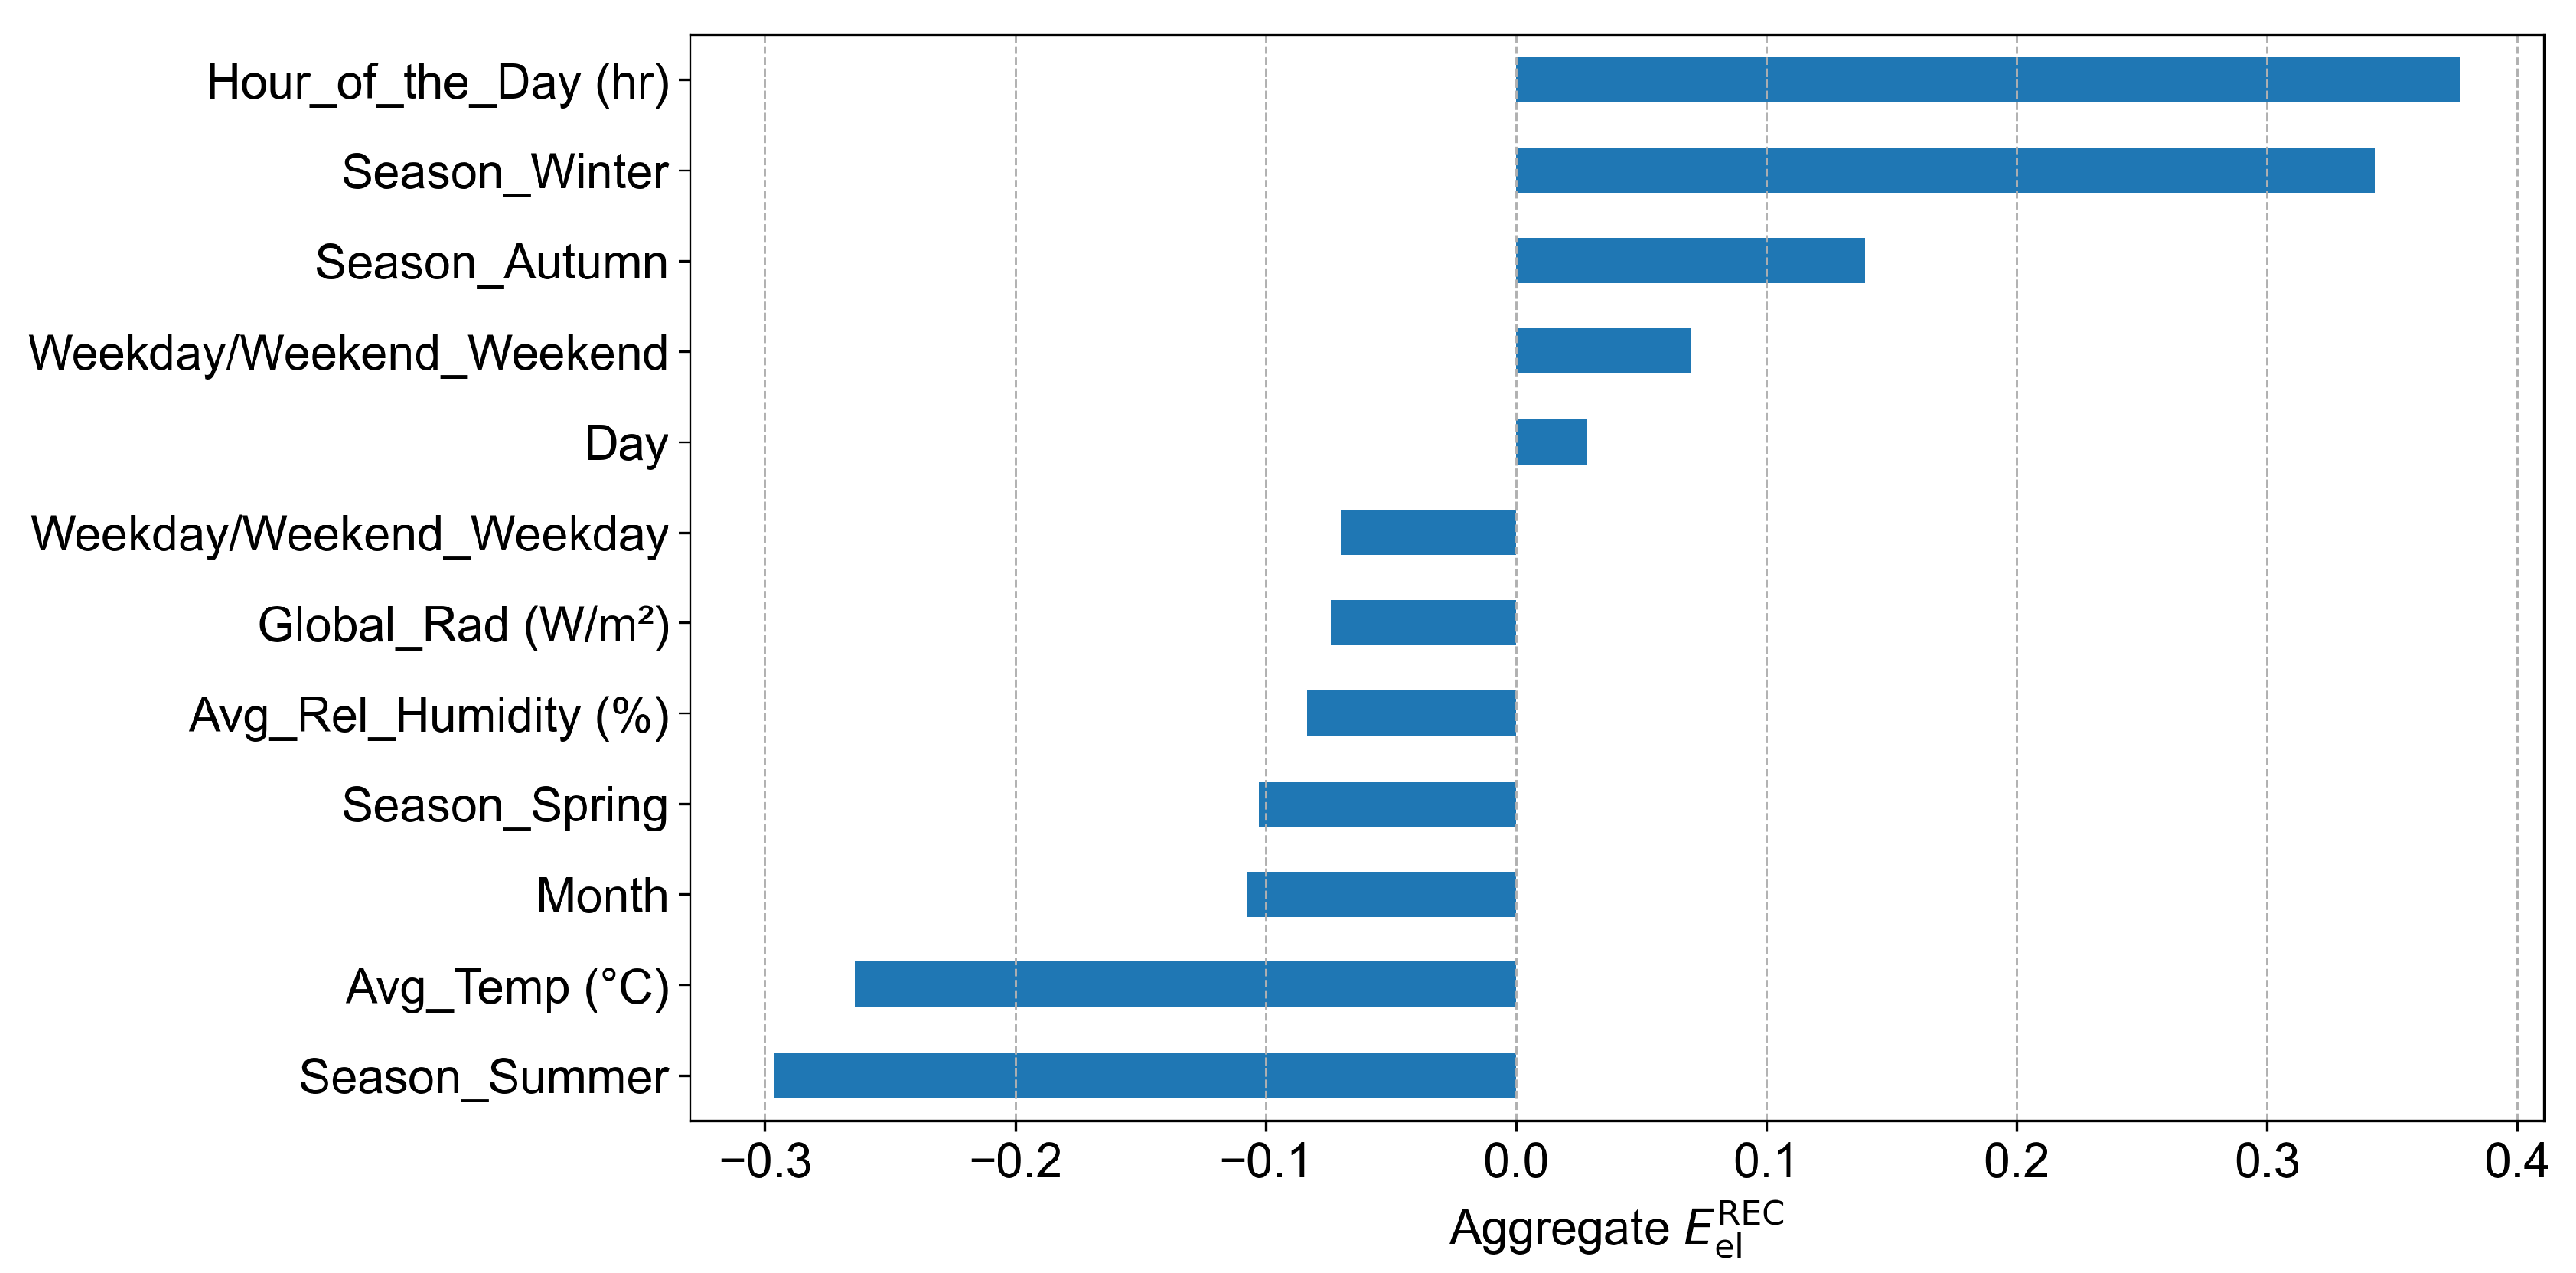
Correlation analysis was performed to evaluate the relationships between candidate features and total REC energy consumption (), a standard approach in energy forecasting research [14]. In this study, total was calculated by aggregating the consumption across all users at each time step. Correlation coefficients were computed between and candidate input features to assess their relevance. The results in Figure 2 show that the hour of the day demonstrated the strongest positive correlation, followed by categorical indicators for winter and autumn. Weather-related factors, including global radiation and average temperature, showed moderate to weak negative relationships with energy consumption. Based on these results, we designed two feature configurations for model development to assess the predictive power of temporal and meteorological variables, with and without lagged features. The initial model configuration incorporated only exogenous variables, including weather-related factors (average temperature, humidity, and solar radiation) and temporal indicators (hour of the day, day of the week, month, season, and a binary indicator for weekday versus weekend). The second configuration extended this baseline by integrating endogenous consumption features derived from historical observations. Specifically, it included the energy consumption from one hour prior to the current time step, as well as the consumption recorded at the same time on the previous day. These temporally shifted inputs capture short-term dependencies and daily cyclical patterns, enabling the model to learn autoregressive behaviors that are often predictive of near-future demand.
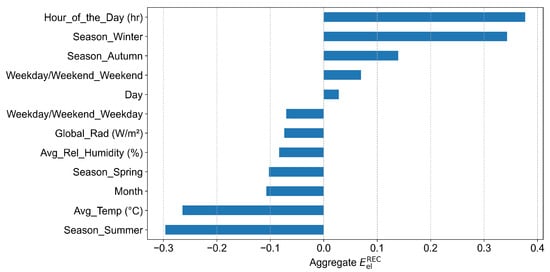
Figure 2.
Correlation of community energy consumption with meteorological and temporal input features used for model development.
2.4. Model Development
Based on the selected input features, this study developed a suite of ML and DL models aimed at forecasting energy consumption within the REC. ML techniques were selected for their ability to capture complex, nonlinear relationships among environmental, temporal, and consumption-related variables, offering greater flexibility, scalability, and predictive accuracy compared to traditional engineering approaches. Three ML models, RF, DT, and CatBoost, were employed for the forecasting task. RF, introduced by Breiman [15], was selected for its robustness in handling high-dimensional data and its strong generalization capabilities. It constructs an ensemble of decision trees, each trained on a random subset of data and features, which helps reduce overfitting and improve model stability [16]. DTs, based on the classification and regression trees methodology, are well suited to capture nonlinear patterns in energy consumption data. However, they are prone to overfitting when used independently, which necessitates ensemble methods like RF and boosting algorithms for improved accuracy [17]. CatBoost, a gradient-boosting algorithm optimized for categorical variables, was also employed. It uses ordered boosting and advanced mechanisms for handling missing data, making it particularly effective for mixed-type datasets often encountered in real-world energy forecasting. Prior studies have highlighted CatBoost’s superior performance in short-term energy consumption prediction tasks, particularly when working with smart meter data [18,19].
In addition to these ML models, a CNN was implemented to capture localized temporal patterns in energy consumption. CNNs are known for their ability to learn hierarchical representations from sequential data, which enhances their effectiveness in time-series forecasting. The implemented CNN architecture comprised two one-dimensional convolutional layers (Conv1D) with 128 and 64 filters, respectively, activated using Rectified Linear Unit (ReLU). These layers were followed by batch normalization and max pooling for downsampling. The output was flattened and passed through two fully connected 128- and 64-neurone layers, incorporating dropout regularization. The model was trained using the Adam optimizer with a learning rate of 0.0005 and employed MSE as the loss function. Early stopping was used to prevent overfitting during training.
2.5. Evaluation Metrics
The forecasting performance of the ML and DL models was evaluated using three standard regression metrics: MAE in Equation (1), MAPE in Equation (2), and in Equation (3). These metrics quantify the prediction accuracy as follows:
Here, denotes the actual energy consumption at time step k, represents the predicted value; is the mean of the actual values; and n is the total number of observations. MAE provides the average magnitude of the errors, MAPE expresses the error as a percentage of actual values, and measures the proportion of variance explained by the model.
3. Results and Discussion
Building on the dataset introduced in Section 2.2, this section outlines how the data was prepared for model development and how different input configurations were constructed. To ensure chronological consistency, the dataset was split based on time order. Specifically, 80% of the data, 32,709 rows representing 351 days, was used for training, and the remaining 20%, representing 106 days, was used for testing and evaluation on unseen data.
3.1. Experimental Design and Feature Configuration
Two experimental feature setups were designed. The first included standard temporal and meteorological features, while the second incorporated historical consumption variables representing the energy usage from one hour earlier and from the same time on the previous day to capture short-term dependencies. This dual approach enables a comparative evaluation of forecasting performance, with and without the inclusion of historical consumption context, supporting energy consumption forecasting and operational planning within the REC framework.
3.2. Results
The forecasting performance of the developed models is evaluated in this section, with emphasis on the impact of feature configurations on predictive accuracy. The models DT, RF, CatBoost, and CNN were assessed under two input settings: one using baseline features alone, consisting of temporal and meteorological variables such as hour, day of the week, month, temperature, humidity, and solar radiation, and another extending this set with lag-based variables to capture short-term dependencies. Performance results under both configurations are summarized in Table 1. Without the inclusion of lag-based inputs, CatBoost achieved the lowest error, reaching a value of 0.2270, followed by RF at 0.2332. DT and CNN recorded higher values of 0.2679 and 0.2711, respectively, indicating limited responsiveness to rapid changes in consumption patterns. Upon integrating lag-based features, all models exhibited substantial improvements. CatBoost demonstrated a 44.4% reduction in error, RF improved by 41.6%, DT by 41.0%, and CNN by 37.6%. These results underscore the importance of incorporating historical consumption information into model inputs. A similar trend was observed for relative error, as measured by MAPE. Under the baseline configuration, CatBoost achieved the lowest value of 6.29%, followed by RF at 6.33%. DT and CNN recorded higher errors at 6.71% and 7.00%, respectively. With lag features included, CatBoost showed a 24.2% reduction, while RF, DT, and CNN improved by 22.1, 22.2, and 18.9%, respectively.

Table 1.
Comparison of model performance (MSE, MAPE, and ) under two input configurations: baseline features and extended features including lag variables, sorted by with lag features.
In terms of variance explained, CatBoost again outperformed all other models with a value of 0.9018 under the lag-based configuration, up from 0.8173 without lag. This corresponds to a 10.4% relative improvement. RF, DT, and CNN also showed gains of 10.1, 11.8, and 11.0%, respectively, indicating enhanced model fit with the addition of historical context.
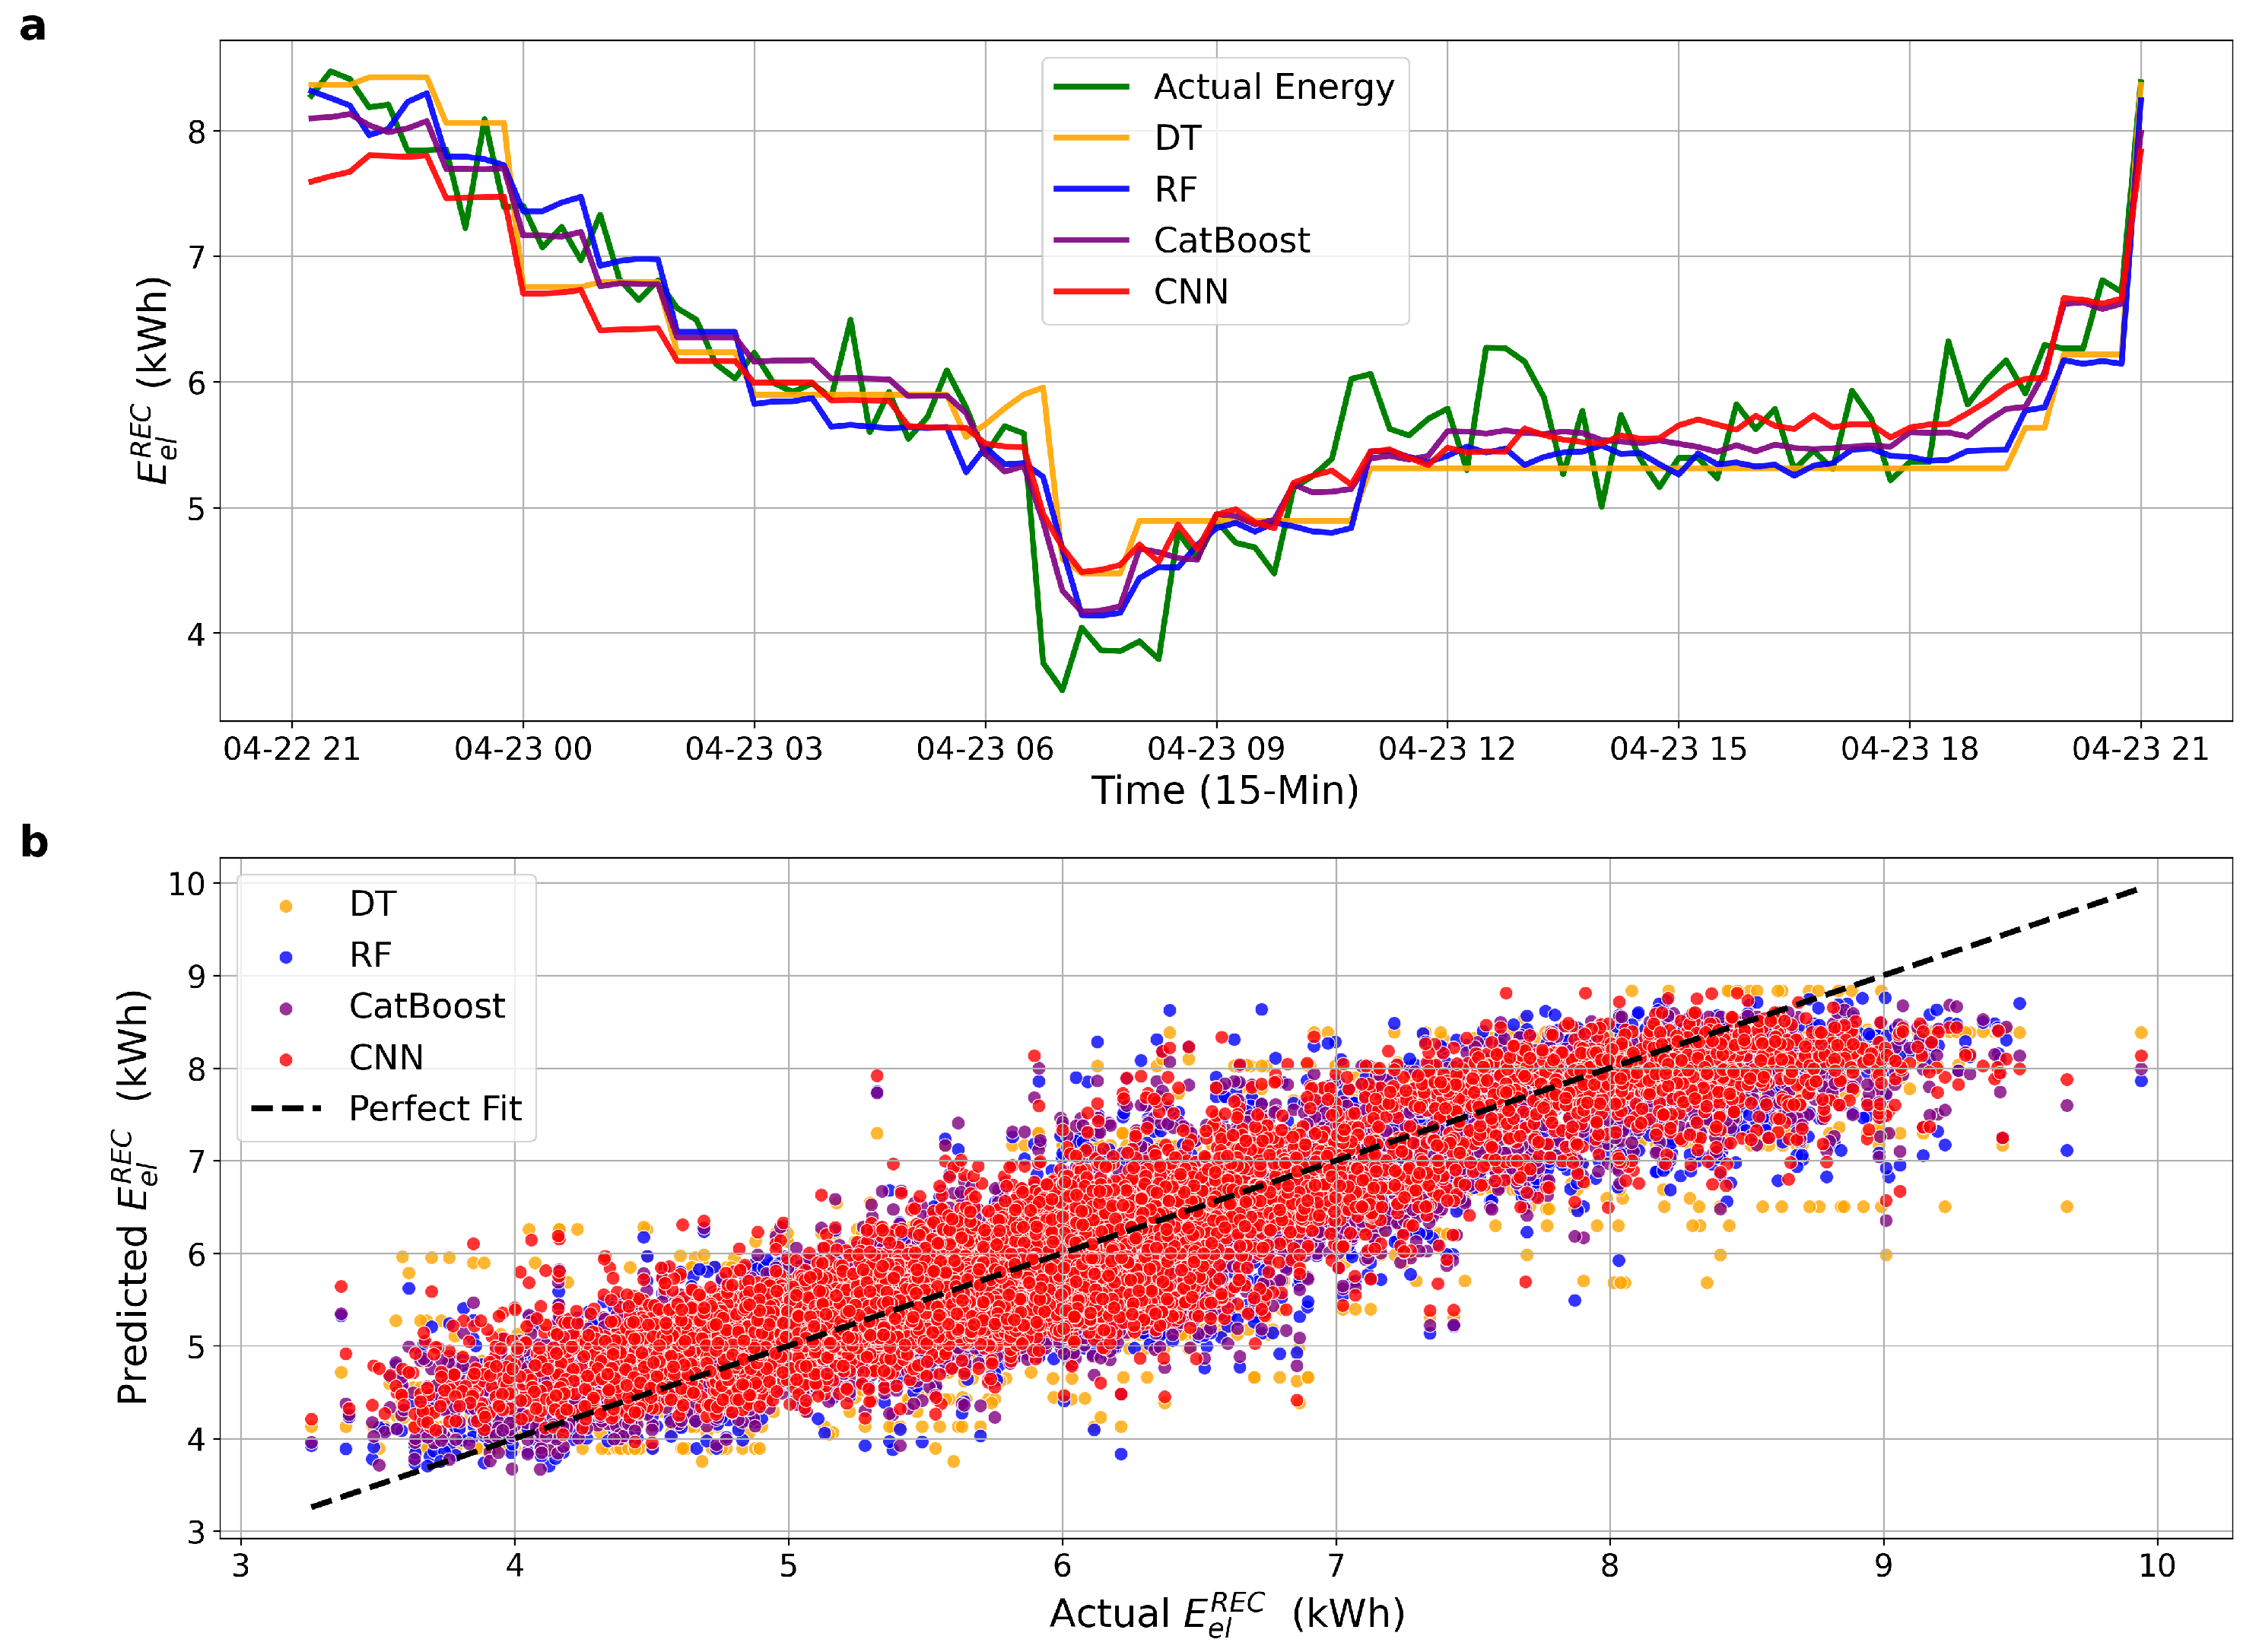
Figure 3 presents the forecasting results for DT, RF, CatBoost, and CNN models using the baseline feature configuration. In Figure 3a, the models generally follow the overall trend of actual energy consumption; however, their ability to capture abrupt transitions, especially during morning and evening transitions, remains limited. Figure 3b illustrates the scatter relationship between predicted and actual values. The dispersion around the ideal fit line indicates notable deviation, especially for DT and CNN. These observations reinforce the quantitative results, suggesting that the absence of lag-based variables restricts the model’s capacity to accurately respond to short-term fluctuations in demand.
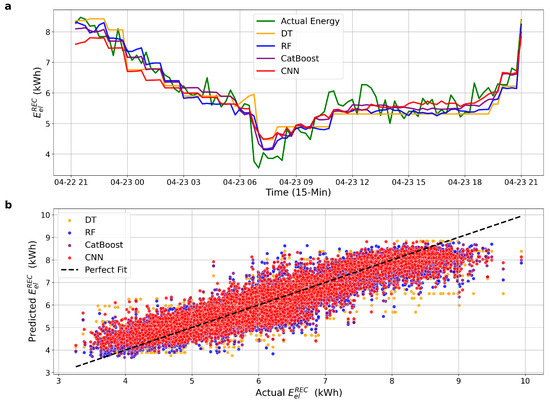
Figure 3.
Forecasting performance of all models using baseline features. (a) Actual vs. predicted hourly energy consumption. (b) Predicted vs. actual scatter plot with perfect fit line.
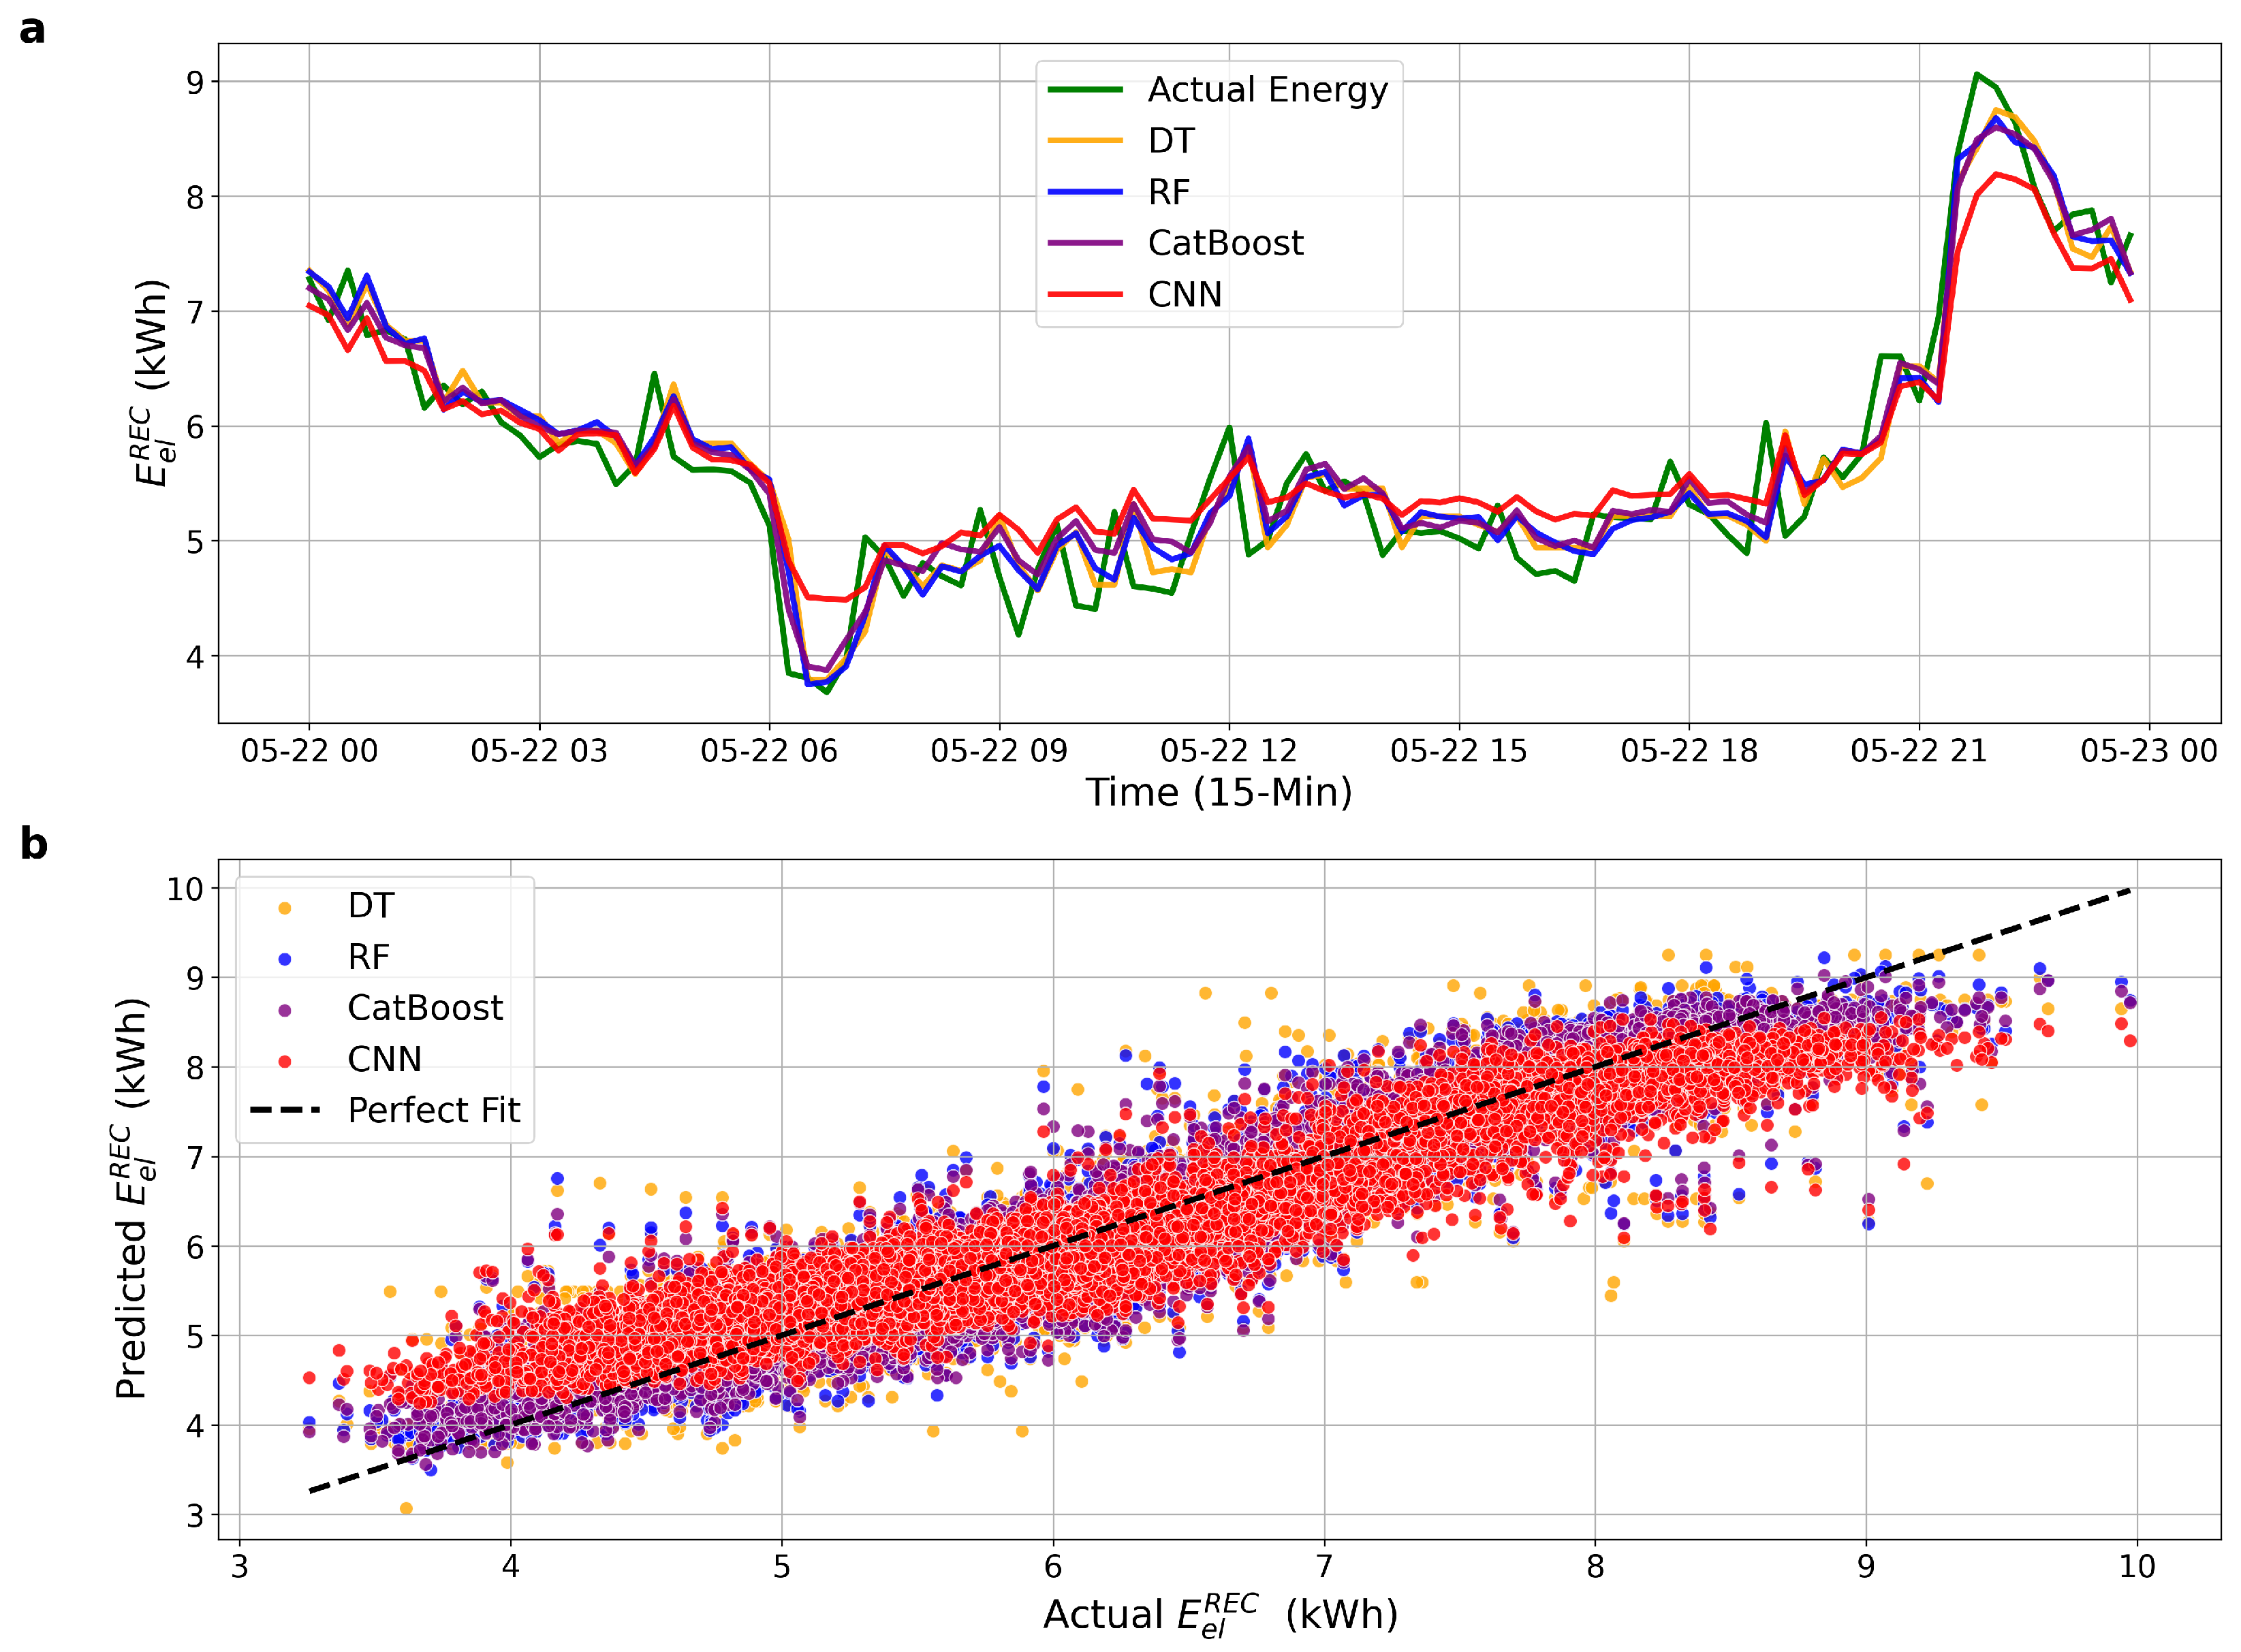
Figure 4 shows the results obtained after augmenting the input set with two temporally shifted consumption features: one capturing energy usage from one hour prior and another representing usage at the same time on the previous day. As seen in Figure 4a, the predicted curves more closely follow the actual energy consumption, particularly during sharp transitions. Figure 4b further demonstrates reduced dispersion around the perfect fit line, with denser clustering and fewer outliers, especially in the case of CatBoost and RF models.

Figure 4.
Performance comparison with extended input features, including historical energy consumption. (a) Actual vs. predicted hourly energy consumption. (b) Predicted vs. actual scatter plot with perfect fit line.
The contrast between Figure 3 and Figure 4 highlights the effectiveness of incorporating temporal dependency into the model inputs. The inclusion of historical consumption values, specifically, energy usage recorded one hour prior and at the same time on the previous day, not only improves temporal alignment in time series predictions but also significantly reduces forecast error, as confirmed by the 44.4% reduction in error for CatBoost and similar improvements across other models. These findings reinforce the value of temporal feature engineering for enhancing accuracy and stability in community-scale energy forecasting.
4. Conclusions
This study presented a comprehensive investigation of energy consumption forecasting within a REC, utilising real-world smart meter data in combination with meteorological variables. A set of ML and DL, DT, RF, CatBoost, and CNN, was evaluated under two feature configurations: a baseline set and an extended set incorporating lag-based variables to capture temporal dependencies. The results clearly demonstrate that the inclusion of historical consumption features significantly enhances forecasting performance across all models. While CatBoost achieved the highest overall performance (44.4% error reduction), DT provided greater computational efficiency, making it suitable for real-time applications.
These findings underscore the importance of temporal feature engineering and support the adoption of advanced data-driven approaches for improving energy planning, load balancing, and operational sustainability in REC environments. Future work will consider the integration of additional contextual features, including occupancy patterns, appliance-level consumption, and sociodemographic information, to further improve model performance. Expanding the forecasting horizon and developing hybrid models that combine statistical and deep learning techniques will also be explored. Finally, the deployment of these models within real-time community energy management systems will be pursued to enable adaptive and data-driven operational decision-making.
Author Contributions
Conceptualization, M.A., C.M., I.P. and E.M.P.; methodology, M.A., C.M., I.P. and E.M.P.; software, M.A., C.M., I.P. and E.M.P.; validation, M.A., C.M., I.P. and E.M.P.; formal analysis, M.A., C.M., I.P. and E.M.P.; investigation, M.A., C.M., I.P. and E.M.P.; data curation, M.A., C.M., I.P. and E.M.P.; writing—original draft preparation, M.A., C.M., I.P. and E.M.P.; writing review and editing, M.A., C.M., I.P. and E.M.P.; visualization, M.A., C.M., I.P. and E.M.P.; supervision, M.A., C.M., I.P. and E.M.P. All authors have read and agreed to the published version of the manuscript.
Funding
This research received no external funding.
Institutional Review Board Statement
Not applicable.
Informed Consent Statement
Not applicable.
Data Availability Statement
The data presented in this study are available on request from the corresponding author.
Acknowledgments
This work was supported by the European Union Next Generation EU, Mission 4, Component 2, Investment Line 1.3: ‘Research Program of the Extended Partnership–Network 4 Energy Sustainable Transition (NEST)’, Italian Ministry of University and Research (MUR), Identification Code: PE00000021–Spoke 7 ‘Smart Sector Integration’, CUP: E63C22002160007.
Conflicts of Interest
The author, Emmanuele Maria Petruzziello, was employed by the Koala company. The remaining authors declare that the research was conducted in the absence of any commercial or financial relationships that could be construed as a potential conflict of interest.
Nomenclature
| Acronyms and | |
| Abbreviations | |
| AI | Artificial Intelligence |
| CNN | Convolutional Neural Network |
| DL | Deep Learning |
| DT | Decision Tree |
| EMS | Energy Management System |
| ML | Machine Learning |
| MAE | Mean Absolute Error |
| MAPE | Mean Absolute Percentage Error |
| MSE | Mean Squared Error |
| REC | Renewable Energy Community |
| RF | Random Forest |
| Coefficient of Determination | |
| ReLU | Rectified Linear Unit |
| Conv1D | One-Dimensional Convolutional Layer |
| Mathematical Symbols | |
| and Variables | |
| Electrical energy consumption of the Renewable Energy Community | |
| Actual energy consumption at time step k | |
| Predicted energy consumption at time step k | |
| Mean of actual energy values | |
| n | Total number of observations (samples) |
References
- United Nations Environment Programme. Executive Summary 2022 Global Status Report for Buildings and Construction: Towards a Zero-Emission, Efficient and Resilient Buildings and Construction Sector. 2022. Available online: https://www.unep.org/resources/publication/2022-global-status-report-buildings-and-construction (accessed on 16 July 2025).
- Mardani, A.; Liao, H.; Nilashi, M.; Alrasheedi, M.; Cavallaro, F. A multi-stage method to predict carbon dioxide emissions using dimensionality reduction, clustering, and machine learning techniques. J. Clean. Prod. 2020, 275, 122942. [Google Scholar] [CrossRef]
- Ceglia, F.; Esposito, P.; Faraudello, A.; Marrasso, E.; Rossi, P.; Sasso, M. An energy, environmental, management and economic analysis of energy efficient system towards renewable energy community. J. Clean. Prod. 2022, 369, 133269. [Google Scholar] [CrossRef]
- Monteiro, F.; Oliveira, R.; Almeida, J.; Gonçalves, P.; Bartolomeu, P.; Neto, J.; Deus, R. Electricity consumption dataset of a local energy cooperative. Data Brief 2024, 54, 110373. [Google Scholar] [CrossRef] [PubMed]
- Tien, P.W.; Wei, S.; Darkwa, J.; Wood, C.; Calautit, J.K. Machine learning and deep learning methods for enhancing building energy efficiency and indoor environmental quality—A review. Energy AI 2022, 10, 100198. [Google Scholar] [CrossRef]
- Safari, A.; Daneshvar, M.; Anvari-Moghaddam, A. Energy intelligence: A systematic review of artificial intelligence for energy management. Appl. Sci. 2024, 14, 11112. [Google Scholar] [CrossRef]
- Wang, R.; Yun, H.; Rayhana, R.; Bin, J.; Zhang, C.; Herrera, O.E.; Liu, Z.; Mérida, W. An adaptive federated learning system for community building energy load forecasting and anomaly prediction. Energy Build. 2023, 295, 113215. [Google Scholar] [CrossRef]
- Goudarzi, S.; Anisi, M.H.; Soleymani, S.A.; Ayob, M.; Zeadally, S. An IoT-based prediction technique for efficient energy consumption in buildings. IEEE Trans. Green Commun. Netw. 2021, 5, 2076–2088. [Google Scholar] [CrossRef]
- Eren, Y.; Küçükdemiral, İ. A comprehensive review on deep learning approaches for short-term load forecasting. Renew. Sustain. Energy Rev. 2024, 189, 114031. [Google Scholar] [CrossRef]
- Akter, R.; Shirkoohi, M.G.; Wang, J.; Mérida, W. An efficient hybrid deep neural network model for multi-horizon forecasting of power loads in academic buildings. Energy Build. 2025, 329, 115217. [Google Scholar] [CrossRef]
- Esposito, P.; Marrasso, E.; Martone, C.; Pallotta, G.; Roselli, C.; Sasso, M.; Tufo, M. A roadmap for the implementation of a renewable energy community. Heliyon 2024, 10, e28269. [Google Scholar] [CrossRef] [PubMed]
- Newgard, C.D.; Lewis, R.J. Missing data: How to best account for what is not known. JAMA 2015, 314, 940–941. [Google Scholar] [CrossRef] [PubMed]
- Pedregosa, F.; Varoquaux, G.; Gramfort, A.; Michel, V.; Thirion, B.; Grisel, O.; Blondel, M.; Prettenhofer, P.; Weiss, R.; Dubourg, V.; et al. Scikit-learn: Machine learning in Python. J. Mach. Learn. Res. 2011, 12, 2825–2830. [Google Scholar]
- Zhao, H.X.; Magoulès, F. Feature Selection for Predicting Building Energy Consumption Based on Statistical Learning Method. J. Algorithms Comput. Technol. 2012, 6, 59–77. [Google Scholar] [CrossRef]
- Breiman, L. Random forests. Mach. Learn. 2001, 45, 5–32. [Google Scholar] [CrossRef]
- Mallala, B.; Khan, P.A.; Pattepu, B.; Eega, P.R. Integrated energy management and load forecasting using machine learning. In Proceedings of the 2024 2nd International Conference on Sustainable Computing and Smart Systems (ICSCSS), Coimbatore, India, 10–12 July 2024; pp. 1004–1009. [Google Scholar] [CrossRef]
- Zhu, J.; Dong, H.; Zheng, W.; Li, S.; Huang, Y.; Xi, L. Review and prospect of data-driven techniques for load forecasting in integrated energy systems. Appl. Energy 2022, 321, 119269. [Google Scholar] [CrossRef]
- Xiang, W.; Xu, P.; Fang, J.; Zhao, Q.; Gu, Z.; Zhang, Q. Multi-dimensional data-based medium- and long-term power-load forecasting using double-layer CatBoost. Energy Rep. 2022, 8, 8511–8522. [Google Scholar] [CrossRef]
- Zhang, L.; Jánošík, D. Enhanced short-term load forecasting with hybrid machine learning models: CatBoost and XGBoost approaches. Expert Syst. Appl. 2024, 241, 122686. [Google Scholar] [CrossRef]
Disclaimer/Publisher’s Note: The statements, opinions and data contained in all publications are solely those of the individual author(s) and contributor(s) and not of MDPI and/or the editor(s). MDPI and/or the editor(s) disclaim responsibility for any injury to people or property resulting from any ideas, methods, instructions or products referred to in the content. |
© 2025 by the authors. Licensee MDPI, Basel, Switzerland. This article is an open access article distributed under the terms and conditions of the Creative Commons Attribution (CC BY) license (https://creativecommons.org/licenses/by/4.0/).