1. Introduction
Hard and superhard coatings created by physical vapor deposition (PVD) have a wide range of applications in machine building. They are mainly used to increase the lifetime of tools, reduce friction, allow operation in severe conditions, avoid lubricating-cooling fluids (LCF), etc. [
1,
2,
3,
4,
5].
TiN is the first widely applied PVD hard coating in industry used to enhance the mechanical properties of the surface [
1,
2,
3,
6]. In addition, it has decorative applications, is well tolerated by the human body, etc. It is also often found as a sublayer in many multilayer and nanolaminate (superlattice) coatings [
2,
5,
6,
7]. Although this coating is well-studied and easily adaptable for PVD application, it (as well as practically all other coatings) has to be further investigated in connection with the application of a specific deposition unit to ensure optimal results.
This publication describes some initial TiN deposition experiments using closed field unbalanced magnetron sputtering (CFUBMS). The hardness was chosen as the main (target) mechanical indicator and the influence of the deposition temperature and the N2 (reactive gas) flow rate on its value was studied.
2. Experimental Details
The test samples are disk-shaped (diameter of 13 mm, thickness of 5 mm) and made of P6M5 (HSS). They were bulk-hardened (63 HRC) and ground (Ra = 0.28 μm).
The PVD method CFUBMS, which is implemented in a coating unit UDP850-4 (Teer Coatings Ltd., Droitwich, UK), was applied for the deposition. Before being placed in the working chamber, the samples were mechanically and chemically cleaned. An ultrasonic cleaning system and mildly alkaline solvent (Deconex HT 1170, Borer Chemie AG, Zuchwil, Switzerland) were used. The movement of the samples was carried out by a two-axis carousel with a rotation frequency set to 5 rpm. The process began when an initial vacuum of 2.0 × 10⁻⁵ Torr was reached. Initially, the surface was etched with accelerated Ar+ ions for 30 min at a high bias voltage upon the samples (carousel) of −500 V (pulse mode with a frequency of 250 kHz, a pause between pulses of 500 ns). The Ar flow rate was 27 sccm and this parameter was maintained during the subsequent coating deposition, which was carried out using two Ti targets located on opposite walls of the chamber, whose operating current was 8 A each. The bias voltage upon the samples was −70 V/250 kHz/500 ns. The deposition started after reaching and stabilizing the desired temperature of the samples: 120 or 150 °C. At first, a thin adhesion layer of Ti was built up over a period of 10 min. After which, for a period of 20 min, an interface transition layer of TiN was created on it with a gradual linear increase in the N2 flow rate from zero to the maximum set value: 12 or 17 sccm. After reaching this level, the main layer of TiN was applied for 120 min. The working pressure was 1.4 × 10⁻³ ÷ 1.5 × 10⁻³ Torr during the deposition. After the deposition was completed, Ar was let in until the pressure increased to ca. 10 Torr and then time was allowed (when necessary) for the samples temperature to drop to 120 °C, after which the chamber was opened and unloaded.
The fractional factorial design 2
3−1 was chosen to conduct the survey because of the small number of experimental runs and the low costs, respectively. The data obtained from the measurements were processed according to the methodologies discussed in [
8] (pp. 87–109). For greater reliability, a check was also made using the Regression tool contained in Analysis ToolPak for MS Excel.
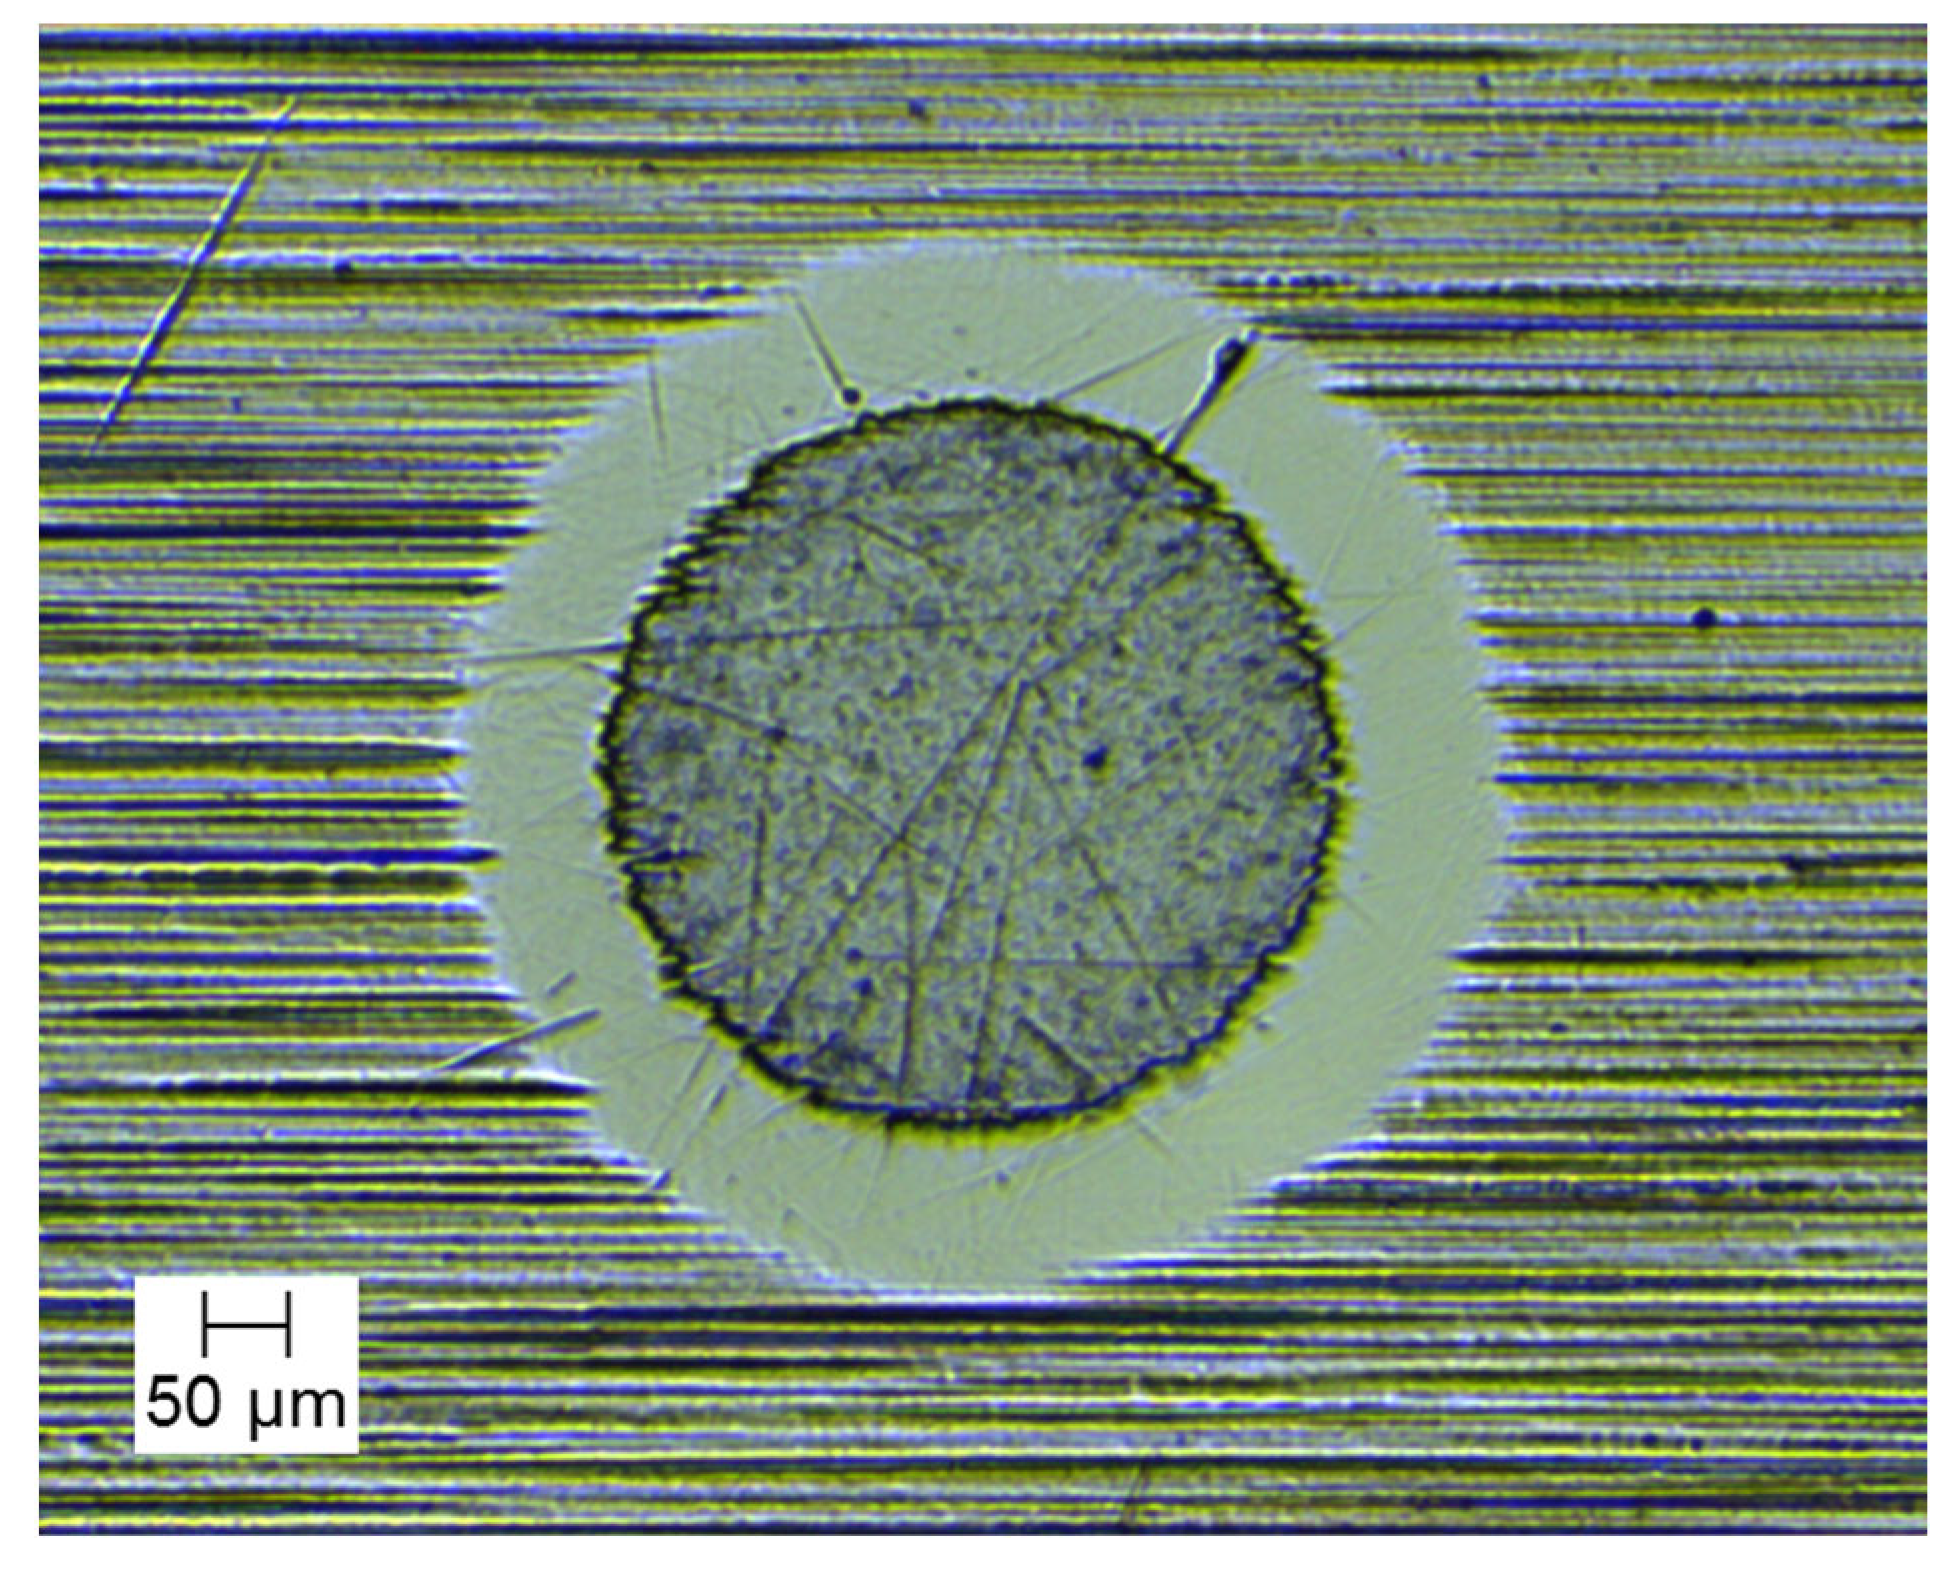
The thickness of the coating was measured by a calo tester: Compact Calotester CAT2c (Anton Paar GmbH, Graz, Austria) using 30 mm ball. The diameters of the formed circles on the spherical section (which represent the boundaries of the coating) were gauged by a microscope and then the thickness itself was calculated using them.
To examine the hardness and elastic modulus, the equipment Compact Platform CPX (MHT/NHT) (CSM Instruments, Anton Paar GmbH, Graz, Austria) was used, applying a Berkovich diamond indenter. A hold of 5 s for the maximum loading force was performed and a value of 0.25 was assumed to the Poisson’s ratio of the coating. The Oliver–Pharr method, which is implemented in the working software, was used for the calculations. The hardness values were obtained as the average of 5 consecutive measurements.
For the sample with the highest hardness, the adhesion and coefficient of friction were measured using the Micro Scratch Tester (MST) module of the same equipment (CSM Instruments, Anton Paar GmbH, Graz). A Rockwell diamond indenter with a tip rounding of 200 µm was attached. The scratches were set to a length of 1 mm and the load force was increased linearly from 0.5 to 30 N at a rate of 1 N/min.
3. Results and Discussion
Table 1 shows data for the four conducted trials (
N = 4): deposition temperature
T (corresponding normalized factor
X1), N
2 flow rate
F (corresponding normalized factor
X2), design matrix (for fractional factorial design 2
3−1), and examined nanohardness
H (response variable).
The regression equation of the fractional factorial design 2
3−1 has the following form:
where
After calculations, the regression equation with normalized factors was obtained:
It is obvious that the two factors independently have a significant impact on the response variable H. Their combined influence, however, is negligible. The coefficient of determination R2 has a theoretical value of 1 for such one regression equation (it was also confirmed when checking the calculations using MS Excel Regression tool). This value would decrease (in this case—insignificantly) if the combined influence of the factors were excluded.
For one assessment of the practical impact of the factors, it was necessary to switch to their non-normalized (absolute) values using the following dependencies:
where
Ta = (
Tmax +
Tmin)/2,
Fa = (
Fmax +
Fmin)/2 − average value;
Ti = (
Tmax −
Tmin)/2,
Fi = (
Fmax −
Fmin)/2 − variation interval;
Tmax,
Fmax − maximum value,
Tmin,
Fmin − minimum value.
After substituting (4) into (3), a regression equation with real (non-normalized) values of the factors was obtained:
From Equation (5), it is seen that the hardness decreases with increasing in the deposition temperature and N2 flow rate (in the considered working range).
The higher temperature leads to greater particle mobility during layer formation, which reduces defects and thus the internal stress, respectively. The hardness of TiN and similar coatings is partially due to increased compressive internal stress as a result of ion bombardment [
3,
6,
9,
10,
11]. In a nutshell, with increasing in the temperature, the relaxation processes are facilitated in the coating and the internal stress decreases, respectively; the hardness also decreases. On the other hand, the reported working temperatures are relatively low, but the sensor placed in the chamber does not measure the temperature in the coating deposition area itself. However, the measured temperature difference of 30 °C could be considered as actual. In the given sense, if it is assumed that the real deposition temperatures are higher, the difference between them becomes less significant and this explains the relatively weak influence of the temperature as a factor.
It turns out that the N
2 flow rate has the most significant influence on the hardness. Its larger value leads probably to the formation of an over-stoichiometric layer (with an excess of nitrogen in its composition). Such layers are characterized by a lower hardness than the stoichiometric and sub-stoichiometric ones [
11].
The sample with the highest nanohardness (trial №4 in
Table 1) was further investigated to determine whether its remaining mechanical properties were of acceptable value for practical needs. The following data below focus on this specifically.
The coating thickness is 1.400 µm and
Figure 1 shows the spherical section from the measurement. From this image, organoleptically (evaluating the color), it could be concluded that the coating is over-stoichiometric. In the area of the section, any damages to the coating are not observed, which suggests relatively low internal stresses and good adhesion.
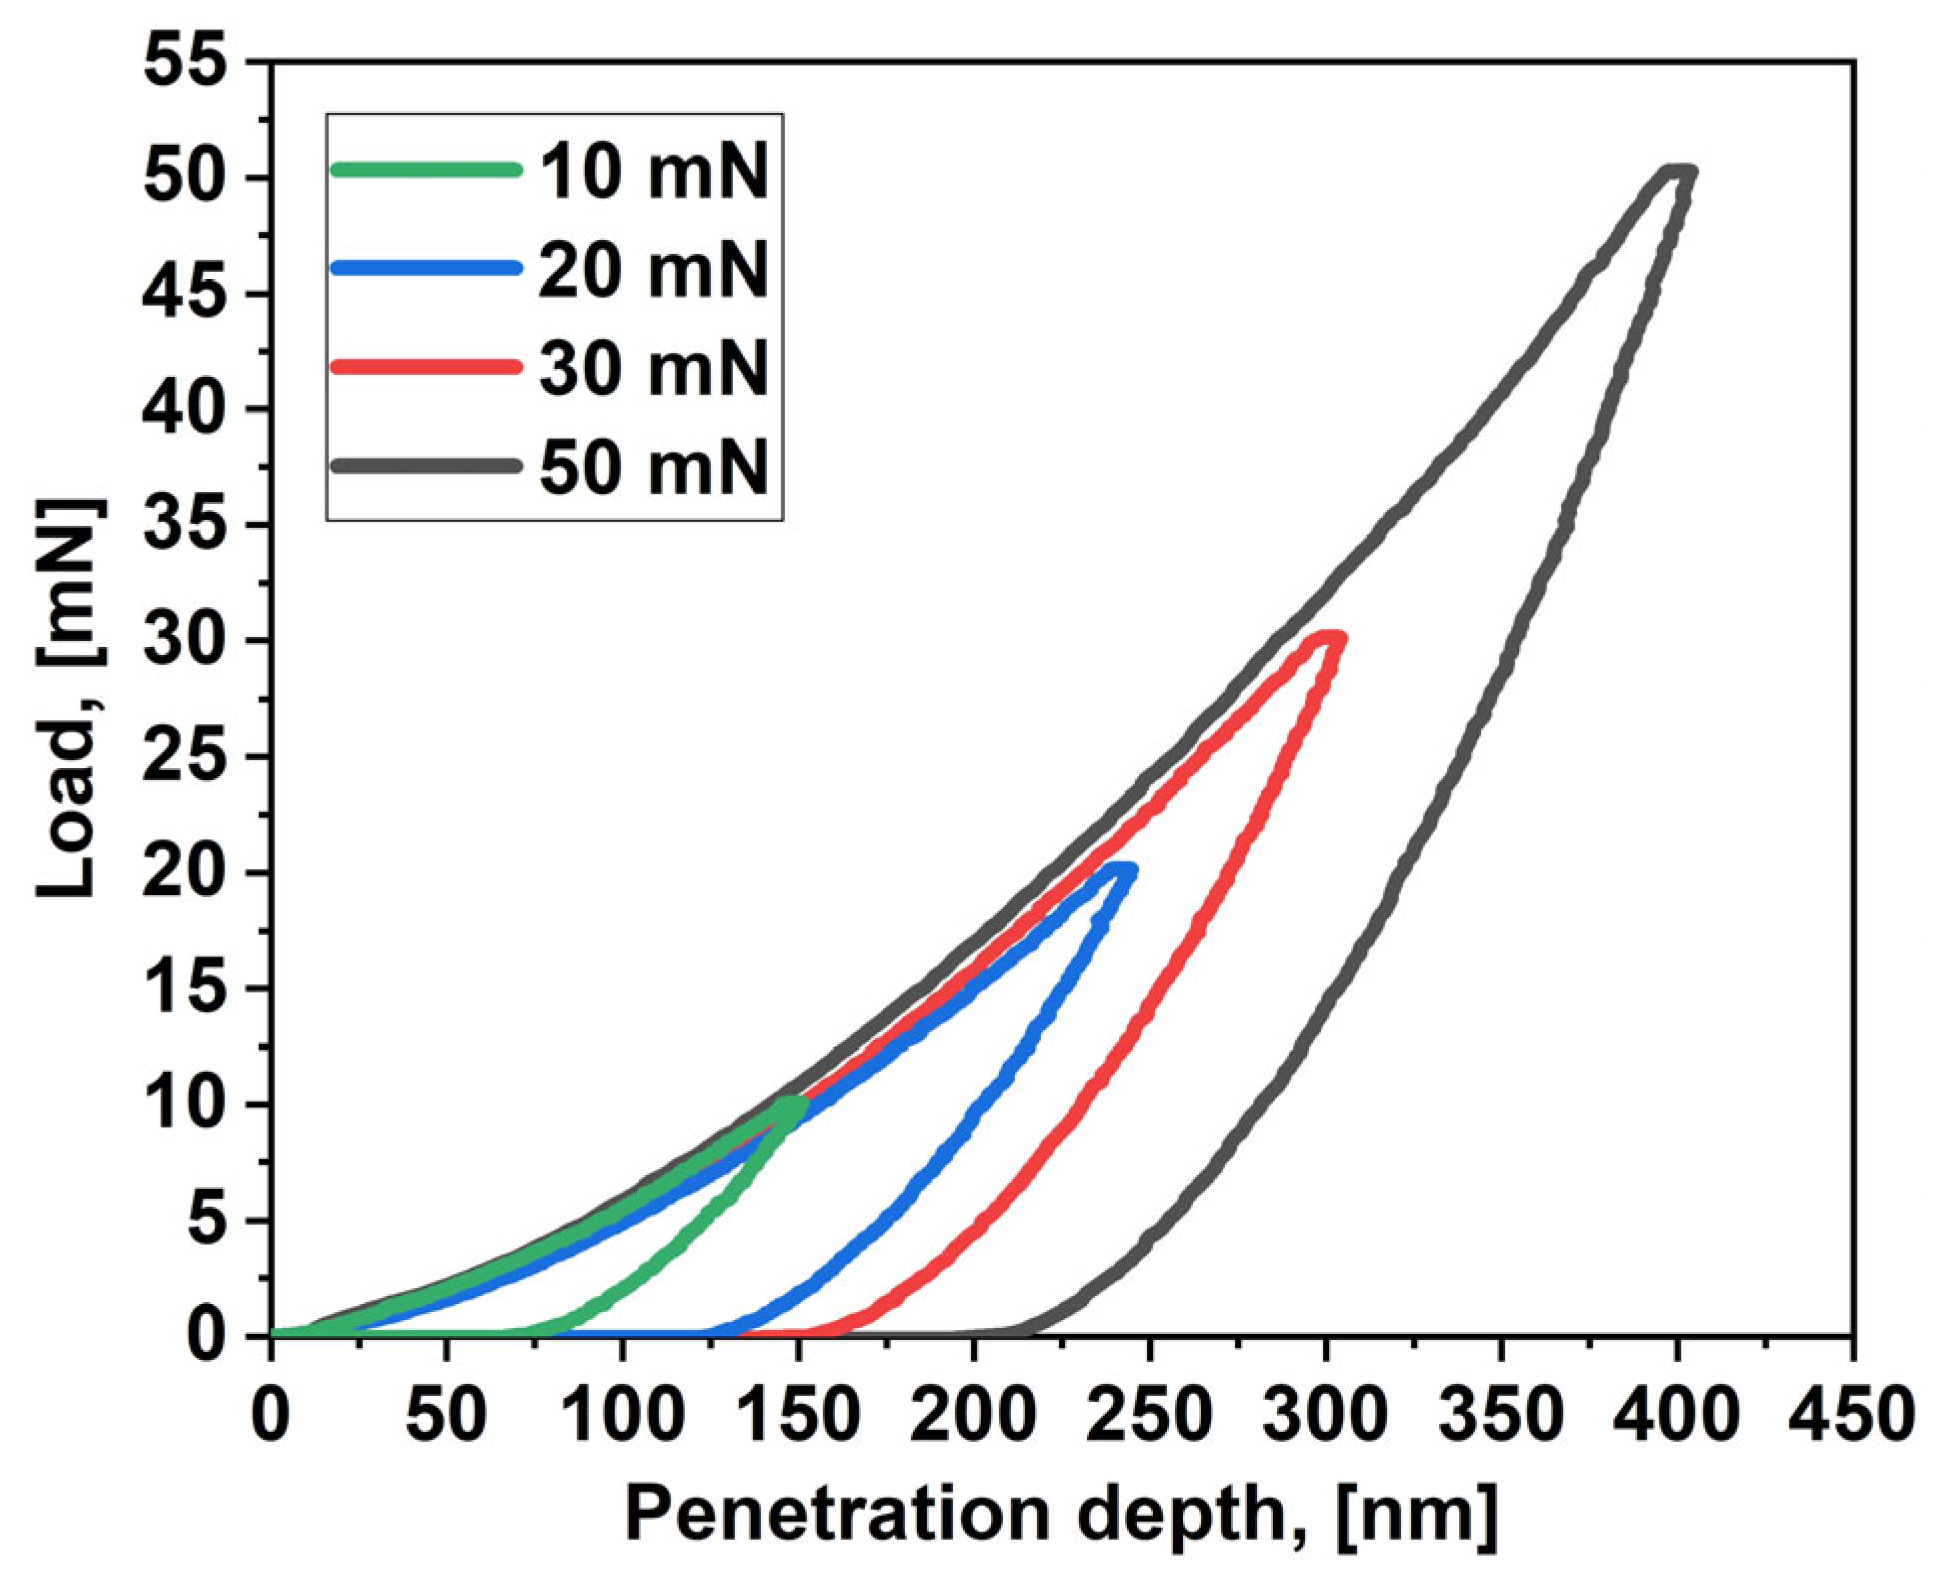
The load–displacement diagrams related to the examination of the nanohardness and elastic modulus can be seen in
Figure 2. It is visible that the load (left) branches of the curves coincide for measurements with different loads (and performed at different locations on the sample), which is evidence of the homogeneity of the coating. Moreover, the curves are smooth, which proves that no cracks appeared in the indentation area [
9,
12].
The measured hardness of 25.9 GPa (
Table 1) was obtained by indentation with a load of 10 mN, which caused a penetration depth of 150.72 nm. This is ca. 10.8% of the coating thickness, which ensures that the substrate hardness did not affect the reported result (the maximum allowable value is approx. 10%) [
6,
7,
10,
11]. The same indentation indicated a modulus of elasticity of 348.0 GPa.
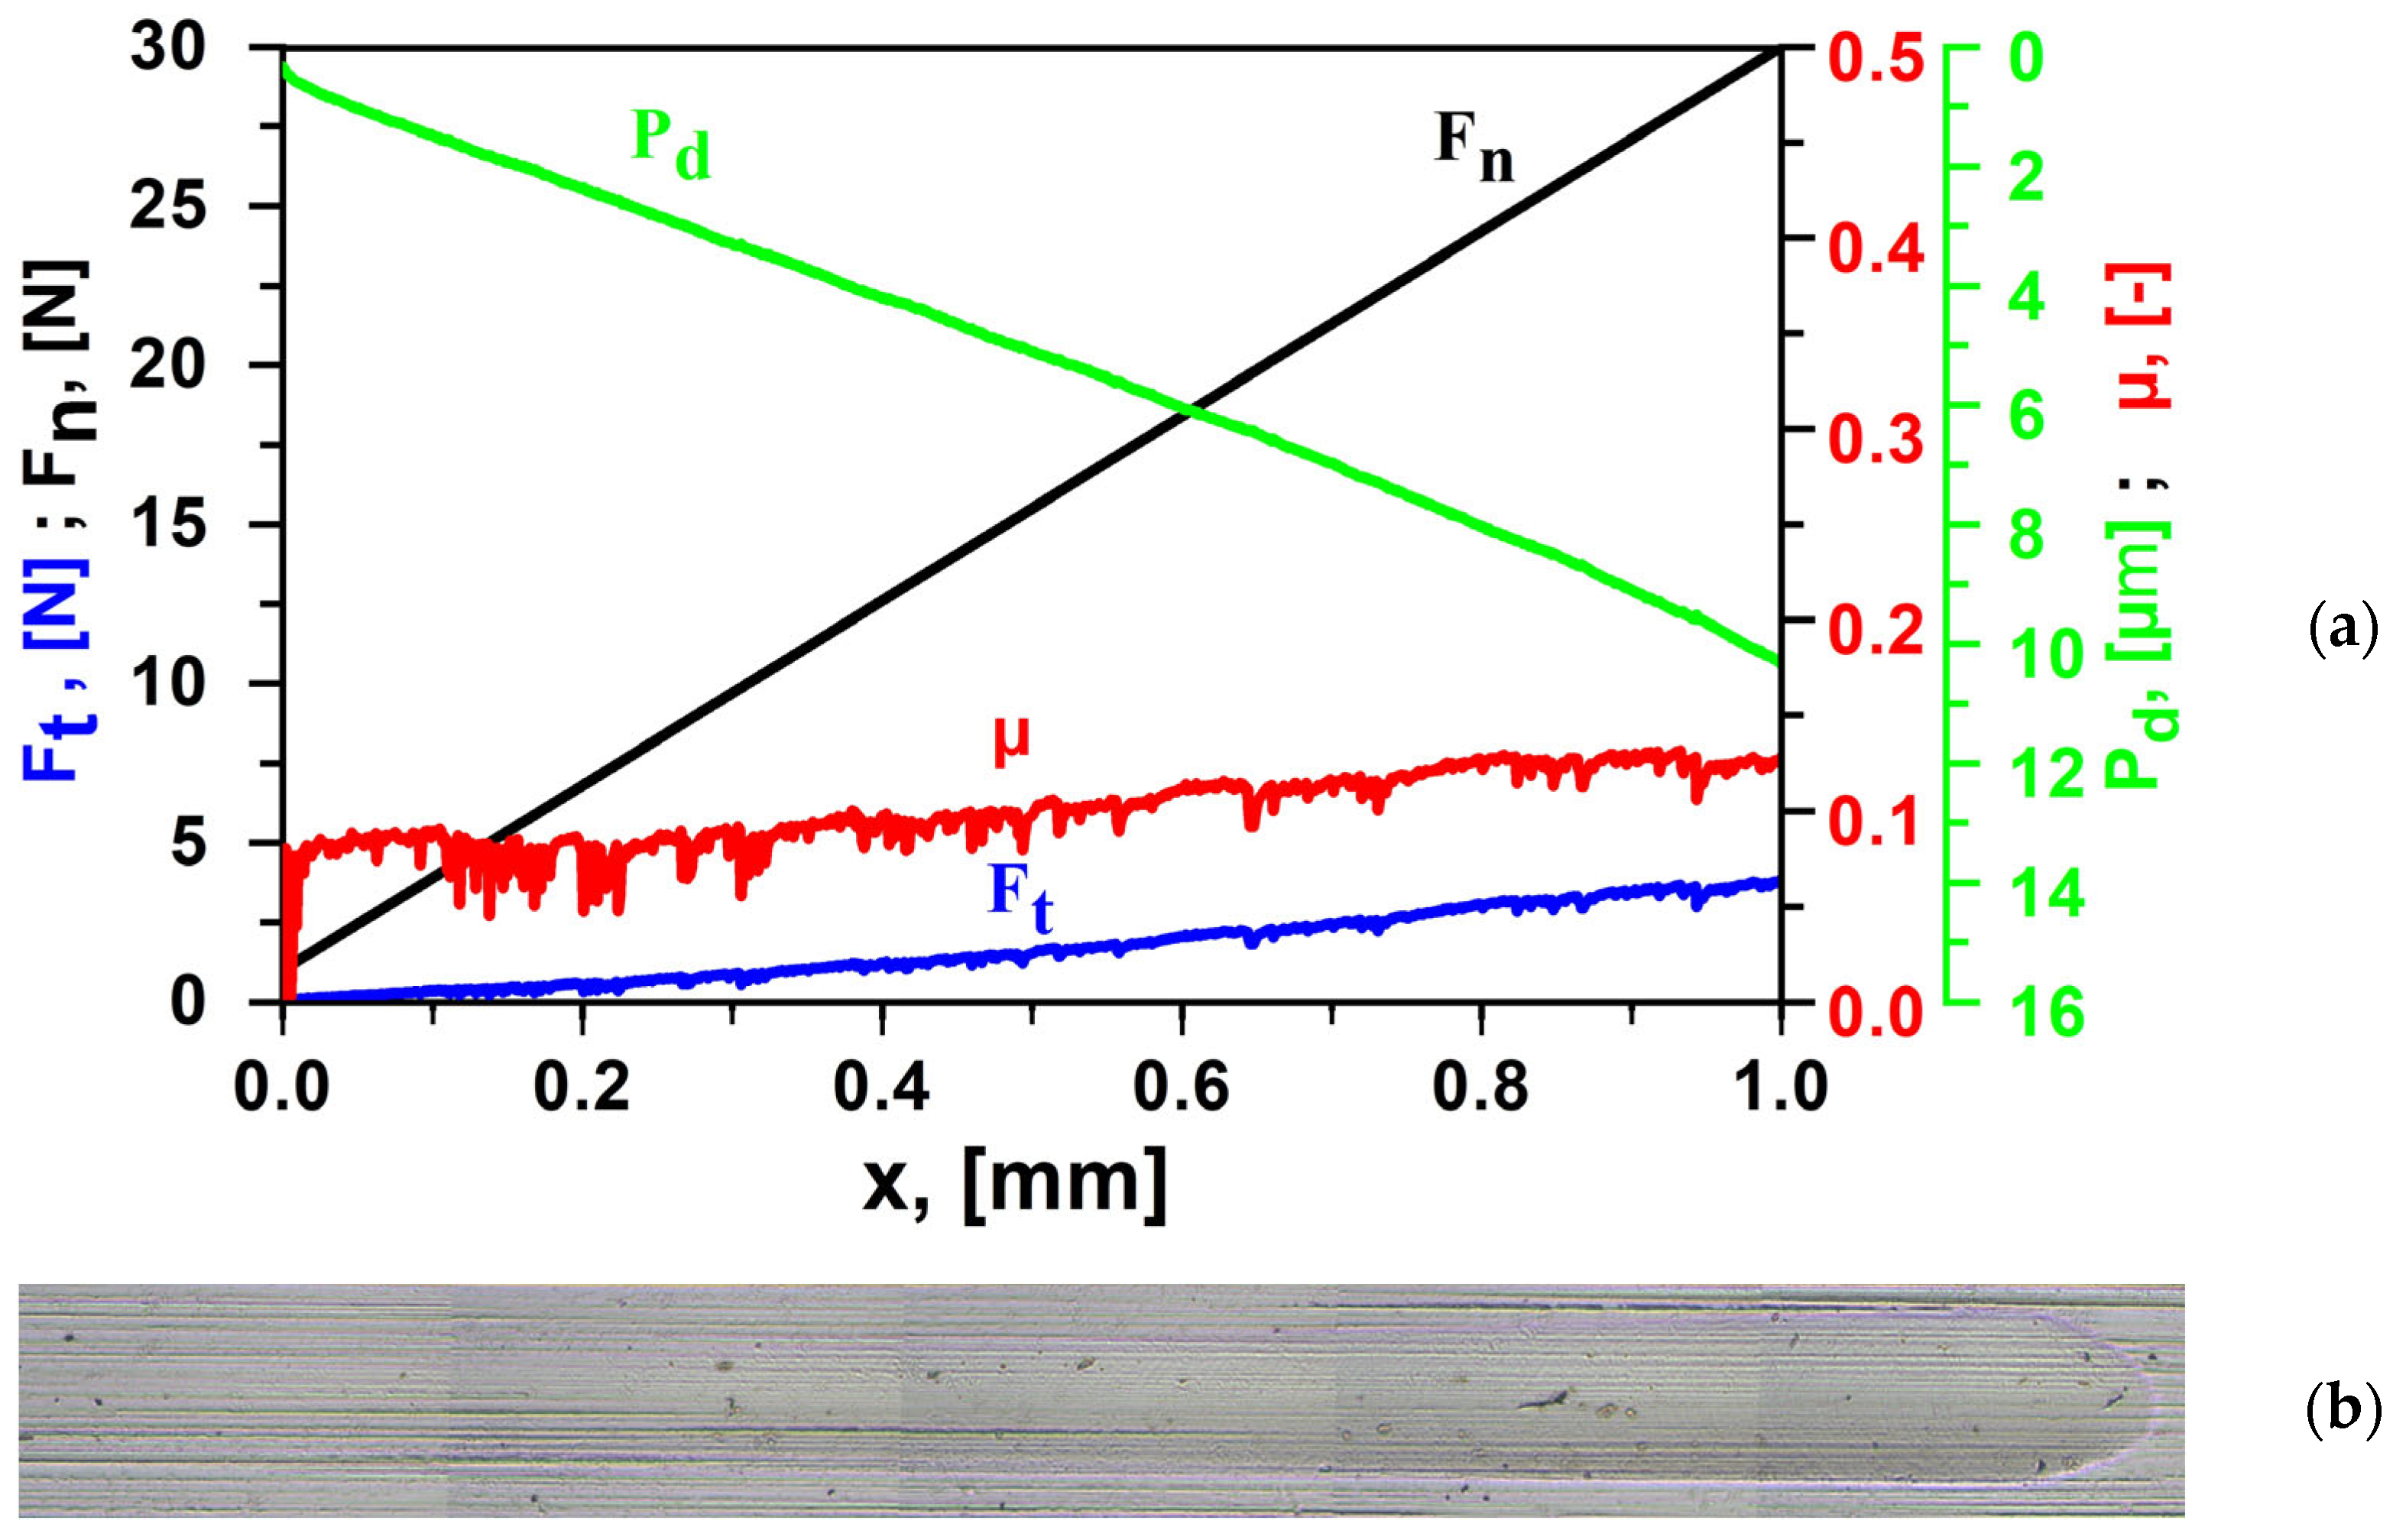
In
Figure 3a, one diagram of the performed scratch test is depicted. Until the end of the needle stroke
x, any adhesion or cohesion failures are not observed along the trace, which is shown in
Figure 3b.
The coefficient of friction µ and friction force Ft (which linearly depends on it) increase slightly until the end of the stroke x. This increment could be explained by the raising of the normal force Fn, which leads to a greater pervasion depth Pd, where the latter increases the amount of material which is displaced and deformed in front of the needle.
4. Conclusions
The conducted fractional factorial experiment provides the necessary information about the coating hardness in the considered range of variation in the deposition temperature and N
2 flow rate. A decrease in the deposition temperature seems desirable, but then the increased internal stress usually reduces the adhesion and strength of the coating. At this stage, they are not compromised yet, so there is likely a potential for optimization in this direction. Obviously, it is desirable to work with a lower N
2 flow rate, but at some point, the layer may be converted into one that is sub-stoichiometric and the hardness might start to decrease. Also, the reduction in the N
2 flow rate could increase the deposition rate; thus, the desired coating thickness could be reached faster [
13].
The results obtained for the sample which possesses the highest hardness (trial №4 in
Table 1) are commonly observed in TiN coatings [
4,
5,
14,
15,
16]. This likely means that this operating mode is close to the optimal one.


