1. Introduction
The advent of artificial intelligence and machine learning in the field of digital marketing has significantly transformed the way companies reach their consumers. These new technologies provide opportunities for highly targeted and automated advertising processes, allowing for more precise planning and execution of campaigns [
1,
2,
3]. One of the most innovative approaches in this area is the Performance Max campaign in the Google Ads platform, which utilizes algorithms for autonomous optimization and real-time decision-making. The effectiveness of such campaigns largely depends on the quality and structure of the data used to train the algorithms. In this context, it is especially important to distinguish between features inherent to the campaign itself and metrics derived from aggregating information from lower levels, such as individual products. While campaign-level features are related to static settings and configurations, aggregated product metrics are often influenced by dynamic factors and require careful analysis to avoid distorted conclusions.
The products that receive the highest visibility in search advertisements are those identified by the campaign’s algorithms as most likely to generate conversions and fulfill predefined objectives. This leads to a natural bias in favor of so-called best sellers, which tend to dominate both budget allocation and impression share. As a result, other products—typically those with limited historical performance data or temporarily lower competitiveness—are deprioritized by the algorithm and receive minimal or no exposure. This behavior aligns with the fundamental goal of Performance Max campaigns, which is optimization toward a single campaign-level objective, rather than evaluating the potential of each individual product. A potential solution to this challenge involves removing the underperforming products from the main campaign and placing them into a separate campaign. In doing so, the algorithm managing the new campaign can be trained on the performance data of those specific products, uninfluenced by the prior dominance of stronger performers. This approach not only provides equal opportunity for less visible products to gain exposure, but also allows for a more accurate assessment of their true potential. Simultaneously, the original campaign becomes more focused, as it is no longer burdened by products that consume resources without contributing to performance goals, resulting in more precise performance analytics. It is important to acknowledge that a product’s effectiveness may also be influenced by temporary external factors such as seasonality, promotional activities, stock availability, or competitive pricing.
Manually reviewing and analyzing each product within a Google Ads account would be a time-consuming and unsustainable task. This underscores the value of intelligent agents capable of automating anomaly detection, behavior-based product classification, and strategic decision-making for campaign structure optimization.
In this paper, we present two intelligent agents designed to optimize Google Ads Performance Max campaigns by applying machine learning at the product level. The first agent, built with an Isolation Forest algorithm, effectively detects performance anomalies in individual products by identifying statistical outliers based on key metrics such as ROAS, impressions, and spend. This allows advertisers to take immediate action by pausing underperforming products or investigating sudden performance drops. The second agent, implemented with a Random Forest algorithm, tracks and analyzes the performance of each product individually based on historical data, and automatically reallocates products between campaigns based on their effectiveness.
2. Structure of Intelligent Agents Workflow
In the context of Google Ads Performance Max campaigns, the identification and use of appropriate features is essential for the successful application of machine learning algorithms aimed at performance optimization [
4,
5]. A key aspect of this process is the distinction between campaign-level features and those product-level features derived from aggregated data at lower levels, such as the individual products within the campaign. Although these two types of features are part of the same model, their nature, method of extraction, and role in predictive computations differ significantly [
6,
7].
Campaign-level features are defined and fixed within the structure of the advertising campaign itself. They do not depend on the performance of individual products or their dynamic metrics, but rather on the configuration, settings, and overall scope of the campaign [
4,
8]. Examples of such features include daily budget, selected bidding strategy, number of included asset groups, audiences used, geographic targeting, seasonality, and others.
The set of lower-level metrics, such as product-level indicators, represents an aggregation of dynamic data that evolves over time and reflects the performance of individual products within a campaign [
7,
9,
10]. This includes metrics such as the number of sales, the impact of a specific product on the campaign’s overall revenue, impression frequency, conversion rate, and others. It is important to emphasize that these metrics do not inherently exist at the campaign level—they are formed by aggregating individual product-level data. Consolidating this data requires preprocessing and presents additional challenges in terms of data quality and the objectivity of results [
7].
Analyzing aggregated data for the products included in a given campaign can lead to misleading conclusions if certain factors are not taken into account. For example, when a campaign includes a product with a very high return on ad spend (ROAS) that dominates in volume, it can skew the overall campaign-level metric, even though the other products may not be performing as well. Another example is when a campaign includes 1000 products, but only 30% of them generate impressions, clicks, and sales. These are usually the best-performing products, which leads the Performance Max campaign to optimize toward them—either to generate the highest number of sales or the highest-value sales, depending on whether the campaign goal is set to Target ROAS or Maximize Conversions.
However, the strong performance of these products might be driven by external factors such as seasonality, temporary product popularity due to another marketing channel, promotional pricing, and more. The campaign cannot account for these external influences, as it only operates based on the data available within the Google Ads platform. This highlights the importance of distinguishing between campaign settings and performance and evaluating products individually, which may ultimately lead to improved overall campaign performance.
The proposed methodology enables extensive automation of advertising management through the deployment of intelligent agents [
11,
12]. In the context of this study on the optimization of Performance Max campaigns, two machine learning-based intelligent agents have been developed, each fulfilling a distinct role in the automation process and contributing to enhanced performance at the product level. These agents operate in a coordinated manner: the first is responsible for detecting and signaling performance issues, while the second autonomously implements corrective actions. This collaborative approach leads to improved campaign effectiveness and adaptability within real-world operational environments.
The overall framework describing the algorithm’s architecture and the agents’ workflow is presented in
Figure 1:
3. Intelligent Agent for Product-Level Monitoring and Anomaly Detection
The objective of this intelligent agent is to monitor the behavior of all products included in a given Performance Max campaign on a daily basis, conducting detailed tracking of key metrics such as spend, sales, impressions, clicks, click-through rate (CTR), and return on ad spend. Based on accumulated data, this agent is trained to detect anomalies in product performance, such as a sudden decline in the effectiveness of previously top-performing products. When deviations are identified, the agent automatically generates alerts to notify the marketing team of a potential issue. Its purpose is to provide an early signal when product behavior changes, enabling timely intervention and preventing any negative impact on the overall campaign performance.
The intelligent agent employs a machine learning-based anomaly detection model using Isolation Forest—a non-conventional machine learning algorithm particularly suited for identifying rare and unusual values in multi-dimensional time series. Isolation Forest operates on the principle that anomalies are easier to isolate from normal observations because they differ sharply from most data points in the set [
13,
14]. The algorithm constructs multiple random binary trees (similar to decision trees), where at each level, a division is made based on a randomly chosen feature and thresholds. Historical data for all products included in the campaigns is used as input for training, with metrics such as impressions (x
1), clicks (x
2), spend (x
3), conversions (x
4), along with derived metrics such as click-through rate (x
5) and return on ad spend (x
6), being fed for each product.
The algorithm builds multiple random binary trees, where each tree splits the data using a randomly selected feature and a random split value. The core idea is to evaluate how quickly a given point can be isolated within the tree structure. In [
14], for each observation, the so-called “anomaly score” is calculated (Equation (1)):
where h(x) represents the number of steps required to isolate observation x, E(h(x)) is the expected value of the isolation depth, n is the number of instances in the dataset, and c(n) is a normalizing constant (Equation (2)):
where H(i) is the i-th harmonic number. The expected value of the isolation depth E(h(x)) is calculated as the average of h(x) from the collection of isolation trees. This value is used to normalize the depth so that anomalies can be compared between different subsets of data. Based on the calculations for each observation, if the value s(x,n) exceeds a defined threshold, for example, 0.6, the corresponding behavior is marked as an anomaly. In the case of consecutive days with similar signals for a particular product, the agent classifies it as risky and alerts the team, thereby ensuring timely identification of problems that might otherwise go unnoticed.
The algorithm is trained in a completely unsupervised mode and can be retrained periodically, for example, on a weekly basis, to adapt to new data and reflect the current market conditions or seasonal changes. In this way, the agent provides a dynamic and adaptive performance monitoring system without the need for manual intervention or predefined rules.
4. Intelligent Agent for Product Reallocation Between Campaigns
The second intelligent learning agent is designed to improve the effectiveness of Performance Max campaigns in Google Ads by automatically managing the reassignment of products between different campaigns based on their performance. Its primary role is to analyze the daily behavior of each individual product and make decisions about transferring products to appropriate campaigns in order to maximize the overall contribution to conversions and return on investment. This is achieved by monitoring key metrics such as impressions, clicks, cost, sales revenue, return on ad spend, and click-through rate.
Random Forest Algorithm is used for the agent’s training. This algorithm creates a large number of decision trees, each trained on a different random subset of the training data. A random subset of input variables is used for each split in the tree. The collection of trees forms an ensemble, and for a new input product, classification is performed by majority voting [
15,
16].
Before training and forecasting, the agent extracts key metrics from Google Ads, as described above, for each product. It then applies normalization of the input features to standardize the scales of the different metrics. Min/Max Scaling is used as defined by Equation (3) [
17]:
This process is important because Random Forest performs better when all input variables are on comparable scales, especially when using heuristics like tree branching information. After normalization, the data is split into input variables and a target variable. The target variable represents the category to which each product should be assigned: 0—stays in the current campaign; 1—moved to a campaign for products with no impressions; 2—moved to a campaign for products with high costs and no conversions.
Immediately after the classification of all products, the agent applies the movement actions. For example, if the model determines that a product falls into category 1, it will be removed from the current campaign through an API request and included in the campaign for products with no visibility. The same procedure is applied for the other categories.
The model is automatically retrained once a week or when there is a significant change in the data (e.g., during a seasonal performance shift). The most recent 30 days of product history are used for training. Additionally, the agent calculates feature importance based on the average reduction in impurity (Gini importance) [
18,
19] in order to determine which features are most informative. This allows for better interpretability and further optimization of the model.
5. Implementation Environment and Experiments
The intelligent agents were developed and tested in a Python-based environment, using machine learning libraries scikit-learn for model implementation [
20,
21,
22] and pandas [
23] for processing comma-separated values (CSV) data. The CSV data is collected from the Google Ads API, which allows for the extraction of campaign performance data, including product-level metrics such as impressions, clicks, conversions, sales, and conversion value/cost. These CSV files are used by the intelligent agents for the training of the machine learning models.
All experiments were conducted on anonymized data from real-world Performance Max campaigns. Using the Google Ads API allows the agents to interact directly with the platform, extract necessary information, and optimize campaigns in real-time, thus automating processes that traditionally require manual management.
We conducted several experiments with each agent separately, using two independent Google Ads accounts, each containing different numbers of products with varying seasonality and price categories.
5.1. Experiments with the Monitoring and Anomaly Detection Agent (at the Product Level)
Two experiments were conducted to evaluate the effectiveness of Isolation Forest in detecting anomalies in product data within specific campaigns and how this impacted the overall ROAS value.
In the first experiment, we used historical performance data for products across several different Performance Max campaigns covering the past 30 days (
Table 1). The data included metrics such as spend, sales, CTR, impressions, and ROAS at the product level.
Before utilizing the data, all metrics were standardized using min/max scaling to ensure equal treatment of different features during the training process. The agent was trained on a subset of this data and then applied to new data to identify products with atypical behavior, with the threshold for triggering alarms empirically set at 0.65. As a result of the experiment, the model successfully highlighted products with high costs but no sales, as well as products with a sudden drop in impressions, which would allow for timely action from the marketing team (
Table 2).
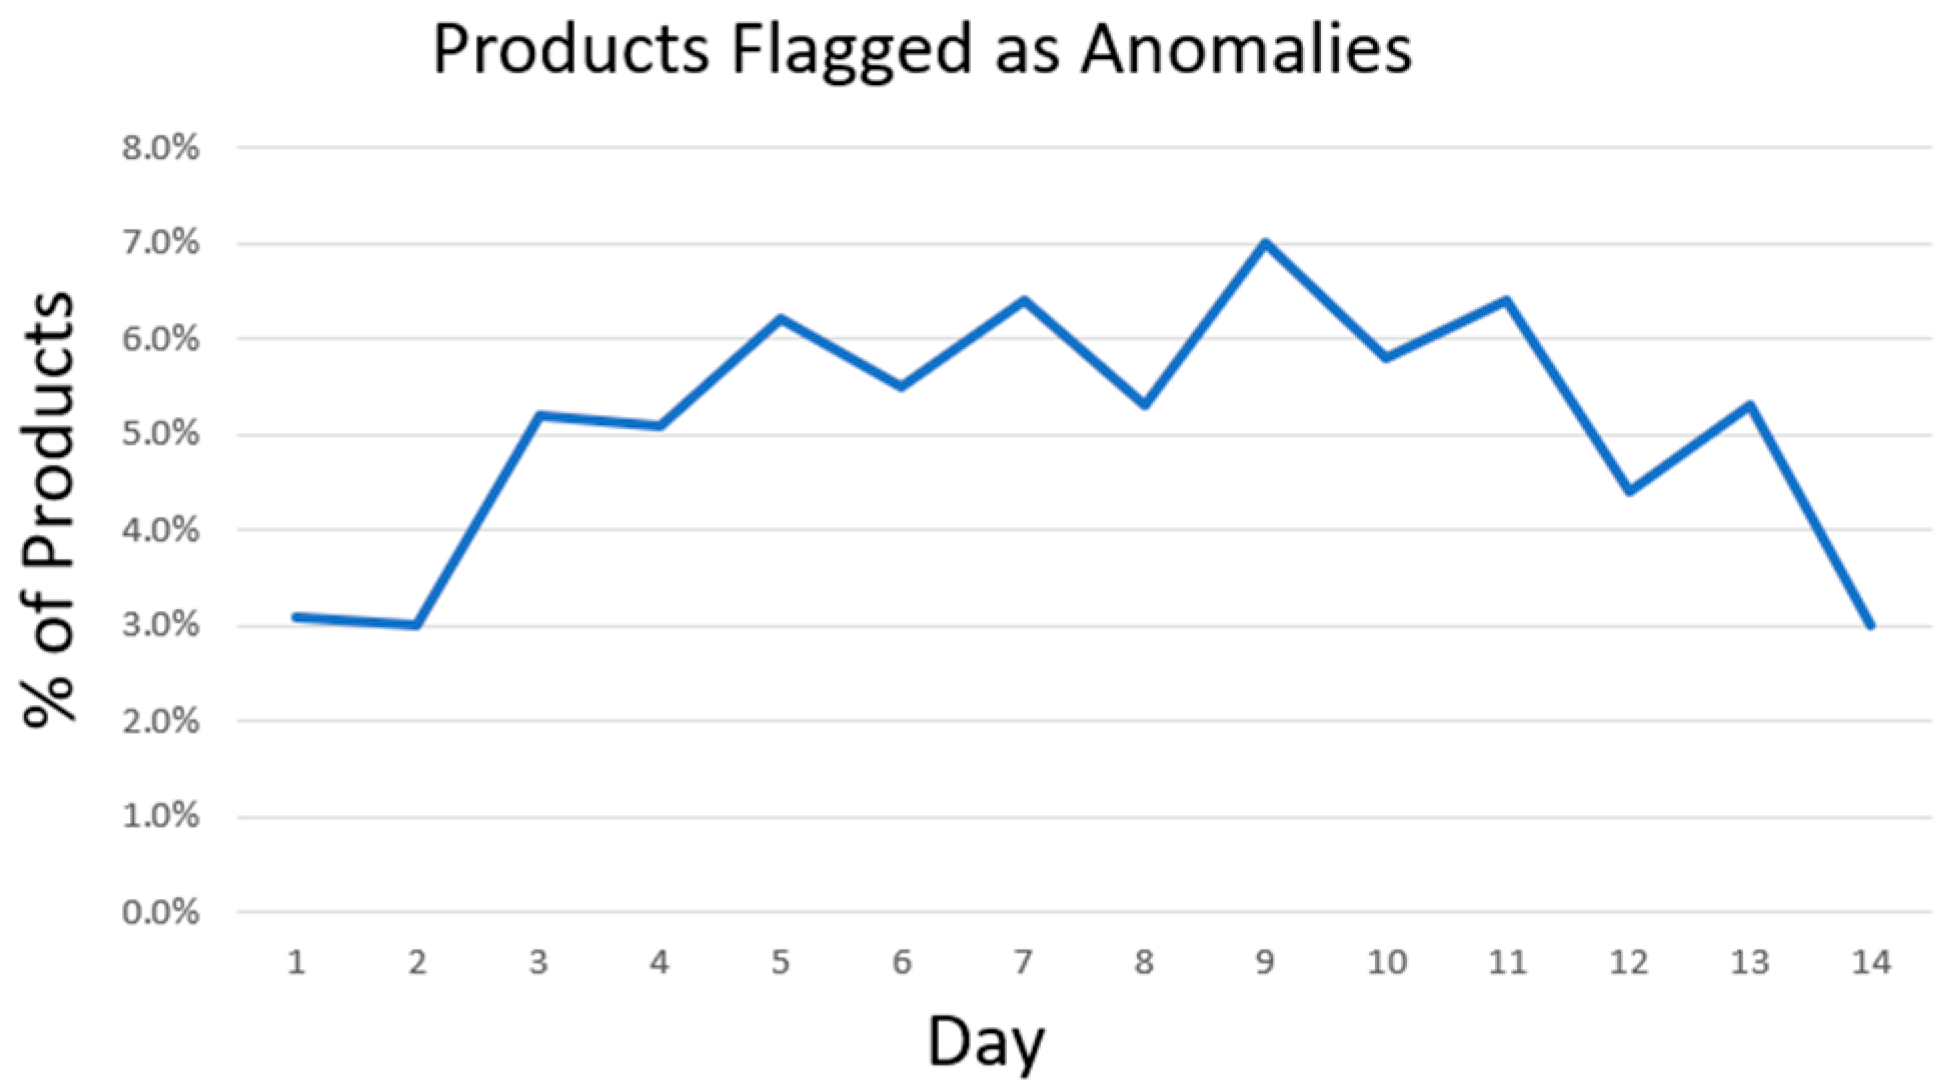
In the second experiment, we used a different account with a variety of products. The agent was trained using data from the past two months. We configured the agent to operate in real-time, where it analyzes incoming data from the Google Ads API on a daily basis and flags potential anomalies based on the newly received values. The system was set up to send automated alerts when deviations above a certain threshold, based on the anomaly score calculated by the Isolation Forest algorithm, were detected.
During the two-week observation period, the agent processed over 4500 unique product ids. On average, it identified 5.1% of the products per day as potential anomalies (ranging from 3% to 7%), which were objectively linked to issues in cost efficiency or product visibility in search (
Figure 2).
In response to the alerts and after a manual review, 27 underperforming products were paused.
5.2. Experiment with the Intelligent Agent for Product Redirection Between Campaigns
For the purposes of the experiment, we created two new campaigns to use for product reallocation. In the first campaign, products from the main campaign without impressions will be added. This campaign has a daily budget set by the client, and the strategy employed is Maximize Conversions. The second campaign will include products with poor performance, defined as those with low ROAS, as well as products with high spend and no conversions. The campaign settings include a very high Target ROAS and a low daily budget, as determined by the respective client.
The agent was trained using the same data from the past 30 days that was used in the anomaly detection agent. The agent was retrained weekly over a period of two months.
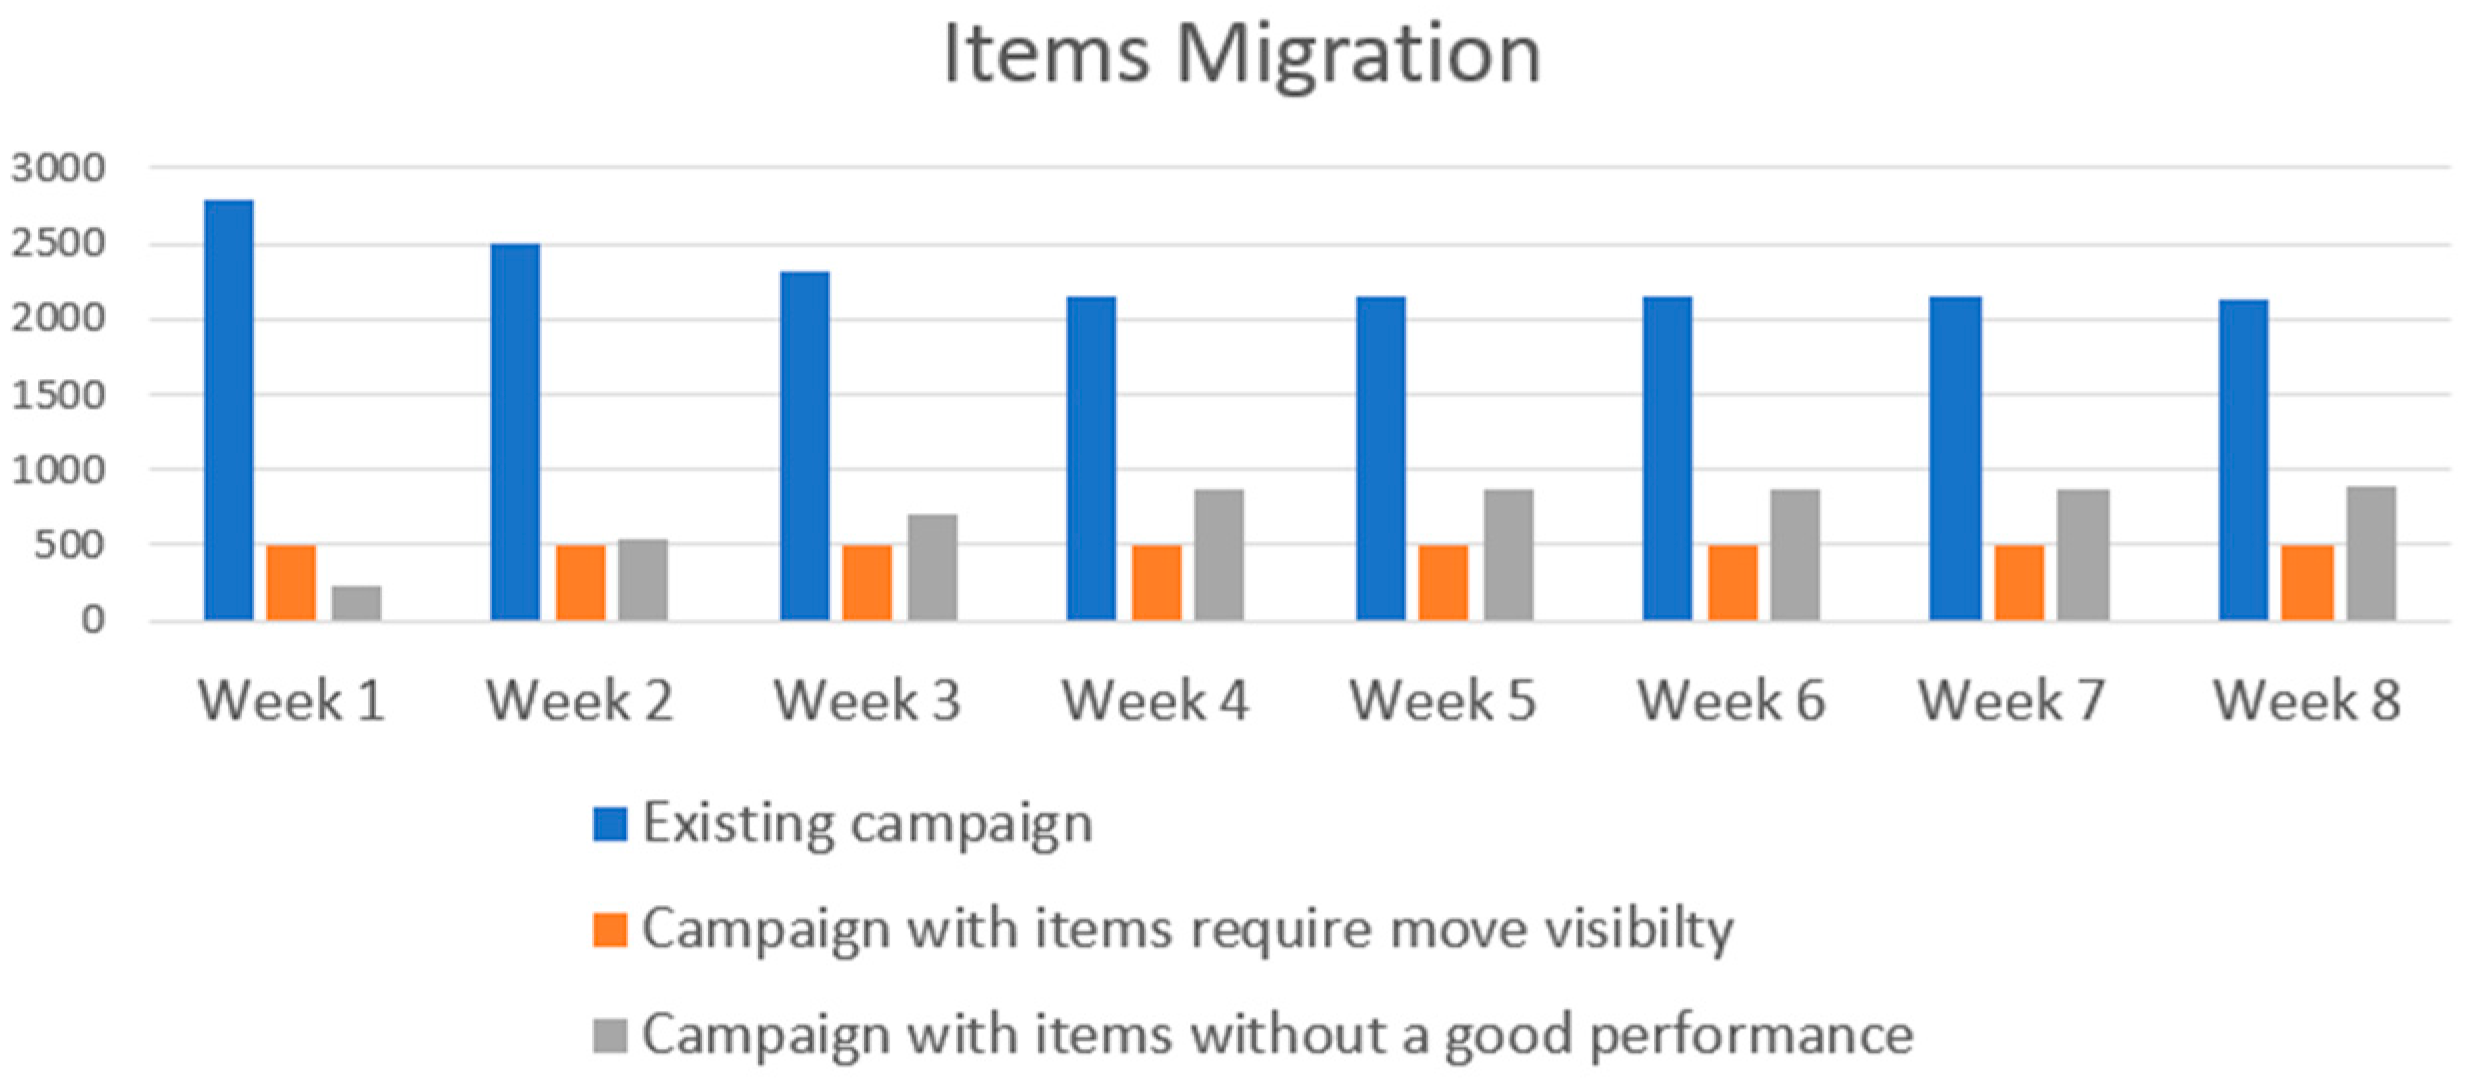
Figure 3 shows the results of the product performance and the change in the total number of products across the three campaigns. It can be observed that, initially, the total number of products changes significantly, while in the later weeks, the total number remains almost unchanged. This indicates that over time, the main campaign is cleared of underperforming products, retaining only those with good performance. As a result, the training of the algorithm used in the campaign is not distorted by ineffective products.
Redirecting products to different campaigns also led to other positive outcomes. Products that were struggling with visibility in search increased their impressions, as they no longer competed with best sellers and now had a dedicated budget just for them. Products that had high spend significantly reduced their costs to a minimum, as the high Target ROAS set at the campaign level limited the cost per click and reduced the frequency of product impressions and clicks. Despite this, the overall ROAS achieved by the campaign improved.
6. Conclusions
This study demonstrates how intelligent agents can significantly enhance the performance of Google Ads Performance Max campaigns. By distinguishing between static campaign-level features and dynamic, aggregated product-level metrics, we enable more accurate and actionable insights. Two machine learning-based agents were developed: one for real-time anomaly detection using Isolation Forest, and another for product reallocation using a Random Forest classifier. These agents work autonomously to monitor performance, flag issues, and optimize campaign structure without manual input. Our experimental results using real Google Ads data across several campaigns demonstrate the practical benefits of these agents-improvements in ROAS, visibility, and cost-efficiency. The approach will support the advertisers in managing complex campaigns more efficiently and responding quickly to changes in product performance.


