
Finding Earthquake Victims by Voice Detection Techniques †


Abstract
:1. Introduction
2. Methodology
2.1. Frequency Domain Parameters
2.2. Noise and Voice Samples
2.3. Post-Processing of Frequency Domain Parameters
2.4. Training
2.5. Cross-Validation
3. Results
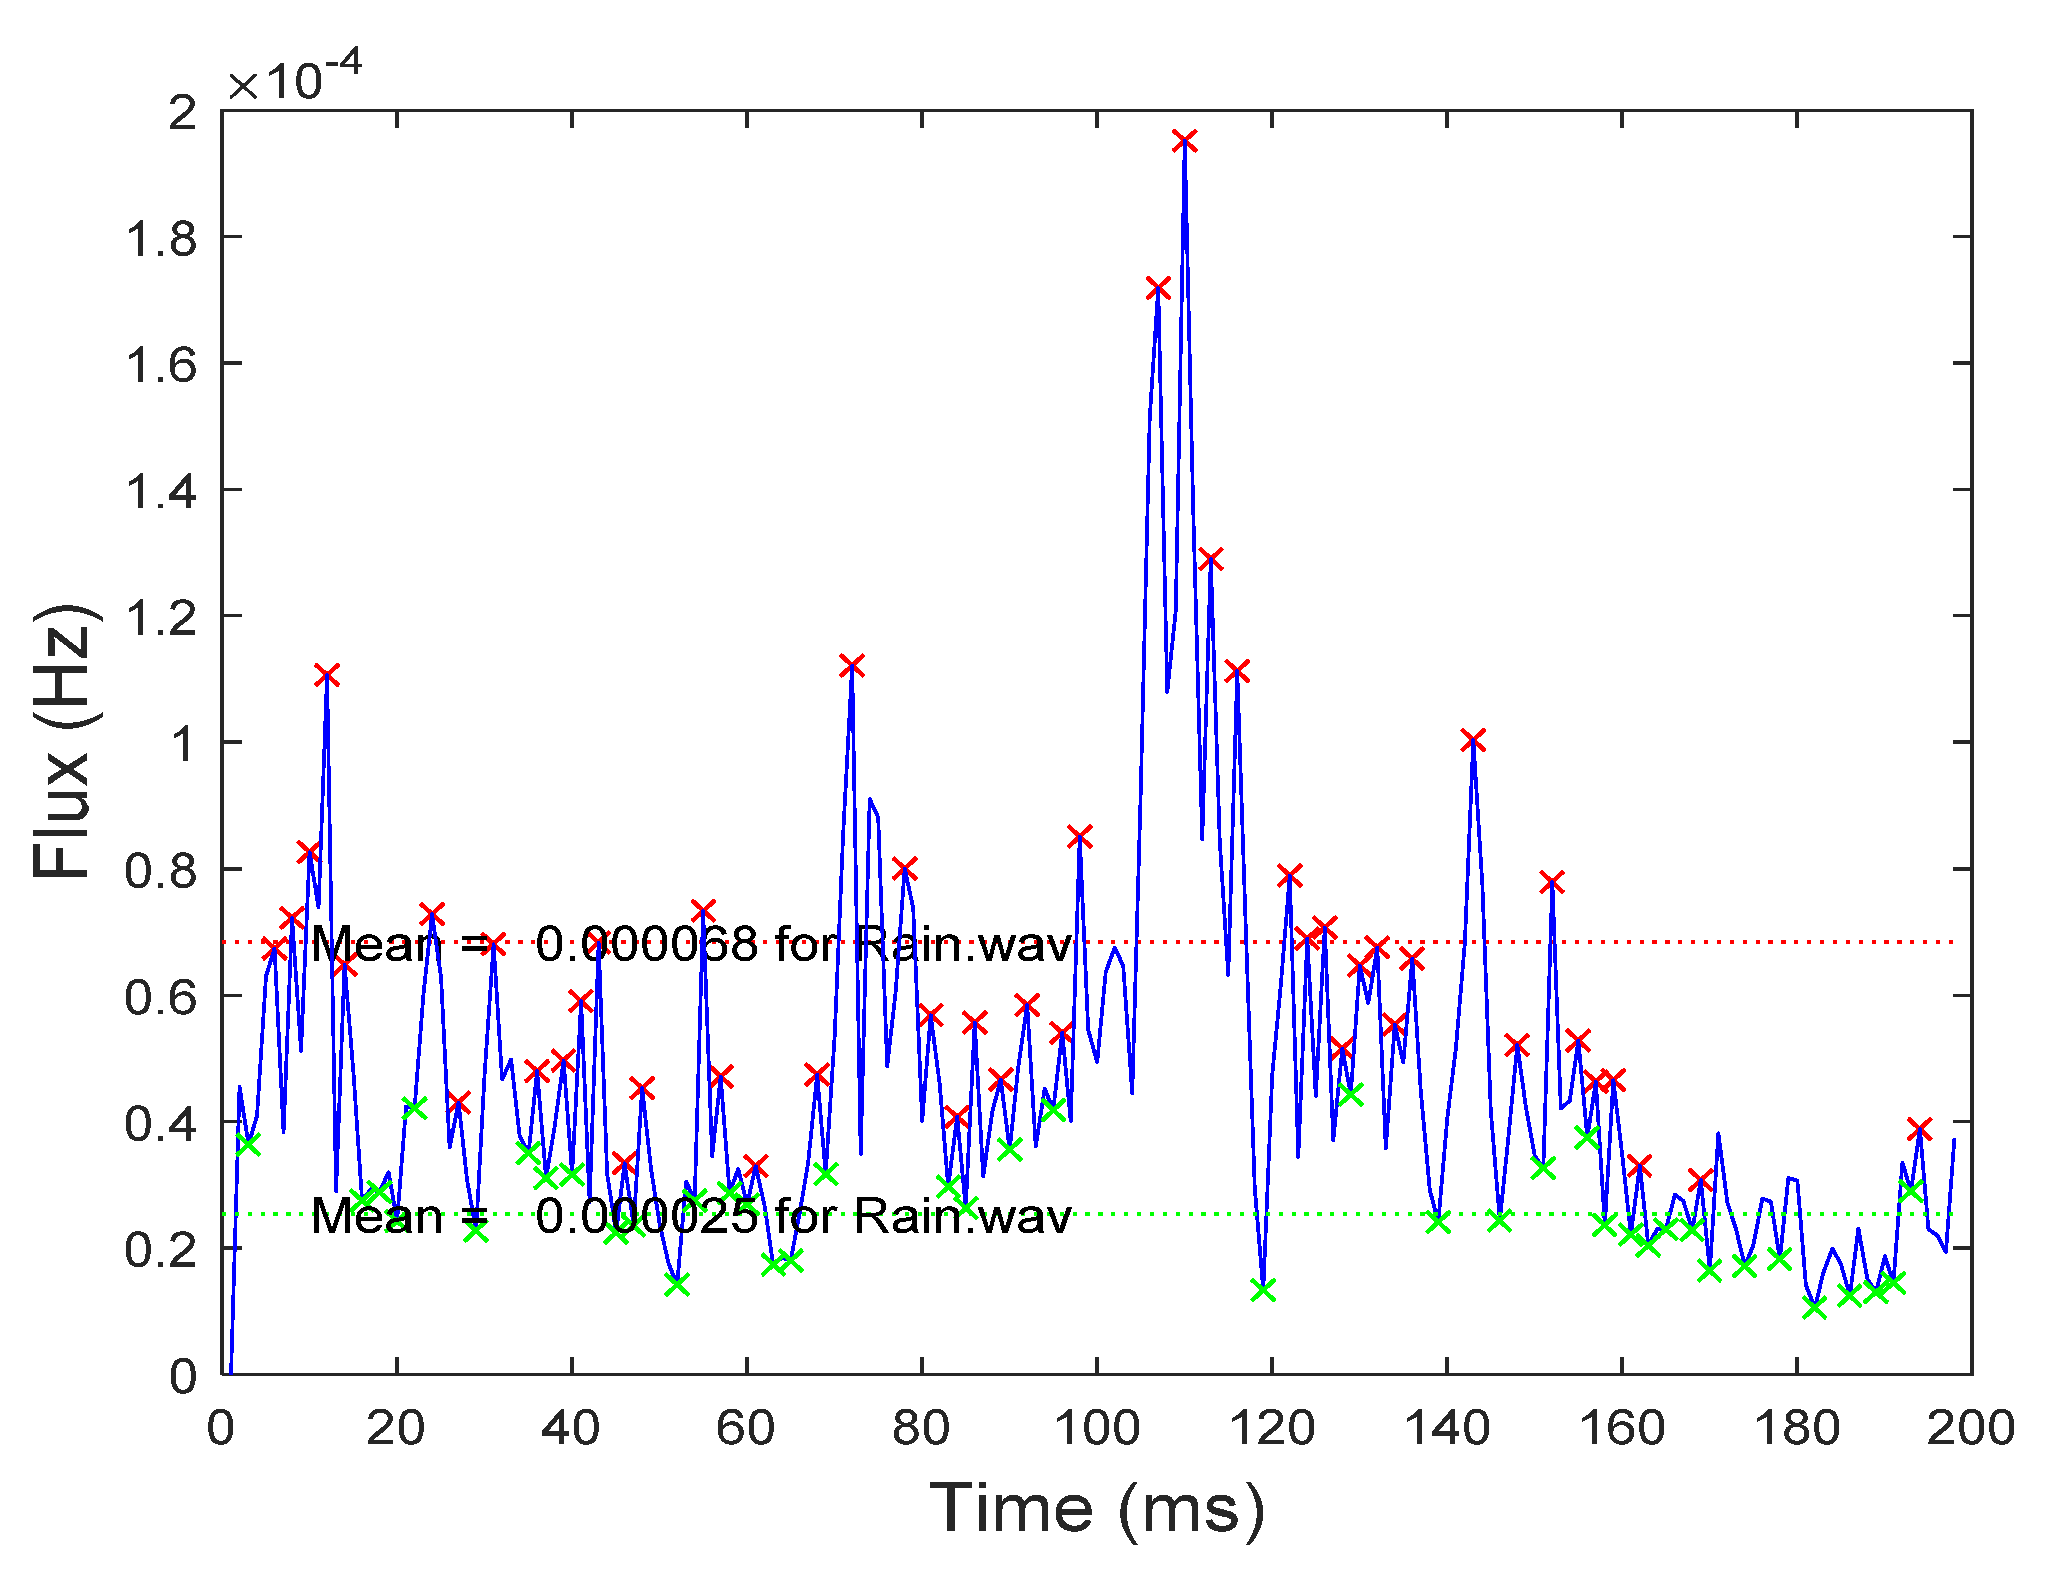
3.1. Peak Detection
3.2. Cross Validation Results
3.3. Results for Mixed Sample Type for Training and Testing
4. Conclusions
Supplementary Materials
Author Contributions
Funding
Institutional Review Board Statement
Informed Consent Statement
Data Availability Statement
Conflicts of Interest
References
- Significant Earthquakes. Available online: http://earthquake.usgs.gov/earthquakes/browse/significant.php (accessed on 10 October 2021).
- Yochum, S.E.; Goertz, L.A.; Jones, P.H. Case study of the Big Bay Dam failure: Accuracy and comparison of breach predictions. J. Hydraul. Eng. 2008, 134, 1285–1293. [Google Scholar] [CrossRef]
- Zhang, D.; Sessa, S.; Kasai, R.; Cosentino, S.; Giacomo, C.; Mochida, Y.; Yamada, H.; Guarnieri, M.; Takanishi, A. Evaluation of a sensor system for detecting humans trapped under rubble: A pilot study. Sensors 2018, 18, 852. [Google Scholar] [CrossRef] [PubMed] [Green Version]
- Aggelopoulos, E.G.; Karabetsos, E.; Constantinou, P.; Uzunoglu, N. Mobile microwave sensor for detection of trapped human beings. Measurement 1996, 18, 177–183. [Google Scholar] [CrossRef]
- New Technology Can Detect Heartbeats in Rubble; California Institute of Technology: Pasadena, CA, USA, 17 September 2013; Available online: http://www.jpl.nasa.gov/news/news.php?release=2013-281 (accessed on 1 April 2020).
- Jha, R.; Lang, W.; Jedermann, R. B4. 5 Sensory options for earthquake victim recovery. In Proceedings of the SMSI 2020-Sensors and Instrumentation, Online Conference, 6 November 2020; pp. 125–126. [Google Scholar] [CrossRef]
- Tanyer, S.G.; Özer, H. Voice activity detection in nonstationary noise. IEEE Trans. Speech Audio Process. 2000, 8, 478–482. [Google Scholar] [CrossRef]
- Jeong-Sik, P.; Jung-Seok, Y.; Yong-Ho, S.; Gil-Jin, J. Spectral energy based voice activity detection for real-time voice interface. J. Theor. Appl. Inf. Technol. 2017, 95, 4304–4312. [Google Scholar]
- Alias, F.; Socoro, J.C.; Sevillano, X. A Review of physical and perceptual feature extraction techniques for speech, music and environmental sounds. Appl. Sci. 2016, 6, 143. [Google Scholar] [CrossRef] [Green Version]
- Mongia, P.K.; Sharma, R.K. Estimation and statistical analysis of human voice parameters to investigate the influence of psychological stress and to determine the vocal tract transfer function of an individual. J. Comput. Netw. Commun. 2014, 2014, 290147. [Google Scholar] [CrossRef] [Green Version]
- IRCAM. A Large Set of Audio Features for Sound Description; IRCAM Tech. Report; IRCAM: Paris, France, 2003. [Google Scholar]
- Da Records. Geräusche Audio CD, ASIN B00005OCCT; Da Records: Singapore, 2001; Volumes 1–3. [Google Scholar]
- Ghojogh, B.; Crowley, M. Linear and Quadratic Discriminant Analysis: Tutorial. arXiv 2019, arXiv:1906.02590. [Google Scholar]
- Hashimoto, K.; Zen, H.; Nankaku, Y.; Lee, A.; Tokuda, K. Bayesian context clustering using cross-validation for speech recognition. IEICE Trans. Inf. Syst. 2011, 94, 668–678. [Google Scholar] [CrossRef] [Green Version]


| Group | Sources | Name | Examples |
|---|---|---|---|
| Noise Studio | Audio CD [11] | N1 to 11 | Traffic, touring cars, motorcars, cleaning, airplane, buzzer, river, applause, industry, chattering. |
| Voice Samples | CD, TV, studio recording | VF1 to 4 (female) VM1 to 5 (male) | Female and Male sound recordings in English and German. |
| Noise Street | Outside recording | SN 1 to 7 | Street noises with birds, cars, tram, glasses, music, river and wind |
| Voice Mix | Outside recording | MIX 1 to 5 | Mix sounds of people speaking with background noise. |
| Voice Studio | Studio recording | VF… (female) VM… (male) | Speech recorded in Spanish (S), German (D), Hindi (H), English (E), and Latvian (L) |
| Group | Flux | Roll-Off | Centroid | Flux and Centroid | Centroid and Roll Off |
|---|---|---|---|---|---|
| Noise Street | 7/0 | 7/0 | 7/0 | 7/0 | 7/0 |
| Voice Mix | 5/0 | 2/3 | 3/2 | 5/0 | 4/1 |
| Voice Studio | 6/0 | 5/1 | 5/1 | 6/0 | 5/1 |
| Success rate | 100% | 78% | 83% | 100% | 88% |
Publisher’s Note: MDPI stays neutral with regard to jurisdictional claims in published maps and institutional affiliations. |
© 2021 by the authors. Licensee MDPI, Basel, Switzerland. This article is an open access article distributed under the terms and conditions of the Creative Commons Attribution (CC BY) license (https://creativecommons.org/licenses/by/4.0/).
Share and Cite
Jha, R.; Lang, W.; Jedermann, R. Finding Earthquake Victims by Voice Detection Techniques. Eng. Proc. 2021, 10, 69. https://doi.org/10.3390/ecsa-8-11248
Jha R, Lang W, Jedermann R. Finding Earthquake Victims by Voice Detection Techniques. Engineering Proceedings. 2021; 10(1):69. https://doi.org/10.3390/ecsa-8-11248
Chicago/Turabian StyleJha, Ruchi, Walter Lang, and Reiner Jedermann. 2021. "Finding Earthquake Victims by Voice Detection Techniques" Engineering Proceedings 10, no. 1: 69. https://doi.org/10.3390/ecsa-8-11248
APA StyleJha, R., Lang, W., & Jedermann, R. (2021). Finding Earthquake Victims by Voice Detection Techniques. Engineering Proceedings, 10(1), 69. https://doi.org/10.3390/ecsa-8-11248