
Investigating the Terrain Complexity from ATL06 ICESat-2 Data for Terrain Elevation and Its Use for Assessment of Openly Accessible InSAR Based DEMs in Parts of Himalaya’s †


Abstract
:1. Introduction
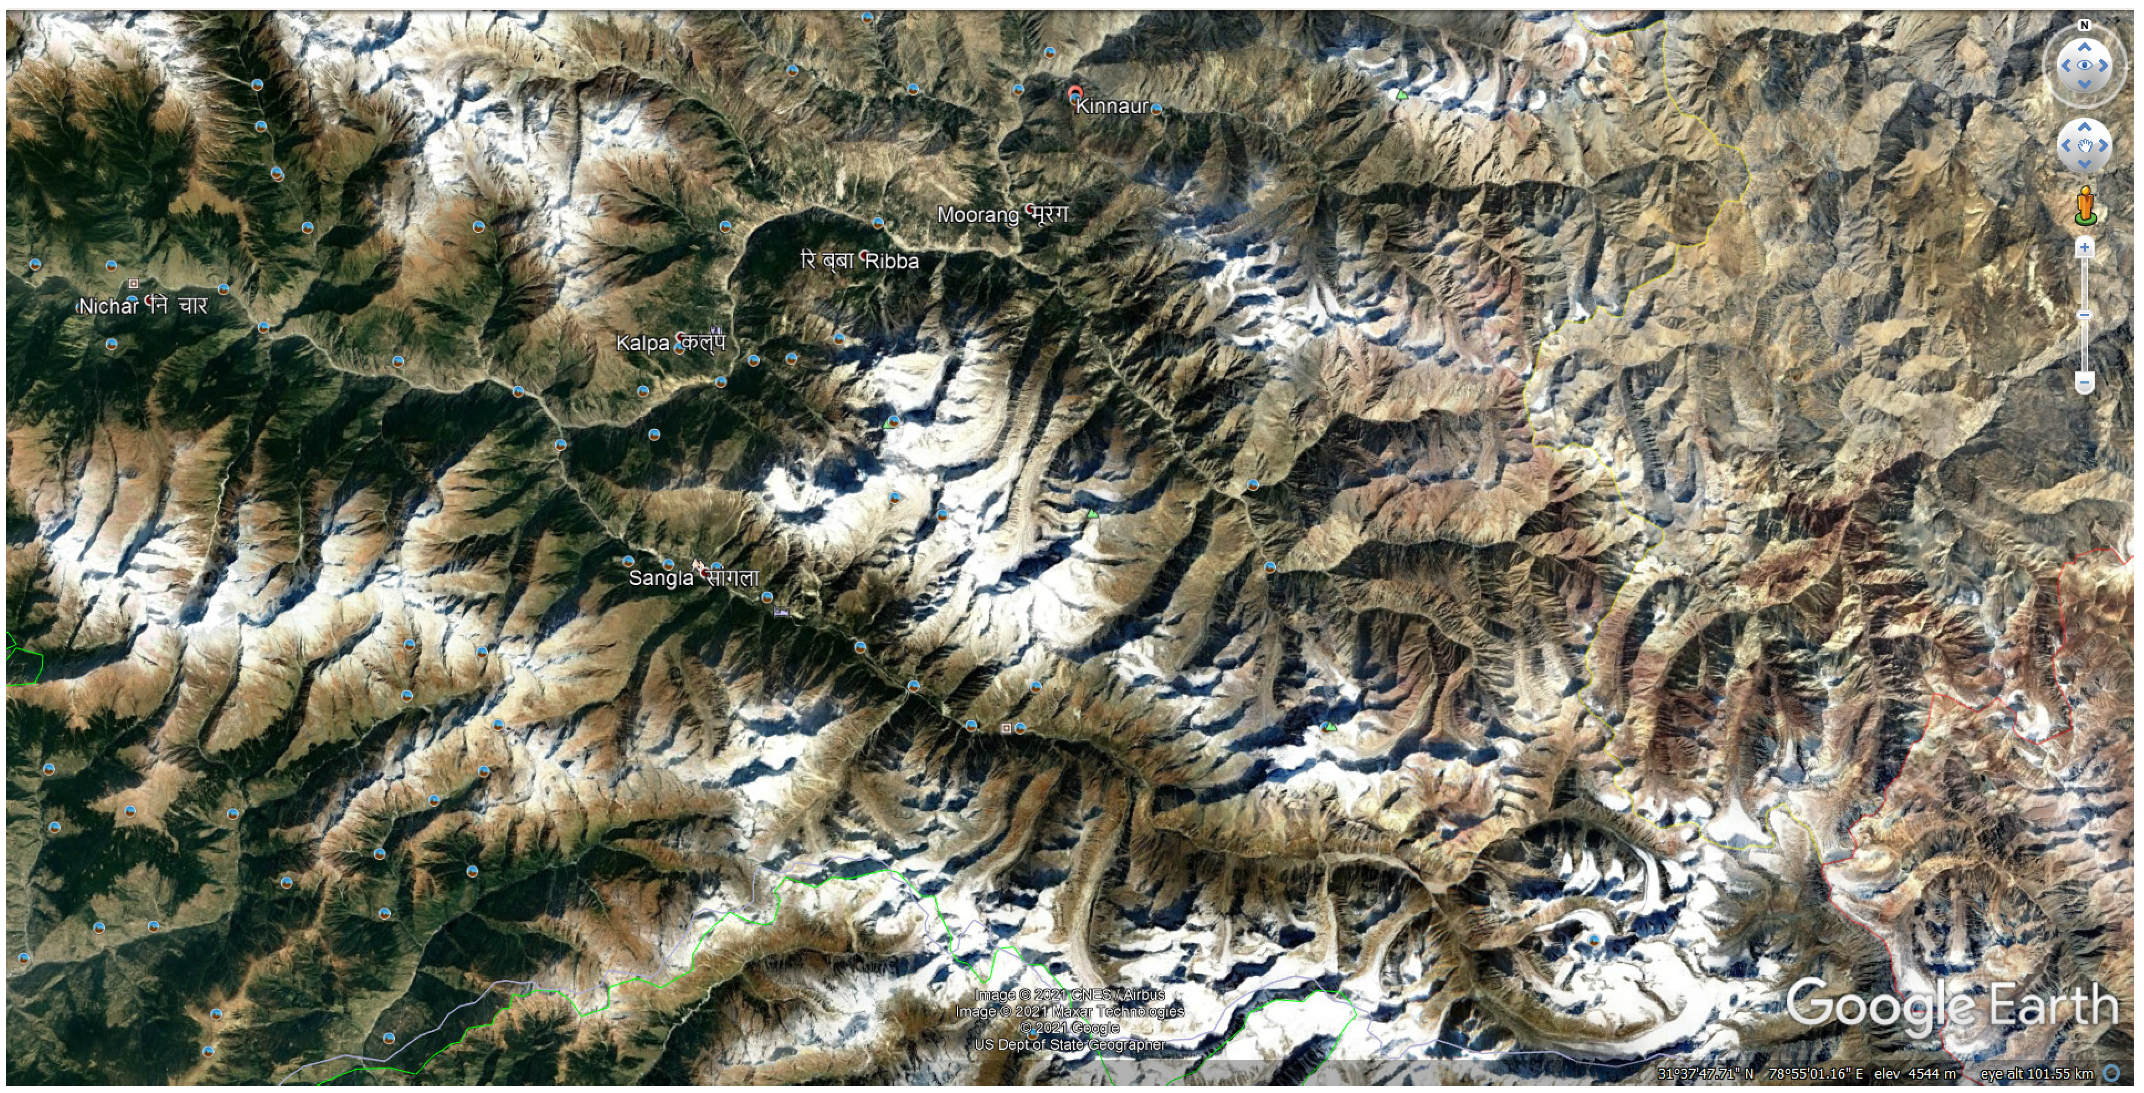
2. Study Area
3. Material
3.1. Openly Accessible DEMs
3.1.1. TanDEM-X 90
3.1.2. ALOS PALSAR RTC HR DEM
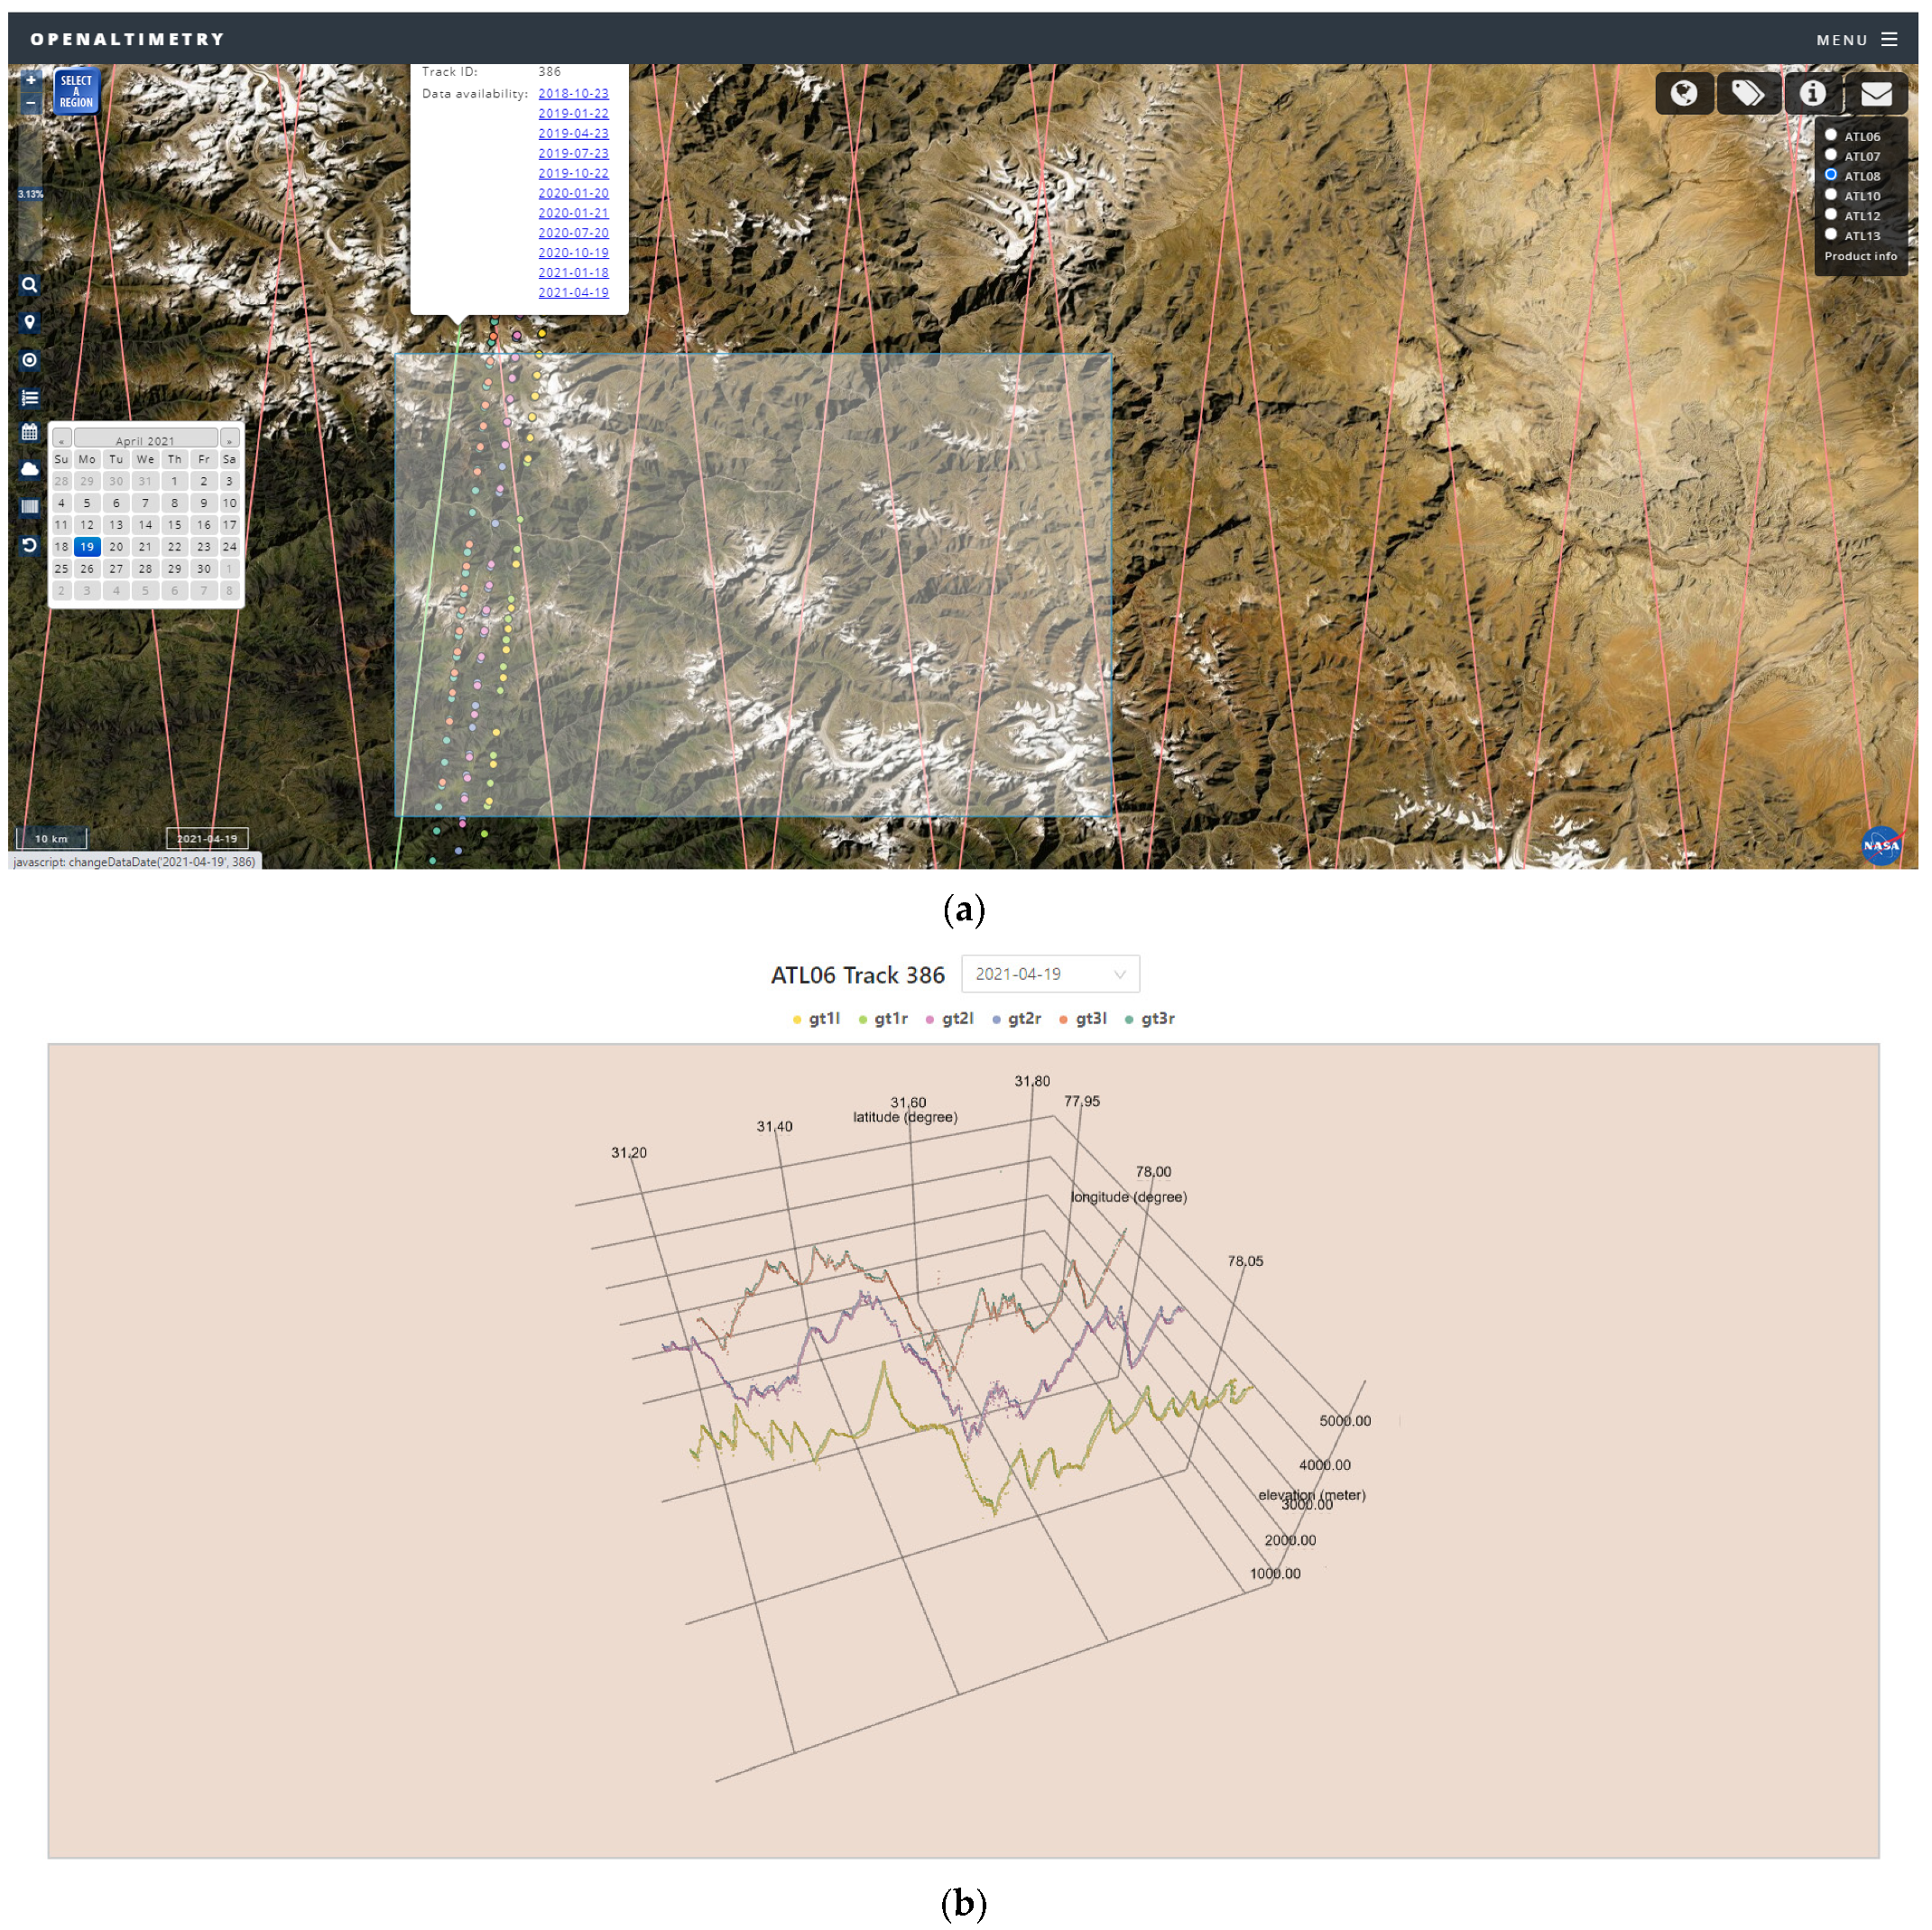
3.2. Spaceborne LiDAR Data (ICESat-2)
4. Method
5. Results and Discussion
6. Conclusions
Funding
Institutional Review Board Statement
Informed Consent Statement
Data Availability Statement
Acknowledgments
Conflicts of Interest
References
- Simeoni, L.; Ronchetti, F.; Costa, C.; Joris, P.; Corsini, A. Redundancy and coherence of multi-method displacement monitoring data as key issues for the analysis of extremely slow landslides (Isarco valley, Eastern Alps, Italy). Eng. Geol. 2020, 267, 105504. [Google Scholar] [CrossRef]
- Palladino, M.R.; Viero, A.; Turconi, L.; Brunetti, M.T.; Peruccacci, S.; Melillo, M.; Luino, F.; Deganutti, A.M.; Guzzetti, F. Rainfall thresholds for the activation of shallow landslides in the Italian Alps: The role of environmental conditioning factors. Geomorphology 2018, 303, 53–67. [Google Scholar] [CrossRef]
- Martha, T.R. Detection of Landslides by Object-Oriented Image Analysis; University of Twente: Enschede, The Netherlands, 2011. [Google Scholar]
- Martha, T.R.; Roy, P.; Mazumdar, R.; Govindharaj, K.B.; Kumar, K.V. Spatial characteristics of landslides triggered by the 2015 Mw 7.8 (Gorkha) and Mw 7.3 (Dolakha) earthquakes in Nepal. Landslides 2017, 14, 697–704. [Google Scholar] [CrossRef]
- Pánek, T.; Schönfeldt, E.; Winocur, D.; Břežný, M.; Šilhán, K.; Chalupa, V.; Korup, O. Moraines and marls: Giant landslides of the Lago Pueyrredón valley in Patagonia, Argentina. Quat. Sci. Rev. 2020, 248, 106598. [Google Scholar] [CrossRef]
- Alcaraz Tarragüel, A.; Krol, B.; van Westen, C. Analysing the possible impact of landslides and avalanches on cultural heritage in Upper Svaneti, Georgia. J. Cult. Herit. 2012, 13, 453–461. [Google Scholar] [CrossRef]
- Wang, C.; Zhu, X.; Nie, S.; Xi, X.; Li, D.; Zheng, W.; Chen, A.S. Ground elevation accuracy verification of ICESat-2 data: A case study in Alaska, USA. Opt. Express 2019, 27, 38168–38179. [Google Scholar] [CrossRef] [PubMed]
- Chen, C.; Yang, S.; Li, Y. Accuracy Assessment and Correction of SRTM DEM Using ICESat/GLAS Data under Data Coregistration. Remote Sens. 2020, 12, 3435. [Google Scholar] [CrossRef]
- Zhang, Y.; Pang, Y.; Cui, D.; Ma, Y.; Chen, L. Accuracy Assessment of the ICESat-2/ATL06 Product in the Qilian Mountains Based on CORS and UAV Data. IEEE J. Sel. Top. Appl. Earth Obs. Remote Sens. 2021, 14, 1558–1571. [Google Scholar] [CrossRef]
- Liu, Z.; Zhu, J.; Fu, H.; Zhou, C.; Zuo, T. Evaluation of the Vertical Accuracy of Open Global DEMs over Steep Terrain Regions Using ICESat Data: A Case Study over Hunan Province, China. Sensors 2020, 20, 4865. [Google Scholar] [CrossRef] [PubMed]
- Wood, J.L.; Harrison, S.; Reinhardt, L. Landslide inventories for climate impacts research in the European Alps. Geomorphology 2015, 228, 398–408. [Google Scholar] [CrossRef] [Green Version]
- USGS. Landslide Hazards. Available online: https://www.usgs.gov/natural-hazards/landslide-hazards/science/landslides-101?qt-science_center_objects=0#qt-science_center_objects (accessed on 14 August 2021).
- Gracheva, R.; Golyeva, A. Landslides in Mountain Regions: Hazards, Resources and Information. Geophys. Hazards 2009, 249–260. [Google Scholar] [CrossRef]
- Martha, T.R.; Roy, P.; Jain, N.; Kumar, K.V.; Reddy, P.S.; Nalini, J.; Sharma, S.V.S.P.; Shukla, A.K.; Rao, K.H.V.D.; Narender, B.; et al. Rock avalanche induced flash flood on 07 February 2021 in Uttarakhand, India—A photogeological reconstruction of the event. Landslides 2021, 18, 2881–2893. [Google Scholar] [CrossRef]
- Pandey, P.; Chauhan, P.; Bhatt, C.M.; Thakur, P.K.; Kannaujia, S.; Dhote, P.R.; Roy, A.; Kumar, S.; Chopra, S.; Bhardwaj, A.; et al. Cause and Process Mechanism of Rockslide Triggered Flood Event in Rishiganga and Dhauliganga River Valleys, Chamoli, Uttarakhand, India Using Satellite Remote Sensing and in situ Observations. J. Indian Soc. Remote Sens. 2021, 49, 1011–1024. [Google Scholar] [CrossRef]
- Meena, S.R.; Bhuyan, K.; Chauhan, A.; Singh, R.P. Snow covered with dust after Chamoli rockslide: Inference based on high-resolution satellite data. Remote Sens. Lett. 2021, 12, 704–714. [Google Scholar] [CrossRef]
- Guth, P.L.; Geoffroy, T.M. LiDAR point cloud and ICESat-2 evaluation of 1 second global digital elevation models: Copernicus wins. Trans. GIS 2021, 25, 2245–2261. [Google Scholar] [CrossRef]
- Saini, O.; Bhardwaj, A.; Chatterjee, R.S. Analysis of Back-Scattering Coefficient of NovaSAR-1 S-Band SAR. In Proceedings of the National Seminar on Recent Advances in Geospatial Technology and Application, Dehradun, India, 2 March 2020; pp. 117–122. [Google Scholar]
- Bhardwaj, A. Assessment of Vertical Accuracy for TanDEM-X 90 m DEMs in Plain, Moderate, and Rugged Terrain. Proceedings 2019, 24, 8. [Google Scholar] [CrossRef] [Green Version]
- Saini, O.; Bhardwaj, A.; Chatterjee, R.S. Generation of Radargrammetric Digital Elevation Model (DEM) and Vertical Accuracy Assessment using ICESat-2 Laser Altimetric Data and Available Open-Source DEMs. In Proceedings of the 39th INCA International Congress on New Age Cartography and Geospatial Technology, Digital, India, 18–20 December 2019; p. 12. [Google Scholar]
- Bhardwaj, A. Evaluation of openly Accessible MERIT DEM for vertical accuracy in different topographic regions of India. In Proceedings of the 39th INCA International Congress on New Age Cartography and Geospatial Technology, Digital, India, 18–20 December 2019; pp. 1–9. [Google Scholar]

Publisher’s Note: MDPI stays neutral with regard to jurisdictional claims in published maps and institutional affiliations. |
© 2021 by the author. Licensee MDPI, Basel, Switzerland. This article is an open access article distributed under the terms and conditions of the Creative Commons Attribution (CC BY) license (https://creativecommons.org/licenses/by/4.0/).
Share and Cite
Bhardwaj, A. Investigating the Terrain Complexity from ATL06 ICESat-2 Data for Terrain Elevation and Its Use for Assessment of Openly Accessible InSAR Based DEMs in Parts of Himalaya’s. Eng. Proc. 2021, 10, 65. https://doi.org/10.3390/ecsa-8-11327
Bhardwaj A. Investigating the Terrain Complexity from ATL06 ICESat-2 Data for Terrain Elevation and Its Use for Assessment of Openly Accessible InSAR Based DEMs in Parts of Himalaya’s. Engineering Proceedings. 2021; 10(1):65. https://doi.org/10.3390/ecsa-8-11327
Chicago/Turabian StyleBhardwaj, Ashutosh. 2021. "Investigating the Terrain Complexity from ATL06 ICESat-2 Data for Terrain Elevation and Its Use for Assessment of Openly Accessible InSAR Based DEMs in Parts of Himalaya’s" Engineering Proceedings 10, no. 1: 65. https://doi.org/10.3390/ecsa-8-11327
APA StyleBhardwaj, A. (2021). Investigating the Terrain Complexity from ATL06 ICESat-2 Data for Terrain Elevation and Its Use for Assessment of Openly Accessible InSAR Based DEMs in Parts of Himalaya’s. Engineering Proceedings, 10(1), 65. https://doi.org/10.3390/ecsa-8-11327