Proceeding Paper

System for Continuous and Prolonged Ambulatory ECG Monitoring with Hosting and Visualization on the Cloud †

by
Daniel Cuevas-González
1,
Juan Pablo García-Vázquez
1,*,
Miguel Bravo-Zanoguera
1,
Roberto López-Avitia
1,
Marco A. Reyna
2 and
José A. Amezquita-García
1
1
Facultad de Ingeniería, Universidad Autónoma de Baja California (UABC), Mexicali 21280, Mexico
2
Instituto de Ingeniería, Universidad Autónoma de Baja California (UABC), Mexicali 21280, Mexico
*
Author to whom correspondence should be addressed.
Presented at the 8th International Electronic Conference on Sensors and Applications, 1–15 November 2021; Available online: https://ecsa-8.sciforum.net.
Eng. Proc. 2021, 10(1), 57; https://doi.org/10.3390/ecsa-8-11326
Published: 1 November 2021

Abstract

:
In this paper, we propose investigating the ability to integrate a portable Electrocardiogram (ECG) device to commercial platforms to analyze and visualize information hosted in the cloud. Our ECG system based on the ADX8232 microchip was evaluated regarding its performance of recordings of a synthetic ECG signal for periods of 1, 2, 12, 24, and 36 h on six different cloud services to investigate whether it maintains reliable ECG records. Our results show that there are few cloud services capable of 24 h or longer ECG recordings. But some existing services are limited to small file sizes of less than 1,000,000 lines or 100 MB, or approximately 45 min of an ECG recording at a sampling rate of 360 Hz, making it difficult an extended time monitoring. Cloud platforms reveal some limitations of storage and visualization in order to provide support to health care specialists to access information related to a patient at any time.

1. Introduction

Current ambulatory monitoring technologies include the Holter, portable event recorder, external loop recorder, and insertable cardiac monitoring [1]. Of these, the Holter ECG is the most widely used in daily practice [2]. The Holter records and stores cardiac activity information continuously for 24 or 48 h. However, it can only detect and record frequent cardiac events but loses its usefulness in following up on less frequent symptoms, commonly evaluated more effectively with monitoring at intervals of up to 2 weeks. For instance, in the follow-up of palpitations caused by atrial fibrillation [3]. Therefore, the patient must return to the physician to download the information and, subsequently, to perform a retrospective analysis of the data. However, it does not offer computational mechanisms that allow the physician and patient to monitor the cardiac rhythm remotely and retrospectively through a mobile application or web service [4]. Therefore, this paper proposes designing and implementing a system based on ADX823X for continuous and prolonged ambulatory cardiac rhythm monitoring. The system will provide compatible long term ECG records with a cloud-hosted platform that allows health care specialists (e.g., cardiologist) to access information related to the patient’s cardiac activity to perform remote monitoring, diagnosis, and perform a retrospective analysis of the patient’s cardiac activity at any time from a computer or mobile device with Internet access.

2. Materials and Methods

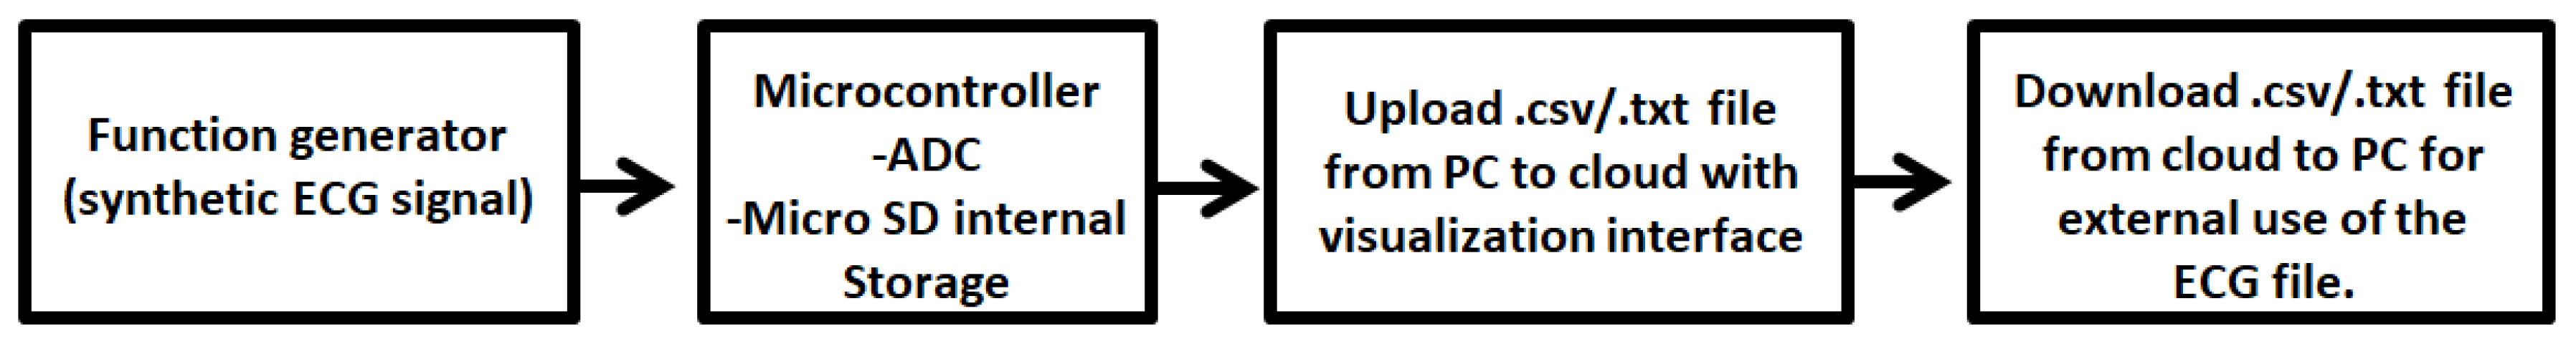
2.1. Continuous and Long-Term Ambulatory Monitoring System

For this work, the ECG System described in [5,6] was used, designed to function when the subject performs daily activities. This system comprises the Analog Front-End (AFE) AD8232 microchip and can measure an electrocardiographic signal of lead DI, DII, or DIII, with a bandwidth of 0.5–40 Hz. Regarding data storage and transmission, the system can work in several modes, but for the experimentation of this paper, the MicroSD recording mode was used. With 32GB of internal storage on the device, it can store up to 30 days of cardiac activity in extended format (.txt or .csv format).

2.2. Synthetic ECG Signals

Synthetic ECG signals were generated using the ecgsim function of the ADSP toolbox for Matlab developed by Ambardar et al. [7]. This function generates a single beat ECG signal from two coefficients, N, the number of samples multiplied by 100, and m, which is the parameter for signal smoothing, initialized with the default value. The ECG signal generated was 300 samples, and with the “resample” command, it was modified to 360 data. This signal was exported to a Tektronix AFG3021B and Analog discovery function generator for continuous playback for 1, 2, 12, 24, 32 h to be fed into the ambulatory monitoring system running in recording mode and checked at the output to verify that the signal is transmitted and recorded correctly.
Therefore, some of the characteristics of the files mentioned above are explained: (1) The sampling frequency used was 500 Hz, with the Analogical to Digital Converter (ADC) in the “default” configuration of 10-bits. One hour of recording corresponds to 3600 beats because the synthetic signal was reproduced at 1 Hz, the size of each beat in the Txt file corresponds to 2480 bytes; therefore when doing the multiplication of beats in each file, the size corresponds to the expected file size. Table 1 shows the file sizes for 1, 2, 12, 24, and 36 h ECG recordings.

2.3. Evaluation of Platforms for Electrocardiographic Information with Cloud Storage and Visualization Services

The ambulatory monitoring system was designed to be linked to storage and visualization tools available in the cloud. This is to allow remote access to the patient’s cardiac activity for timely diagnosis. The platforms that could be compatible with our system were ThingSpeak, Tableau, Power BI, Datastudio, Zoho, and Amazon Web Services (AWS). Each platform was tested to determine its performance during the storage and visualization of the long-duration ECG signal. Performance testing was achieved with recordings of a synthetic ECG signal for 1, 2, 12, 24, and 36 h (See Table 2), to verify the capacity of platforms to allow the information visualization of ECG data records corresponding to longer than 24 h. Additionally, to determine the integrity of the ECG data, a simple Matlab vector subtraction was used to compare the uploaded file against the downloaded file to determine any anomalies in the ECG signal.
Figure 1 shows the block diagram of the experimental design carried out in this work, which consists of the following stages: (1) the generation and reproduction of a known synthetic signal in a function generator, (2) microcontroller and peripheral elements among which the internal storage in microSD, (3) the use of cloud as a service (SaaS) to upload ECG files and (4) the download of these files from the cloud for a particular use.
Therefore, to correctly upload, view, and download the ECG files of prolonged time, it is necessary to record the file on the MicroSD memory in the ECG device by pressing “record” and at the end of the monitoring time, press “stop” to ensure that the ECG file is saved on the MicroSD memory. Then it is necessary to transfer this .txt/.csv file to a PC and manually upload it to the cloud as a new “dataset” or database. Currently, to automatize this step, we are working on a mobile application that will enable the patient to monitor his cardiac rhythm and automatically collect it for storage in the cloud. Depending on each cloud service’s display options, it will be possible to view the signal in 2500, 5000, and up to 10,000 data segments. Finally, if the file will undergo any post-processing, the files should be downloaded and used independently of the cloud visualization.

3. Results

3.1. Capacity of Online Platforms to Support Long-Term Recording Files

The results obtained concerning the performance of the platforms for storing and viewing information were as follows. Three platforms were considered not helpful for storing long-term records. These were: Thingspeak, which allows storing 259,200 and visualizing 8000 points. This corresponds only to 12 min of recording with a sampling frequency of 360 Hz. The same results were obtained with Zoho and Google DataStudio platforms since they only allow storing files with a maximum size of 100 MB or 1,000,000,000 data elements, equivalent to 45 min of ECG recording. On the other hand, the platforms shown in Table 3 complied for uploading, viewing, and downloading files of 1, 2, 12, 24, 36 h of ECG recording.
Another aspect evaluated in the platforms was the size of the files. Due to the large volume of data, the file size was recognized as a problem on some evaluated platforms.

3.2. Uploading and Downloading Files to the Cloud

File upload times corresponding to the 1, 2, 12, 12, 24, and 36 h ECG were evaluated to provide performance characteristics to select the best cloud option from the platforms shown in Table 4. This test was performed on each cloud services platform, and 25 times for each file, although in some cases the volume of data was not supported (see Table 4). Another error that arose was that some of the cloud services did not allow downloading the data, permitting only to work them online. Zoho and Data studio allow uploading files of 1 h, but viewing and downloading files with a vector of ECG data larger than 1,000,000 elements, or files with a size of 100 MB, freezes the viewing interface, making it impossible to analyze the ECG signal. Power BI allows uploading files up to 36 h of ECG without difficulty, but their service does not have an option to download the datasets; they can only be worked on in their interface. AWS allows uploading all files and is the fastest for uploading, but when downloading data, it only allows downloading in packets of 1,000,000 elements, downloading all the ECG files in this fashion; it takes about 35 s for each data packet. Finally, Tableau, although not the fastest option for uploading files to the cloud, is the only platform that allows downloading in a single file the entire data set of the ECG record, with relatively short download times, which suggests an improvement in the tedious process of data and file management in the current healthcare system

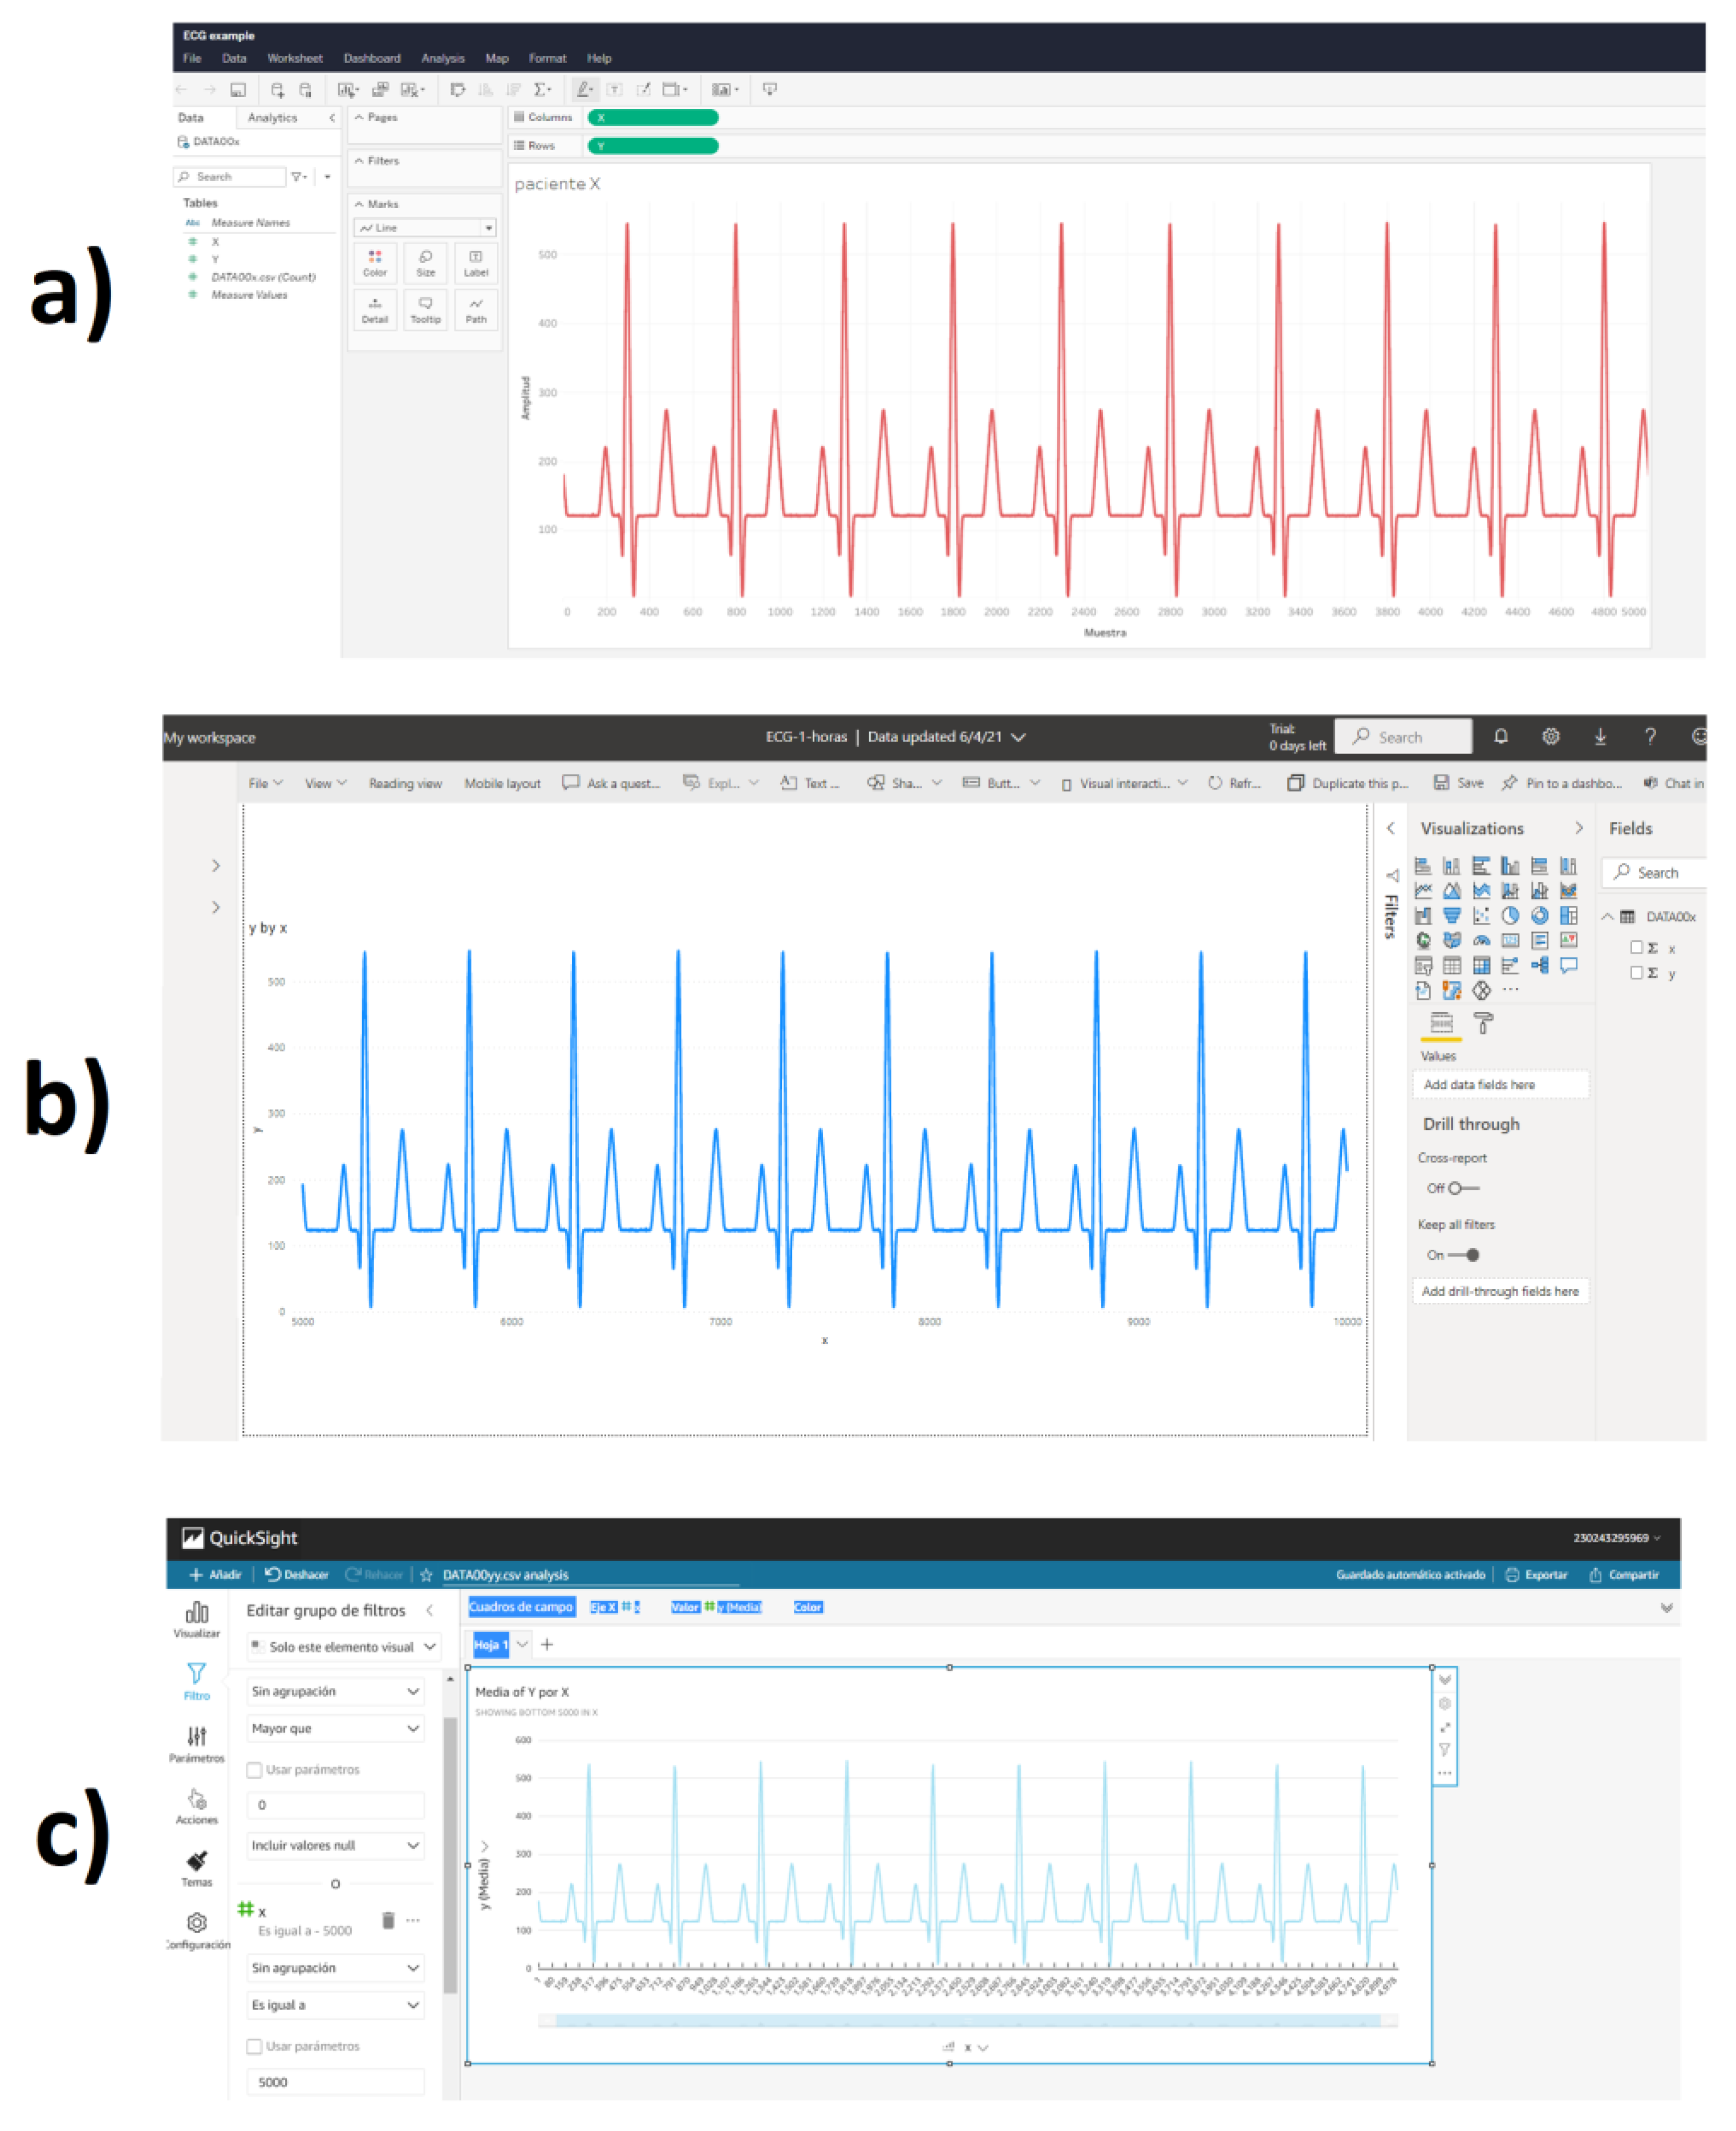
3.3. Data Visualization in the Cloud

The last aspect of interest regarding the cloud is the visualization of ECG records. From the options evaluated, only three platforms were identified that allowed 36-h ECG records to be saved and visualized. These included Tableau, Power BI, and QuickSight. Figure 2a shows the Tableau platform; it is one of the complete tools since it has a user-friendly interface, user support, and unlimited log storage when contracting the service. The annual cost is 70 USD. Figure 2b shows the Power BI platform; it presents a more complex interface than Tableau and QuickSight. So, it might not be as suitable for a patient. However, the platform allows the storage and display of long-term signals.
Furthermore, power BI has a limited free-of-charge service, and the service with the cost is 9.90 USD. Finally, Figure 2c shows the interface of the AWS platform, which in turn has a QuickSight extension; its cost is a moderate 21 USD. This platform allows displaying a signal in detail, its processing time is low, and it is another good option to visualize and share your ECG recordings remotely. The three platforms show in detail the ECG signal, allow the user to zoom/search in on the signal, and display it in sections of 5000 points to complete the length of the record. We recommend Tableau because it is a complete alternative that allows you to download files from the cloud and modify the vertical scale on the graph, which is useful to visualize the noise in the baseline in the ECG signal and motion artifacts. Unlike the other platforms, it allows you to graph all the data or choose through filters to show a portion of these. Some limitations were found, such as not being able to combine 2 ECG signals on the same graph. Another limitation was that the free version does not have a scrolling function on the horizontal axis, but in the full version, it can be developed in the visualization interface.

3.4. Error Detection in Long-Term ECG Files

This stage of experimentation consists of data validation with MATLAB software using files downloaded from the Tableau cloud platform. Only this platform was used because it is the only one that allows downloading the complete records. The original files were uploaded to the cloud, and once they were hosted on the Internet servers, they were downloaded to verify that there were no modifications or loss of data in the files once processed by the cloud. Once the files were downloaded, the vectors were used in the MATLAB software to subtract the signals, and the result was “0”, so we can conclude that these files were not modified in the number of data or signal amplitude (about 150 times).

4. Discussions and Conclusions

The interest in the technology miniaturization of portable medical equipment, such as the AFE AD8232 microchip, which is intended for ECG monitoring, the interface to visualize the data has concentrated on displaying the ECG signal in real-time or saving traces of short duration from 30 s to 15 min [8,9,10,11] but this is insufficient to carry out long-term monitoring. Recently, there has been a growing interest in integrating it into cloud services to access patient records remotely and facilitate access and information flow with the health sector. For instance, in [12] an ECG device based on the AD8232 microchip with BLE communication and an interface to upload the data to a server through a smartphone is presented, but the focus of this work is aimed at testing the prototype and functionality. In [13] a smart home environment is proposed using the cloud for monitoring vital signs and monitoring for older adults but it is focused more on the heart rate, location, respiration and uses innovative tools, but is not focused on the electrocardiographic signal for a long time. In [14] a mobile cloud tool with functionalities for abnormal heartbeat detection is proposed. However, they do not propose a complete solution that includes the interface with the ECG sensor; it is only focused on the evaluation of its algorithms in the cloud. In this work, some free cloud platforms were initially evaluated for storage and visualization services, by simply validation of ECG signal recordings in file length, signal recovered, and plotting capabilities. It is known that more future work is necessary to explore for autonomy and movement of the users of wearable medical devices. The interest for this paper is in the compatibility of portable medical devices with commercial cloud platforms for remote signal storage and visualization. One of the challenges faced during this stage was the amount of data stored in long-time ECG recordings. Existing platforms are generally limited to small file sizes of less than 1,000,000 lines or 100 MB, which in terms of ECG recordings at a sampling rate of 360 Hz would be approximately 45 min of a recording being insufficient with the existing need for extended time monitoring the electrocardiographic signal. There are few cloud platforms or services that are capable of 24 h or longer ECG recordings. The easy way to solve this problem is online platforms with a capacity for large volumes of data that does not saturate when uploading large files, but there are more issues related to the display of data and information remotely for patients and healthcare personnel, not only for electrocardiography recordings but also capacity for other studies and complete patient health monitoring. Engineers and scientists developing cloud applications to allow health care specialists to provide early care. A limitation of this work is that part of the signal processing is done offline before uploading to cloud platforms. As future work, it is planned to make a software component that connects the device with cloud services.

Author Contributions

Conceptualization and methodology, D.C.-G., J.P.G.-V. and M.B.-Z.; hardware, software, and validation, D.C.-G. and M.B.-Z.; writing—original draft preparation, writing—review and editing, J.P.G.-V., D.C.-G. and M.B.-Z.; and final paper review, M.A.R., J.A.A.-G. and R.L.-A. All authors have read and agreed to the published version of the manuscript.

Funding

This research was funded by Consejo Nacional de Ciencia y Tecnología (CONACyT) D.C.-G. Scholar fellowship CVU: 763230.

Institutional Review Board Statement

Not applicable.

Acknowledgments

The authors thank CONACyT for the scholar fellowship of the authors D.C.-G.

Conflicts of Interest

The authors declare no conflict of interest.

References

  1. Kohno, R.; Abe, H.; Benditt, D.G. Ambulatory electrocardiogram monitoring devices for evaluating transient loss of consciousness or other related symptoms. J. Arrhythm. 2017, 33, 583–589. [Google Scholar] [CrossRef] [PubMed] [Green Version]
  2. Murali, S.; Brugger, N.; Rincon, F.; Mashru, M.; Cook, S.; Goy, J.J. Cardiac Ambulatory Monitoring: New Wireless Device Validated Against Conventional Holter Monitoring in a Case Series. Front. Cardiovasc. Med. 2020, 7, 587945. [Google Scholar] [CrossRef] [PubMed]
  3. Vanegas-Cadavid, D.I. Uso del monitor cardíaco implantable en fibrilación auricular. Rev. Colomb. Cardiol. 2016, 23, 34–39. [Google Scholar] [CrossRef] [Green Version]
  4. Kowey, P.R.; Kocovic, D.Z. Ambulatory electrocardiographic recording. Circulation 2003, 108, e31–e33. [Google Scholar] [CrossRef] [PubMed] [Green Version]
  5. Cuevas-González, D.; Bravo-Zanoguera, M.; Altamira-Colado, E.; López-Avitia, R.; García-Vázquez, J.P.; Reyna, M.A. Coping with Motion Artifacts by Analog Front-End ECG Microchips under Variable Digital Resolution and Gain. Eng. Proc. 2020, 2, 12. [Google Scholar] [CrossRef]
  6. Bravo-Zanoguera, M.; Cuevas-González, D.; Reyna, M.A.; García-Vázquez, J.P.; Avitia, R.L. Fabricating a Portable ECG Device Using AD823X Analog Front-End Microchips and Open-Source Development Validation. Sensors 2020, 20, 5962. [Google Scholar] [CrossRef] [PubMed]
  7. Ambardar, A. Analog and Digital Signal Processing; PWS: Boston, MA, USA, 1995; p. 700. [Google Scholar]
  8. IWATCH Apple [En Línea]. Available online: https://support.apple.com/es-mx/HT208955 (accessed on 15 October 2021).
  9. Alivecor Kardia Mobile [En Línea]. Available online: https://www.alivecor.com/previous-labeling/kardiamobile/00LB17.1.pdf (accessed on 15 October 2021).
  10. Cardiosecur [En Línea]. Available online: https://www.cardiosecur.com/product/ecg-device-for-smartphones-mobile-ecg (accessed on 15 October 2021).
  11. Qardiocore [En Línea]. Available online: https://www.getqardio.com/qardiocore-wearable-ecg-ekg-monitor-iphone/ (accessed on 15 October 2021).
  12. Sun, F.; Yi, C.; Li, W.; Li, Y. A wearable H-shirt for exercise ECG monitoring and individual lactate threshold computing. Comput. Ind. 2017, 92, 1–11. [Google Scholar] [CrossRef]
  13. Pham, M.; Mengistu, Y.; Do, H.; Sheng, W. Delivering home healthcare through a Cloud-based Smart Home Environment (CoSHE). Future Gener. Comput. Syst. 2018, 81, 129–140. [Google Scholar] [CrossRef]
  14. Venkatesan, C.; Karthigaikumar, P.; Satheeskumaran, S. Mobile cloud computing for ECG telemonitoring and real-time coronary heart disease risk detection. Biomed. Signal Process. Control 2018, 44, 138–145. [Google Scholar] [CrossRef]
Figure 1. Block diagram of device operation and attachment of a file to the cloud. (1) Synthetic signal generation, (2) Recording of the signal on internal microSD, (3) Upload file from microSD using PC to cloud, (4) Download file from the cloud to PC remotely for external use file.
Engproc 10 00057 g001
Figure 2. Visualization of 36-h ECG recordings in cloud services (a) Tableau cloud visualization, (b) Power BI cloud visualization, (c) AWS cloud visualization.
Engproc 10 00057 g002
Table 1. Size of ECG files according to their duration.
NameSize of File
1 h 21.2 MB
2 h 43.6 MB
12 h 276 MB
24 h 563 MB
36 h 851 MB
Table 2. Platforms that support ECG recordings.
NameFile FormatCost (USD)Can Upload and Visualization Files >24 h
ThingSpeak.csv0.00No
Tableau.csv/.txt70Yes
Power BI.csv/.txt0.00/9.9Yes
Datastudio Google.csv/.txt0.00No
Zoho.csv/.txt0.00No
AWS.csv/.txt21Yes
Table 3. Large files supported by cloud services platforms for viewing and storage without errors.
Name1 h ECG2 h ECG12 h ECG24 h ECG36 h ECG
ThingSpeak
Tableau
Power BI
Datastudio Google
Zoho
AWS
Note: ✗ means that an upload/download error occurred making it impossible to save, download or view the ECG record. ✓ means that the platform upload/download the file successfully.
Table 4. Time to upload/download files to cloud service.
Name 1 h ECG 2 h ECG 12 h ECG 24 h ECG 36 h ECG
Upload
(s)
Download
(s)
Upload
(s)
Download
(s)
Upload
(s)
Download
(s)
Upload
(s)
Download
(s)
Upload
(s)
Download
(s)
ThingSpeak
Tableau 11.92 2.53 22.05 27.16 153.91 157.89 307.42 321.08 419.85 495
Power BI 4.42 7.58 41.49 86.95 118.95
Datastudio Google 20.82
Zoho 23.13
AWS 3.87 5.43 31.32 82.42 135.81
Note: ✗ means that an upload/download error occurred making it impossible to save, download or view the ECG record.
Publisher’s Note: MDPI stays neutral with regard to jurisdictional claims in published maps and institutional affiliations.

