Proceeding Paper

Evaluating Suitability of a DS18B20 Temperature Sensor for Use in an Accurate Air Temperature Distribution Measurement Network †

by
Ali Elyounsi
and
Alexander N. Kalashnikov
*
Department of Engineering and Mathematics, Sheffield Hallam University, Sheffield S1 1WB, UK
*
Author to whom correspondence should be addressed.
Presented at 8th International Electronic Conference on Sensors and Applications, 1–15 November 2021; Available online: https://ecsa-8.sciforum.net.
Eng. Proc. 2021, 10(1), 56; https://doi.org/10.3390/ecsa-8-11277
Published: 1 November 2021

Abstract

:
We analysed literature data and our experimental results to determine why the readings of different temperature sensors might be notably different in air despite being placed in close proximity. We attributed these differences to two factors—unrestricted air movements and differences in the sensors’ response times. After elimination of these factors, the temperature readings of Pt100 and DS18B20 sensors exhibited an excellent agreement which, together with the convenient networking features provided by the DS18B20 sensors, confirmed their suitability for our use case.

1. Introduction

Temperature sensors are used for a wide variety of industrial, scientific, medical and domestic purposes, and they differ by design and/or operating principles to better suit their given application. The global market size for these sensors was estimated at USD 6.3 billion in 2020 with a projected annual growth of 4.8% to 2027 [1]. For many applications, using a single temperature sensor is sufficient, but sometimes a group of sensors is required to optimise, for example, the design of a refrigerator [2] or room ventilation [3]. We came across the need to develop an accurate air temperature distribution measurement network in order to verify the operation of an ultrasonic oscillating temperature sensor (UOTS) that we are developing to measure aggregate temperatures in dwellings. When selecting a reference sensor, we considered suitability, reliability of readings, convenience for networking and cost of various conventional temperature sensors.

1.1. Suitability

Infrared sensors are not directly applicable to air temperature measurement. On the other hand, combinational temperature and humidity (and sometimes pressure) sensors, which are unsuitable for measuring temperatures of solids and liquids, were designed primarily for measurement in air and should be considered alongside temperature-only sensors.

1.2. Cost Considerations for Common Contact Temperature Sensors

Resistance temperature detectors (RTDs) are popular in industrial thermometers, which are built using either Pt100 or Pt1000 platinum RTDs. These sensors are expensive and require a separate electronic driver for each RTD as well as dedicated networking. Thermistors are the least expensive on their own but require individual calibration for accurate measurement. Thermocouples are not expensive on their own but require so-called cold junction compensation and feature quite low sensitivity for the resolutive measurement of room temperatures. These drawbacks confine their uses to extreme temperatures only. Integrated circuit temperature sensors, at a medium price point, typically contain appropriate electronic digitising circuitry and provide a standardised interface. A non-exhaustive list of such sensors on Wikipedia mentions 37 sensors from five manufacturers [4], but there are many more manufacturers offering these sensors (Silicon Labs, TE Connectivity and Bosh, among other well-established brands). As different sensors provide various features (for example, combinational sensors are becoming increasingly common) and target different market segments, their price point ranges between USD 0.5 and 10.

1.3. Reliability of Air Temperature Measurement

The accuracy of temperature sensors after manufacture is specified by their vendors; variation might range from as low as ±0.25 °C up to ±2 °C [4]. A study on thermistors found that their accuracy deteriorated very little over time [5], and this should hold for both RTDs and integrated circuit temperature sensors that have been manufactured from materials of high purity. However, making room temperature measurements that are accurate to 1 °C could be complicated by the fact that the same thermometer, placed at different heights in the same room, could report temperature differences well in excess of the above-mentioned amount of 1 °C [6]. Moreover, a detailed quantitative experimental study of temperatures at seven different places in a simulated office environment (four different climate modes) showed that placing different commercial thermometers in the same location could result in temperature differences of 1 °C despite the consistent environment. Additionally, the same thermometer’s readings could vary by up to 2 °C at different room locations for the same stationary conditions (that the authors refer to as climate modes) [3].
Another important consideration relates to the sensor’s response time, i.e., the time it takes sensor readings to reach a certain level when reacting on a step temperature change. For example, a manufacturer of electronic thermometers put four types of sensors in an oven simultaneously, and the recorded data showed a difference between the most and least responsive of up to 25 °C [7]. Differences in readings of similar magnitude were observed by O. Liutyi, who constructed a board equipped with over 60 combinational temperature and humidity sensors, transferred it from a room environment into a freezer and shared the resulting data on his blog (Test 10 v5 board in Freezer [8]). His data show that it took from 6 to 10 min for different sensors to reach a reading of −15 °C from the initial reading of over 25 °C, and the difference between sensors’ readings could be up to 15 °C.
Two other notable studies that recorded readings from different sensors placed in close proximity reported differences of up to 2 °C [9,10]. Much better agreement among readings was observed by experimenters who placed the sensors in a confined space, either in a cardboard box [11], in a glass jar with a cap [12] or simply under a plastic bottle cap [13].

1.4. Sensor Networking

The networking of sensors with analogue output, such as thermistors, thermocouples and some integrated circuit sensors, is complicated by the need to provide electronics for signal conditioning and filtering, analogue-to-digital conversion and a standardised interface close to each sensor. There are some off-the-shelf solutions available, but they typically cost hundreds of dollars. Integrated circuits have all these circuits built in and thus seem preferable.
An air temperature distribution measurement network requires many sensors with the same part number to ensure that all of the readings correspond. Unfortunately, most integrated circuit temperature sensors feature an interface that is most convenient for a single data sink, such as a microcontroller. In particular, inter-integrated circuit (IIC or I2C) sensors are supplied with the same bus address, which mandates the use of additional I2C multiplexers if more than one sensor is used. Serial peripheral interface (SPI) sensors require at least four wires for a single sensor; this number is either increased by one wire for each additional sensor (chip select wire) or the communication speed is reduced by the factor equal to the number of the sensors used (daisy chain configuration). We are aware of only two sensors that allow the connection of several sensors to the same bus. The I2C-enabled MCP9808 allows the use of up to eight sensors on the same bus, and restrictions on the multiple DS18B20 on the same bus relate primarily to the wire lengths and not their number. These parts should be considered if ease of sensor wiring is a primary concern.
Other important networking considerations should include, but are not limited to, the sensor’s measurement time, which limits the rate at which the measured temperature can be sampled, and the data communication rate (the faster, the better). For example, each sensor of the 68 on O. Liutyi’s network could be sampled only every 16–17 s to allow readings of all the other sensors [8]. This may not be fast enough for some use cases. Finally, it might be important to start the temperature conversion at exactly the same time for all the networked sensors, even if reading the conversion results takes considerable time; this feature seems to be available only for the DS18B20 sensors.

1.5. Apparent Temperature

It is important to note that the measured temperature value could differ from human-felt temperature (also known as apparent temperature), as the latter is subjective to wind chill, humidity (heat index) and presence of direct sunlight (wet bulb globe temperature).

1.6. Reporter’s Liability

Sensor manufacturers do not like comparisons of their products with those of their competitors, as only one product comes out on top. To avoid their displeasure (or even potential legal issues), either any references to particular products are removed from the experiment’s description (e.g., branding of thermometers in photographs [3]), products from only one manufacturer are compared [7], or the data are presented with the details of how they were obtained but without a definitive judgement [9,10,12,13]. The latter approach was taken for this study, allowing the reader to draw their own conclusion according to their use case.
In this paper, we report the results of two sets of experiments. These were conducted with two uncalibrated temperature sensors and without the use of a reference thermometer. One experiment involved recording the readings of the Pt100 RTD and the DS18B20 integrated circuit sensor to cloud storage for several months. The Pt100 RTD was selected due to its proliferation in industry, whilst the DS18B20 was selected due to its advantages for networking and our prior positive experiences with them [14]. The other experiment utilised two I2C combinational sensors (BMP280 and AHT20) that were attached to an unbranded board that provided good thermal contact between them.

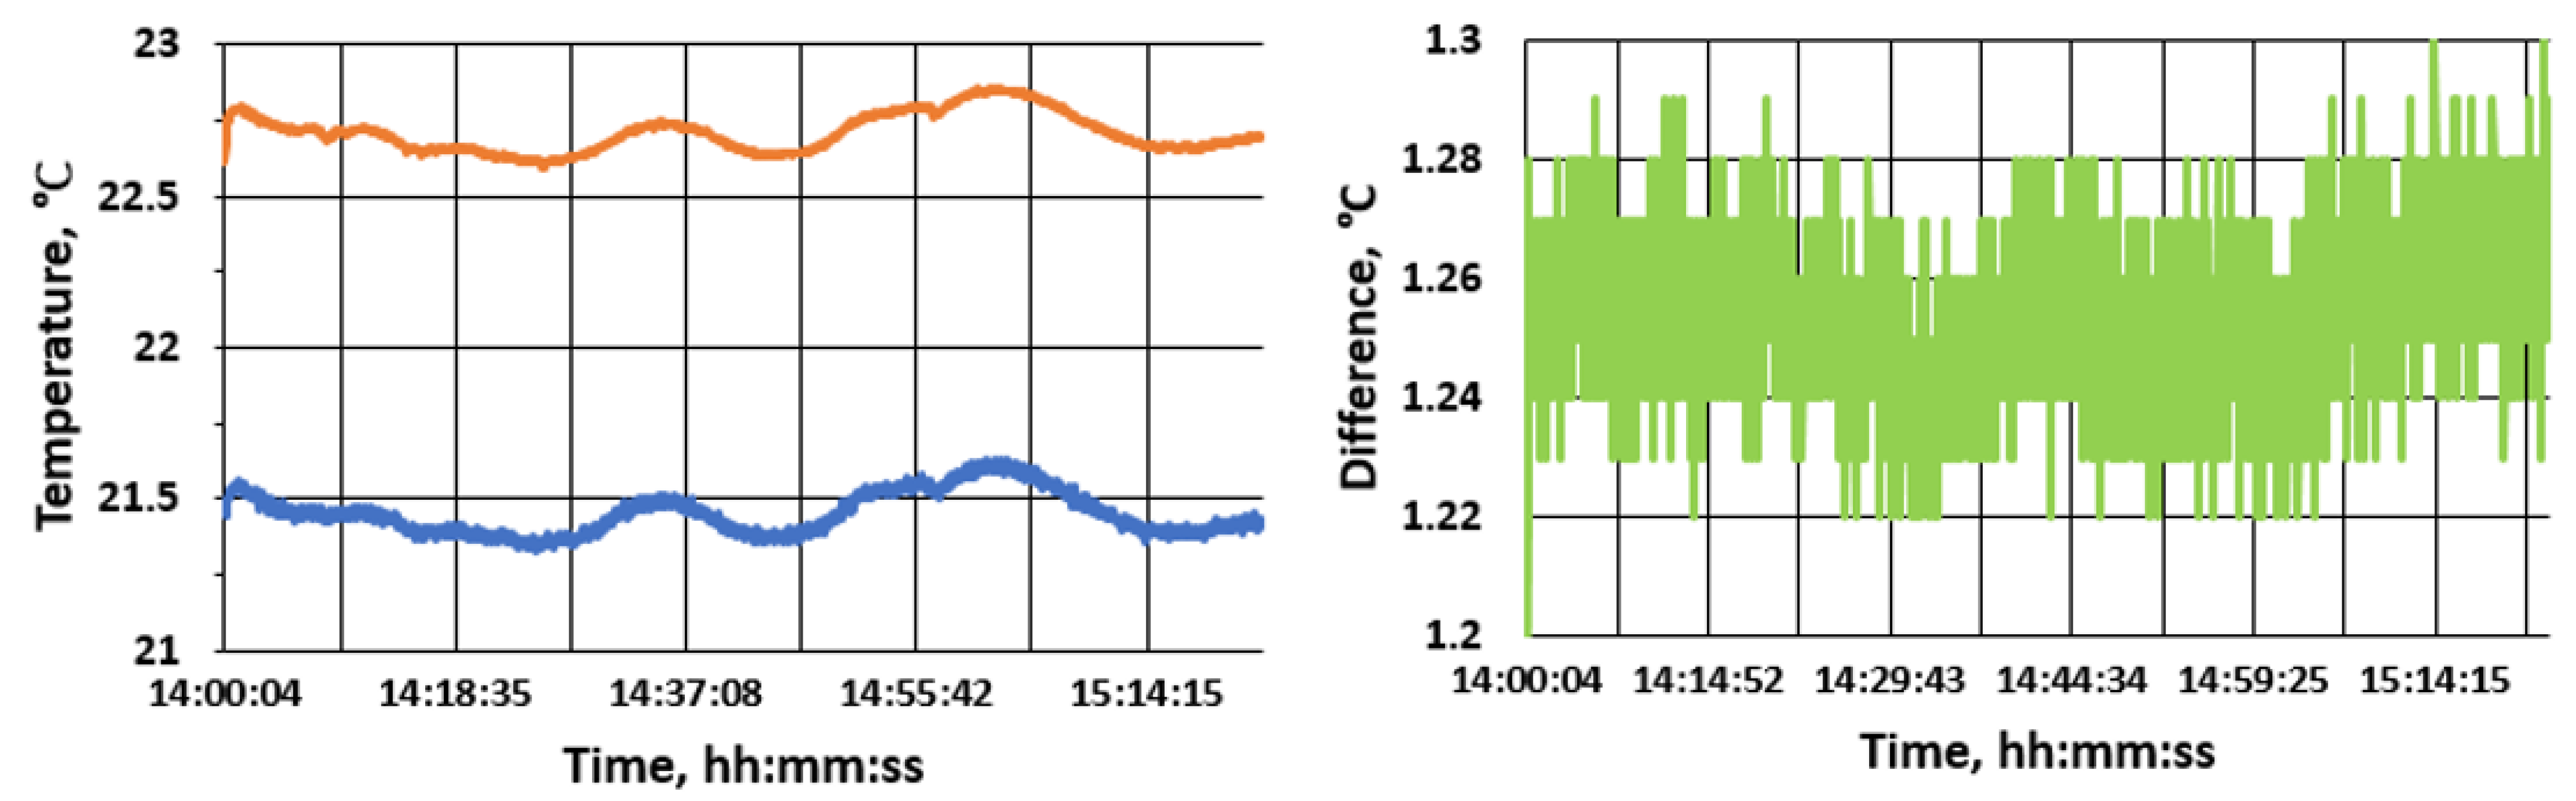
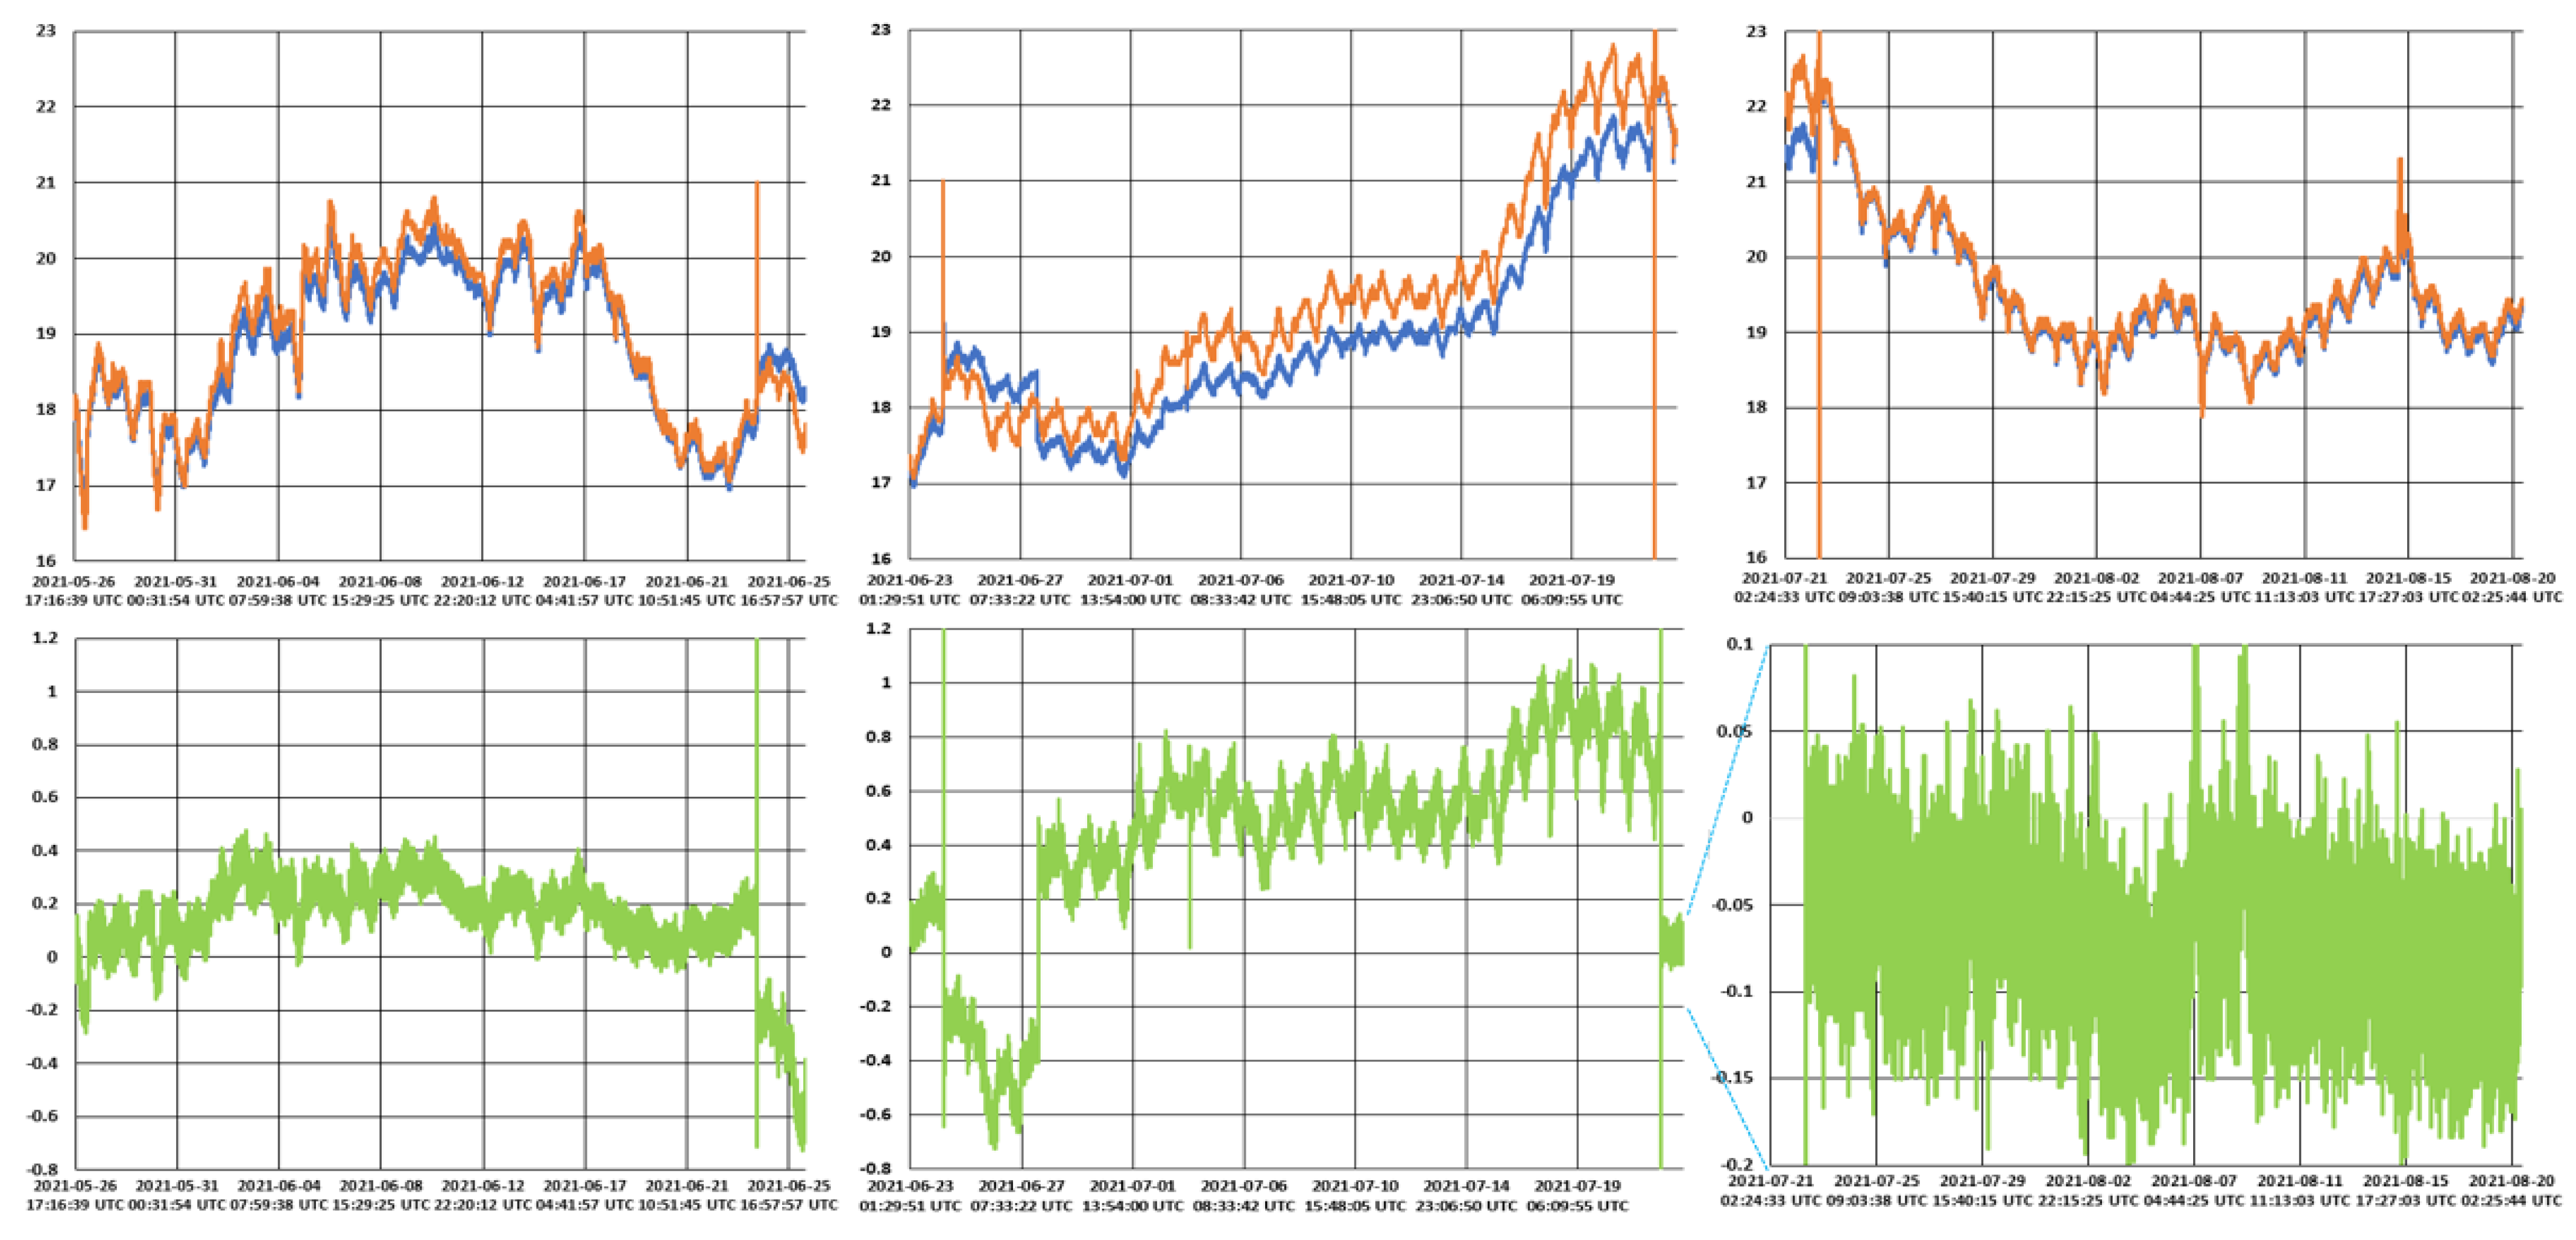
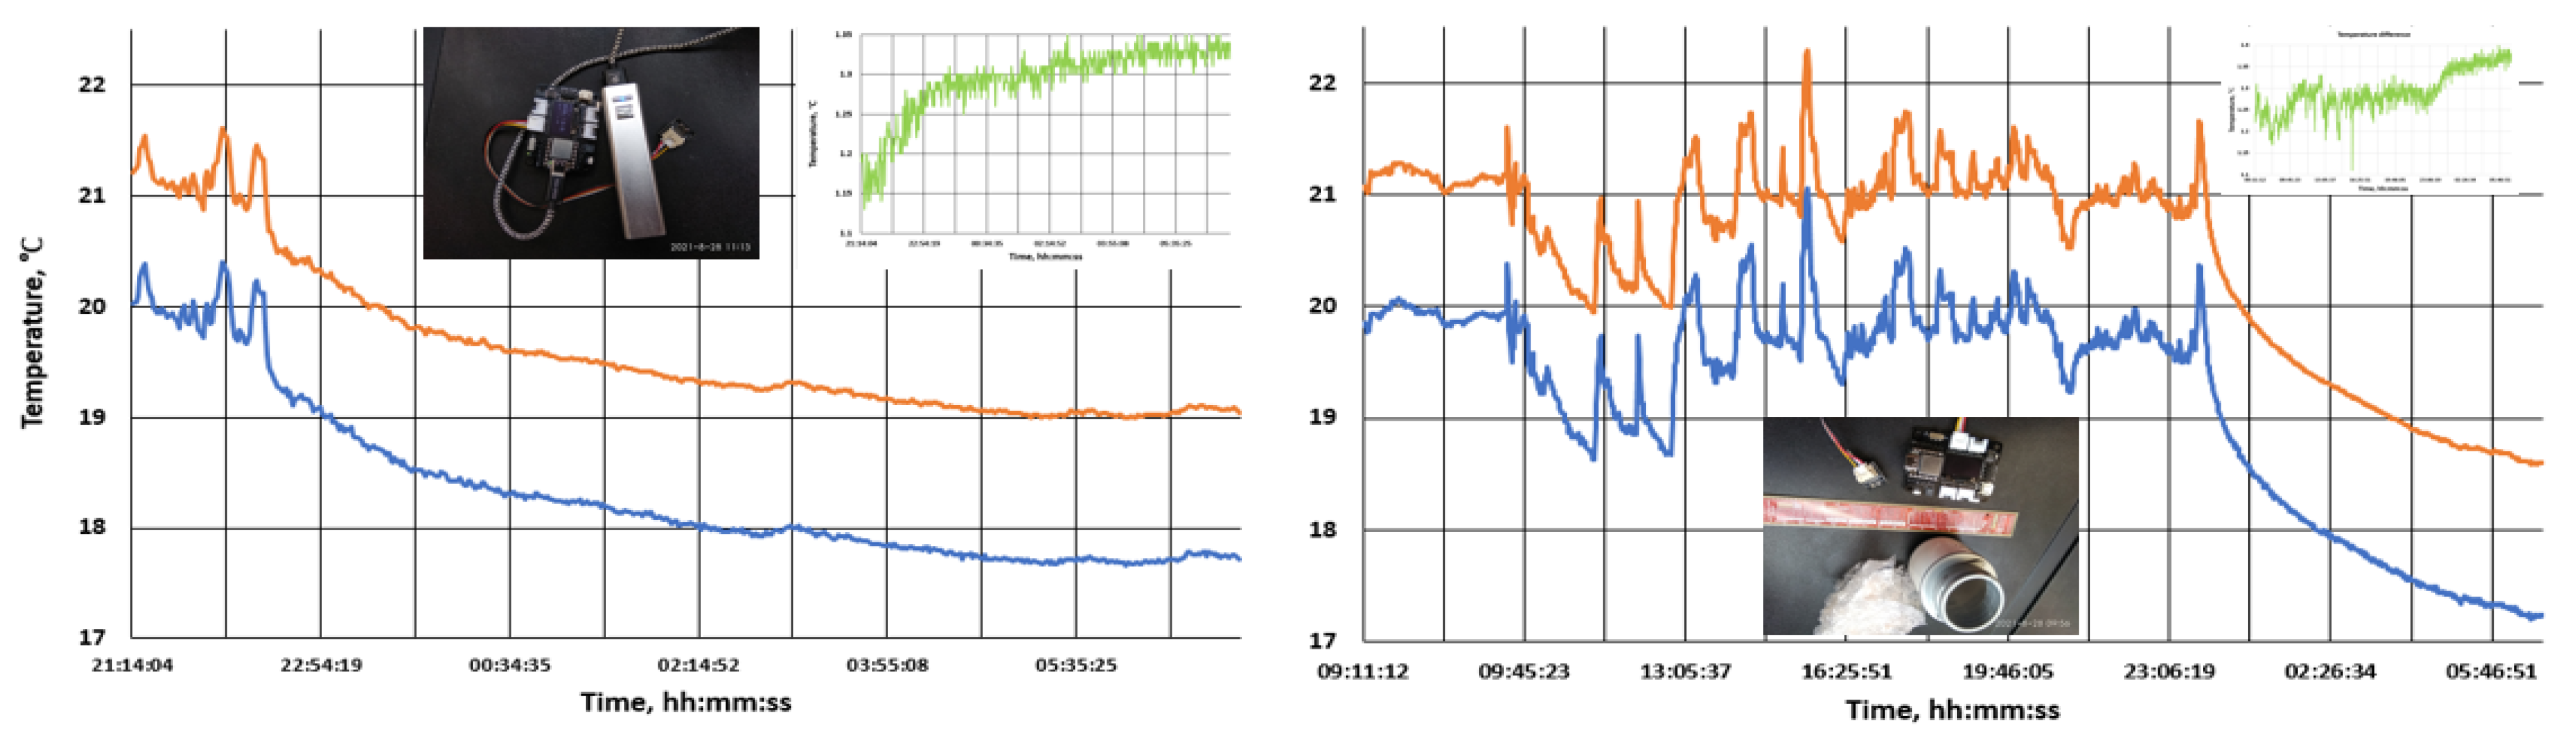
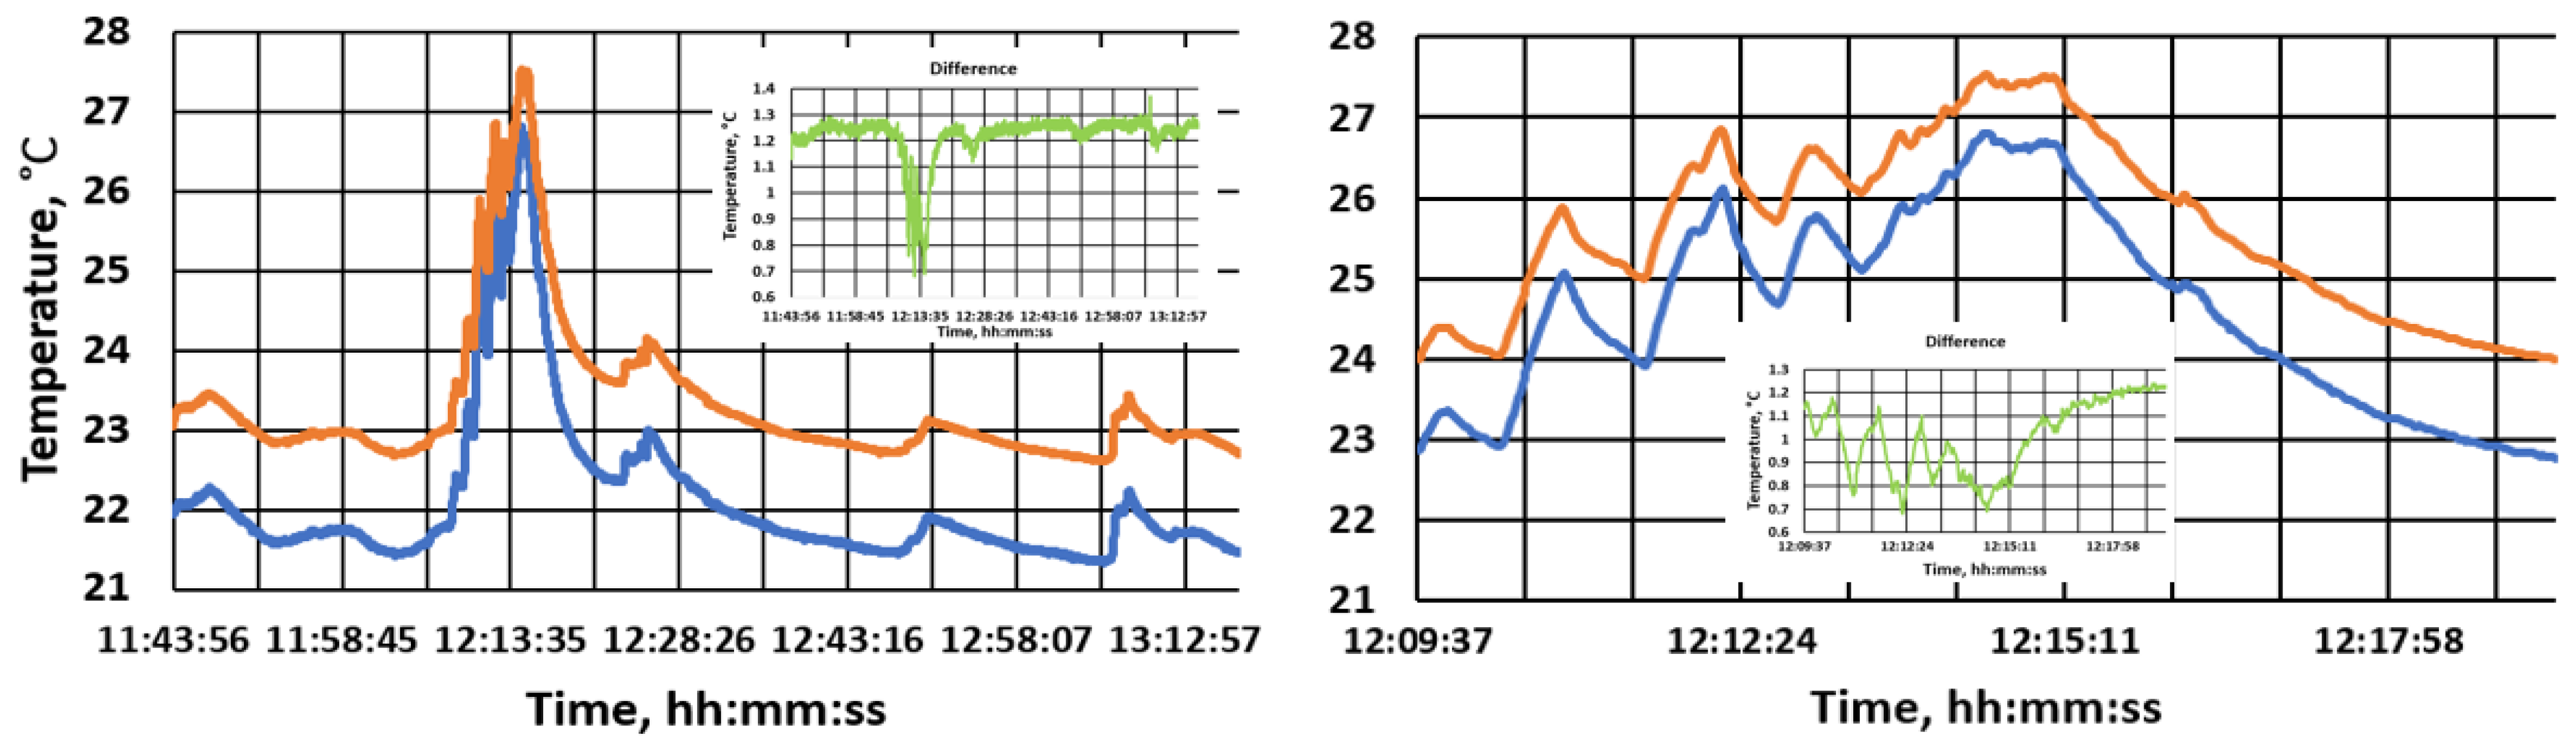
2. Simultaneous Temperature Measurement Using Pt100 and DS18B20 Air-Gapped Sensors

We used an experimental setup, relevant firmware and cloud storage procedures that are detailed elsewhere [15]. Both sensors were placed at the bottom of a 170 mm × 95 mm × 110 mm (length × width × height) cardboard box and covered by air bubble packaging. The box was kept on the ground floor, away from the window and direct sunlight. From time to time, the sensors were moved closer to each other and/or covered by an additional layer in order to make their readings be in better agreement. Figure 1 presents the experimental readings, which were collected approximately every 18 s for about three months, along with the calculated differences.
Despite the measures taken to ensure that the sensors responded to the same air temperature, both a notable bias of up to 0.5 °C and scatter of up to ±0.2 °C were observed for over two months. These results were concerning, as we expected the sensor readings to be biased but to generally follow each other, as occurred in our experiments with DS18B20 sensors in water [14]. However, we were unable to identify a single bias for the recorded dataset and the resulting scatter, although within the DS18B20 specifications was too high for our liking. This changed for the better when the sensors were placed inside the same plastic bag on 22 July 2021. The subsequent readings showed excellent agreement with an average bias of only 0.05 °C and most scatter within ±0.08 °C. The final part of this experiment gave us confidence in the accuracy of the DS18B20 sensors for measuring at least quasi-stationary air temperatures. This, coupled with their convenience for networking, determined their selection for our use case (verification of UOTSs).

3. Simultaneous Air Temperature Measurement Using AHT20 and BMP280 Sensors Mounted on the Same Board

We used the sensor board along with Seeeduino Xiao Arduino-compatible microcontroller module [16], which was attached to an expansion board with an OLED display, real-time clock and SD card.
The first set of experiments was conducted by placing the setup on a computer table that was manned until around 22:00, after which the room was vacated until the next morning. On the first occasion, the setup’s operation was unchanged, but on the second, the sensor board was placed inside a plastic tube and covered by air bubble packaging material when the room was vacated. The recorded readings, along with the calculated difference and relevant photographs, are presented in Figure 2.
The results show that one of the sensors gave consistently higher readings, with the variable bias in the region of 1.25 °C (a similar bias was observed by some other experimenters [11,12]). The nearby presence of a human and a working computer led to spontaneous fluctuations of up to 1 °C that were not observed at night, when fluctuations were within 0.1°C. These were reduced further when the sensor board was placed in a plastic container.
The second experiment was conducted by placing the board on a windowsill, where it caught occasional sunrays through the garden bushes. The sunrays, when present, heated up the board rather quickly and reduced the above-mentioned bias down to 0.7 °C at times, as shown in Figure 3.
We assume that this reduction was due to the faster response time of the sensor with lower readings—the other sensor readings simply lagged behind.
For the third experiment, the setup was placed inside a long cardboard box in which air movements were severely restricted. Under these conditions, the recordings of both sensors changed very little (±0.1 °C) over the course of 80 min and rigorously followed each other. The calculated bias was very stable with a scatter of around ±0.02 °C (Figure 4).
These results show that in the absence of air movements and with a quasi-stationary temperature, good thermal contact between different temperature sensors and bias correction, the sensors can produce nearly the same readings. Similar agreement among three different temperature sensors’ readings was obtained in a confined chamber with forced air circulation. Application of the best fit linear regression resulted in relative squared residual (R2) values in excess of 0.999 for the 25–75 °C temperature interval [17].

4. Conclusions

The results reported in the literature and in this paper led to the following conclusions for air temperature measurement:
  • Absolute accuracy might be tricky to achieve, but relative measurements can be quite consistent if the sensors are placed inside a common enclosure with a limited air volume. Under these conditions, the readings of different sensors might stay much closer than can be expected from the relevant manufacturers’ specifications; the biases among sensors, if present, can be eliminated with the subsequent processing.
  • If the air movements are not restricted, even closely placed sensors can report notably different data.
  • Substantial differences in sensor readings can be observed if the temperature changes quickly. This occurs due to the differences in the sensors’ response times.
  • The advantages of the DS18B20 for temperature field measurement include using only three wires for a large number of sensors and the availability of the “start of measurements” broadcast command.

Author Contributions

A.E. and A.N.K. contributed to this paper equally. All authors have read and agreed to the published version of the manuscript.

Funding

This research received no external funding.

Institutional Review Board Statement

Not applicable.

Conflicts of Interest

The authors declare no conflict of interests.

References

  1. Temperature Sensor Market by Product Type (Thermocouples, RTDs, Thermistors, Temperature Sensor ICs, Bimetallic, Infrared, and Fiber Optic Temperature Sensors), Output, End-User Industry, and Region–Global Forecast to 2027. MarketsandMarkets, Online Summary. March 2020. Available online: https://www.marketsandmarkets.com/Market-Reports/temperature-sensor-market-522.html (accessed on 10 January 2022).
  2. Hints for Selecting the Correct Temperature Sensors for Your Application; Measurement Tips; Agilent Technologies: Santa Clara, CA, USA, 2008; Volume 1, 4p.
  3. Shinoda, J.; Mylonas, A.; Kazanci, O.B.; Tanabe, S.; Olesen, B.W. Differences in temperature measurement by commercial room temperature sensors: Effects of room cooling system, loads, sensor type and position. Energy Build. 2021, 231, 110630. [Google Scholar] [CrossRef]
  4. List of Temperature Sensors. Available online: https://en.wikipedia.org/wiki/List_of_temperature_sensors (accessed on 10 January 2022).
  5. Lawton, K.M.; Patterson, S.R. Long-term relative stability of thermistors. Precis. Eng. 2001, 25, 24–28. [Google Scholar] [CrossRef]
  6. Pico Technology. Improving the Accuracy of Temperature Measurements. Application Note. Available online: https://www.picotech.com/library/application-note/improving-the-accuracy-of-temperature-measurements (accessed on 10 January 2022).
  7. How to Choose a Temperature Sensor, Yoctopuce. Blog Post. 24 May 2019. Available online: https://www.yoctopuce.com/EN/article/how-to-choose-a-temperature-sensor (accessed on 10 January 2022).
  8. Liutyi, O. Test i2c Humidity Sensors: V5 Sensors Board. Available online: https://wiki.liutyi.info/display/ARDUINO/v5+Sensors+Board+project (accessed on 10 January 2022).
  9. Konstantinos, I.; Dimitrios, E.; Kleanthis, X. A comparative analysis among three commercial temperature sensors. In Proceedings of the 8th International Conference on Information and Communication Technologies in Agriculture, Food and Environment (HAICTA 2017), Chania, Greece, 21–24 September 2017; pp. 824–2030. Available online: http://ceur-ws.org/Vol-2030/HAICTA_2017_paper93.pdf (accessed on 10 January 2022).
  10. DHT11 vs. DHT22 vs. LM35 vs. DS18B20 vs. BME280 vs. BMP180, Random Nerd Tutorials. Available online: https://randomnerdtutorials.com/dht11-vs-dht22-vs-lm35-vs-ds18b20-vs-bme280-vs-bmp180/ (accessed on 10 January 2022).
  11. BME 280 Temp Offset/Self Heating, Adafruit’s Forum Discussion, Started November 2019. Available online: https://forums.adafruit.com/viewtopic.php?f=19&p=534525 (accessed on 10 January 2022).
  12. Smith, R. Wide Range of Hygrometers: DHT22, AM2302, AM2320, AM2321, SHT71, HTU21D, Si7021, BME280. Available online: https://www.kandrsmith.org/RJS/Misc/Hygrometers/calib_many.html (accessed on 10 January 2022).
  13. G6EJD–David, Tech Note 014–Accurate (Precision) Sensor Comparison, YoutTube Video 0:30–1:30. Available online: https://www.youtube.com/watch?v=rQQDi2_-x80 (accessed on 10 January 2022).
  14. Hashmi, A.; Kalashnikov, A.N. Sensor data fusion for responsive high resolution ultrasonic temperature measurement using piezoelectric transducers. Ultrasonics 2019, 99, 105969. [Google Scholar] [CrossRef]
  15. Elyounsi, A.; Kalashnikov, A.N. Using Internet services for low cost intelligent management of industrial process equipment. In Proceedings of the International Scientific and Practical Conference “Information Control Systems & Technologies” (ICST-2021), Odessa, Ukraine, 23–25 September 2021. [Google Scholar]
  16. Xiao, S. Product Support Page. Available online: https://wiki.seeedstudio.com/Seeeduino-XIAO/ (accessed on 10 January 2022).
  17. Škultéty, E.; Pivarčiová, E.; Karrach, L. Comparing Selected Temperature Sensors Compatible with the Arduino Platform. Manag. Syst. Prod. Eng. 2018, 26, 168–171. [Google Scholar] [CrossRef] [Green Version]
Figure 1. Temperature readings of Pt100 and DS18B20 sensors over the course of three months.
Engproc 10 00056 g001
Figure 2. Recorded temperatures for the sensor board placed on a computer table on two occasions.
Engproc 10 00056 g002
Figure 3. Temperatures recorded by the sensor board on a windowsill.
Engproc 10 00056 g003
Figure 4. Temperatures recorded by the sensor board placed inside a long cardboard box.
Engproc 10 00056 g004
Publisher’s Note: MDPI stays neutral with regard to jurisdictional claims in published maps and institutional affiliations.

