Abstract
The noise caused by airports and its impact on human health, together with train, road traffic, leisure, and wind nose has been widely analyzed, even in the reports published in 2019 by the WHO. Noise effect has also been studied in the literature on other species, such as birds and amphibians. In this work, we focus on a natural environment of special singularity due to its location: the natural space of the Delta del Llobregat, next to the city of Barcelona. The Delta del Llobregat is placed in an area close to the Port of Barcelona, and directly on the route of the planes taking off from Barcelona airport. In this paper, we present a first analysis of the typology of the sounds found in the natural environment of the Delta del Llobregat after conducting a simultaneous recording campaign at three separate spots of biological interest, determined by the park’s curators. We identify the interfering sounds, as well as the amount of wildlife sounds in relation to the noises caused by the airport activity. The recordings and posterior analysis were made on 5 March 2021, when airport activity was still greatly diminished by the mobility restrictions. In addition, we apply machine learning techniques to classify the acoustic events produced by both airport activity and wildlife, aiming to build an automatic system that would allow us to gather labelled data in future works.
1. Introduction
The effect of aircraft noise on humans, among other noise polluters, has been widely studied and analyzed over the last few decades [1]. Fewer studies have analyzed the impact of those sounds on wildlife (e.g., birds or amphibians), and despite the well-known consequences that noise can have on animals, such as reproductive or long-term survival problems, there are still natural parks over-exposed to sounds produced by humans [2]. In this work, we aim to collect audio files and analyze the soundscape of the Delta del Llobregat natural park, which is a Protected Area (PA) located next to the city center of Barcelona. The selected location is surrounded by the Port of Barcelona and the Josep Tarradelles Barcelona-El Prat airport. Using acoustic data gathered at three spots of biological interest inside the natural park, we aim to train a machine learning model able to classify real-world acoustic events. Currently, without the help of automatic classification systems, expert biologists have to manually listen and annotate the presence, location, and behavior of animal species to be able to study wildlife patterns. In this sense, an automatic system would save them valuable time that they could invest in analyzing the already classified data.
Similar works have been conducted in other natural parks located close to noisy areas such as airports. For example, in [3], the overlap between natural areas and Brazilian airports is studied. Moreover, the legislation of different countries regarding the location of airports near protected areas are analyzed, and measures to mitigate the impact of aircraft to wildlife are proposed. Another example can be found in [2], where A.L. Radle focuses on the impact of noise to wildlife on different ecosystems (e.g., terrestrial wildlife, marine wildlife, or noise in national parks). Similarly, in [4], C. Iglesias-Merchan et al. evaluate the impact of aircraft noise in a protected area in the Central Mountains of Spain. Finally, in [5], mist-nets and sound automatic recording units are used to classify bird species near natural areas close to different Brazilian airports. They evaluate several biodiversity indexes and identify which bird species tend to avoid the airport (airport avoidant species) and which bird species adapt to the airport (airport adapter species).
The work presented in this paper exposes the results of a manually labeled recording campaign carried out in the Delta del Llobregat protected area. Concretely, three simultaneous recordings of 2 h of duration have resulted in acoustic events from 14 different categories, some of them produced by humans and some others produced by the environment wildlife. Then, the classification results of three different machine learning algorithms trained and tested over the collected dataset are compared. The reason to apply machine learning techniques over the recorded data comes from the idea that automatically classifying the acoustic events present on the soundscape of the selected location would allow us to automatically have more data that could be used to analyze, over time, the impact of the airport sound on the bird species inhabiting the protected area.
The remainder of this paper is organized as follows: first, Section 2 explains the methodology carried out to gather data in three different spots. Section 3 details the analysis conducted to the designed dataset after labeling it. Then, Section 4 reports the classification algorithms trained with our data and compares their results. Finally, Section 5 closes the paper and proposes some future work.
2. Airport Recording Campaign
Once the recording points were decided, and having requested prior permission from the consortium for protection and management of the natural spaces of the Delta del Llobregat, we planned a recording campaign for 5th of March 2021. At that date, due to the COVID-19 pandemic, take-offs and landings of flights were happening more or less with a frequency of a flight every 15 or 20 min.
The recording equipment required was: (i) tripod, (ii) Zoom H5 Recorder, (iii) pen and writing support, and (iv) data collection sheet (see Figure 1). The three recorders were synchronized with 3 hand claps. Later on, the three recorders were separated and placed at their final designed locations, and after finishing the recording setup, all the technicians started the annotations in the data collection sheets. At the end of the recordings, another synchronization was conducted, to be able to adjust the data stamp if the three clocks were not precisely synchronous. The three recordings lasted for 2 h, starting at 16:20 in the afternoon. The recording schedule was chosen taking into account (1) the opening schedule of the Natural Park and (2) that animals tend to produce more vocalizations at nightfall compared to other times of the day. The distance between the three chosen locations was around 500 m.
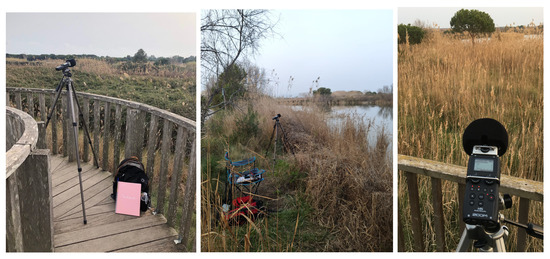
Figure 1.
Locations of the three recordings in Delta del Llobregat.
3. Data Analysis
After the recording campaign, an exhaustive analysis was conducted over the data. Firstly, a manual labeling process was carried out using Audacity (open-source software for audio and recordings treatment that can be downloaded for free at https://www.audacityteam.org/, accessed on 23 December 2021). The volume of the acoustic events detected is represented in Table 1.

Table 1.
Number of events for each of the categories of the labeled dataset.
Regarding the feature extraction process, the following parameters were obtained for each of the acoustic events: (1) Mel Frequency Cepstral Coefficients (MFCC), which represent the short-term power spectrum of a sound [6], (2) the Spectral Centroid, used in digital signal processing to characterize a spectrum, (3) the Spectral Roll-Off—the frequency below which a specified percentage of the total spectral energy lies—and (4) the Zero Crossing Rate—the rate at which a signal toggles from positive to negative or vice versa.
As shown in Figure 2, not all the categories have the same duration. Therefore, the average length of all the categories was used to split the events into windows of the same duration (0.94 s). Considering those divisions, the dataset was created in a way that all the audio slices belonging to the same acoustic event (e.g., an aircraft passing by), were placed only on the training set or the testing set. Finally, the 80% of the audio fragments were used for training, and the remaining 20% were used for testing.
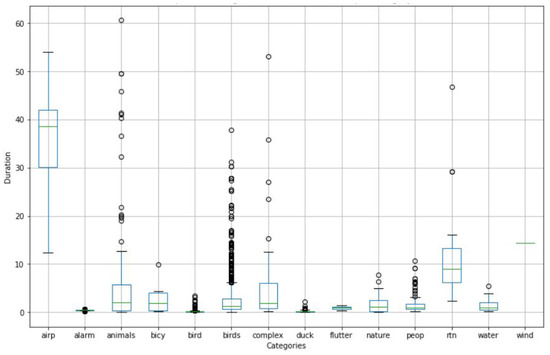
Figure 2.
Boxplot of average duration time (in seconds) of events per category.
4. Classification Algorithm
Several machine learning algorithms have been tested to automate the acoustical detection of events. The accuracy given for each model is evidenced on Table 2.
Table 2.
Accuracy value for the tested algorithms.
4.1. K-Nearest Neighbor
K-NN has given efficient results for acoustic event detection in other fields [7,8]. A grid search was performed to check what number of neighbors results in the best accuracy value. Finally, the best result (accuracy value of 53.5%) was obtained when using a value of k = 6.
Usually, the sounds produced by airplanes (airp category) are confused with complex sounds. As the complex category contains acoustic information that we could not identify in the labeling process, it is possible that some of the windows from that category contain fragments of airplane sounds. Additionally, some alarm events are confused with the rtn category. As transit sound is continuous in the background in almost all of the recordings, some events cataloged as alarm could contain also rtn background noise. Finally, the algorithm tends to confuse the categories bird and birds, which means that it is unable to differentiate the number of birds present in a concrete window.
4.2. Decision Tree
The model created with a decision tree is designed with a maximum profundity (largest way from the root node to the leaf node) of 6, as it is the one that results in a higher accuracy (of 51.3%). Again, maximum profundity was chosen after conducting a grid search.
In this case, the decision tree model shows that categories airp and peop have clear patterns, and hence there is no confusion identified on these events. Alternatively, all the categories related to animals (animals, bird, birds, and duck) are often confused. Furthermore, the fragments belonging to categories with the poorest samples (alarm, bicy, complex, flutter, nature, transit, water, or wind) are the ones that result in the worst classification results.
4.3. Random Forest
Random Forest has already been used in other research projects of acoustic events detection and classification [9]. To design our concrete model, we have conducted a grid search varying the maximum depths parameter. We found that the best performance of the model was achieved for max_depth = 48, with an accuracy of 68.6%. Then, Bagging, Boosting, and Voting methods were applied to try to increase the accuracy of the model; after applying Bagging the accuracy raised to 68.8% meaning that, in this case, the increment in accuracy is barely meaningful (only 0.2%).
The accuracy obtained in this algorithm is the best one to date, but it is also important to study the weaknesses of the model by means of analyzing the events that it confuses the most. With this classifier, the algorithm confuses sporadic events of all the categories. However, some patterns can be identified again. The algorithm tends to confuse the rtn and airp categories, and the bird with birds, which proves that it is not able to identify the number of birds vocalizing simultaneously. Something remarkable that has not happened on other algorithms is that some birds events are confused with the peop category, showing that it confuses bird vocalizations with human voice. The reason behind this confusion may be that there are some similarities between bird vocalizations and human sounds, as stated in some studies [10].
4.4. Support Vector Machine
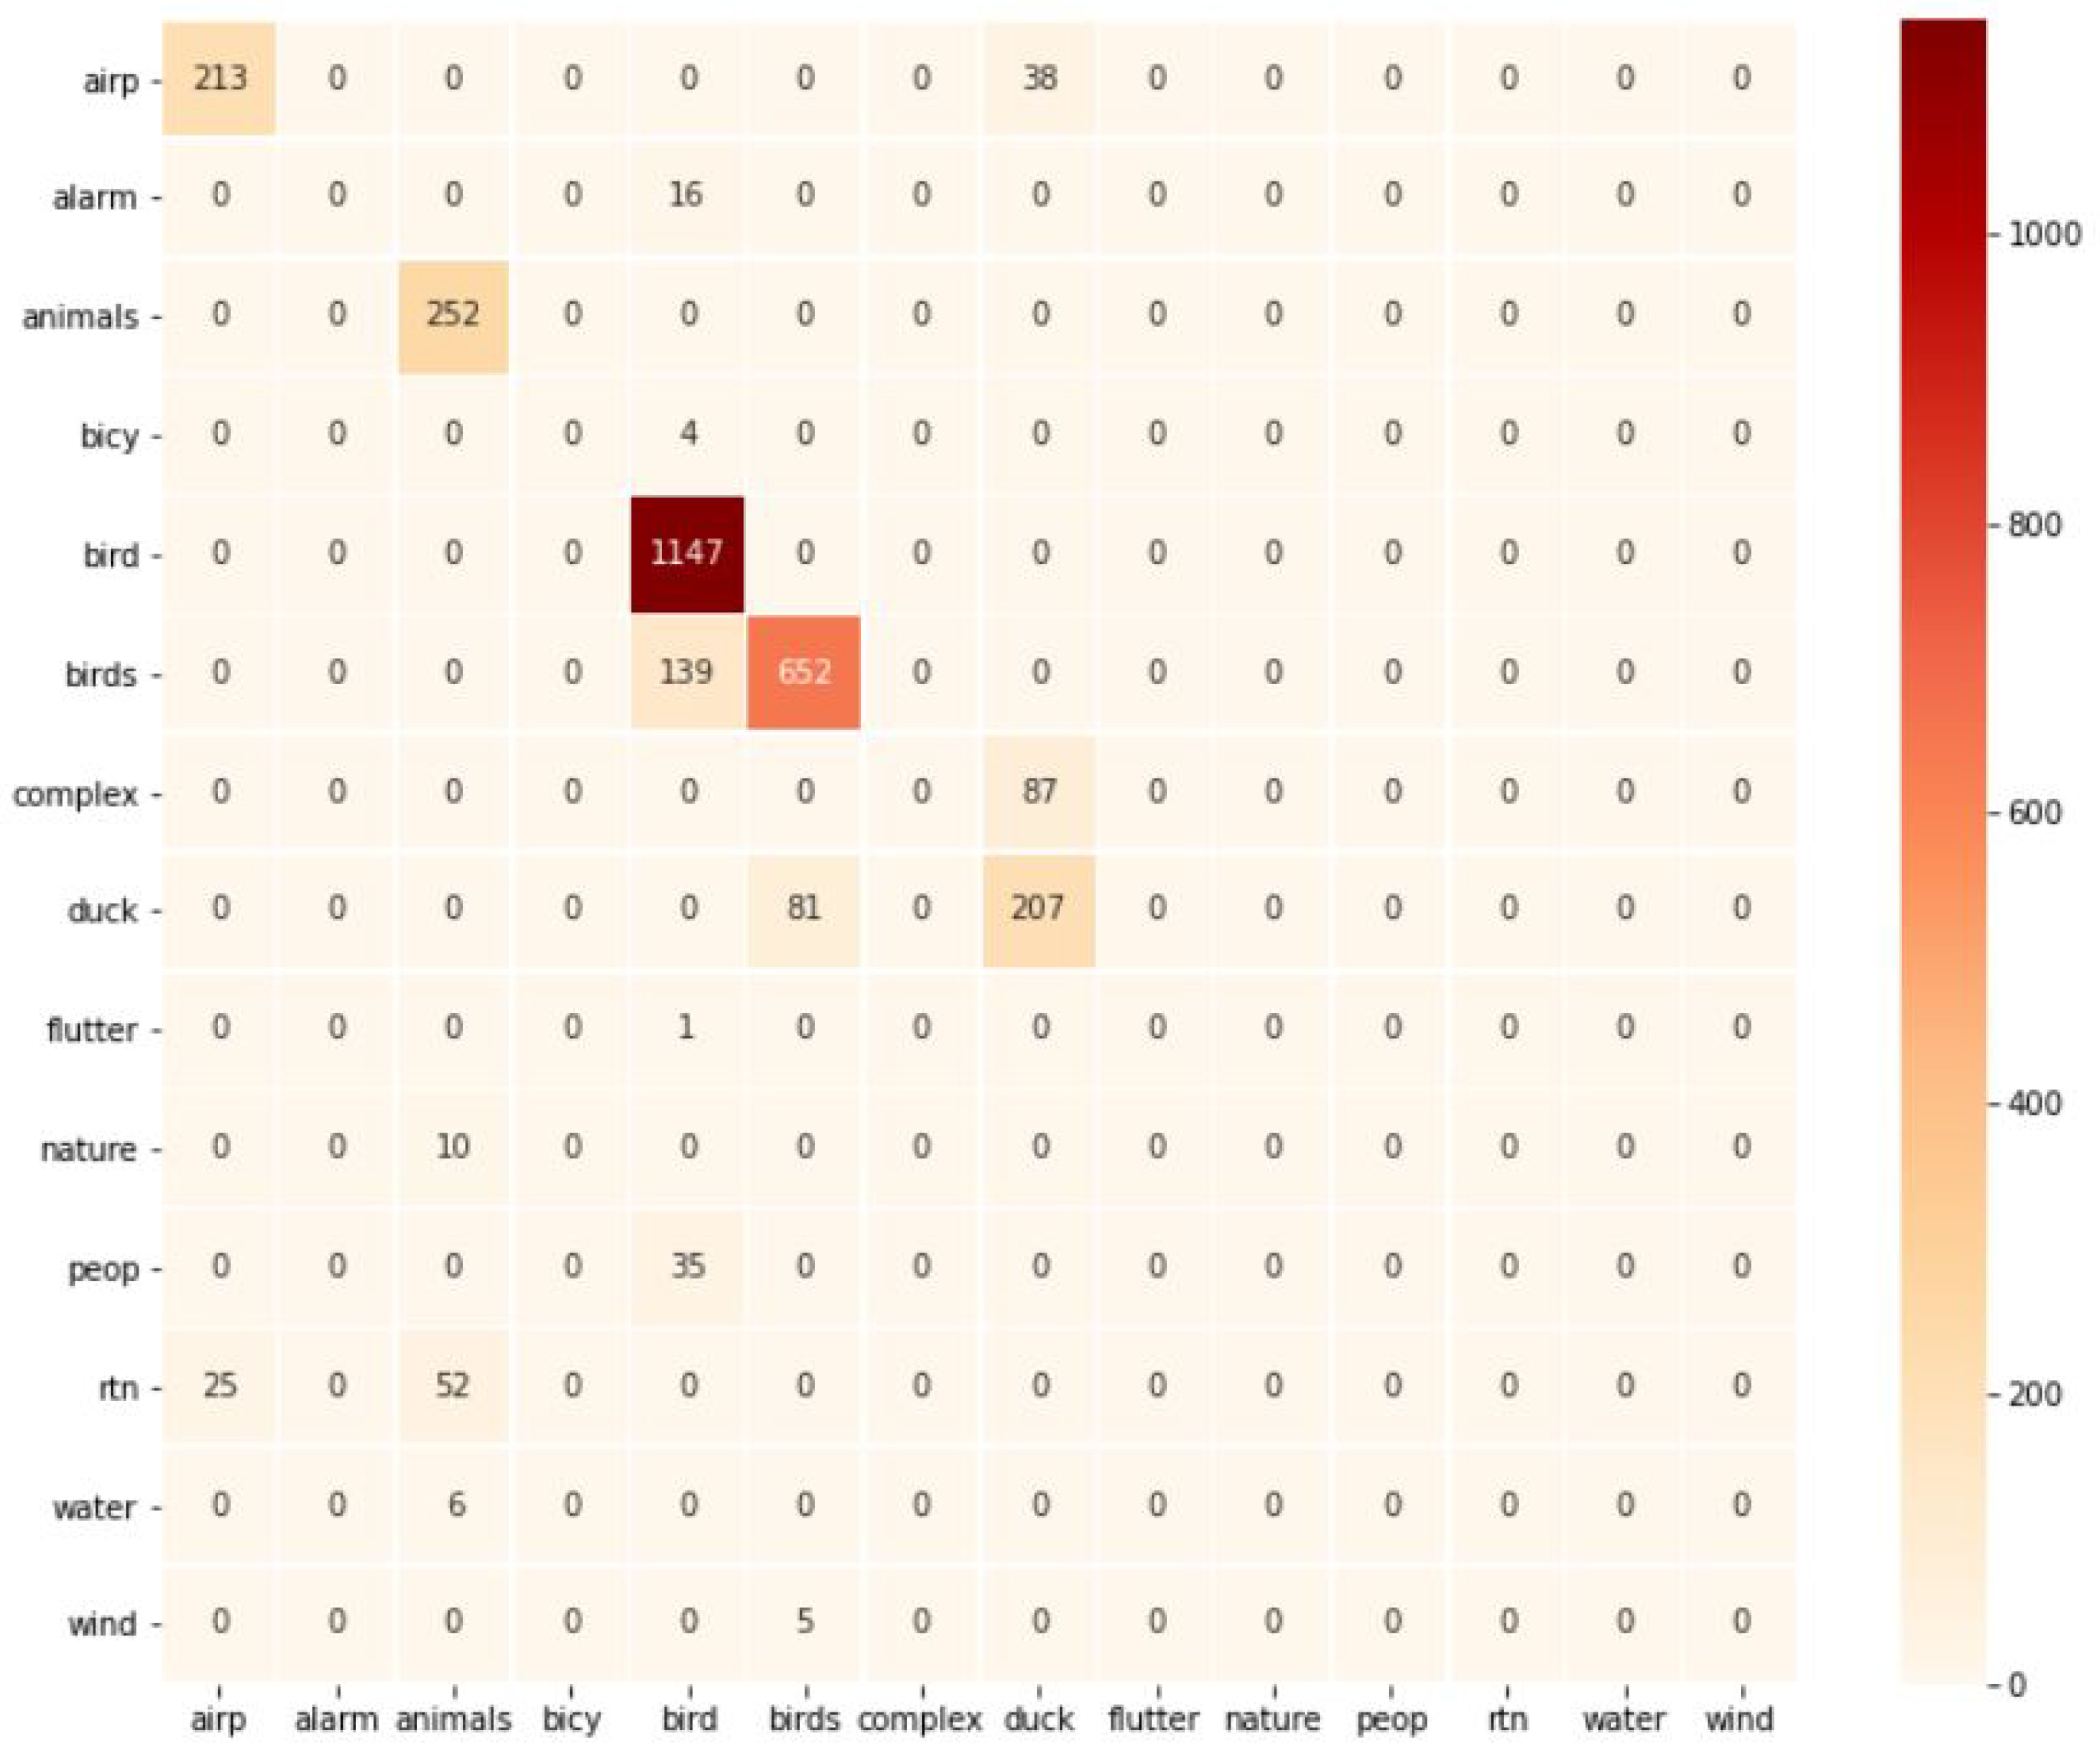
One of the most widely used methods for the classification of sound events is the Support Vector Machine (SVM). In this work, the Radial Basis Function (RBF) kernel [11] has proven to be the one that obtains the best classification results out of four (linear, sigmoid, polynomial, and RBF). The linear kernel never converged, therefore there are no results to present. When using the sigmoid kernel, the classifier was only able to correctly identify the animals, bird, and duck categories, and obtained poor results for the others. With the polynomial kernel, the classifier tended to classify events from other categories as bird. Finally, RBF kernel obtained the best results among all the classifiers presented in this work. The obtained confusion matrix of the algorithm when using the RBF kernel can be seen on Figure 3. This kernel results in an accuracy of 83,2%. On the confusion matrix, it can be seen how the system is able to classify the categories: airp, animals, bird, birds, and duck, respectively.
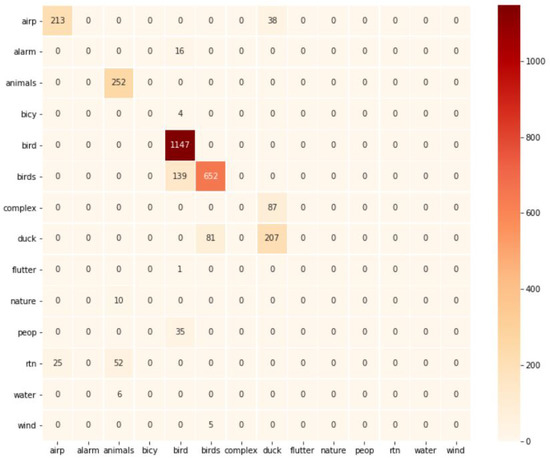
Figure 3.
Confusion matrix of the SVM algorithm.
5. Conclusions
After analyzing the machine learning results, it has been detected that, in general, all of the implemented algorithms have confusion patterns over different classes. The main reason for this might be the lack of data from some of the categories in the training set. The most common confusion happens between the bird and birds categories, which may be caused by the splitting of different windows of the same acoustic event in different fragments, and due to the similarity of the spectrum of both signals. As the window is usually shorter than the duration of the birds event, it may be that some of the windows of the labeled event contained only information of a single vocalization. This fact was not considered when the dataset was created.
To improve the current results, in future work, a wider recording campaign should be implemented. This would probably allow the algorithms to create more accurate patterns for detection, hence resulting in a more efficient model with better classification results. In fact, the current dataset only takes into account data recorded over one day, which may not be representative of the soundscape that can be found in the park in other conditions (e.g., other seasons of the year, different weather conditions, different airport activity).
Author Contributions
Conceptualization, R.M.A.-P. and E.V.-V.; software, J.B.; validation, all authors; formal analysis, J.B.; investigation, all authors; data curation, J.B. and E.V.-V.; writing—original draft preparation, review and editing, all authors; visualization, J.B.; supervision, E.V.-V. and R.M.A.-P.; project administration and funding acquisition, R.M.A.-P. All authors have read and agreed to the published version of the manuscript.
Funding
We would like to thank Secretaria d’Universitats i Recerca of the Department d’Empresa i Coneixement of the Generalitat de Catalunya for the grant 2017-SGR-966. The research that has concluded in these results has been carried out thanks to funds from the Secretariat of Research and Universities of the Generalitat de Catalunya and the Ramon Llull University, thanks to the project Sons al Balcó, code 2021-URL-Proj-053.
Acknowledgments
We would like to thank El Delta del Llobregat Natural Park for their valuable assistance on selecting the most convenient locations during the recording campaign.
Conflicts of Interest
The authors declare no conflict of interest.
Abbreviations
The following abbreviations are used in this manuscript:
| K-NN | K-Nearest Neighbor |
| LD | Linear dichroism |
| MFCC | Mel Frequency Cepstral Coefficients |
| PA | Protected Area |
| RBF | Radial Basis Function |
| SVM | Support Vector Machine |
| WHO | World Health Organisation |
References
- Hurtley, C. Night Noise Guidelines for Europe; WHO Regional Office Europe: Bonn, Germany, 2009. [Google Scholar]
- Radle, A.L. The Effect of Noise on Wildlife: A Literature Review. World Forum for Acoustic Ecology Online Reader, 2 March 2007; 1–16. [Google Scholar]
- Alquezar, R.D.; Macedo, R.H. Airport noise and wildlife conservation: What are we missing? Perspect. Ecol. Conserv. 2019, 17, 163–171. [Google Scholar] [CrossRef]
- Iglesias-Merchan, C.; Diaz-Balteiro, L.; Soliño, M. Transportation planning and quiet natural areas preservation: Aircraft overflights noise assessment in a National Park. Transp. Res. Part D Transp. Environ. 2015, 41, 1–12. [Google Scholar] [CrossRef]
- Alquezar, R.D.; Tolesano-Pascoli, G.; Gil, D.; Macedo, R.H. Avian biotic homogenization driven by airport-affected environments. Urban Ecosyst. 2020, 23, 3. [Google Scholar] [CrossRef]
- Mermelstein, P. Distance measures for speech recognition, psychological and instrumental. Pattern Recognit. Artif. Intell. 1976, 116, 374–388. [Google Scholar]
- Hoyos-Barceló, C.; Monge-Álvarez, J.; Shakir, M.Z.; Alcaraz-Calero, J.M.; Casaseca-de La-Higuera, P. Efficient k-NN implementation for real-time detection of cough events in smartphones. IEEE J. Biomed. Health Inform. 2017, 22, 1662–1671. [Google Scholar] [CrossRef] [PubMed] [Green Version]
- Liu, C.L.; Lee, C.H.; Lin, P.M. A fall detection system using k-nearest neighbor classifier. Expert Syst. Appl. 2010, 37, 7174–7181. [Google Scholar] [CrossRef]
- Phan, H.; Maaß, M.; Mazur, R.; Mertins, A. Random regression forests for acoustic event detection and classification. IEEE/ACM Trans. Audio Speech Lang. Process. 2014, 23, 20–31. [Google Scholar] [CrossRef] [Green Version]
- Doupe, A.J.; Kuhl, P.K. Birdsong and human speech: Common themes and mechanisms. Annu. Rev. Neurosci. 1999, 22, 567–631. [Google Scholar] [CrossRef] [PubMed] [Green Version]
- Vavrek, J.; Pleva, M.; Juhar, J. Acoustic events detection with support vector machines. In Electrical Engineering and Informatics, Proceeding of the Faculty of Electrical Engineering and Informatics of the Technical University of Košice, Kosice, Slovakia, 1 September 2010; Technical University of Košice: Kosice, Slovakia, 2010; pp. 796–801. [Google Scholar]

Publisher’s Note: MDPI stays neutral with regard to jurisdictional claims in published maps and institutional affiliations. |
© 2021 by the authors. Licensee MDPI, Basel, Switzerland. This article is an open access article distributed under the terms and conditions of the Creative Commons Attribution (CC BY) license (https://creativecommons.org/licenses/by/4.0/).