Proceeding Paper

Design and Characterization of a Passive Wireless DNA Sensor †

1
Department of Mechanical Engineering, University of Puerto Rico, Mayaguez 00680, Puerto Rico
2
Gurabo Campus, Universidad Ana G. Mendez, San Juan 00928, Puerto Rico
*
Author to whom correspondence should be addressed.
Presented at the 8th International Electronic Conference on Sensors and Applications, 1–15 November 2021; Available online: https://ecsa-8.sciforum.net.
Eng. Proc. 2021, 10(1), 39; https://doi.org/10.3390/ecsa-8-11261
Published: 1 November 2021

Abstract

:
This paper presents a concept for a passive wireless DNA sensing platform that exploits a multidisciplinary area, synthesizing the conventional DNA capacitive sensing mechanism and the surface-based conformational characterization throughout DNA immobilization and hybridization. The resonant frequency shift, caused by the change of capacitance throughout DNA immobilization and hybridization and occurring on top of an interdigital capacitor, is monitored by means of an impedance analyzer. 32 samples were measured throughout the experiment and the average capacitance measurements represented a variety of surface charges resulting from DNA molecule immobilization and hybridization. The capacitance changed from 11.58 pF to 114.5 pF when specific ssDNA was attached to electrodes and then increased to 218.6 pF once complementary strand DNA was introduced and hybridized with existing DNA chains. In addition, using impedance analyzer measurements, the resonant frequency decreased from 2.01 MHz to 1.97 MHz in the presence of ssDNA and decreased further down to 0.95 MHz after the complementary strand DNA was deposited.

1. Introduction

The concept of biosensors, initially introduced by Millan and Mikkelson [1] in 1993, has been frequently discussed, and numerous groups have carried out extensive studies in this area. A biosensor is generally defined as a device designed to detect or quantify a biochemical molecule such as a particular DNA sequence or particular protein [2]. Most molecular biosensors are affinity-based, meaning their role is to create an immobilized capture probe that binds the molecule being sensed. Thus, biosensors change the problem of detecting the analyte in solution to detecting a change at a localized surface where the interaction of the analyte with the bio-receptor is designed to produce an effect measured by the transducer (which might be an electrochemical transducer, optical transducer, gravimetric transducer, Surface Plasmon Resonance (SPR) or electric transducer). An example of a biosensor can be our own body with its own biological recognition system demonstrated by every function of its complex yet efficient design. This example can be related to wireless DNA sensor transducer having the ability to detect DNA with different electrochemical detection methods. The immobilization and hybridization of the DNA can be quantified using specialized equipment that analyzes the data reading the sensitivity of the sensor. Impedance and capacitance analysis are the electrical measurements that indicate the sensitivity of the sensor when it is exposed to the DNA sample.
The detection of DNA hybridization has been possible with electro active molecules that monitor the electron transfer mechanism during the hybridization process, which presents a potential application for the creation of biosensors. It has been shown that the sensor performance (e.g., sensitivity, selectivity and stability) is highly dependent on the properties of immobilized DNA probes such as orientation, conformation, and surface density [3]. Generally, the sensitive element for a DNA biosensor is composed of single stranded DNA (ssDNA) molecules that allow the hybridization of complementary strands [4]. Different methods have been employed to convert these hybridization signals including: (1) optical transducers that are based on fiber optics (reflection interference contrast microscopy [5], surface plasmon resonance [6] and Raman spectroscopy [7]; (2) electrochemical transduction [8,9] or electrical transduction (i.e., integrated-circuit biochip [10]); and (3) piezoelectric transduction (measurement of changes in mass) [11]. The behavior of DNA attached onto metallic and semi-metallic surfaces has shown its potential application in biomedical devices [12]. Due to this, the overall goal of this project is to provide a concept of a lab-on-chip biosensor using passive wireless technology that can passively detect or identify different diseases that are characterized by a specific DNA sequence, such as anthrax and tuberculosis [13], in a more accurate and faster manner.

2. Principle and Design

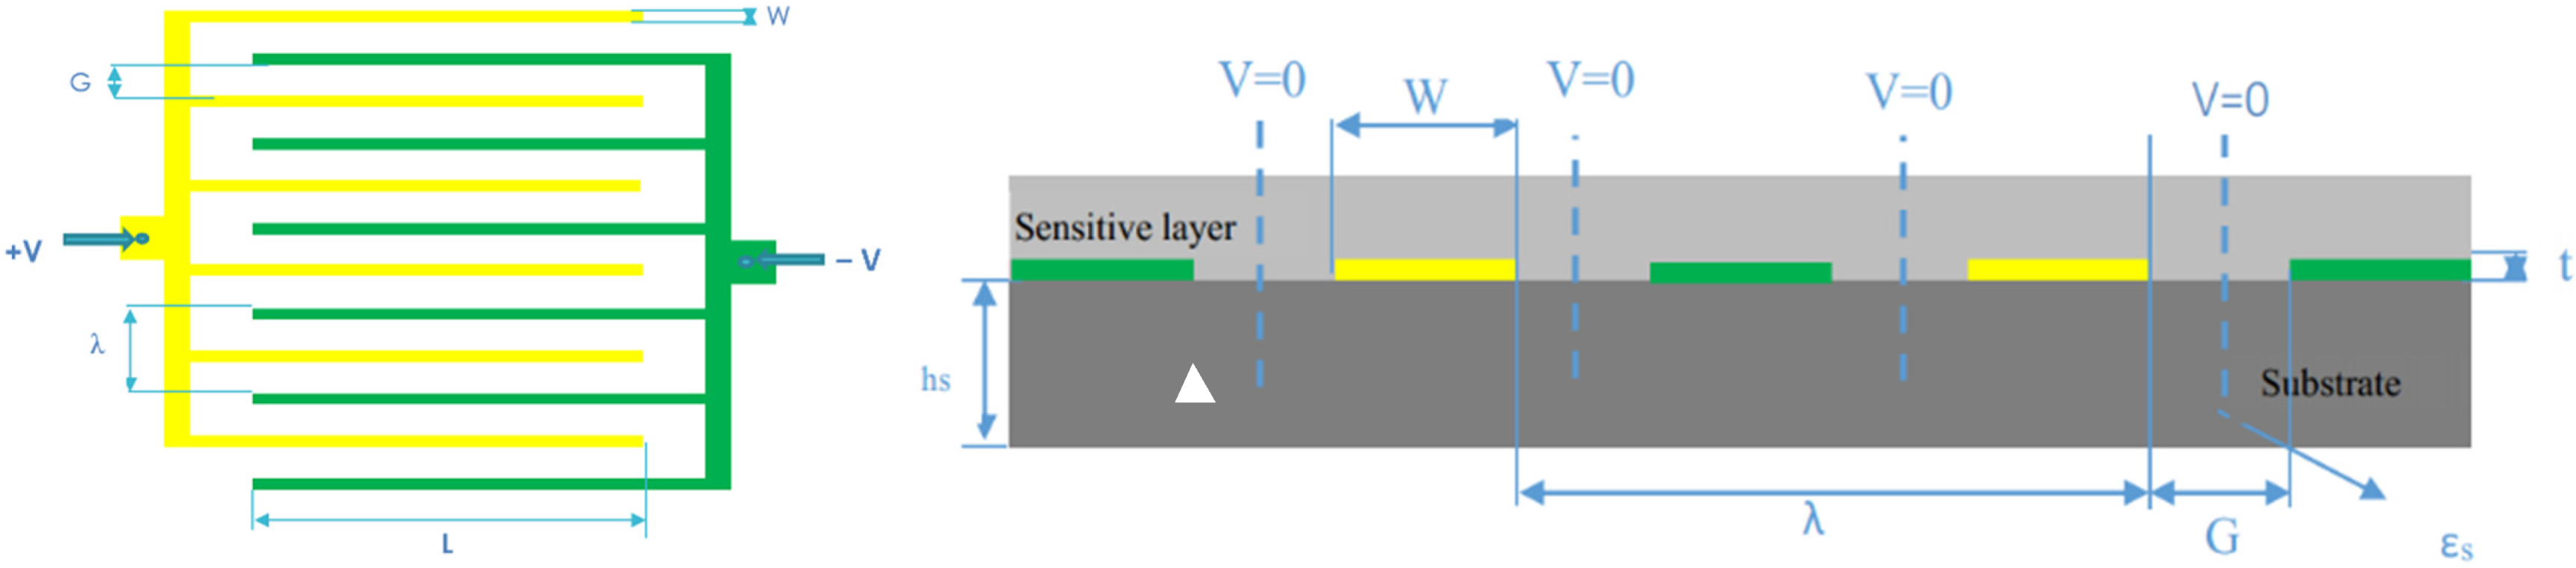
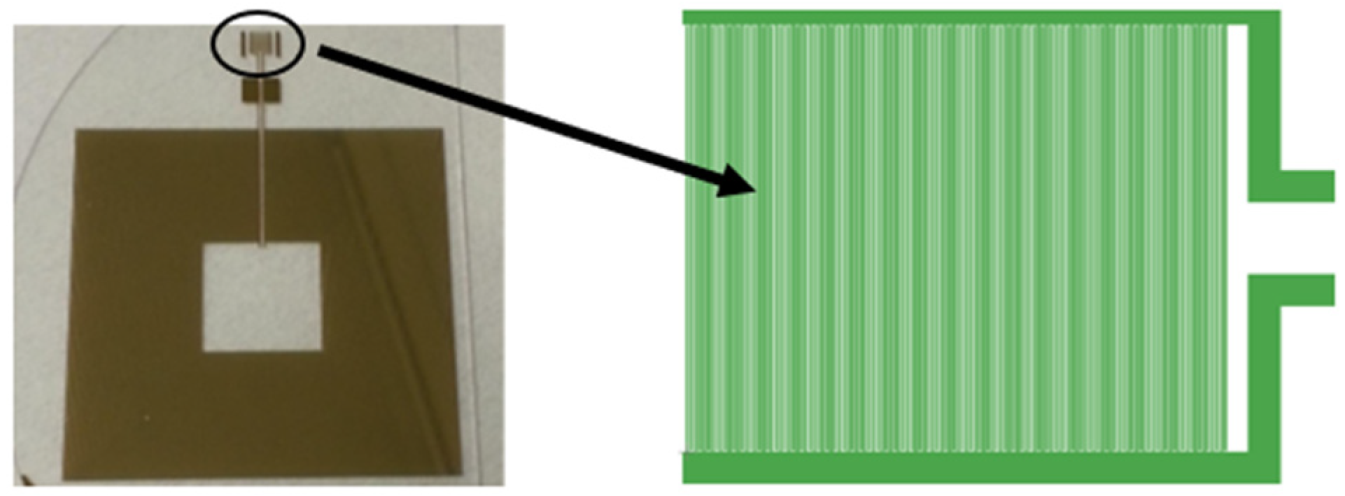
2.1. Interdigital Capacitor Design

Interdigital capacitors (IDC) for technological applications have been studied by many authors since the early 1970s. An approximation schematic is briefly illustrated in Figure 1. It shows a layout of IDC in which the induction electrode is in the same plane as driving electrode consisting of two interpenetrating comb electrodes. The gaps between electrodes have a width G while the fingers have a width W. The thickness of electrodes is denoted as t and the thickness of the substrate is marked as hs. The permittivity constant of the substrate is marked as εs. Each electrode is connected with opposite potential (either +V or −V). The wavelength of this periodic IDC-S is called λ. Thanks to the symmetry of geometry, the whole sensor can be divided into a number of identical unit cells with dimension λ/2, from the center of electrode to the mid-point of adjacent pole. The perpendicular planes halfway between the electrodes are equipotential planes. In common practice, this plane is considered as an electric ground and its voltage is set to zero.
The capacitance for a particular interdigital sensor configuration is a function of the dielectric permittivity of the materials, the fingers length, the number of electrodes comb, and of two geometric dimensionless parameters r and η as shown in the following equation:
C = C (η, r, εi, N, L, εs)
where η represents the metal ratio and can be calculated by η = W/(W+G). r is a geometric parameter defined as r = hi/ λ. hi is the thickness of each layer. N denotes the number of interdigital electrodes and L is the length of each electrode. εi and εs suggest the permittivity constant of i-th layer and the substrate, respectively.
In the previous work, we discussed the performance of these three configurations in different scenarios to optimize the interdigital capacitor design [14]. It turned out the model with smaller gaps has the most sensitivity responding to the capacitance change and wider detectable area. However, the capacitors with inter spacing less than 10 um was practically hard to keep since it made about 50% of the electrodes to fail during our fabrication process. Through overall consideration, we decide to apply the configuration with 10 µm width and 10 µm gap for our design. Figure 2 shows the schematic of suggested capacitor consisting of 130 fingers. The geometrical parameters are listed in Table 1.

2.2. Spiral Inductor Design

Spiral inductors are utilized widely to make resonant circuit elements for capacitive sensors in the microelectronics field. Coupling the primary reader antenna, the spiral inductor acts as a transformer based on the principle of electromagnetic induction. When an oscillating current is executed on the antenna, a changing magnetic field to both the primary antenna and the spiral inductor is produced along the magnetic path in the air. An alternating voltage of the same frequency is induced in the spiral inductor. The DNA molecule behavior on the top of interdigital capacitor variations induce the frequency change, which can be detected from the reader side by monitoring the impedance across the terminals of the wide bandwidth reader antenna. In other words, the electrical energy is transferred from the input antenna to the sensor and the DNA information can be detected by the reader from the coupled magnetic field. The spiral inductor with five turns was made of copper wire leads and connected to the electrodes of the capacitor. The diameter of the round copper ire was 0.674 mm and the radius of the inductor was 3.1 cm.

2.3. Electrical Model of Resonant Circuit

The planar inductor coil, together with the interdigital capacitor electrodes, forms a planar structure that has an integrated passive resonant circuit. Once the current with a varying frequency is applied to the primary coil, a varying magnetic field is generated around this coil. Based on Faraday’s law, induced voltage is generated on the remotely placed sensor. The capacitance change due to Helmholtz ion plane displacement in the electrode-solution interface occurs corresponding to the reaction of DNA molecular with capacitors. When the gold electrode is clean, the equivalent capacitance is going to be relatively small. Once we introduced single strand DNA solution on the electrodes, the equivalent capacitance will increase. When the hybridization process occurs, the equivalent capacitance obtain is even higher.

3. Experiment Procedure

3.1. Material and Preparation

For this proof-of-concept experiment, specific ssDNA probes (Bacillus Anthracis CCG ACG AGG GTT GTC AGA GGA TGC GTC GG were used for indirect modifications, GGC TGC TCC CAA CAG TCT CCT ACG CAG CC for complementary targets and TTA CTA CAA AGG AGT CAC AAC GAT AGT AA applied for non-complementary targets) were obtained from Integrated DNA Technologies (IDT). Single strand of Poly G samples was diluted with 1 mL of nanopore water and modified with a disulfide for gold electrode immobilization.
The proposed microelectrodes were fabricated by one of authors, Lisandro Cunci, at Conte Nanotechnology Cleanroom Lab at University of Massachusetts (UMass) at Amherst in collaboration with the Center for Hierarchical Manufacturing, an NSF Nanoscale Science and Engineering Center (NSEC). The fabricated sensors mush be treated properly and cleaned to be suitable for usage.

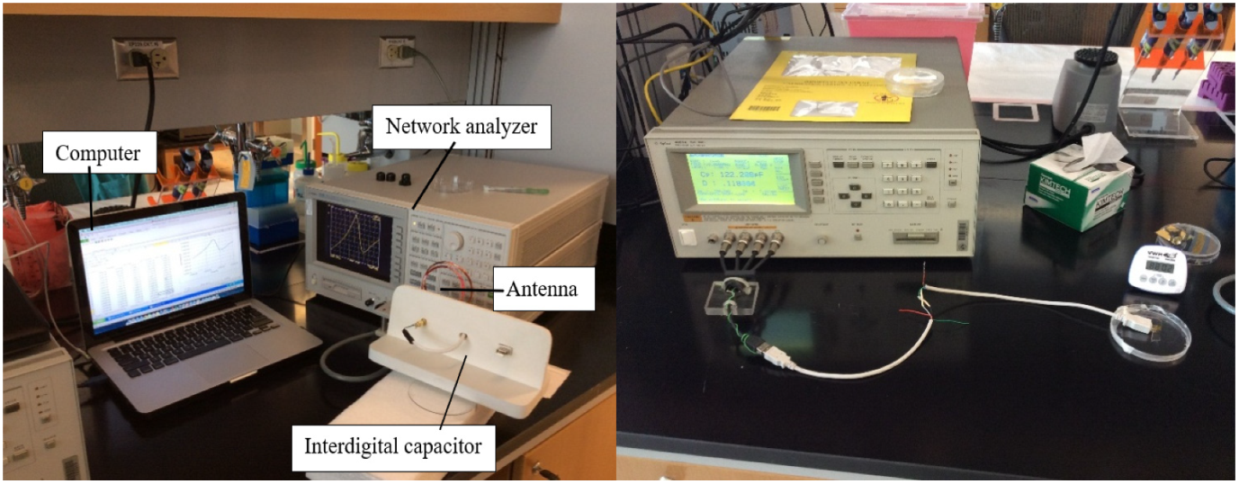
3.2. Experiment Setup and Procedure

  • Setup and Calibration: The experiment setup is presented in Figure 3. Before introducing specimen, the 0 S, 0 Ω, and 50 Ω terminations in the calibration kit are required. In respect to LCR meter, the open and short circuit test were performed leaving an open or short connection between the IDC connection station docking terminals for eliminating stray capacitance.
  • Measure bare electrodes: The frequency peak corresponding to clean bare electrodes was measured as a baseline of this experiments.
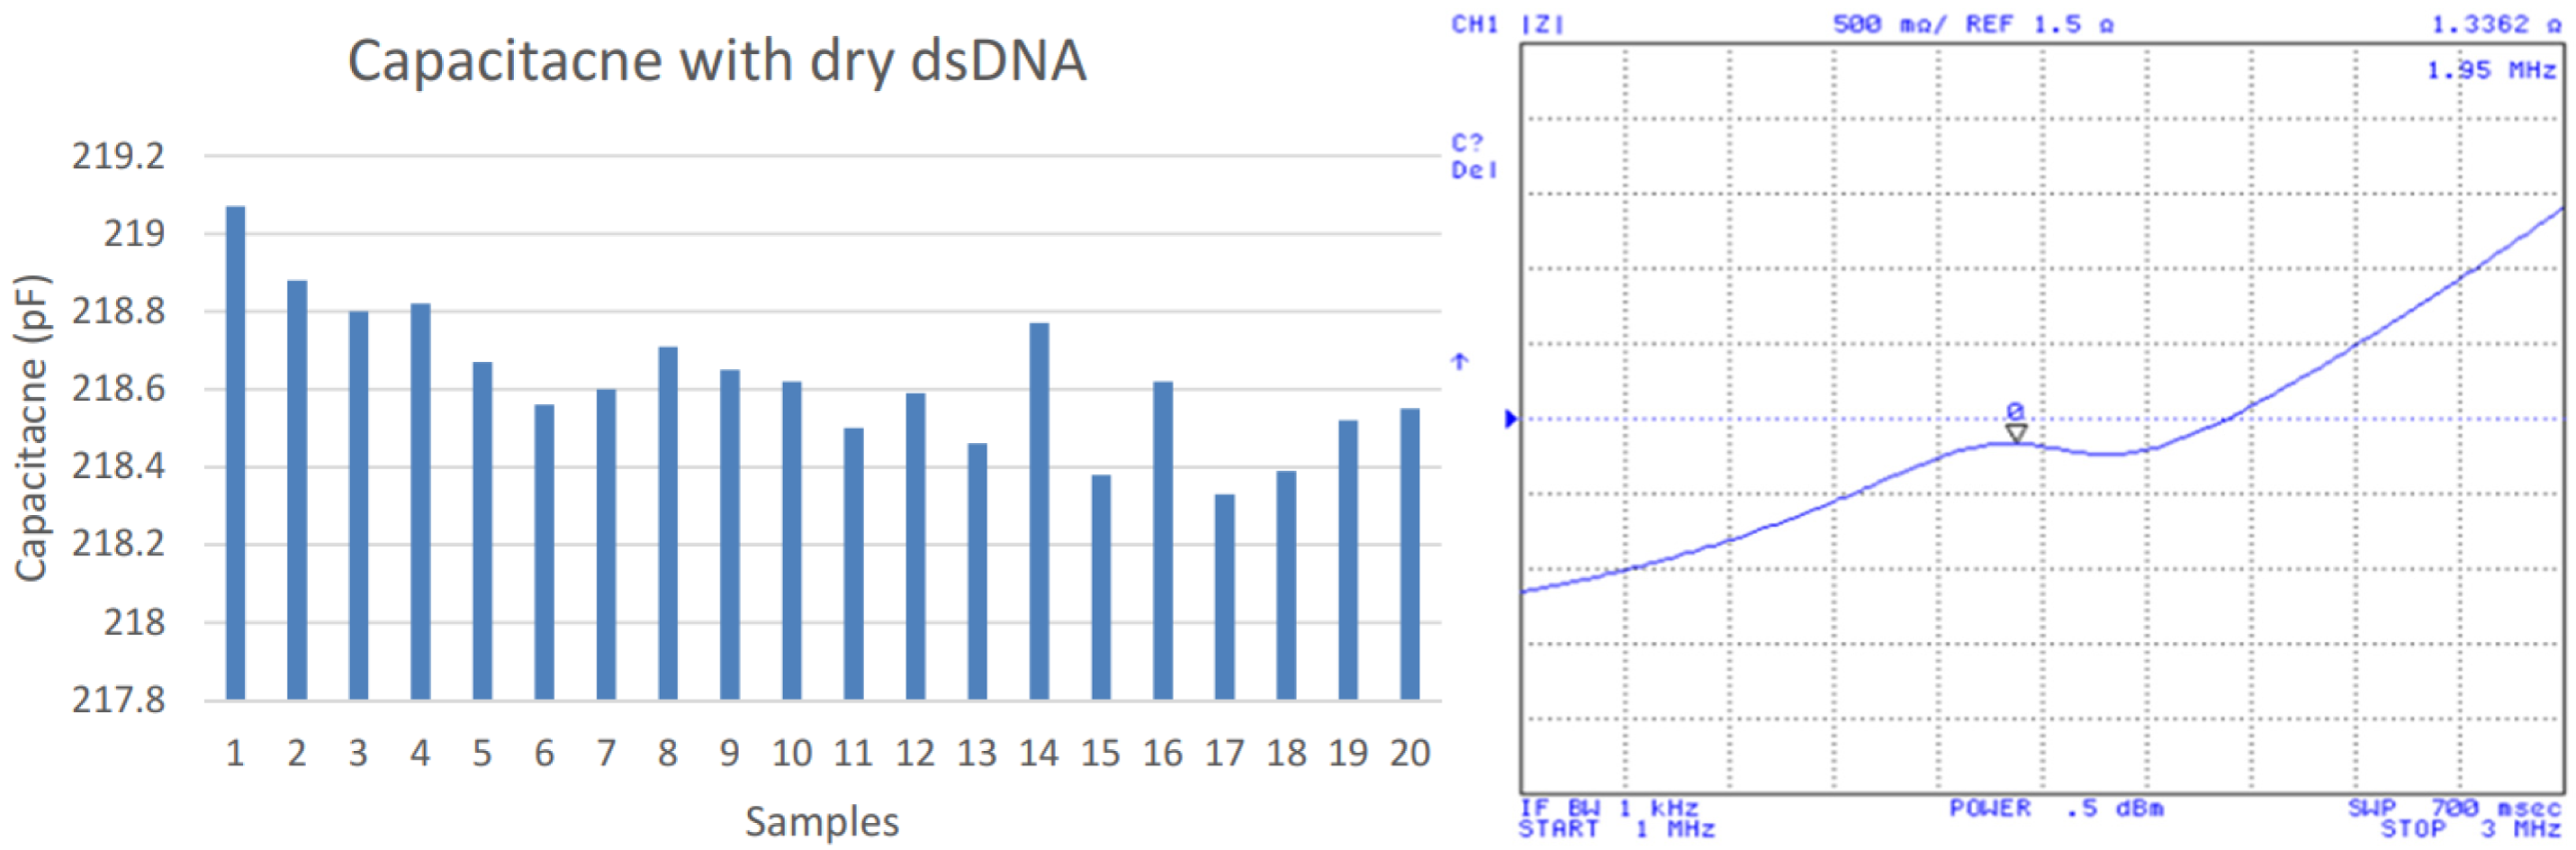
  • Measurement of ssDNA: a drop of 5 mM ssDNA solution was deposited on the interdigital part enclosed by insulated rubber tape to prevent connection between two electrodes from presence of solution, then kept in a clean petri dish for 20 h. After of the period is complete, the electrode was rinsed with preparative buffer and dried with a nitrogen stream for eliminating the excess unattached to electrodes. The frequency peak was observed in network analyzer screen and the capacitance obtained by LCR meter.
  • Measurement of 5 mM ssDNA with non-complementary target: non-complementary strand of DNA was introduced and remain 3 h. followed by the cleaning with buffer and nitrogen measurement was taken. The measurement is aimed at being a contrast experiment for the DNA hybridization process.
  • Measurement of 5 mM ssDNA with complementary target: this step would also take 3 h and same cleaning task before measurement.

4. Results and Discuss

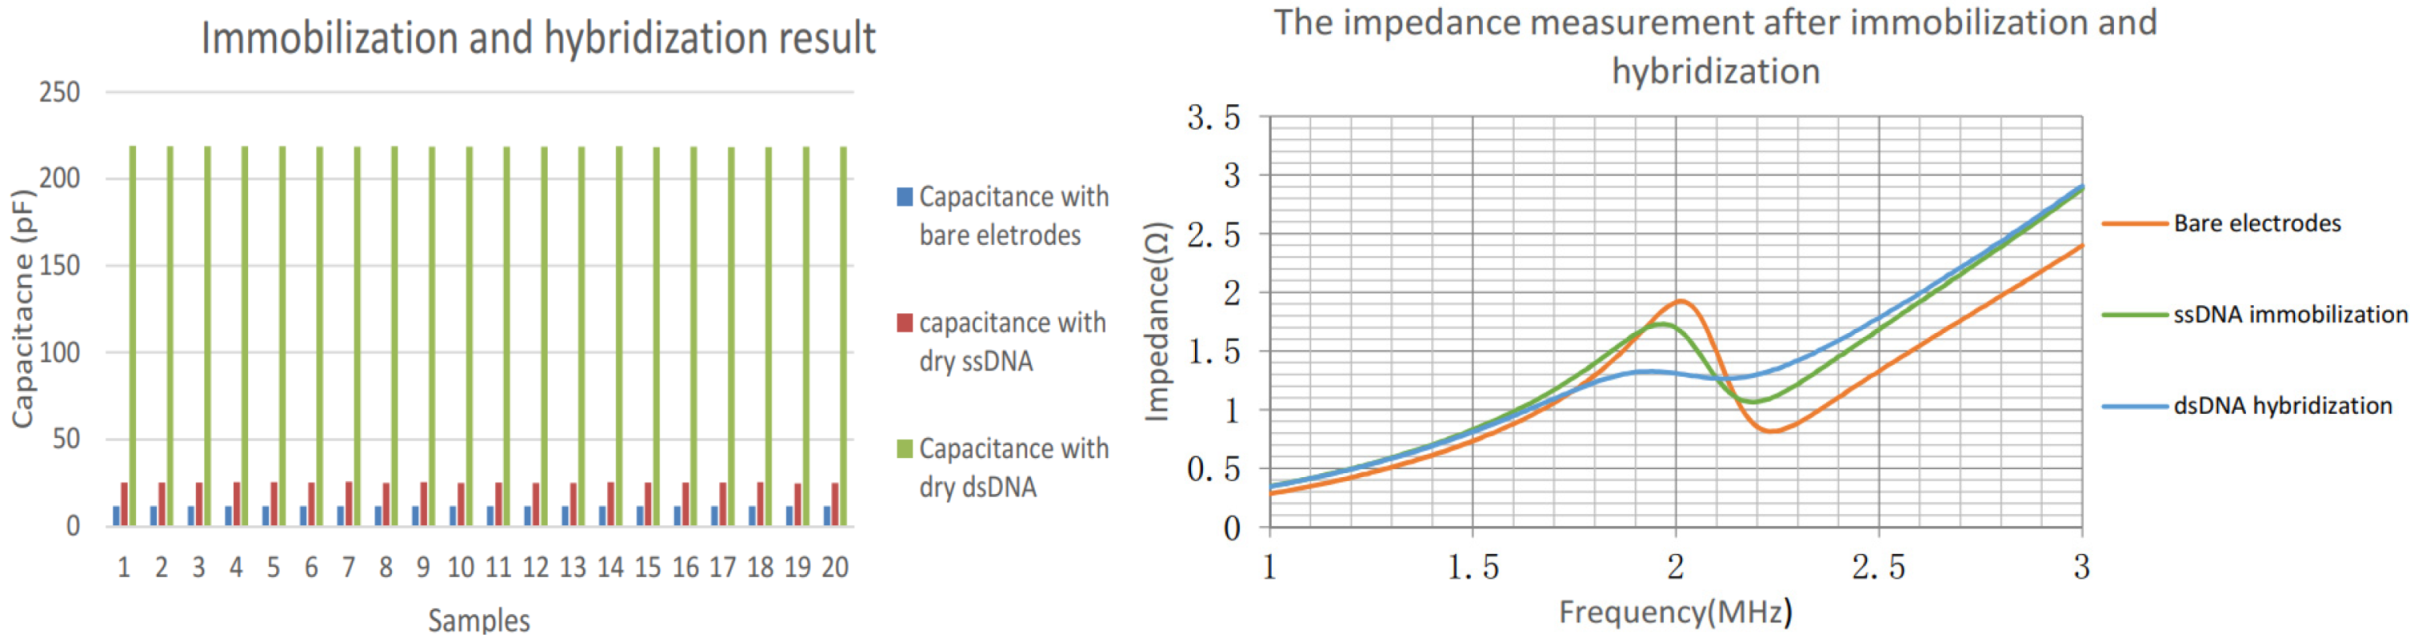
4.1. Bare IDC Capacitance Result

The bare IDC capacitance and impedance was measured as a reference (not shown). The average of the direct capacitance measurement is 11.58 pF with a resonant frequency of 2.01MHz. The theoretical capacitance calculated is 11.76 pF.

4.2. Immobilization of ssDNA

After the specific DNA strand immobilization period concluded, a MES buffer was placed on the electrode array for removing the residual and a nitrogen stream was applied for drying. Then, the device capacitance and impedance were again tested as shown in Figure 4. The average capacitance resulted in 25.19 pF and 1.97 MHz. This presents a capacitance increase of 13.61 pF but a 0.04 MHz decrease of frequency peak over the clean dry IDC device.

4.3. Hybridization of the Complementary Strand

Before measuring the hybridization of complementary strand, a series of blank tests involving non-complementary strands were performed. As expected, the impedance peak was stable in 1.97 MHz (not shown). Then, a MES buffer solution including 5 μM of the complementary strand was placed on the same electrode array, and capacitance measurements were taken three hours after the deposition procedure to ensure greater strand hybridization. Figure 5 shows the IDC capacitance and impedance measurement after the hybridization process that yielded an average capacitance of 218.6 pF and an average resonant frequency of 1.95 MHz. It presents a capacitance increase of 104.1 pF while the frequency decreased by 0.02 MHz for the hybridization process.

4.4. Result Discussion

The left panel of Figure 6 shows the capacitance increase after the immobilization and hybridization stage; the frequency peak decrease is presented in the right panel. It is noticeable that each sample is measured and performed using an arithmetic average of 32 subsamples. The capacitance of the bare electrodes is relatively small. Once the ssDNA is immobilized, the related capacitance increased significantly, resulting from the free charge interfacial transfer between the ssDNA which carries the negative charge inherently and the electrodes surface. The DNA hybridization occurred in the presence of complementary target strand is deposited on the preceding electrodes. It is indicated that the capacitance obtained rose drastically up to 104.1 pF since more free charge and energy is presented.
For impedance measurement, the frequency peak changes in response to the presence of DNA as demonstrated in Figure 6 right panel. Initially, the frequency point of the abrupt change is stable at 2.01 MHz, and then the ssDNA is used to modify IDC surface, which cause the resonant frequency of the related circuit decreased to 1.97 MHz. The measurement following hybridization shows the abrupt point dropped to 1.95 MHz. The variations were not as significant as the ones in direct capacitance measurement. However, the contrast experiment regarding the non-complementary DNA strands suggested the impedance variations subject to the hybridization were sensitive enough.

5. Conclusions

This research project has developed a novel passive wireless DNA molecule sensor, which has a structure with two major parts: a capacitor which is a DNA sensing element and an inductor which works as a passive power source and data communication element. These two components work together as an LC resonator, whose resonant frequency shifts when the capacitance of the sensor changes in response to DNA molecule behavior, in order to realize the wireless label-free DNA sensing and remote power (eliminating the need for wire connection). Moreover, these passive wireless sensors can be fabricated at a low-cost so that they are able to be widely used in both homes and clinics. The proposed DNA bio-sensor provides a simple planar structure and a stable accurate measurement with a passive wireless and reusable feature, which enables long-term DNA molecule detection and integrated wireless communication.
There are couples of directions that future research can explore including, but not limited to, the following:
  • Improve the IDC DNA sensor with higher sensitivity, linearity, and minimized sensor size;
  • Extend the communication distance of the DNA sensor;
  • Develop a cost-effective way to read out the data transformed from proposed LC circuit, such as applying RFID technology;

Supplementary Materials

The following supporting information can be downloaded at: https://www.mdpi.com/article/10.3390/ecsa-8-11261/s1.

Author Contributions

Conceptualization, Y.J.; methodology, H.X. and L.C.; investigation, H.X. and L.C.; resources, H.X. and L.C.; writing—original draft preparation, H.X.; writing—review and editing, Y.J.; supervision, Y.J. All authors have read and agreed to the published version of the manuscript.

Funding

This research was funded by National Science Foundation, grant number 1152940. Label-Free Electrochemical Capacitance DNA Sensing with Passive Wireless Radio Frequency Identification Technology.

Institutional Review Board Statement

Not applicable.

Informed Consent Statement

Not applicable.

Data Availability Statement

Data is contained within the article or Supplementary Material. The data presented in this study are available in Supplementary Material here.

Acknowledgments

I would like to thank Carlos R. Cabrera and his group from UPRRP, in charge of preparing DNA molecule and arranging chemical experiments for the study of the capacitive label-free detection of DNA immobilization and hybridization process. This project would not have been possible without the kind help of my co-workers Hong Li and Orlando J Lopez Vazquez. The Grant from NSF 1152940 provided the funding and resources for the development of this research.

Conflicts of Interest

The authors declare no conflict of interest. The funders had no role in the design of the study; in the collection, analyses, or interpretation of data; in the writing of the manuscript; or in the decision to publish the results.

References

  1. Millan, K.M.; Mikkelsen, S.R. Sequence-selective biosensor for DNA based on electroactive hybridization indicators. Anal. Chem. 1993, 65, 2317–2323. [Google Scholar] [CrossRef] [PubMed]
  2. Daniels, J.S.; Pourmand, N. Label-Free Impedance Biosensors: Opportunities and Challenges. Electroanal. 2007, 19, 1239–1257. [Google Scholar] [CrossRef] [PubMed]
  3. Lao, R.; Song, S.; Wu, H.; Wang, L.; Zhang, Z.; He, A.L.; Fan, C. Electrochemical Interrogation of DNA Monolayers on Gold Surfaces. Anal. Chem. 2005, 77, 6475–6480. [Google Scholar] [CrossRef] [PubMed]
  4. Albers, J.; Grunwald, T.; Nebling, E.; Piechotta, G.; Hintsche, R. Electrical biochip technology?a tool for microarrays and continuous monitoring. Anal. Bioanal. Chem. 2003, 377, 521–527. [Google Scholar] [CrossRef] [PubMed]
  5. Clack, N.G.; Salaita, K.; Groves, J.T. Electrostatic readout of DNA microarrays with charged microspheres. Nat. Biotechnol. 2008, 26, 825–830. [Google Scholar] [CrossRef] [PubMed] [Green Version]
  6. Goodrich, T.T.; Lee, H.J.; Corn, R. Enzymatically Amplified Surface Plasmon Resonance Imaging Method Using RNase H and RNA Microarrays for the Ultrasensitive Detection of Nucleic Acids. Anal. Chem. 2004, 76, 6173–6178. [Google Scholar] [CrossRef] [PubMed]
  7. Cao, Y.C.; Jin, R.; Mirkin, C.A. Nanoparticles with Raman Spectroscopic Fingerprints for DNA and RNA Detection. Science 2002, 297, 1536–1540. [Google Scholar] [CrossRef] [PubMed] [Green Version]
  8. Bandiera, L.; Cellere, G.; Cagnin, S.; De Toni, A.; Zanoni, E.; Lanfranchi, G.; Lorenzelli, L. A fully electronic sensor for the measurement of cDNA hybridization kinetics. Biosens. Bioelectron. 2007, 22, 2108–2114. [Google Scholar] [CrossRef] [PubMed]
  9. Drummond, T.G.; Hill, M.G.; Barton, J.K. Electrochemical DNA sensors. Nat. Biotechnol. 2003, 21, 1192–1199. [Google Scholar] [CrossRef] [PubMed] [Green Version]
  10. Vo-Dinh, T.; Alarie, J.P.; Isola, N.; Landis, D.; Wintenberg, A.L.; Ericson, M.N. DNA Biochip Using a Phototransistor Integrated Circuit. Anal. Chem. 1999, 71, 358–363. [Google Scholar] [CrossRef] [PubMed]
  11. Liu, T.; Tang, J.; Han, M.; Jiang, L. A novel microgravimetric DNA sensor with high sensitivity. Biochem. Biophys. Res. Commun. 2003, 304, 98–100. [Google Scholar] [CrossRef]
  12. Rivera-Gandía, J.; Maldonado, M.D.M.; De La Torre-Meléndez, Y.; Ortiz-Quiles, E.O.; Vargas-Barbosa, N.M.; Cabrera, C.R. Electrochemical Capacitance DNA Sensing at Hairpin-Modified Au Electrodes. J. Sensors 2011, 2011, 1–6. [Google Scholar] [CrossRef] [Green Version]
  13. Sasindran, S.J.; Torrelles, J.B. Mycobacterium Tuberculosis Infection and Inflammation: What is Beneficial for the Host and for the Bacterium? Front. Microbiol. 2011, 2, 2. [Google Scholar] [CrossRef] [PubMed] [Green Version]
  14. Xu, H.; Jia, Y. The novel design of Interdigital capacitor and Planar Inductor. Unpublished work. 2021.
Figure 1. Layout of electrode plane (left); Cross-section of a periodic IDC-S (right).
Engproc 10 00039 g001
Figure 2. Snapshot of the fabricated resonant circuit consisting of the proposed capacitor in the circle and spiral inductor (left); layout of magnifying interdigital capacitor sensing element (right).
Engproc 10 00039 g002
Figure 3. Layout of interdigital capacitor sensing element (left) and LCR meter (right).
Engproc 10 00039 g003
Figure 4. Capacitances after ssDNA immobilization (left); impedance measurements (right).
Engproc 10 00039 g004
Figure 5. Capacitances after dsDNA hybridization (left); impedance measurements (right).
Engproc 10 00039 g005
Figure 6. Capacitance measurements after each experiment stage (left); impedance measurements (right).
Engproc 10 00039 g006
Table 1. The geometrical parameters of the proposed capacitor.
ParameterSymbolValue
Finger WidthWC0.01 mm
Finger GapsGC0.01 mm
Finger LengthLC2 mm
Number of FingersNC130
The Thickness of Fingert0.002 mm
Publisher’s Note: MDPI stays neutral with regard to jurisdictional claims in published maps and institutional affiliations.

