
Estimation of Building Heights and DEM Accuracy Assessment Using ICESat-2 Data Products †


Abstract
:1. Introduction
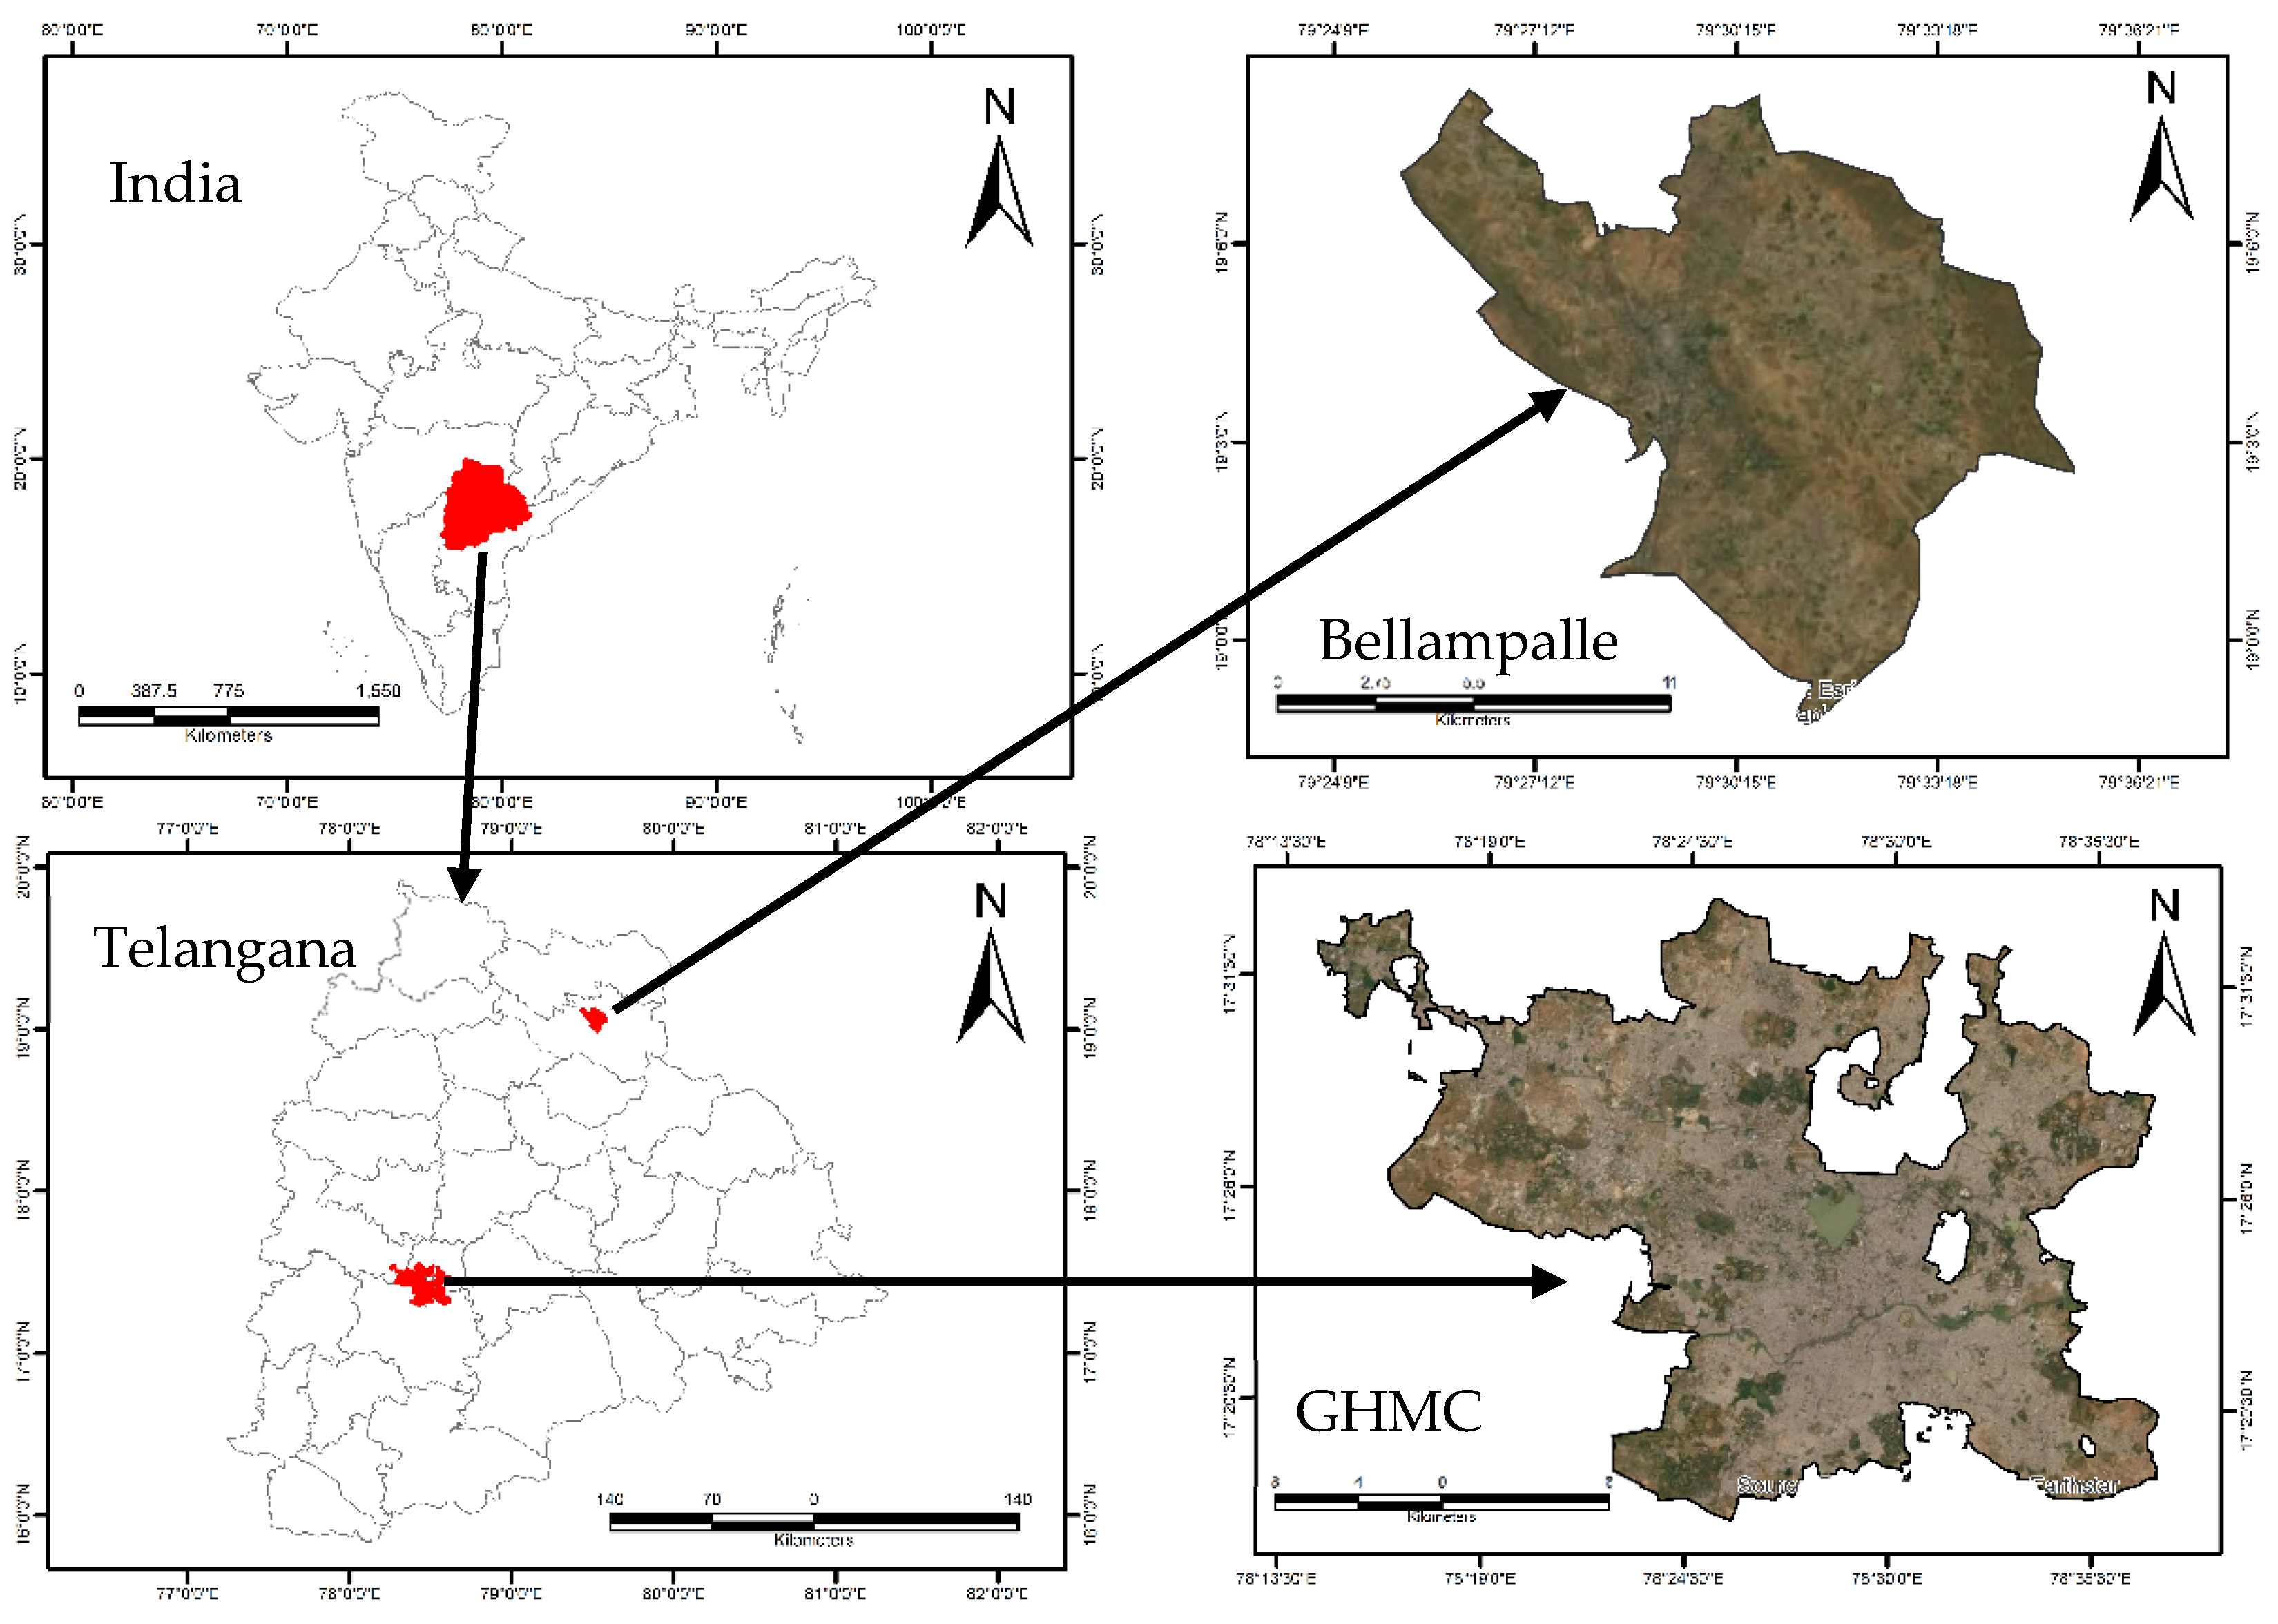
2. Study Area
2.1. Greater Hyderabad Municipal Corporation (GHMC)
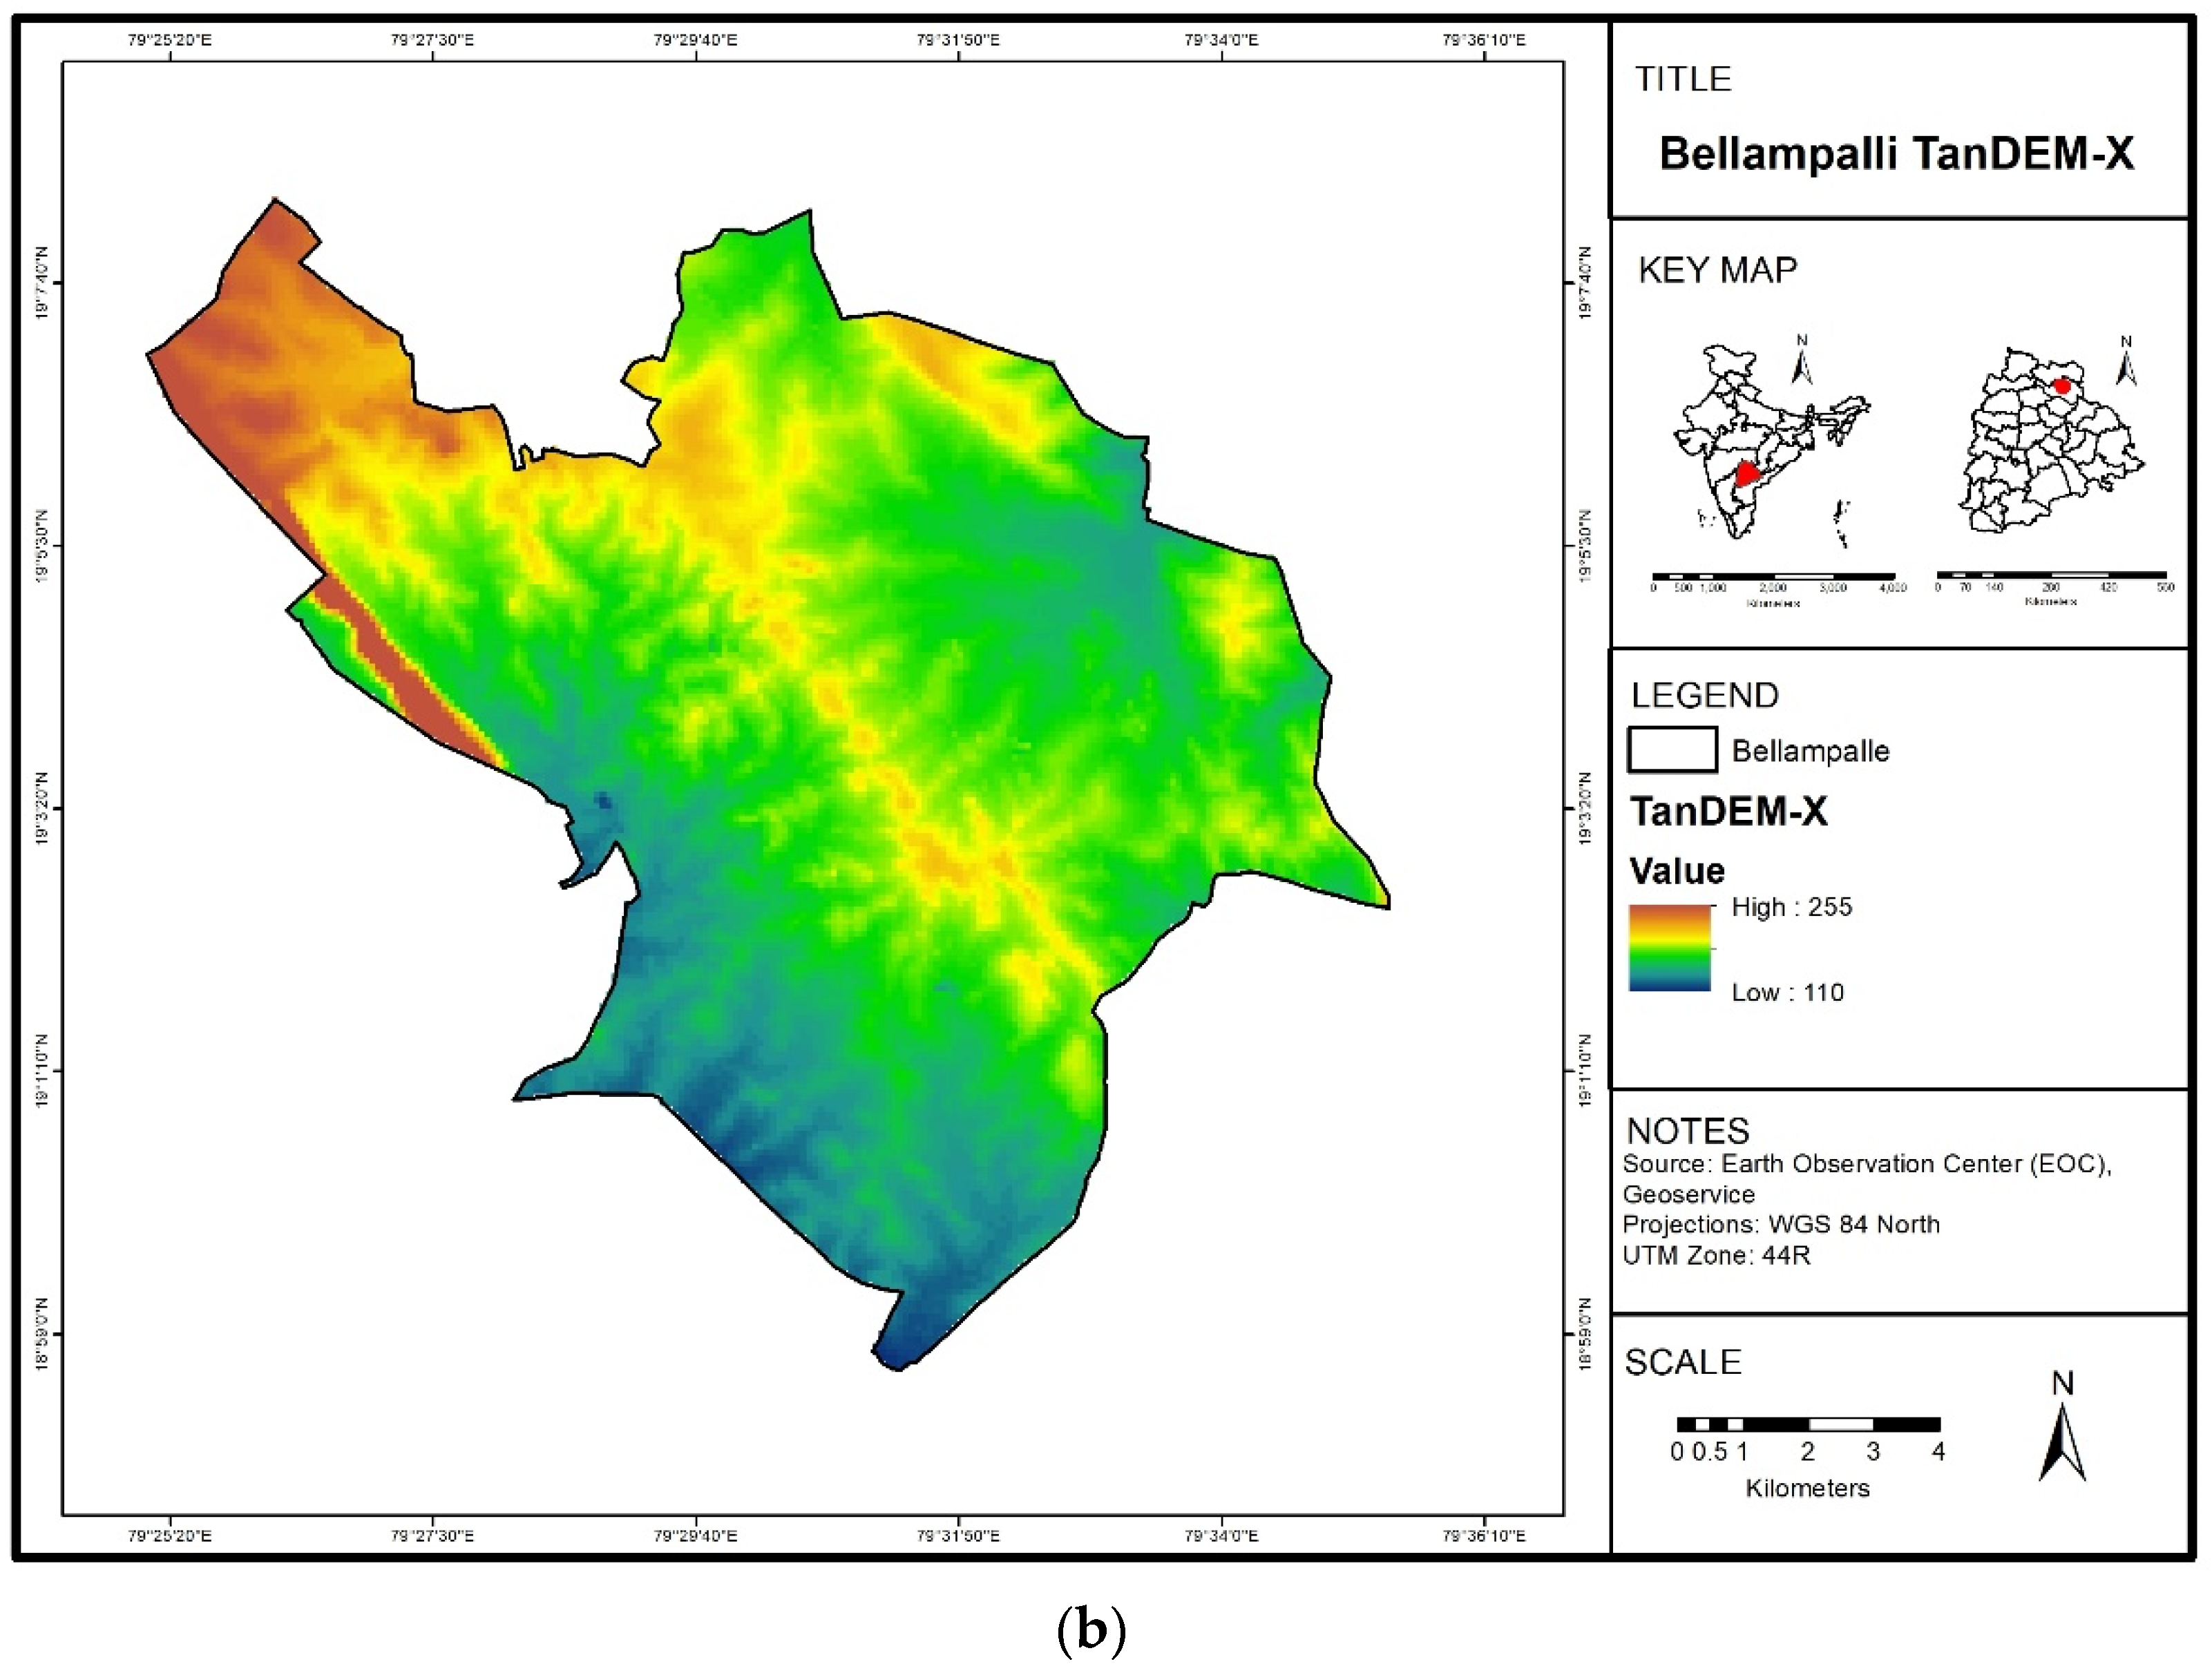
2.2. Bellampalli Mandal
3. Materials and Methods
3.1. Digital Elevation Model
3.2. CARTOSAT-1 Mission
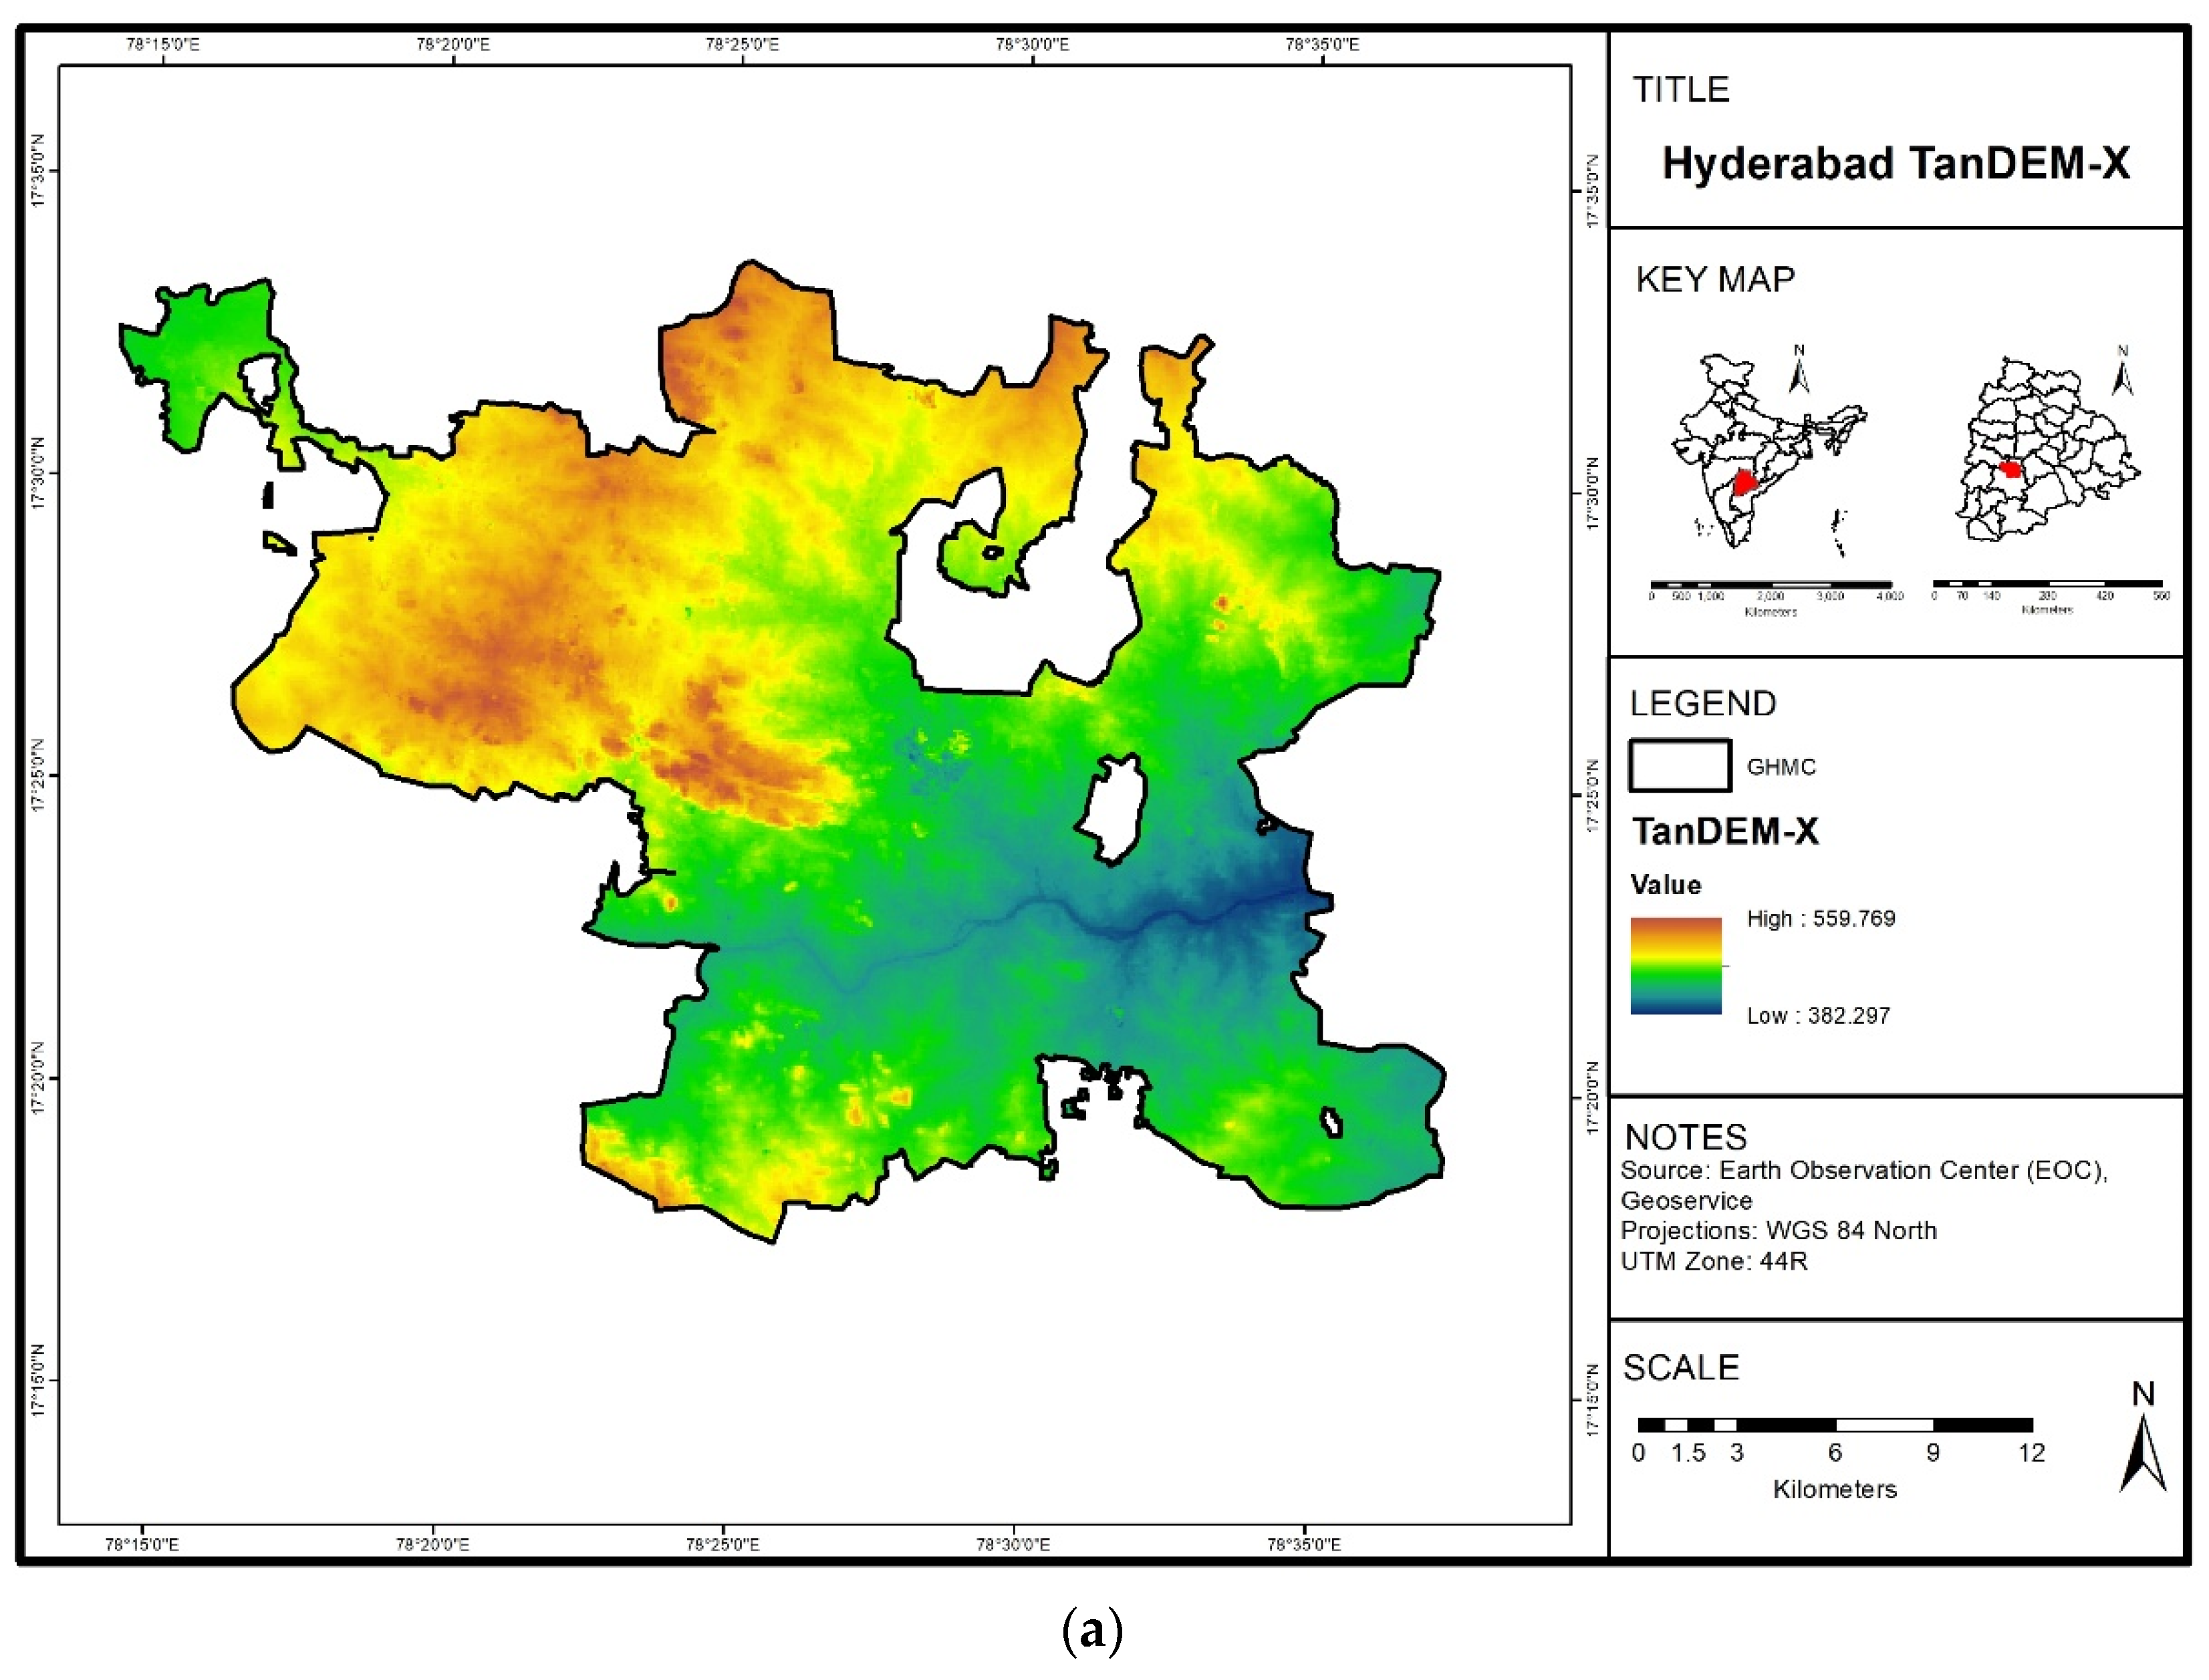
3.3. TanDEM-X DEM
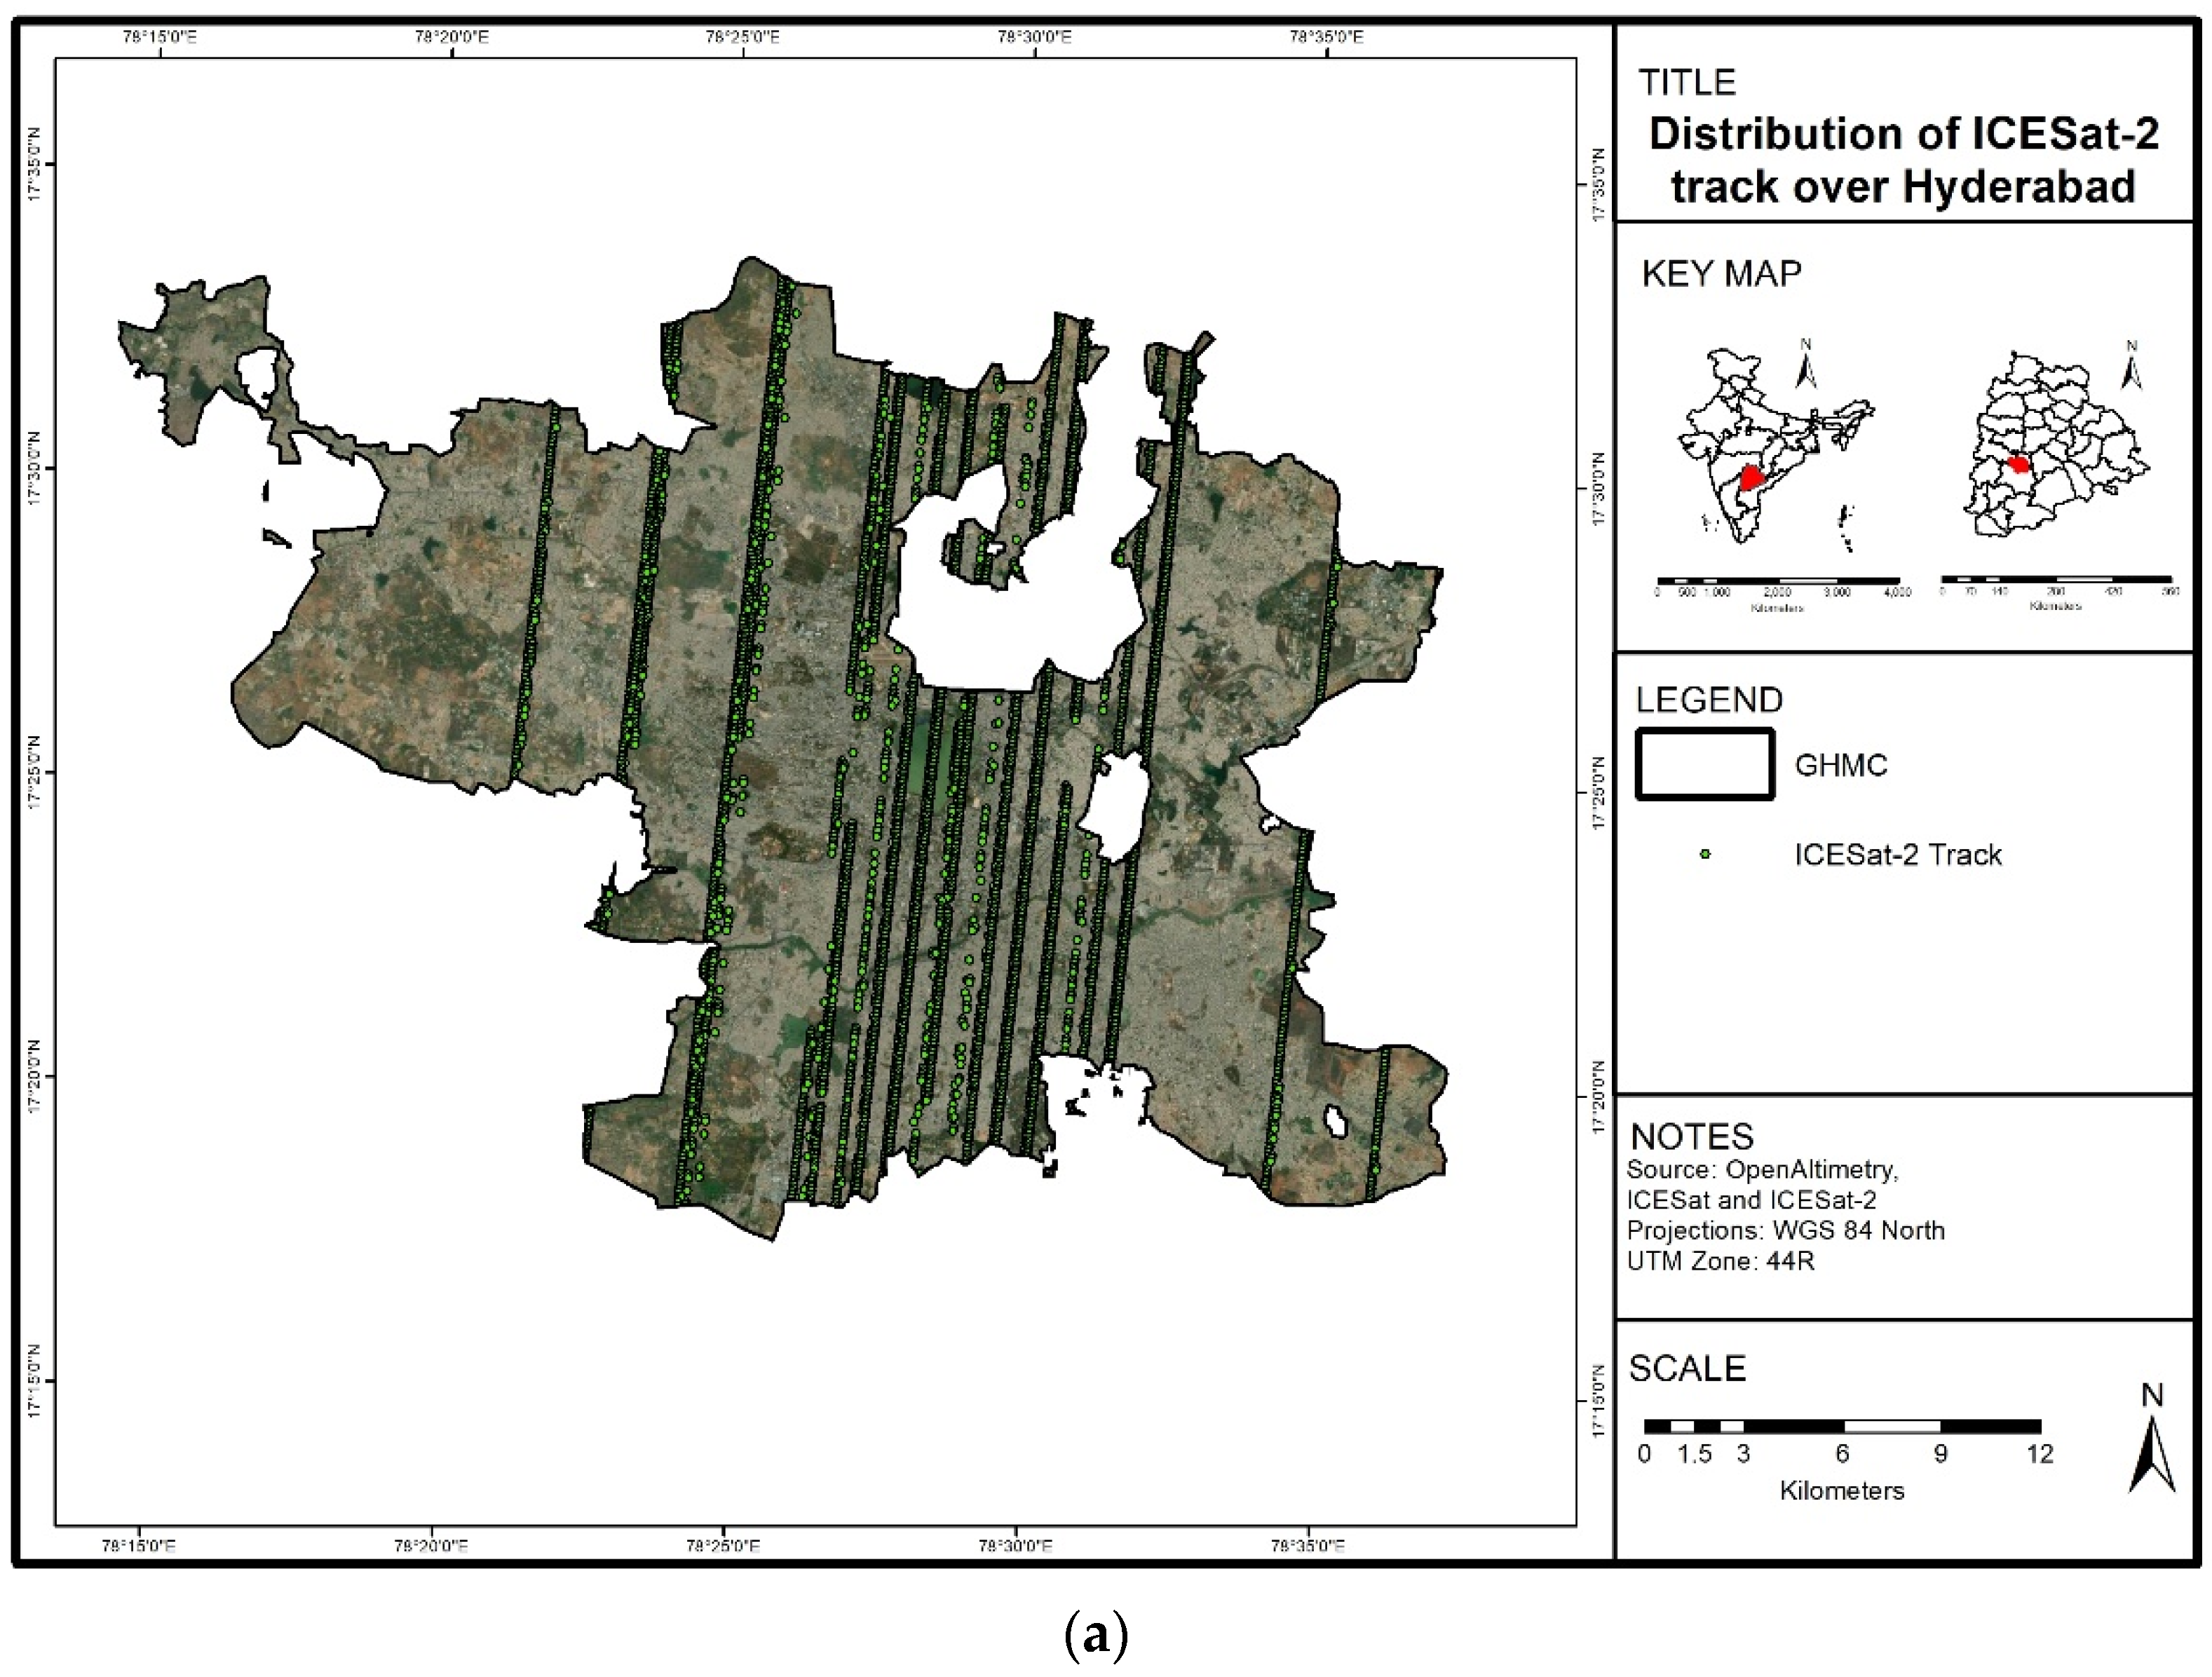
3.4. ICESat-2
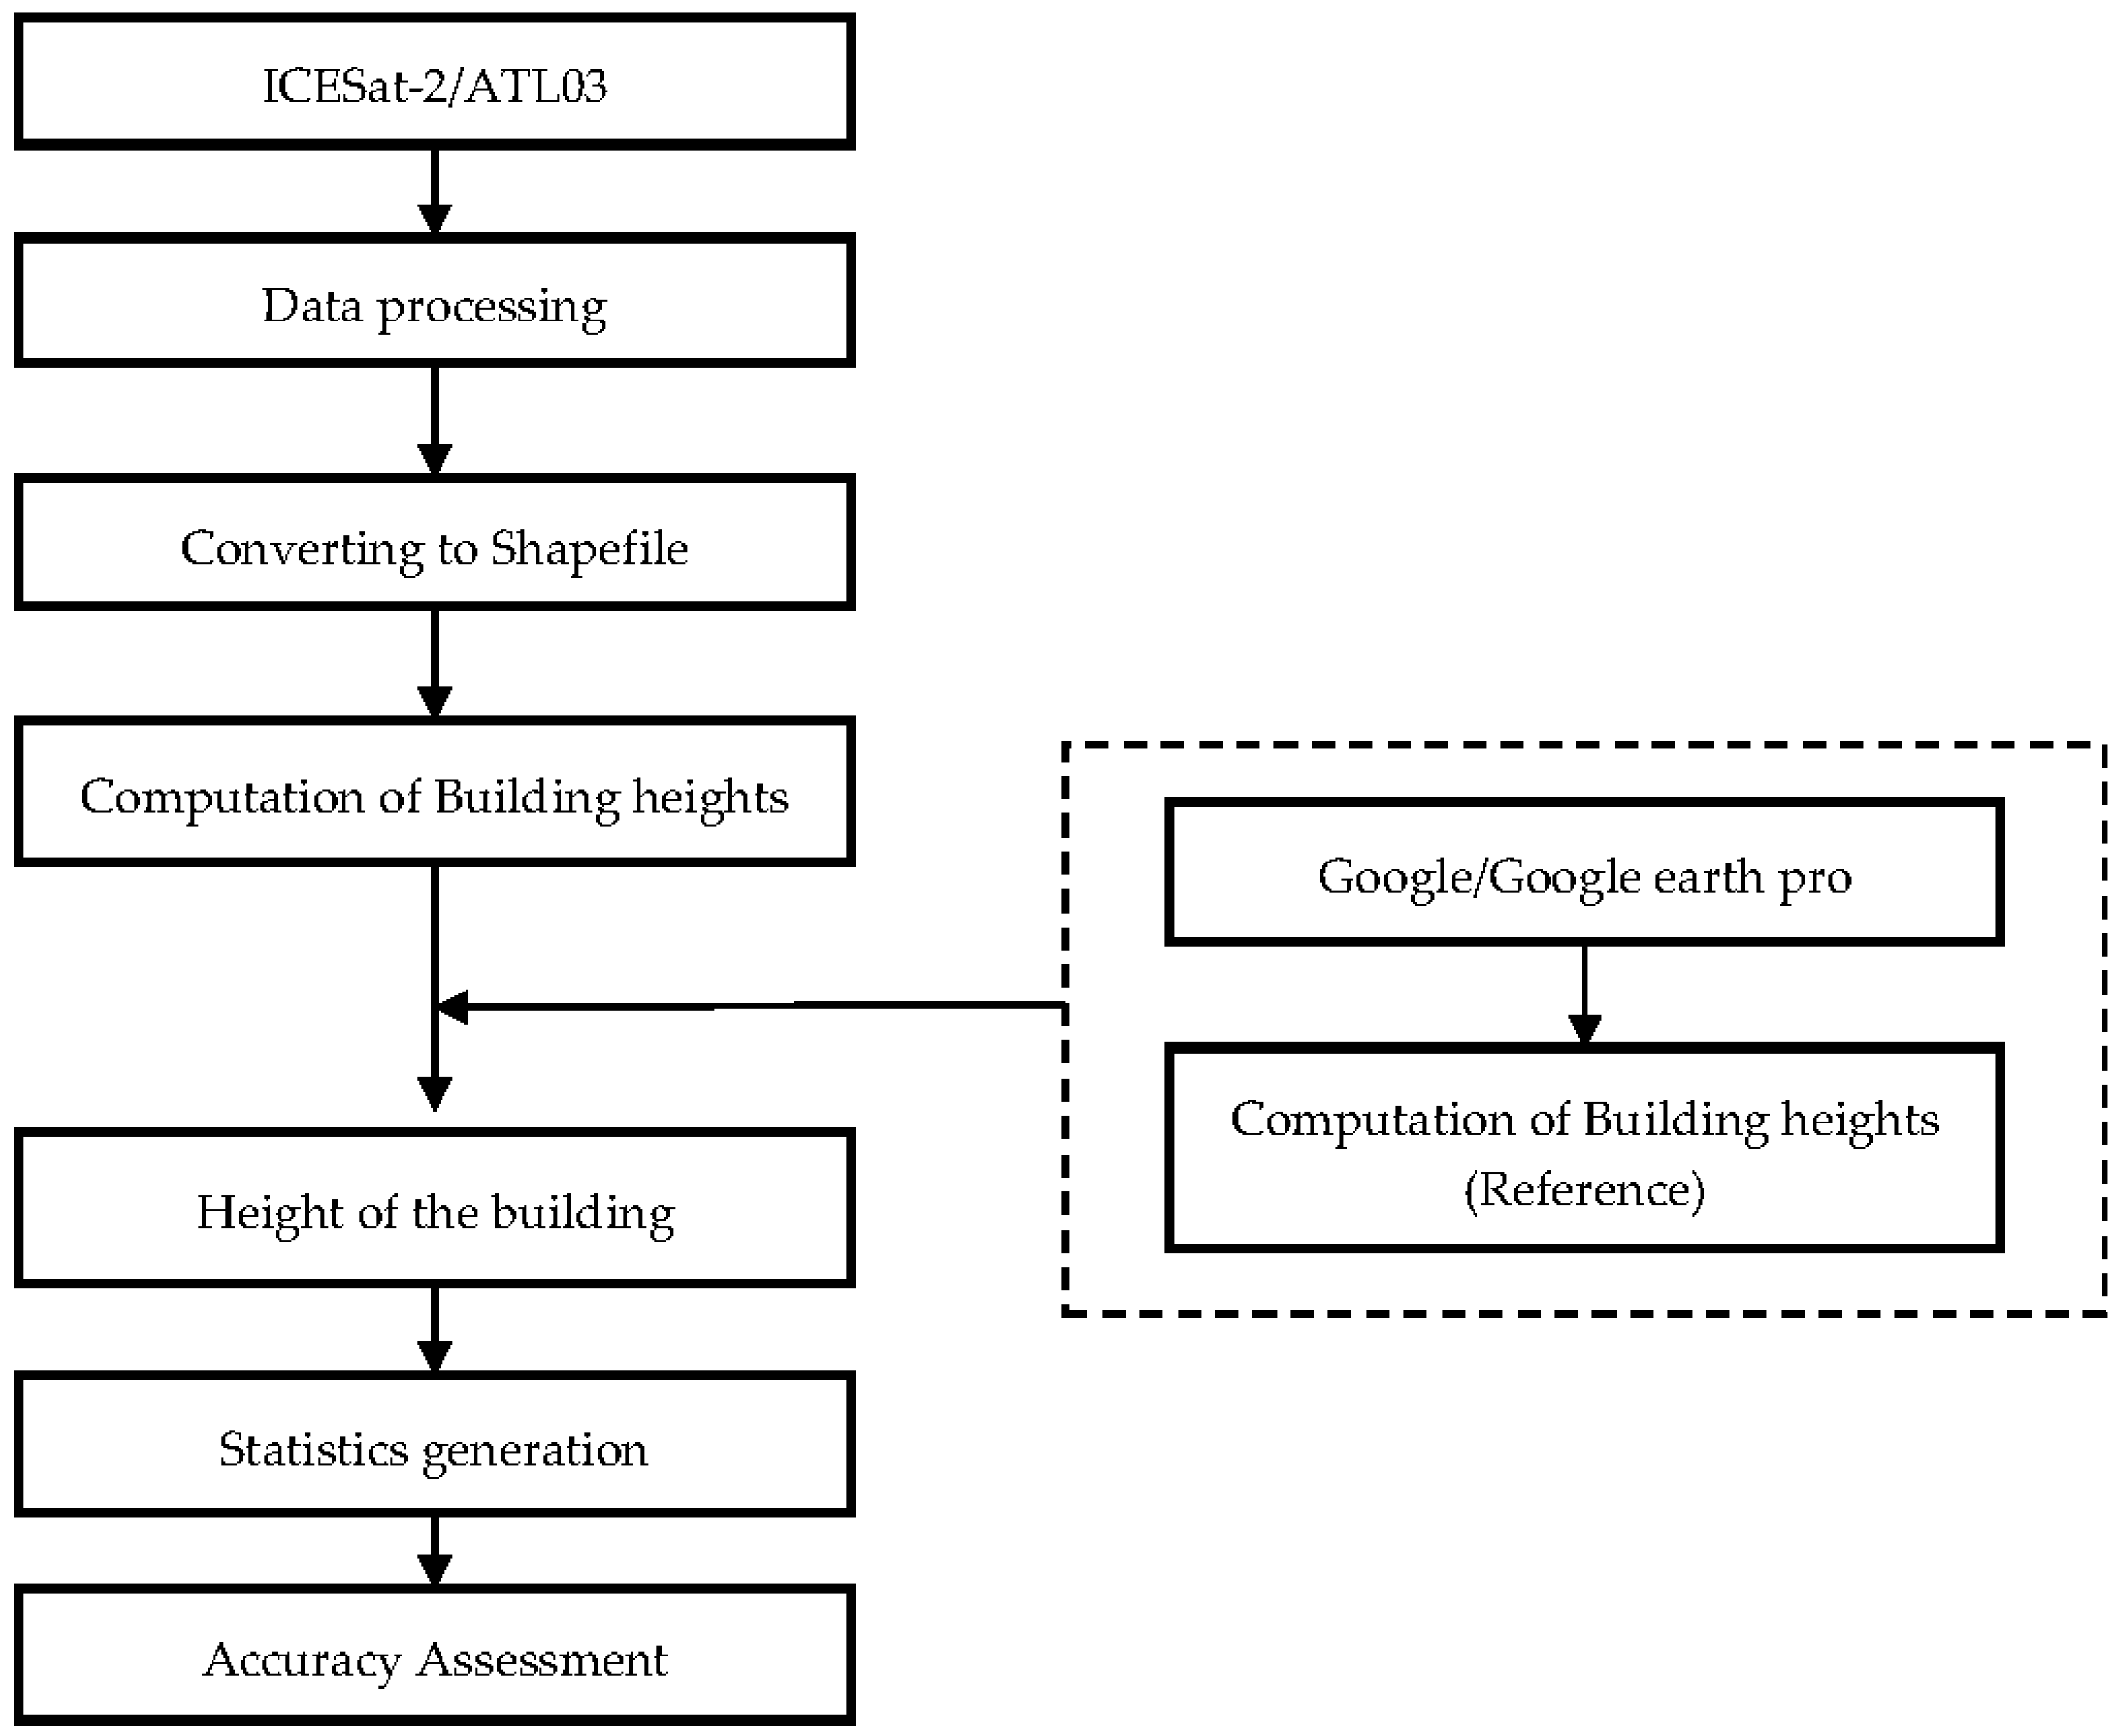
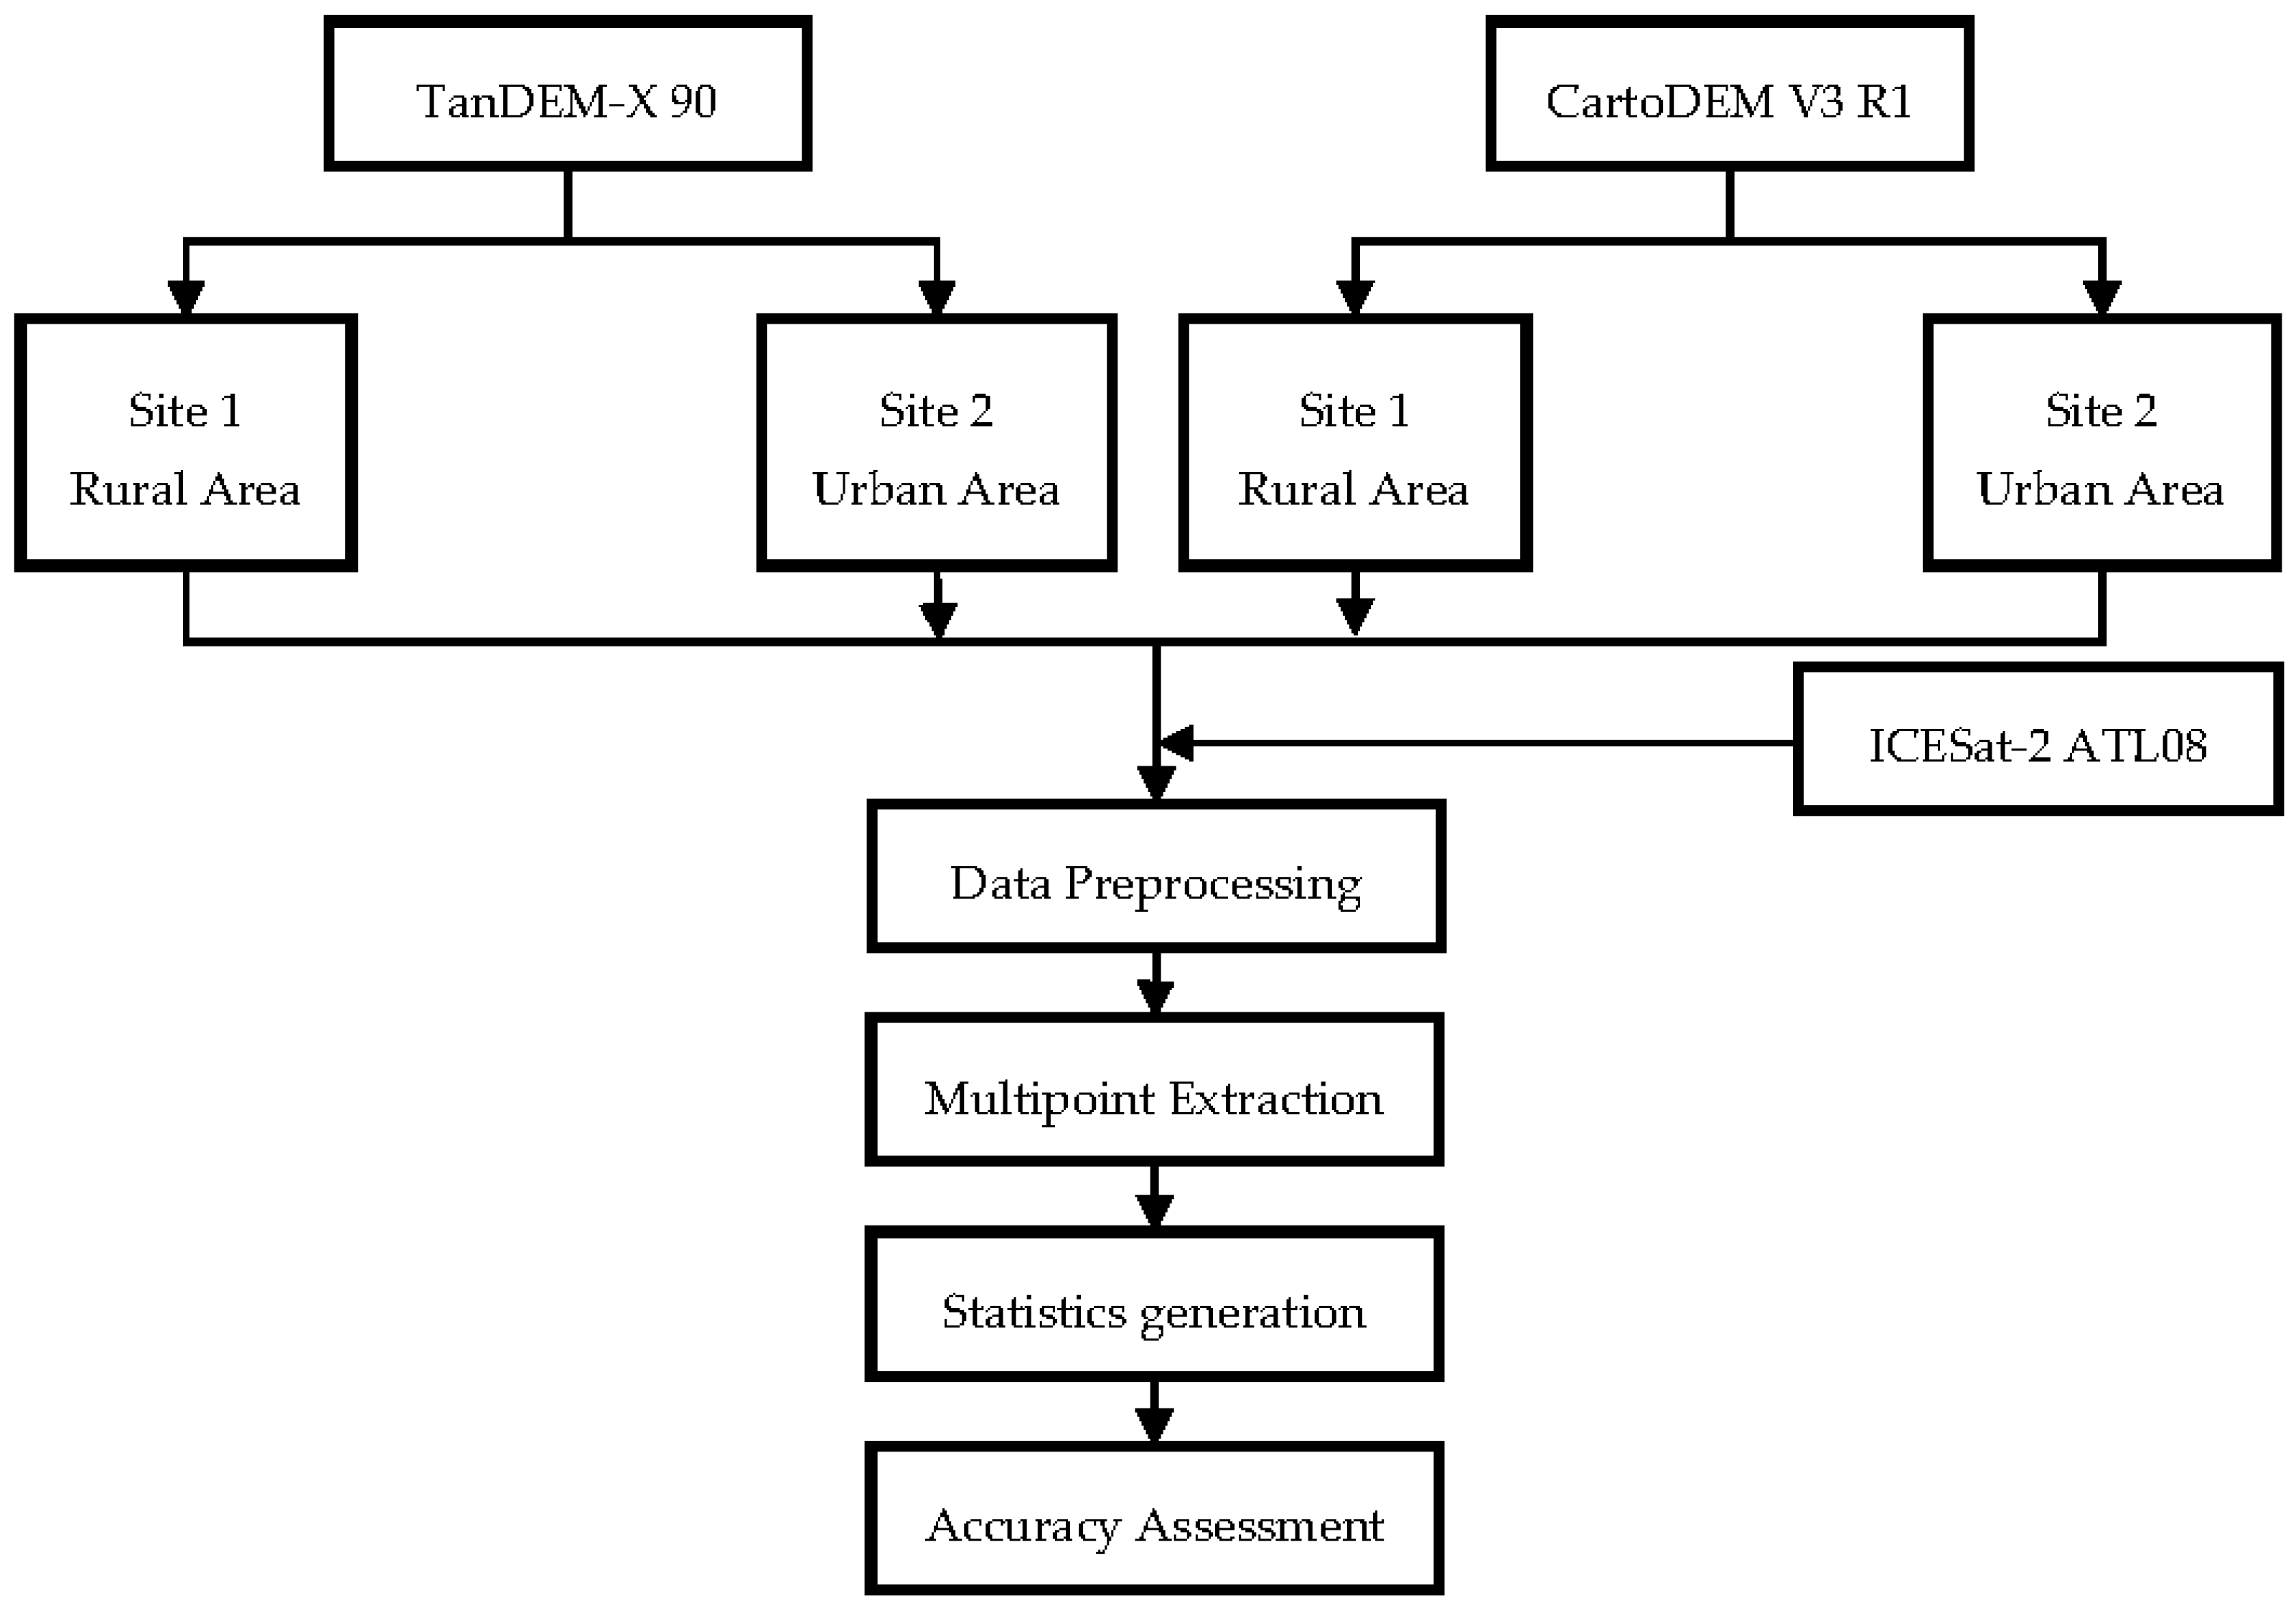
3.5. Methodology
4. Results and Discussion
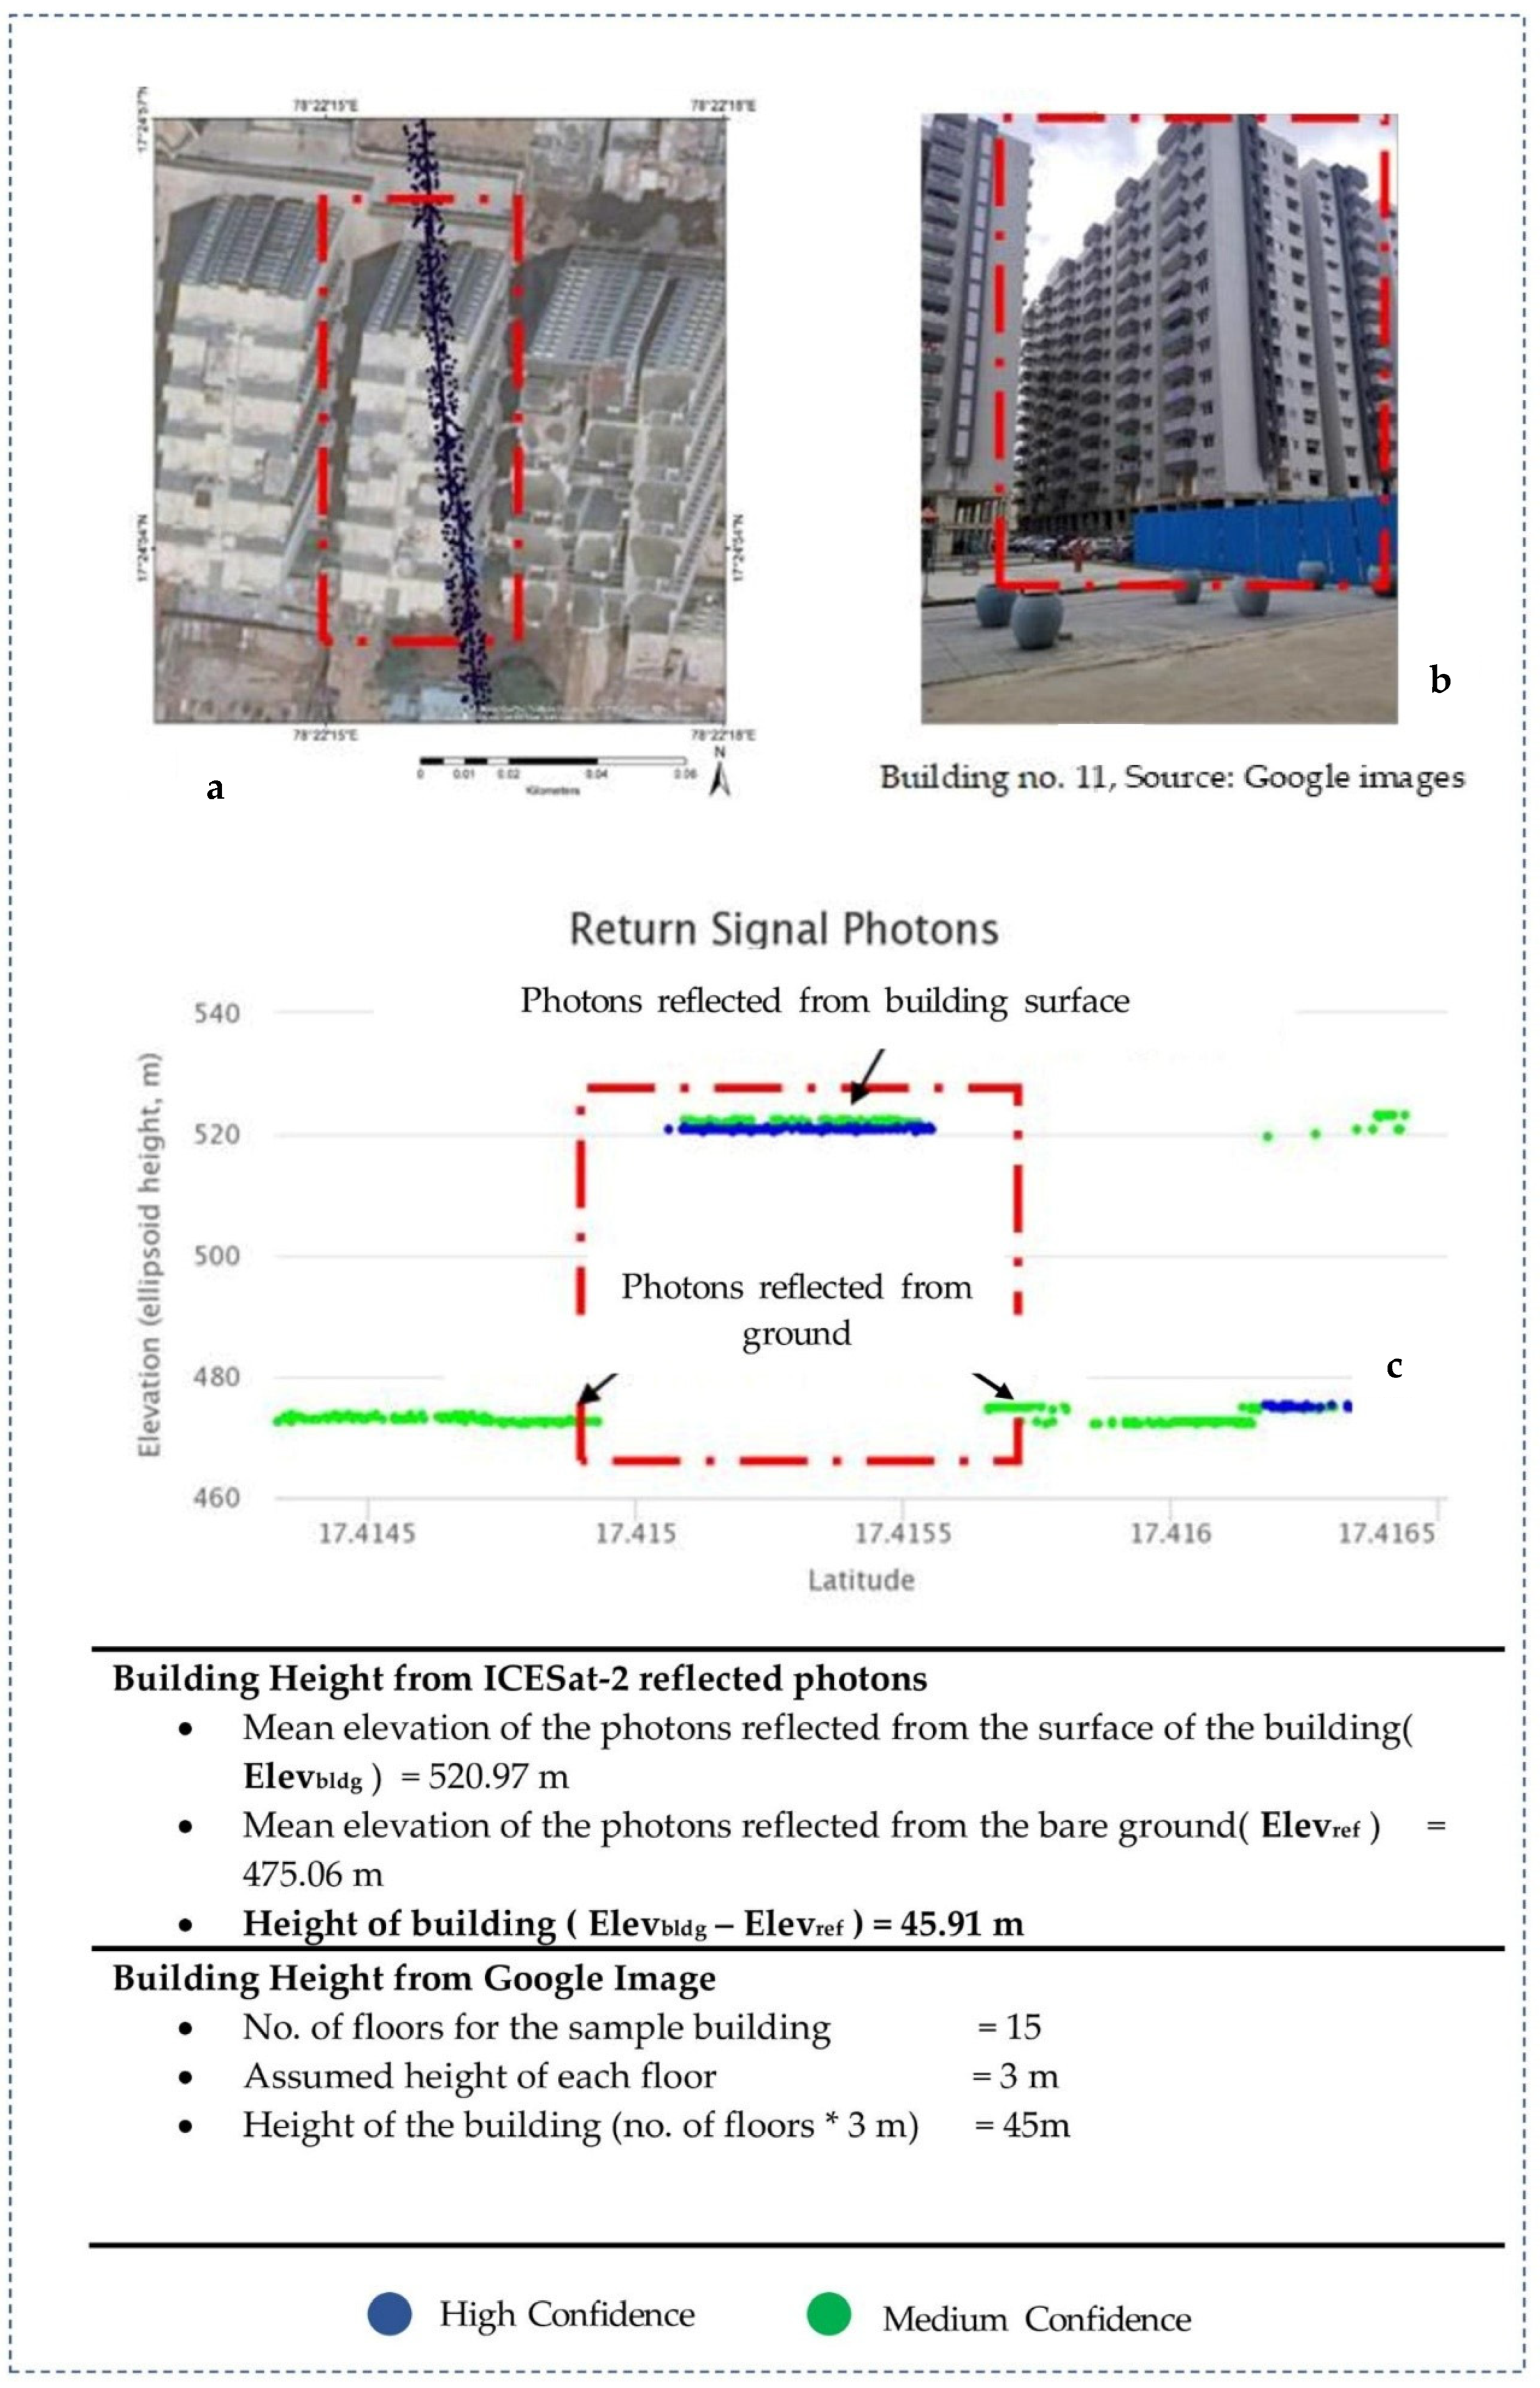
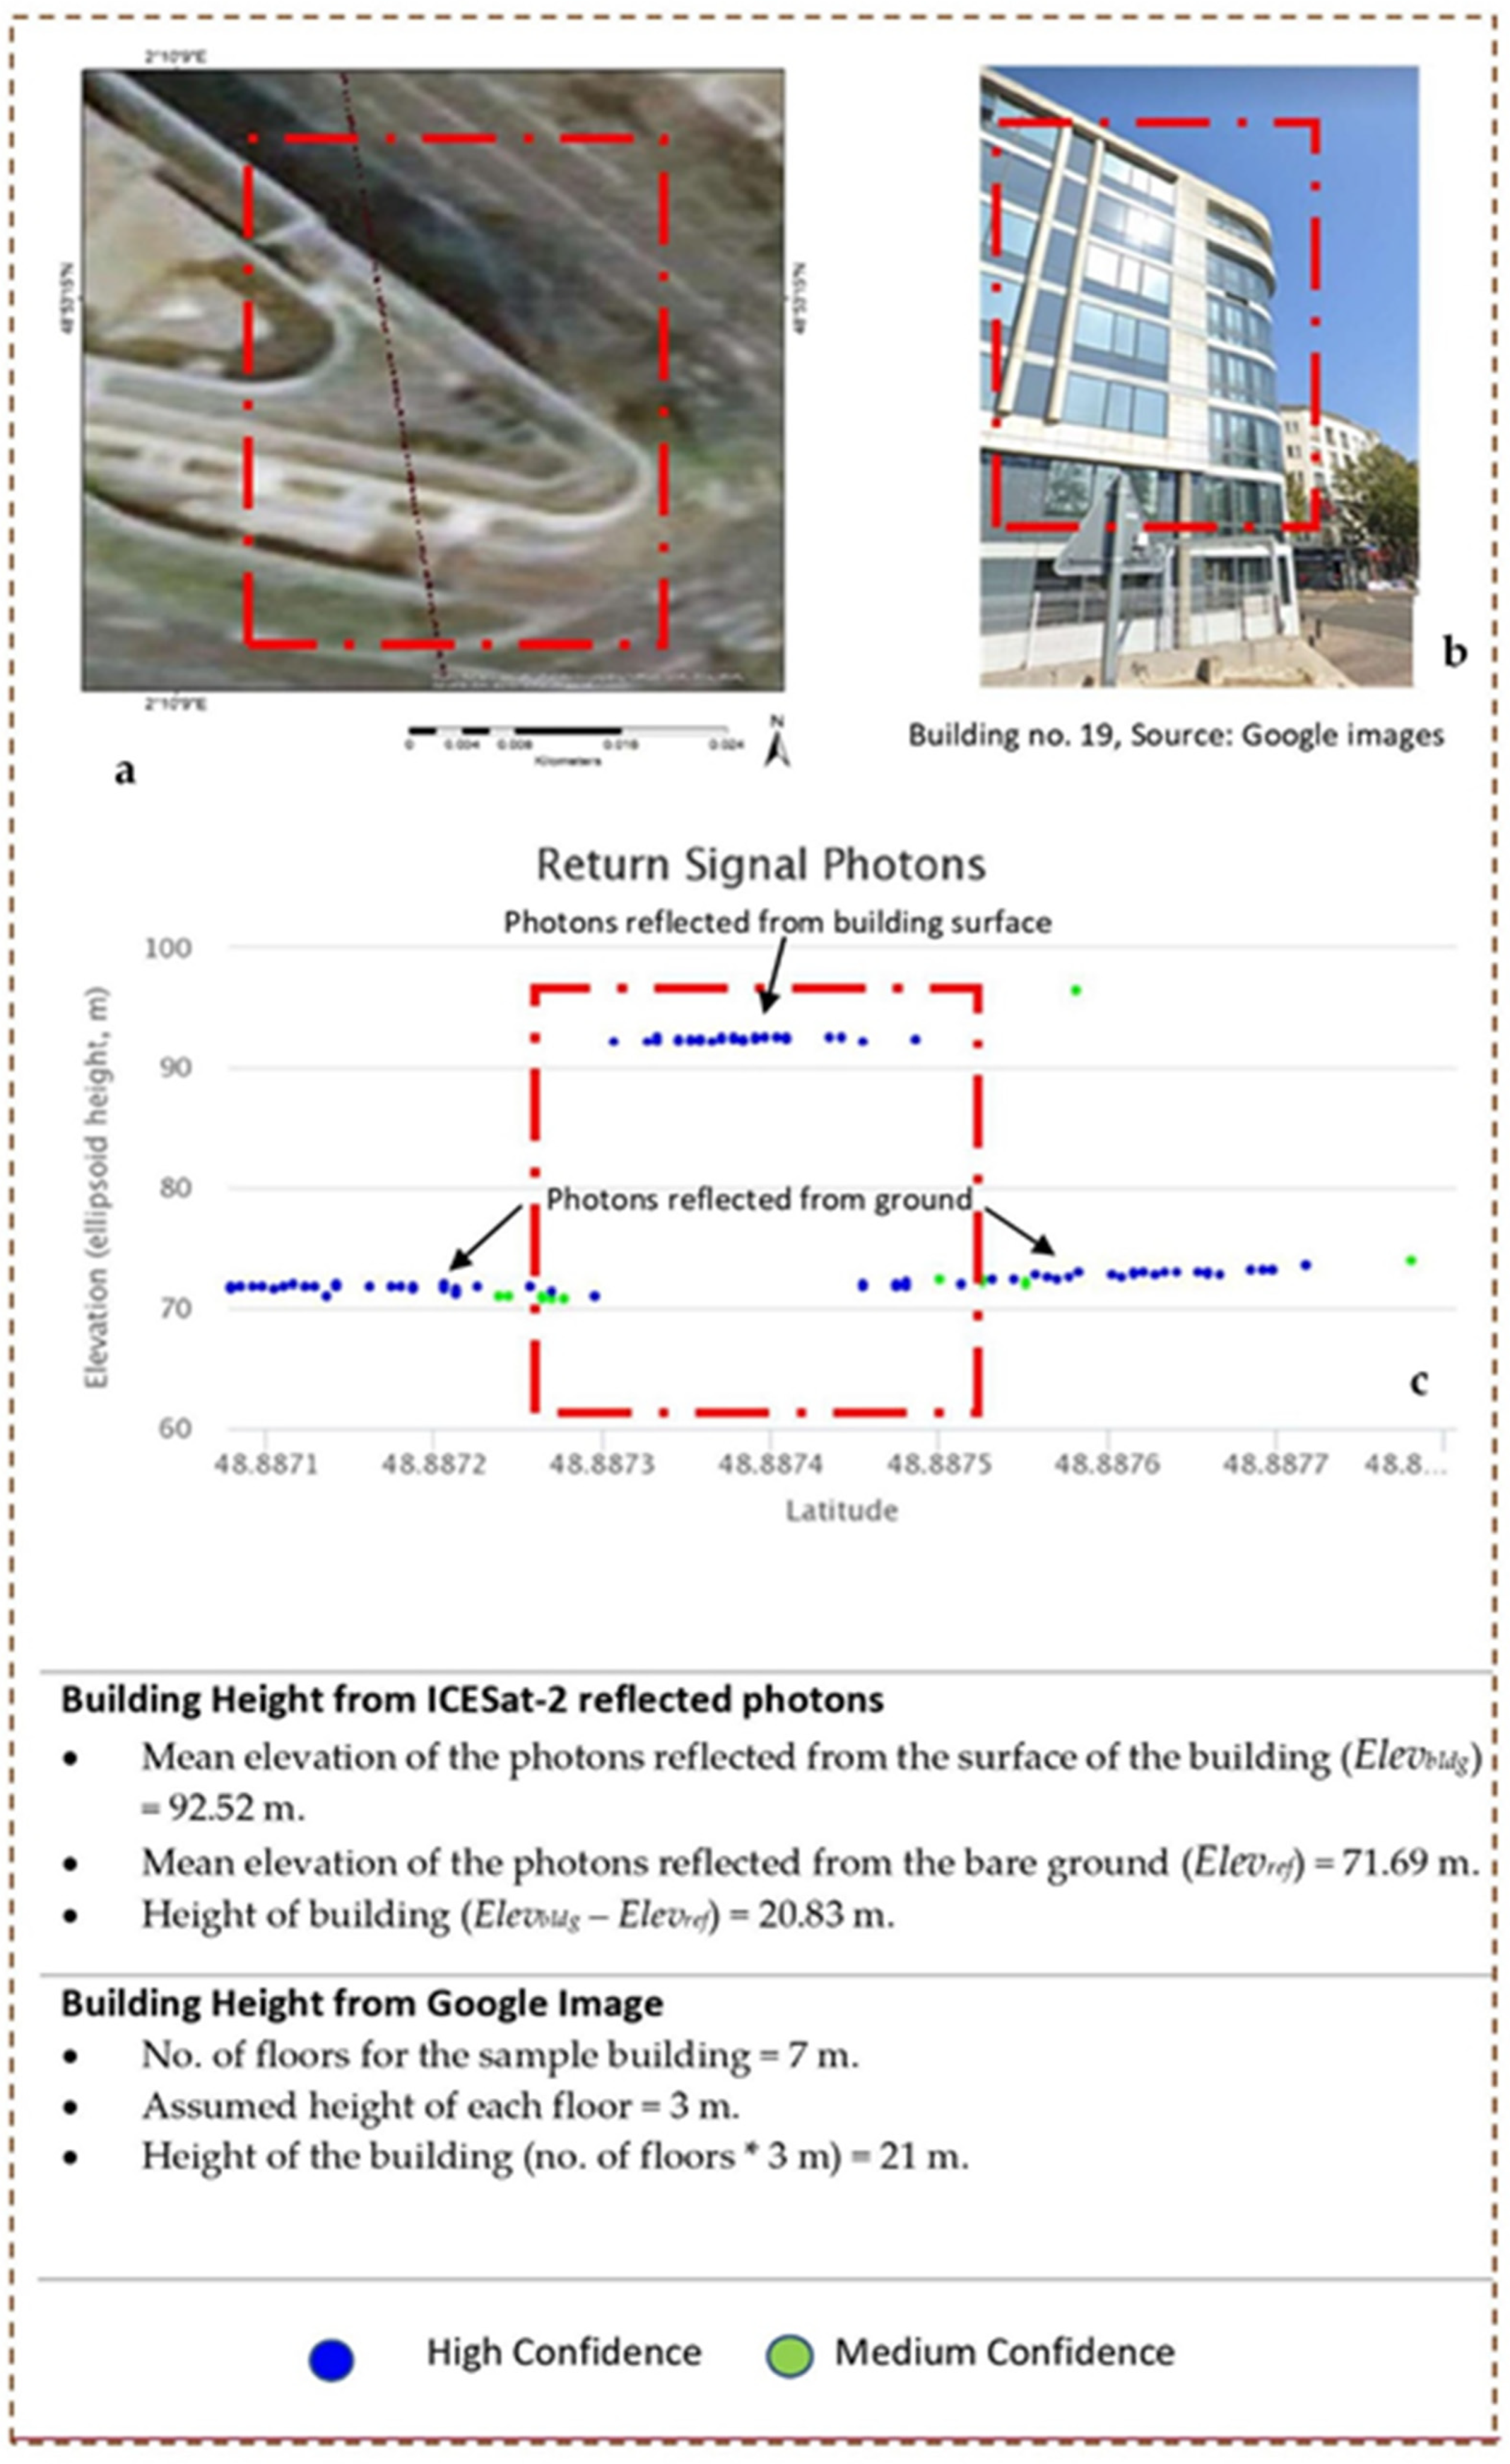
4.1. Building Height Estimation
4.2. DEM Accuracy Assessment
5. Conclusions
Funding
Institutional Review Board Statement
Informed Consent Statement
Data Availability Statement
Acknowledgments
Conflicts of Interest
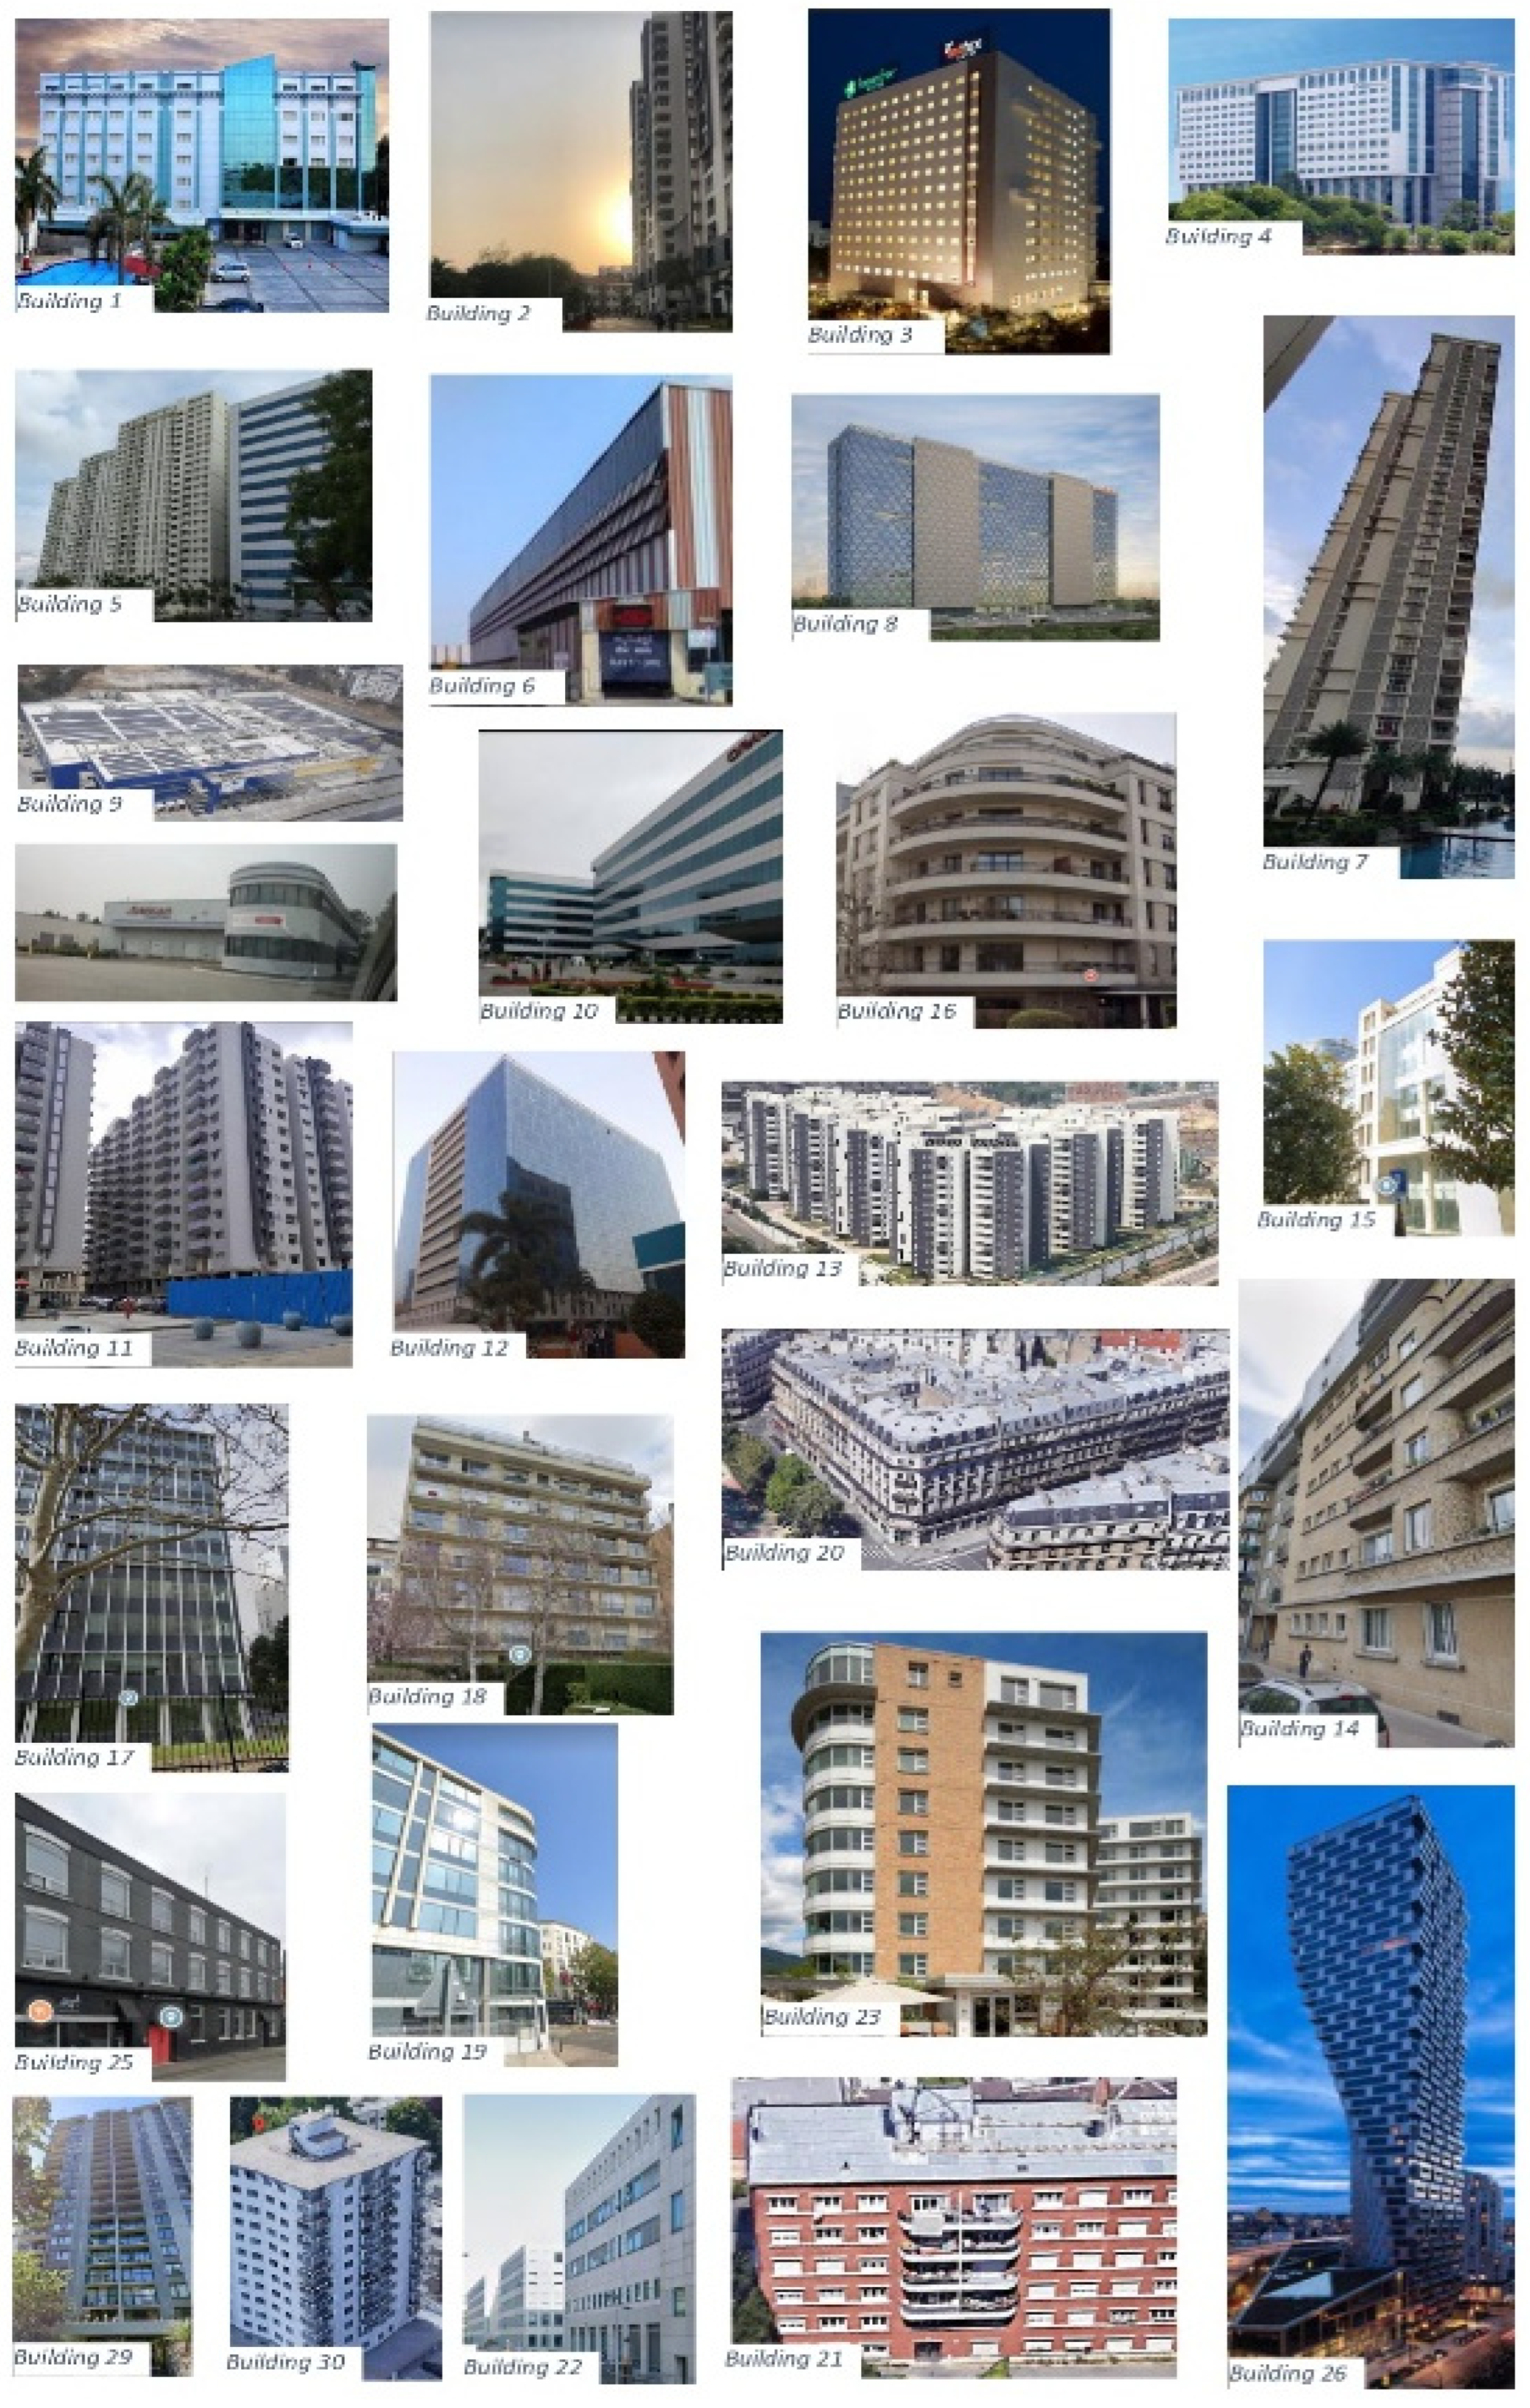
Appendix A. Sample Buildings for Building Height Estimation
References
- Gianinetto, M.; Milano, P.; Leonardo, P.; Vinci, D. Multi-Scale Digital Terrain Model Generation Using Cartosat-1 Stereo Images for the Mausanne Les Alpilles Test Site. Archives 2006, 9, 1331–1336. [Google Scholar]
- Winograd, M. Environmental Indicators for Latin America and the Caribbean: Toward Land-Use Sustainability; IICA-GTZ Project; Inter-American Institute for Cooperation on Agriculture: Washington, DC, USA, 1995; p. 83. [Google Scholar]
- Srivastava, P.K.; Srinivasan, T.P.; Gupta, A.; Singh, S.; Nain, J.S.; Prakash, S.; Kartikeyan, B.; Krishna, B.G. Recent Advances in Cartosat-1 Data Processing. ISPRS Hannover Workshop. May 2005. Available online: https://www.isprs.org/proceedings/XXXVI/1-W51/paper/Srivastava_etal.pdf (accessed on 11 August 2021).
- Rao, C.V.; Sathyanarayana, P.; Jain, D.S.; Manjunath, A.S. Topographic map updation using Cartosat-1 data. In Proceedings of the RSPSoc Annual Conference 2007, Nottingham, UK, 11–14 September 2007; pp. 1–5. [Google Scholar]
- Liu, Z.; Zhu, J.; Fu, H.; Zhou, C.; Zuo, T. Evaluation of the vertical accuracy of open global dems over steep terrain regions using icesat data: A case study over hunan province, china. Sensors 2020, 20, 4865. [Google Scholar] [CrossRef]
- Bhardwaj, A. Quality Assessment of Openly Accessible Fused EarthEnvDEM90 DEM and its comparison with MERIT DEM using Ground Control Points for Diverse Topographic Regions. In MOL2NET, International Conference Series on Multidisciplinary Sciences; USINEWS-04: US-IN-EU Worldwide Science Workshop Series; UMN: Duluth, MN, USA, 2020; pp. 1–8. Available online: https://sciforum.net/paper/view/conference/6855 (accessed on 15 May 2020).
- Krishnan, S.; Sajikumar, N.; Sumam, K.S. DEM Generation Using Cartosat-I Stereo Data and its Comparison with Publically Available DEM. Procedia Technol. 2016, 24, 295–302. [Google Scholar] [CrossRef] [Green Version]
- Bhardwaj, A. Assessment of Vertical Accuracy for TanDEM-X 90 m DEMs in Plain, Moderate, and Rugged Terrain. Proceedings 2019, 24, 8. [Google Scholar] [CrossRef] [Green Version]
- Ventura, S.J.; Grams, S.A.; Wechsler, S.P. Perceptions of Digital Elevation Model Uncertainty by DEM Users. Urban Reg. Inf. Syst. Assoc. 2003, 15, 57–64. [Google Scholar]
- Kay, S.; Zielinski, R. Orthorectification and geometric quality assessment of Cartosat-1 for common agricultural policy monitoring. Int. Arch. Photogramm. Remote Sens. Spat. Inf. Sci. 2006, 36, 6. [Google Scholar]
- Avtar, R.; Sawada, H. Use of DEM data to monitor height changes due to deforestation. Arab. J. Geosci. 2013, 6, 4859–4871. [Google Scholar] [CrossRef]
- Kumar, T.S.; Mahendra, R.S.; Nayak, S.; Radhakrishnan, K.; Sahu, K.C. Coastal vulnerability assessment for Orissa State, East Coast of India. J. Coast. Res. 2010, 26, 523–534. [Google Scholar] [CrossRef]
- Fereshtehpour, M.; Karamouz, M. DEM Resolution Effects on Coastal Flood Vulnerability Assessment: Deterministic and Probabilistic Approach. Water Resour. Res. 2018, 54, 4965–4982. [Google Scholar] [CrossRef]
- Case, B.S.; Meng, F.R.; Arp, P.A. Digital elevation modelling of soil type and drainage within small forested catchments. Can. J. Soil Sci. 2005, 85, 127–137. [Google Scholar] [CrossRef] [Green Version]
- Bandyopadhyay, S.; Srivastava, S.K.; Jha, M.K.; Hegde, V.S.; Jayaraman, V. Harnessing earth observation (EO) capabilities in hydrogeology: An Indian perspective. Hydrogeol. J. 2007, 15, 155–158. [Google Scholar] [CrossRef]
- Singh, P.; Gupta, A.; Singh, M. Hydrological inferences from watershed analysis for water resource management using remote sensing and GIS techniques. Egypt. J. Remote Sens. Space Sci. 2014, 17, 111–121. [Google Scholar] [CrossRef] [Green Version]
- Pandya, M.R. Estimation of aerosol optical thickness over land using dual angle panchromatic data. Remote Sens. Atmos. Clouds 2006, 6408, 64080X. [Google Scholar] [CrossRef]
- Murphy, P.N.C.; Ogilvie, J.; Arp, P. Topographic modelling of soil moisture conditions: A comparison and verification of two models. Eur. J. Soil Sci. 2009, 60, 94–109. [Google Scholar] [CrossRef]
- Rajani, M.B. The expanse of archaeological remains at Nalanda: A study using remote sensing and GIS. Arch. Asian Art 2016, 66, 1–23. [Google Scholar] [CrossRef]
- van Persie, M.; Noorbergen, H.H.S.; van den Broek, A.C.; Dekker, R.J. Use of Remote Sensing Imagery for Fast Generation of Military Maps and Simulator Databases. Simulation 2000, XXXIII, 573–581. [Google Scholar]
- Florinsky, I.V. Digital Terrain Analysis in Soil Science and Geology. Digit. Terrain Anal. Soil Sci. Geol. 2012, 31–41. [Google Scholar] [CrossRef]
- Yang, X.; Wang, C.; Xi, X.; Wang, P.; Lei, Z.; Ma, W.; Nie, S. Extraction of Multiple Building Heights Using ICESat/GLAS Full-Waveform Data Assisted by Optical Imagery. IEEE Geosci. Remote Sens. Lett. 2019, 16, 1914–1918. [Google Scholar] [CrossRef]
- Dandabathula, G.; Sitiraju, S.R.; Jha, C.S. Retrieval of building heights from ICESat-2 photon data and evaluation with field measurements. Environ. Res. Infrastruct. Sustain. 2021, 1, 011003. [Google Scholar] [CrossRef]
- Why Satellites Are the Future of Urban Planning|Earth-i. Available online: https://earthi.space/blog/future-urban-planning/ (accessed on 19 July 2021).
- Bande, S.; Shete, V.V. Smart flood disaster prediction system using IoT & neural networks. In Proceedings of the 2017 International Conference on Smart Technologies for Smart Nation (SmartTechCon), Bengaluru, India, 17–19 August 2017; pp. 189–194. [Google Scholar] [CrossRef]
- Sonde, P.; Balamwar, S.; Ochawar, R.S. Urban sprawl detection and analysis using unsupervised classification of high resolution image data of Jawaharlal Nehru Port Trust area in India. Remote Sens. Appl. Soc. Environ. 2020, 17, 100282. [Google Scholar] [CrossRef]
- Hegazy, I.R.; Kaloop, M.R. Monitoring urban growth and land use change detection with GIS and remote sensing techniques in Daqahlia governorate Egypt. Int. J. Sustain. Built Environ. 2015, 4, 117–124. [Google Scholar] [CrossRef] [Green Version]
- Jagadish, K. Urban Sprawl Pattern Recognition and Modeling Using GIS. 2014. Available online: https://www.researchgate.net/publication/237816205 (accessed on 19 July 2021).
- Jat, M.K.; Garg, P.K.; Khare, D. Monitoring and modelling of urban sprawl using remote sensing and GIS techniques. Int. J. Appl. Earth Obs. Geoinf. 2008, 10, 26–43. [Google Scholar] [CrossRef]
- Li, Z.; Zhu, Q.; Gold, C. Digital Terrain Modeling: Principles and Methodology; CRC Press: Boca Raton, FL, USA, 2005. [Google Scholar]
- USGS. What Is a Digital Elevation Model (DEM)? Usgs. 2021. Available online: https://www.usgs.gov/faqs/what-a-digital-elevation-model-dem?qt-news_science_products=0#qt-news_science_products (accessed on 5 August 2021).
- Bhardwaj, A.; Jain, K.; Chatterjee, R.S. Generation of high-quality digital elevation models by assimilation of remote sensing-based DEMs. J. Appl. Remote Sens. 2019, 13, 1. [Google Scholar] [CrossRef]
- Murthy, Y.V.N.K.; Rao, S.S.; Rao, D.S.P.; Jayaraman, V. Analysis of DEM generated using Cartosat-1 stereo data over Mausanne Les Alpiles–Cartosat scientific appraisal programme (CSAP TS-5). Int. Arch. Photogramm. Remote Sens. Spat. Inf. Sci. 2008, 37, 1–6. [Google Scholar]
- Muralikrishnan, S.; Narender, B.; Reddy, S.; Pillai, A. Evaluation of Indian national DEM from Cartosat-1 data. Indian Space Res. Organ. 2011, 1, 1–19. [Google Scholar]
- TDX (TanDEM-X)—eoPortal Directory—Satellite Missions. eoPortal Directory. 2021. Available online: https://earth.esa.int/web/eoportal/satellite-missions/t/tandem-x#SG9SE1157Herb (accessed on 19 August 2021).
- Grohmann, C.H. Evaluation of TanDEM-X DEMs on selected Brazilian sites: Comparison with SRTM, ASTER GDEM and ALOS AW3D30. Remote Sens. Environ. 2018, 212, 121–133. [Google Scholar] [CrossRef] [Green Version]
- Markus, T.; Neumann, T.; Martino, A.; Abdalati, W.; Brunt, K.; Csatho, B.; Farrell, S.; Fricker, H.; Gardner, A.; Harding, D.; et al. The Ice, Cloud, and land Elevation Satellite-2 (ICESat-2): Science requirements, concept, and implementation. Remote Sens. Environ. 2017, 190, 260–273. [Google Scholar] [CrossRef]
- Data Products|ICESat-2. Available online: https://icesat-2.gsfc.nasa.gov/science/data-products (accessed on 21 August 2021).
- Neuenschwander, A.L.; Magruder, L.A. Canopy and Terrain Height Retrievals with ICESat-2: A First Look. Remote Sens. 2019, 11, 1721. [Google Scholar] [CrossRef] [Green Version]
- Neuenschwander, A.; Pitts, K. The ATL08 land and vegetation product for the ICESat-2 Mission. Remote Sens. Environ. 2019, 221, 247–259. [Google Scholar] [CrossRef]
- Height of a 9-Storey Building in Meters, from Which SNiP Norms are Added. Available online: https://myhouse-en.desigusxpro.com/normy/vysota-9-etazhnogo-doma (accessed on 31 October 2021).
- Percentage Error—Formula, How to Calculate and Solved Examples. Available online: https://www.vedantu.com/maths/percentage-error (accessed on 12 June 2021).
- Deo, R.; Jain, M.; Rao, Y.S. Comparison of TanDEM-X and Cartosat-1 Stereo DEMs Over Different Terrains of India. In Proceedings of the 2016 IEEE International Geoscience and Remote Sensing Symposium (IGARSS), Beijing, China, 10–15 July 2016; Centre of Studies in Resources Engineering, Indian Institute of Technology Bombay: Mumbai, India, 2016; pp. 6484–6487. [Google Scholar]


| Place | Building. No. | Track Id/Beam Id/Date of Acquisition | Building Position on the Beam (Lat., Long.) |
|---|---|---|---|
| Hyderabad | 1 | t1148/gt3l/2020-12-08 | 17.4390056, 78.4751239 |
| 2 | t653/gt2r/2020-02-07 | 17.4631615, 78.3737838 | |
| 3 | t653/gt1r/2021-02-04 | 17.4430168, 78.3768220 | |
| 4 | t1148/gt2r/2019-06-12 | 17.4371660, 78.4828767 | |
| 5 | t1148/gt1l/2020-12-08 | 17.4234564, 78.3408120 | |
| 6 | t1148/gt3r/2020-03-10 | 17.4349488, 78.5320913 | |
| 7 | t1148/gt2r/2019-06-12 | 17.4748731, 78.3930326 | |
| 8 | t653/gt2r/2020-02-07 | 17.4364234, 78.3760944 | |
| 9 | t653/gt2r/2020-02-07 | 17.4393428, 78.3754439 | |
| 10 | t653/gt2r/2020-02-07 | 17.4504948, 78.3732881 | |
| 11 | t1148/gt2r/2021-03-09 | 17.4351007, 78.3859719 | |
| 12 | t653/gt3r/2018-11-10 | 17.4162568, 78.3705803 | |
| 13 | t653/gt2r/2018-11-10 | 17.3997395, 78.3425604 | |
| Paris | 14 | t938/gt3l/2019-02-27 | 48.8293113, 2.2523981 |
| 15 | t938/gt3l/2019-02-27 | 48.8881962, 2.2604336 | |
| 16 | t938/gt3l/2019-02-27 | 48.8588103, 2.2980711 | |
| 17 | t938/gt3r/2019-02-27 | 48.9020286, 2.2614291 | |
| 18 | t938/gt3l/2019-02-27 | 48.9105713, 2.2638678 | |
| 19 | t778/gt2l/2019-02-17 | 48.8873445, 2.1694545 | |
| 20 | t938/gt1l/2019-02-27 | 48.8774477, 2.3467241 | |
| 21 | t938/gt1l/2019-02-27 | 48.9032770, 2.3509193 | |
| 22 | t778/gt2r/2019-02-17 | 48.8777919, 2.1716283 | |
| Vancouver | 23 | t1050/gt1l/2020-12-01 | 49.3155437, −122.9708216 |
| 24 | t1050/gt2r/2021-04-19 | 49.1890883, −123.0790622 | |
| 25 | t1050/gt3r/2020-12-01 | 42.2848871, −123.0660846 | |
| 26 | t1050/gt3l/2020-09-02 | 49.2750352, −123.1312038 | |
| 27 | t387/gt1r/2021-04-19 | 49.3198650, −123.0952621 | |
| 28 | t387/gt3r/2021-04-19 | 49.2617017, −122.7767959 | |
| 29 | t1050/gt1l/2019-09-04 | 49.2817339, −123.1380390 | |
| 30 | t1050/gt1l/2019-09-04 | 49.2912939, −123.1367726 |
| S. No. | Parameter | Specification |
|---|---|---|
| 1 | Nominal Altitude | 618 km |
| 2 | Spatial Resolution | 2.5 m |
| 3 | Radiometric Resolution | 10 bits |
| 4 | Swath | 30 km (Fore), 27 km (Aft) |
| 5 | Product Dimensions | 30 km × 30 km |
| 6 | Local time for equatorial crossing | 10:30 a.m. |
| 7 | Instantaneous Geometric Field of View (IGFOV) | 2.5 × 2.7 m (Fore) 2.22 × 2.23 m (Aft) |
| 8 | Spectral Bands | |
| No. of bands | 1 Panchromatic | |
| Bandwidths | 0.5–0.85 µ | |
| 9 | Quantization | 10 bits/pixel |
| 10 | No. of detectors | 12,000/camera |
| 11 | Base-Height Ratio | 0.62 |
| 12 | Planimetric Accuracy | 15 m (CEP90) |
| 13 | Vertical Accuracy | 8 m (LE90) |
| 14 | National Level DEM | CartoDEM |
| 15 | Processing Tools | SAPHIRE 1.0 |
| S. No. | Specifications of TanDEM-X | TanDEM-X |
|---|---|---|
| 1 | Acquisition technique | RADAR |
| 2 | Data format | GeoTIFF |
| 3 | Vertical datum | WGS84 ellipsoidal heights |
| 4 | Spatial resolution | 90 m |
| 5 | Projection system | Geographic |
| 6 | Absolute horizontal accuracy (CE90) | below 10 m |
| 7 | Absolute Vertical accuracy | below 10 m |
| 8 | Relative vertical accuracy for slopes at or below 20% | 2 m |
| 9 | Relative vertical accuracy for slopes above 20% | 4 m |
| S. No. | Mission | ICESat-2 |
|---|---|---|
| 1 | Launch date | 15 September 2018 |
| 2 | Nominal Duration | 3 years |
| 3 | Detector | Hamamatsu photomultiplier |
| 4 | Detector type | Photon counting |
| 5 | Wavelength | 532 nm (green) |
| 6 | Orbit inclination and Coverage | 92°; coverage up to 88° N–88° S latitude |
| 7 | Track number | 6 tracks from 1 laser |
| 8 | Acquisition strategy | 3 pairs (a strong and a weak beam) created by beam-splitting optics in the laser transmitter |
| 9 | Laser power | 120 μJ/30 μJ |
| 10 | Footprint diameter | ~12 m |
| 11 | along-track spacing | ~0.7 m |
| 12 | across-track spacing | 90 m within pairs, 3.3 km between pairs |
| Location | Product | Trcak_ID | Year | No. of Data Sets | Format |
|---|---|---|---|---|---|
| GHMC | ATL 08, ATL 03 | 1148 | 2018–2021 | 7 | .CSV |
| Bellampalle | ATL 08 | 1089 and 142 | 2018–2021 | 16 | .CSV |
| Building. No. | Mean Elevation of the Building (Elevbldg) m | Mean Elevation of the Adjacent Bare Earth (Elevref) m | Heights of the Building Computed from ICESat-2 Profile | Heights of the Building Computed Using Google Photos | Height Difference | % Error |
|---|---|---|---|---|---|---|
| 1 | 468.01 | 444.96 | 23.05 | 21.00 | 2.05 | 10% |
| 2 | 566.38 | 510.81 | 55.57 | 54.00 | 1.57 | 3% |
| 3 | 565.54 | 521.89 | 43.66 | 42.00 | 1.66 | 4% |
| 4 | 495.70 | 450.48 | 45.22 | 45.00 | 0.22 | 0% |
| 5 | 545.55 | 480.02 | 65.53 | 66.00 | −0.47 | 1% |
| 6 | 455.05 | 445.92 | 9.13 | 10.00 | −0.87 | 9% |
| 7 | 600.75 | 500.86 | 99.89 | 100.00 | −0.11 | 0% |
| 8 | 593.15 | 492.81 | 100.34 | 105.00 | −4.66 | 4% |
| 9 | 532.02 | 512.13 | 19.89 | 18.00 | 1.89 | 11% |
| 10 | 552.79 | 531.12 | 21.67 | 18.00 | 3.67 | 20% |
| 11 | 558.97 | 507.86 | 51.11 | 48.00 | 3.11 | 6% |
| 12 | 520.97 | 475.06 | 45.91 | 45.00 | 0.91 | 2% |
| 13 | 504.15 | 464.87 | 39.29 | 39.00 | 0.29 | 1% |
| 14 | 101.46 | 74.92 | 26.55 | 24.00 | 2.55 | 11% |
| 15 | 96.45 | 72.90 | 23.55 | 21.00 | 2.55 | 12% |
| 16 | 107.60 | 87.06 | 20.54 | 21.00 | −0.46 | 2% |
| 17 | 115.05 | 83.06 | 31.99 | 30.00 | 1.99 | 7% |
| 18 | 109.81 | 85.30 | 24.51 | 24.00 | 0.51 | 2% |
| 19 | 92.52 | 71.69 | 20.83 | 21.00 | −0.17 | 1% |
| 20 | 106.94 | 82.23 | 24.71 | 21.00 | 3.71 | 18% |
| 21 | 102.58 | 84.18 | 18.40 | 18.00 | 0.40 | 2% |
| 22 | 86.13 | 73.90 | 12.23 | 15.00 | −2.77 | 18% |
| 23 | 114.48 | 81.48 | 33.00 | 33.00 | −0.0019 | 1.5% |
| 24 | −1.93 | −17.87 | 15.94 | 18.00 | −2.06 | 11% |
| 25 | −2.15 | −13.37 | 11.22 | 9.00 | 2.22 | 25% |
| 26 | 147.61 | −5.35 | 152.96 | 150.30 | 2.66 | 2% |
| 27 | −3.56 | −11.21 | 7.65 | 6.00 | 1.65 | 28% |
| 28 | −9.25 | −15.30 | 6.05 | 6.00 | 0.05 | 1% |
| 29 | 58.45 | −1.07 | 59.52 | 60.00 | −0.48 | 1% |
| 30 | 30.24 | −0.01 | 30.25 | 33.00 | −2.75 | 8% |
| Site | DEMs | ME | MAE | RMSE | LE90 | SD | Skew |
|---|---|---|---|---|---|---|---|
| GHMC (Urban) | TanDEM-X | 3 | 3.7 | 5.29 | 8.73 | 4.38 | 0.23 |
| CartoDEM | 6 | 6.2 | 7.48 | 12.34 | 4.49 | 1.25 | |
| Bellampalle (Rural) | TanDEM-X | 0.9 | 1.4 | 3.12 | 5.14 | 2.99 | 5.4 |
| CartoDEM | 1.8 | 2.1 | 3.32 | 5.48 | 2.77 | 8.25 |
Publisher’s Note: MDPI stays neutral with regard to jurisdictional claims in published maps and institutional affiliations. |
© 2021 by the authors. Licensee MDPI, Basel, Switzerland. This article is an open access article distributed under the terms and conditions of the Creative Commons Attribution (CC BY) license (https://creativecommons.org/licenses/by/4.0/).
Share and Cite
Goud, G.P.S.; Bhardwaj, A. Estimation of Building Heights and DEM Accuracy Assessment Using ICESat-2 Data Products. Eng. Proc. 2021, 10, 37. https://doi.org/10.3390/ecsa-8-11442
Goud GPS, Bhardwaj A. Estimation of Building Heights and DEM Accuracy Assessment Using ICESat-2 Data Products. Engineering Proceedings. 2021; 10(1):37. https://doi.org/10.3390/ecsa-8-11442
Chicago/Turabian StyleGoud, Goddu Pavan Sai, and Ashutosh Bhardwaj. 2021. "Estimation of Building Heights and DEM Accuracy Assessment Using ICESat-2 Data Products" Engineering Proceedings 10, no. 1: 37. https://doi.org/10.3390/ecsa-8-11442
APA StyleGoud, G. P. S., & Bhardwaj, A. (2021). Estimation of Building Heights and DEM Accuracy Assessment Using ICESat-2 Data Products. Engineering Proceedings, 10(1), 37. https://doi.org/10.3390/ecsa-8-11442