
A Comparison of Landsat-8 OLI, Sentinel-2 MSI and PlanetScope Satellite Imagery for Assessing Coastline Change in El-Alamein, Egypt †


Abstract
:1. Introduction and Literature Review
2. Materials and Methods
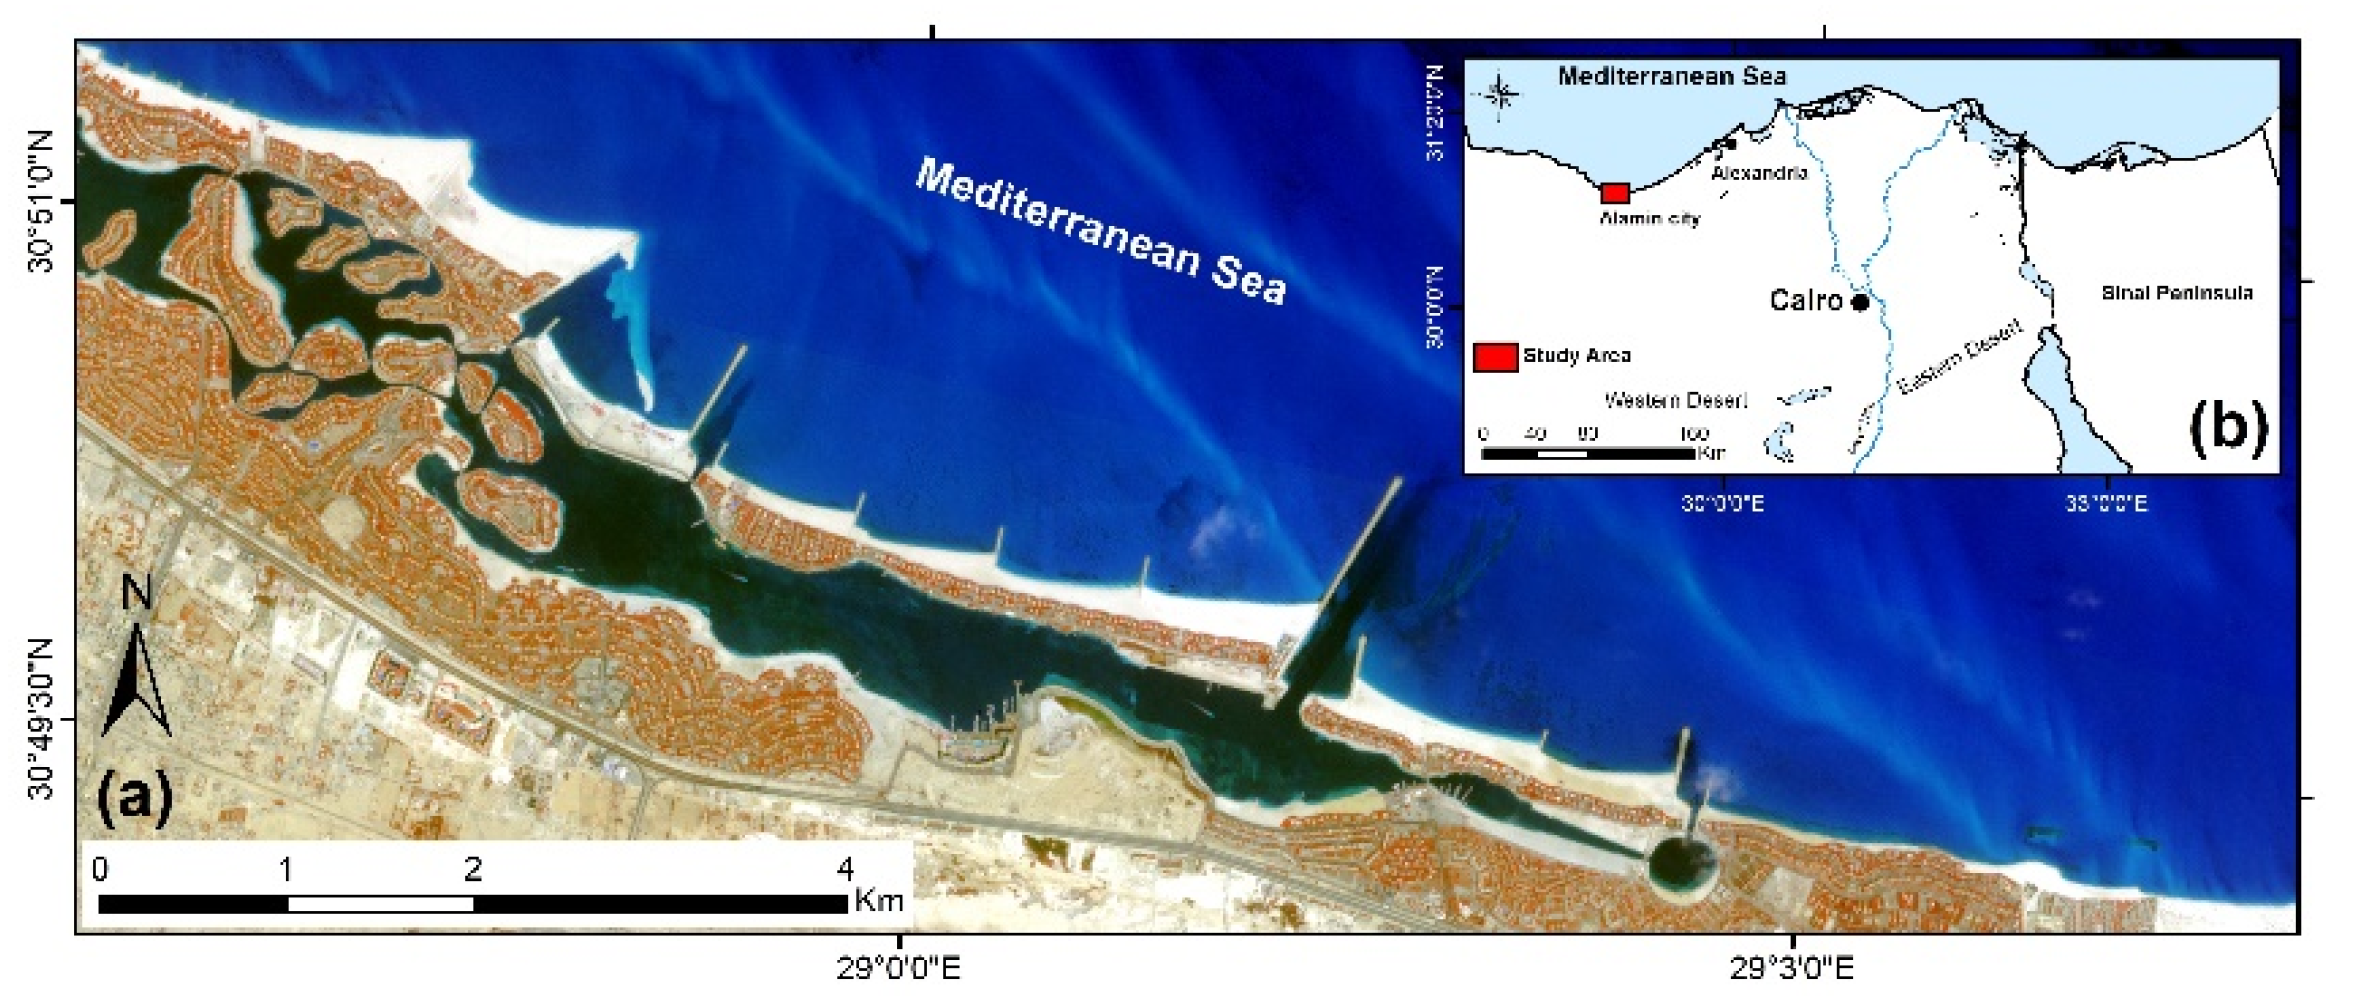
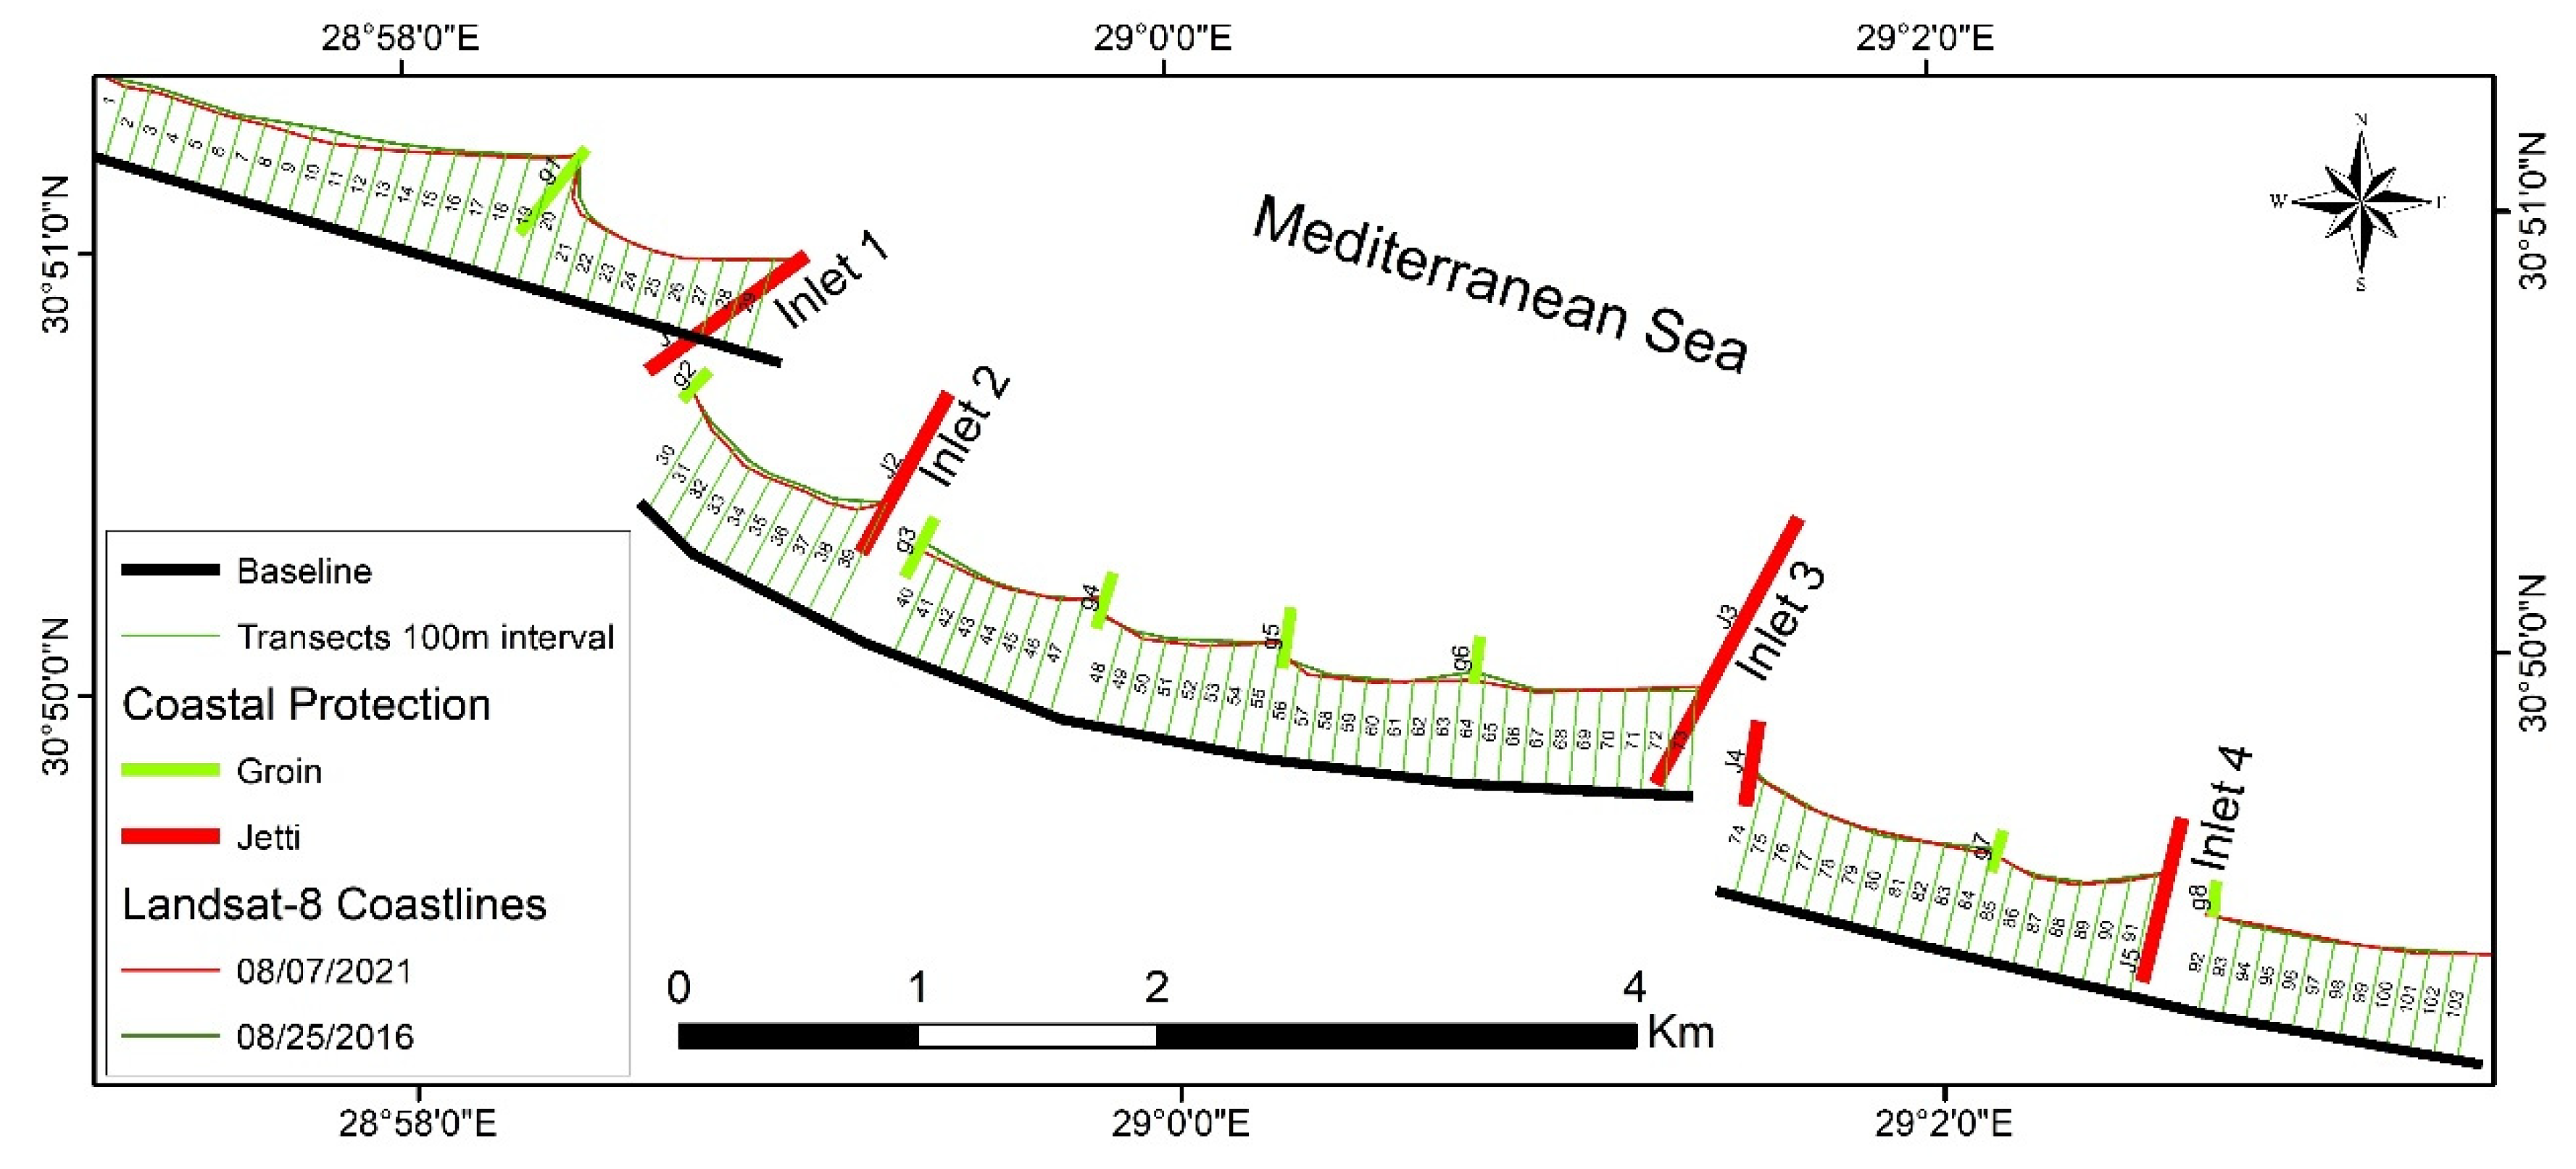
2.1. Study Area
2.2. Materials
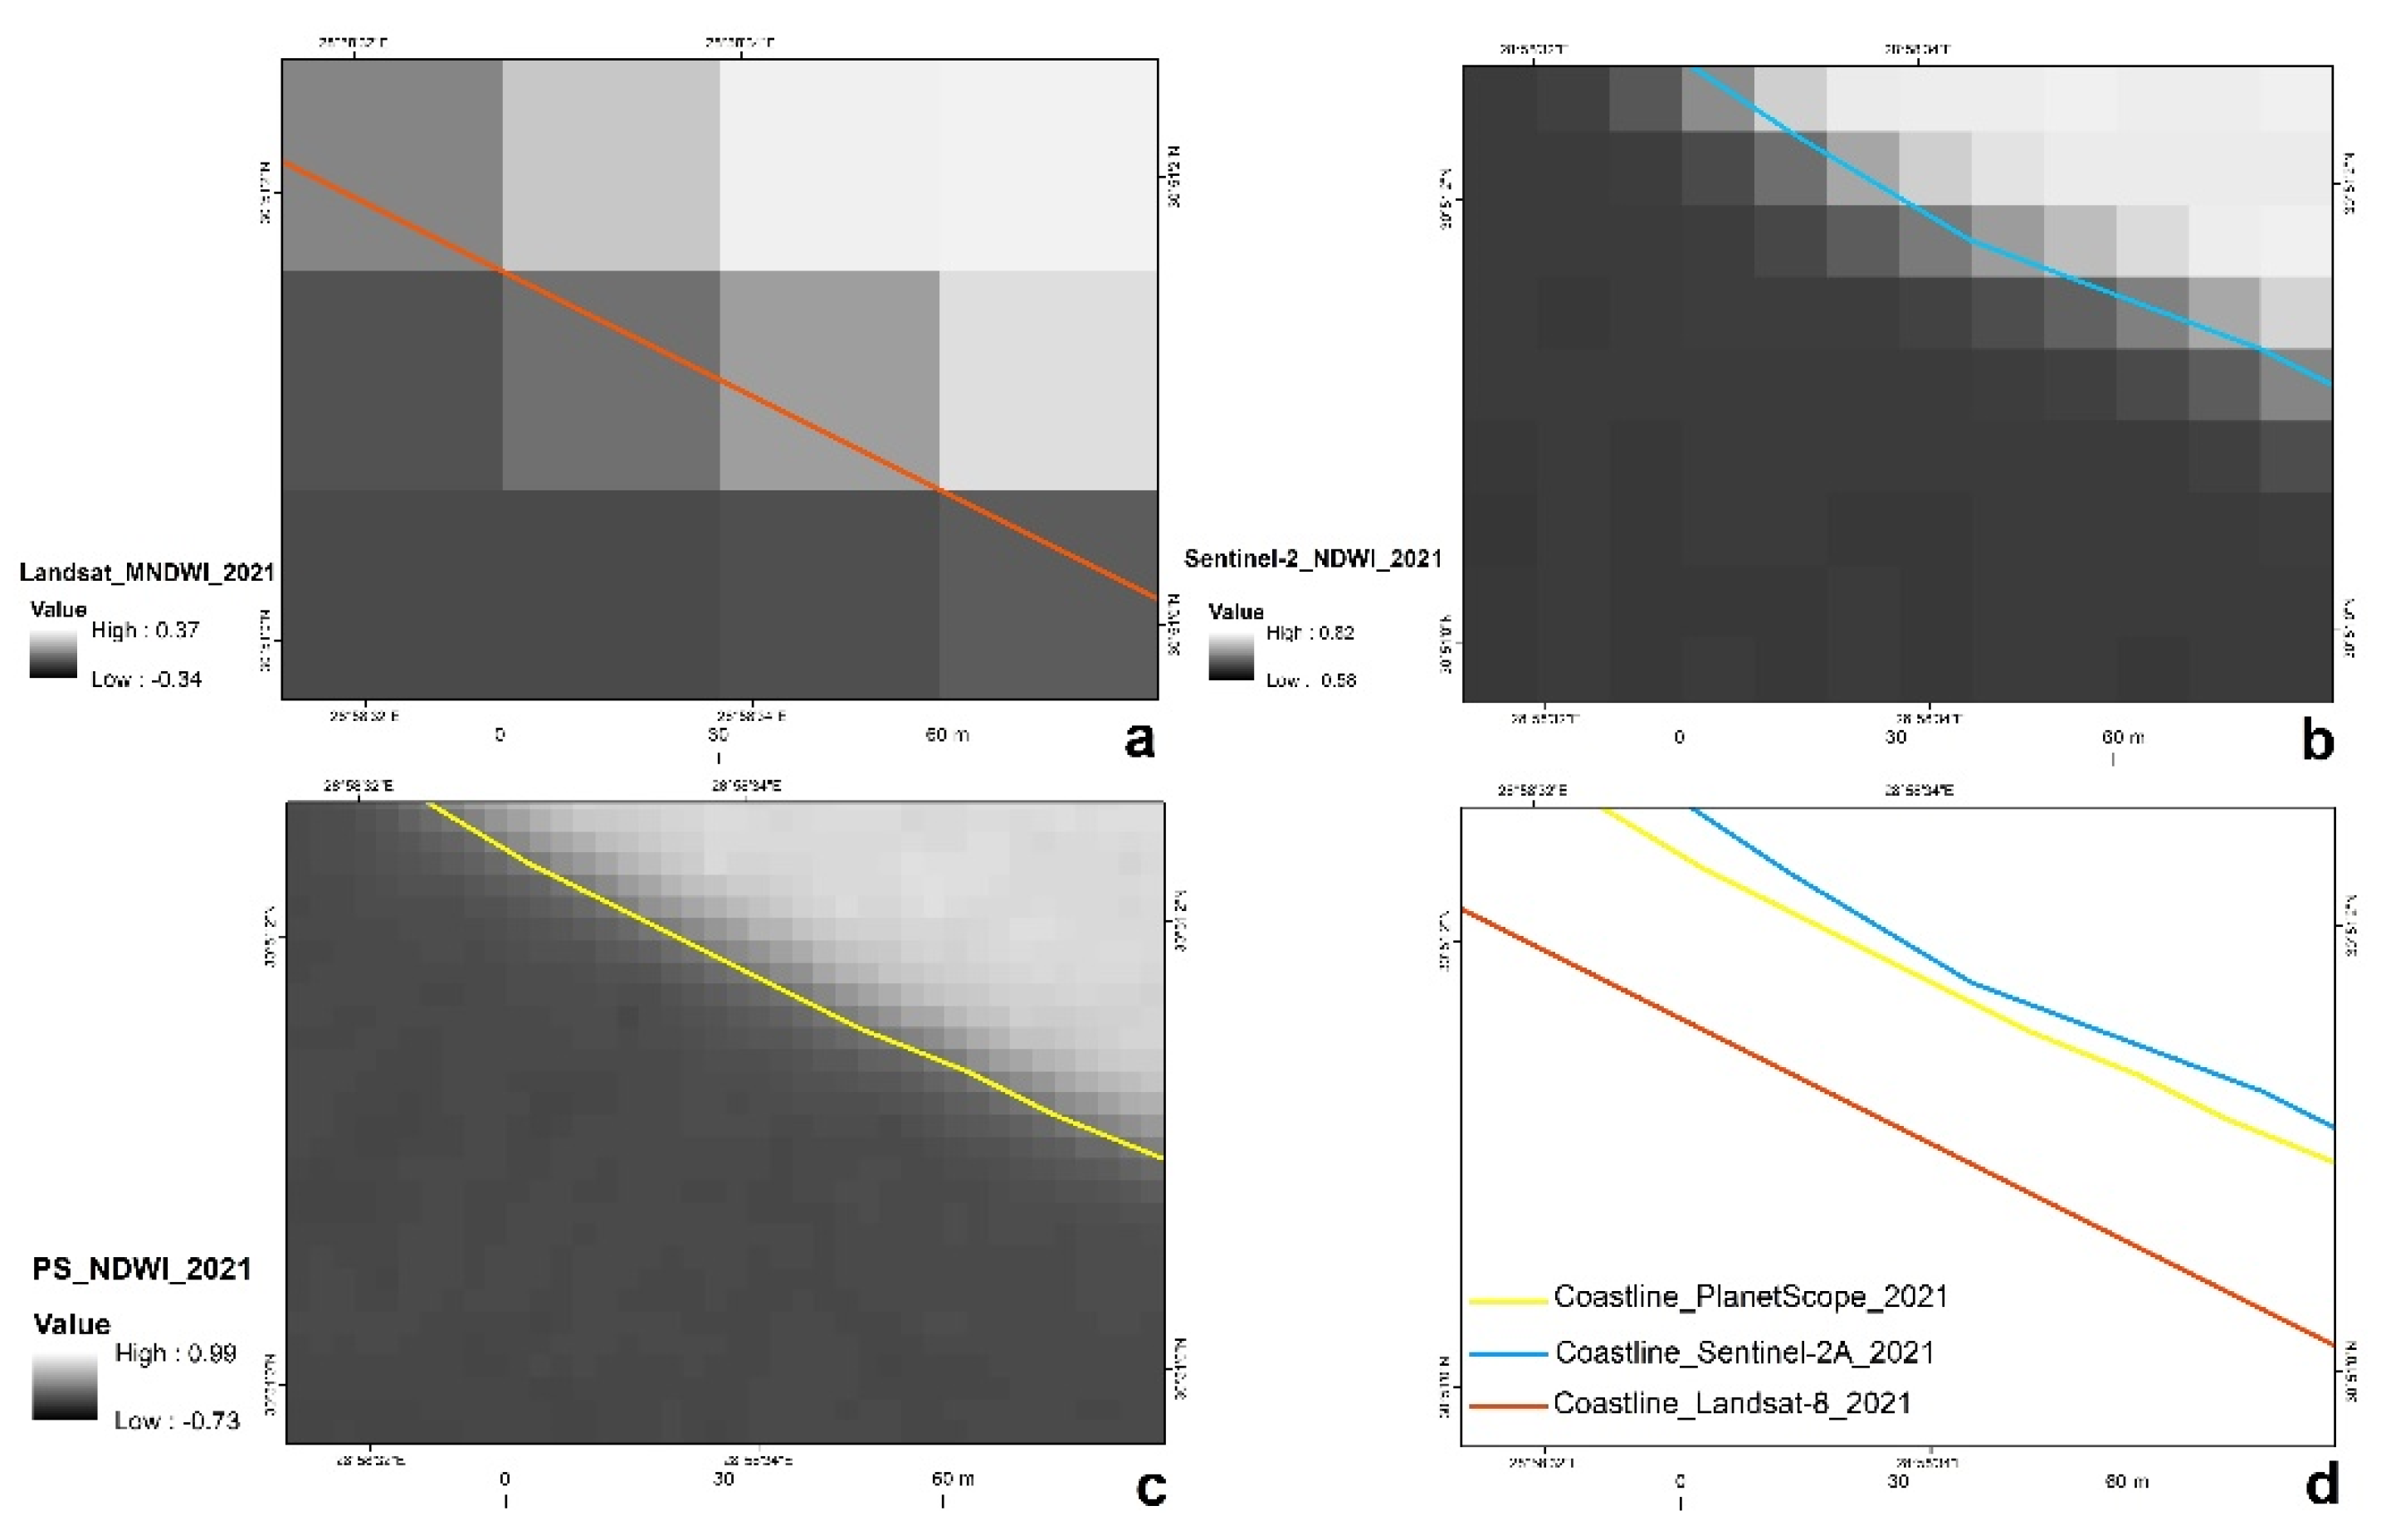
2.3. Methods
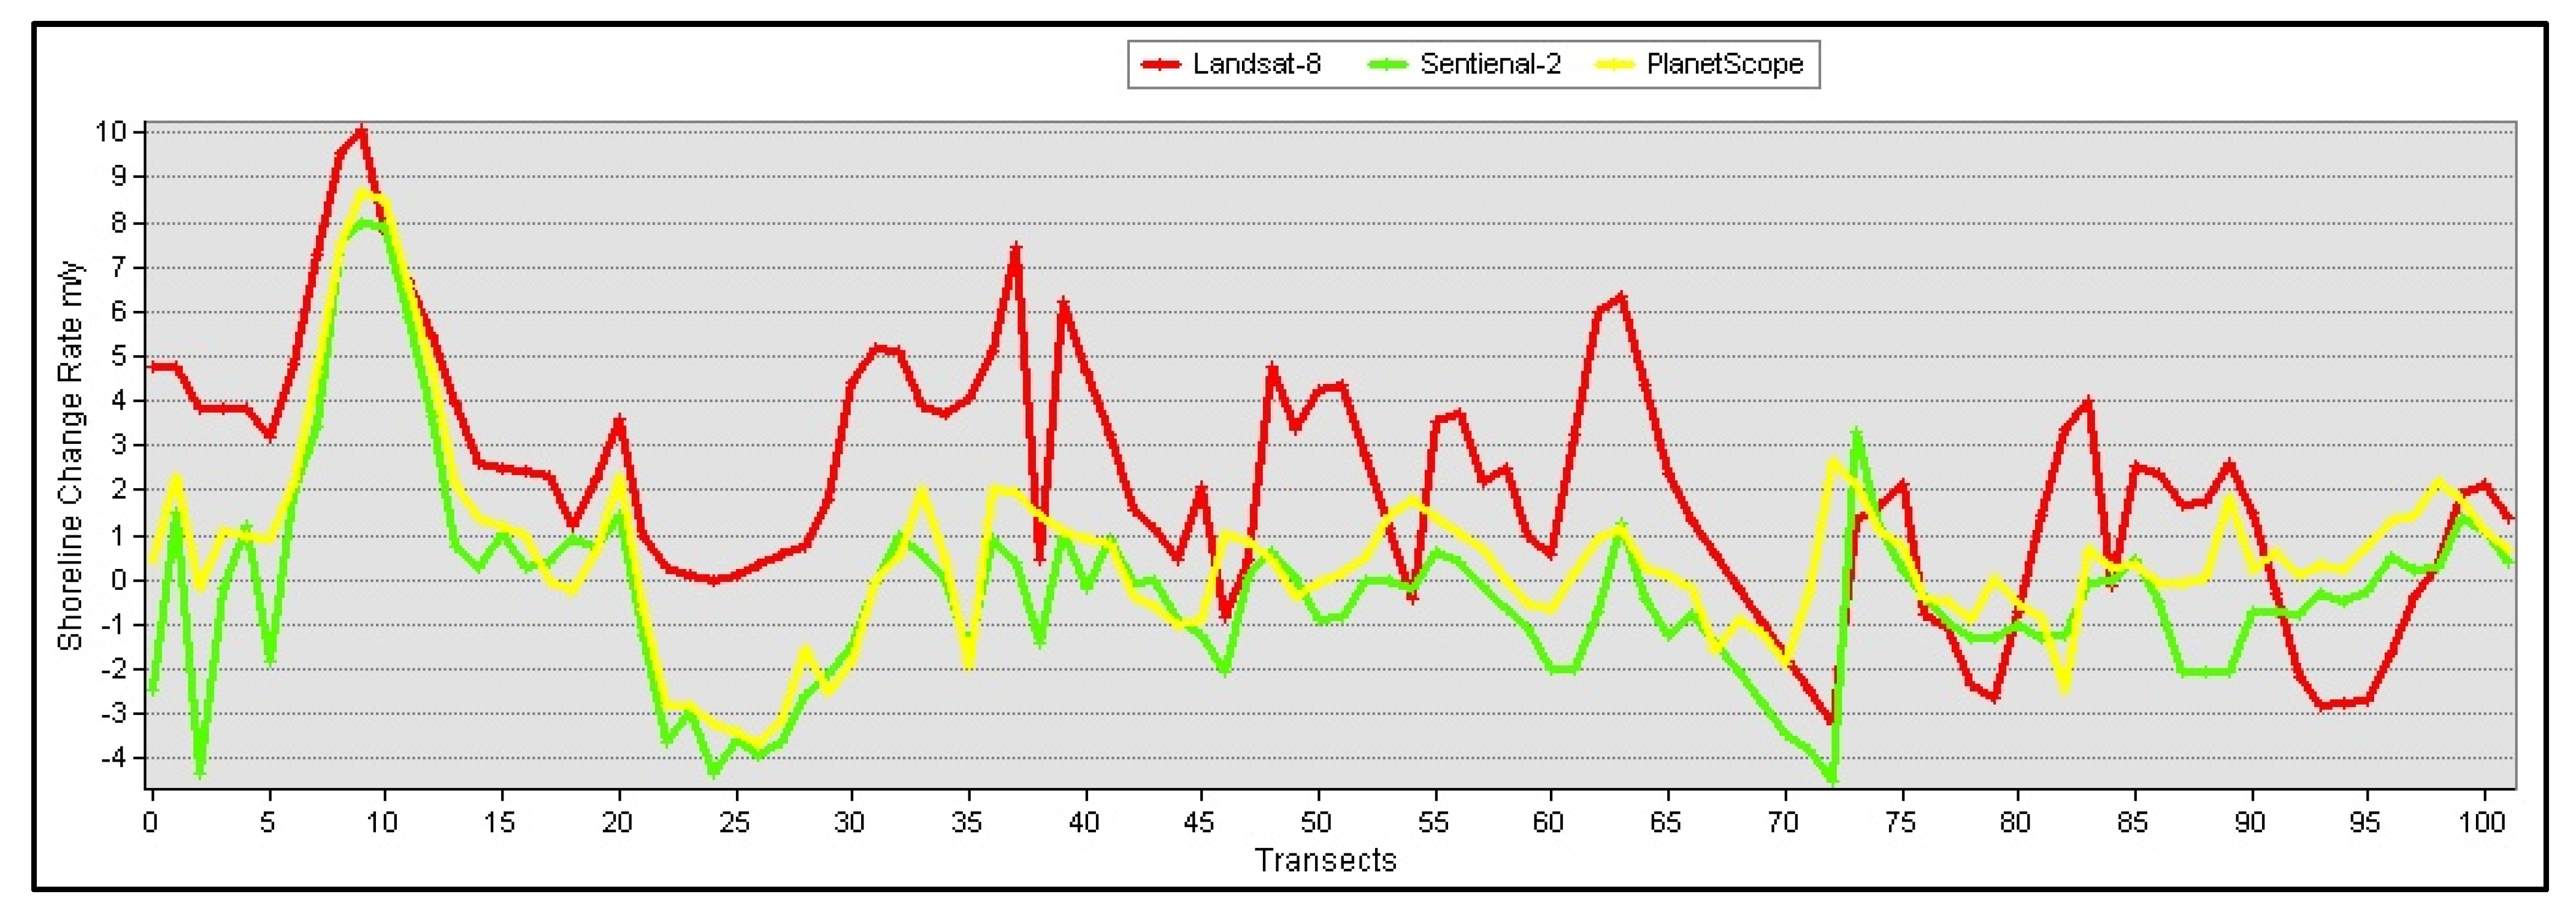
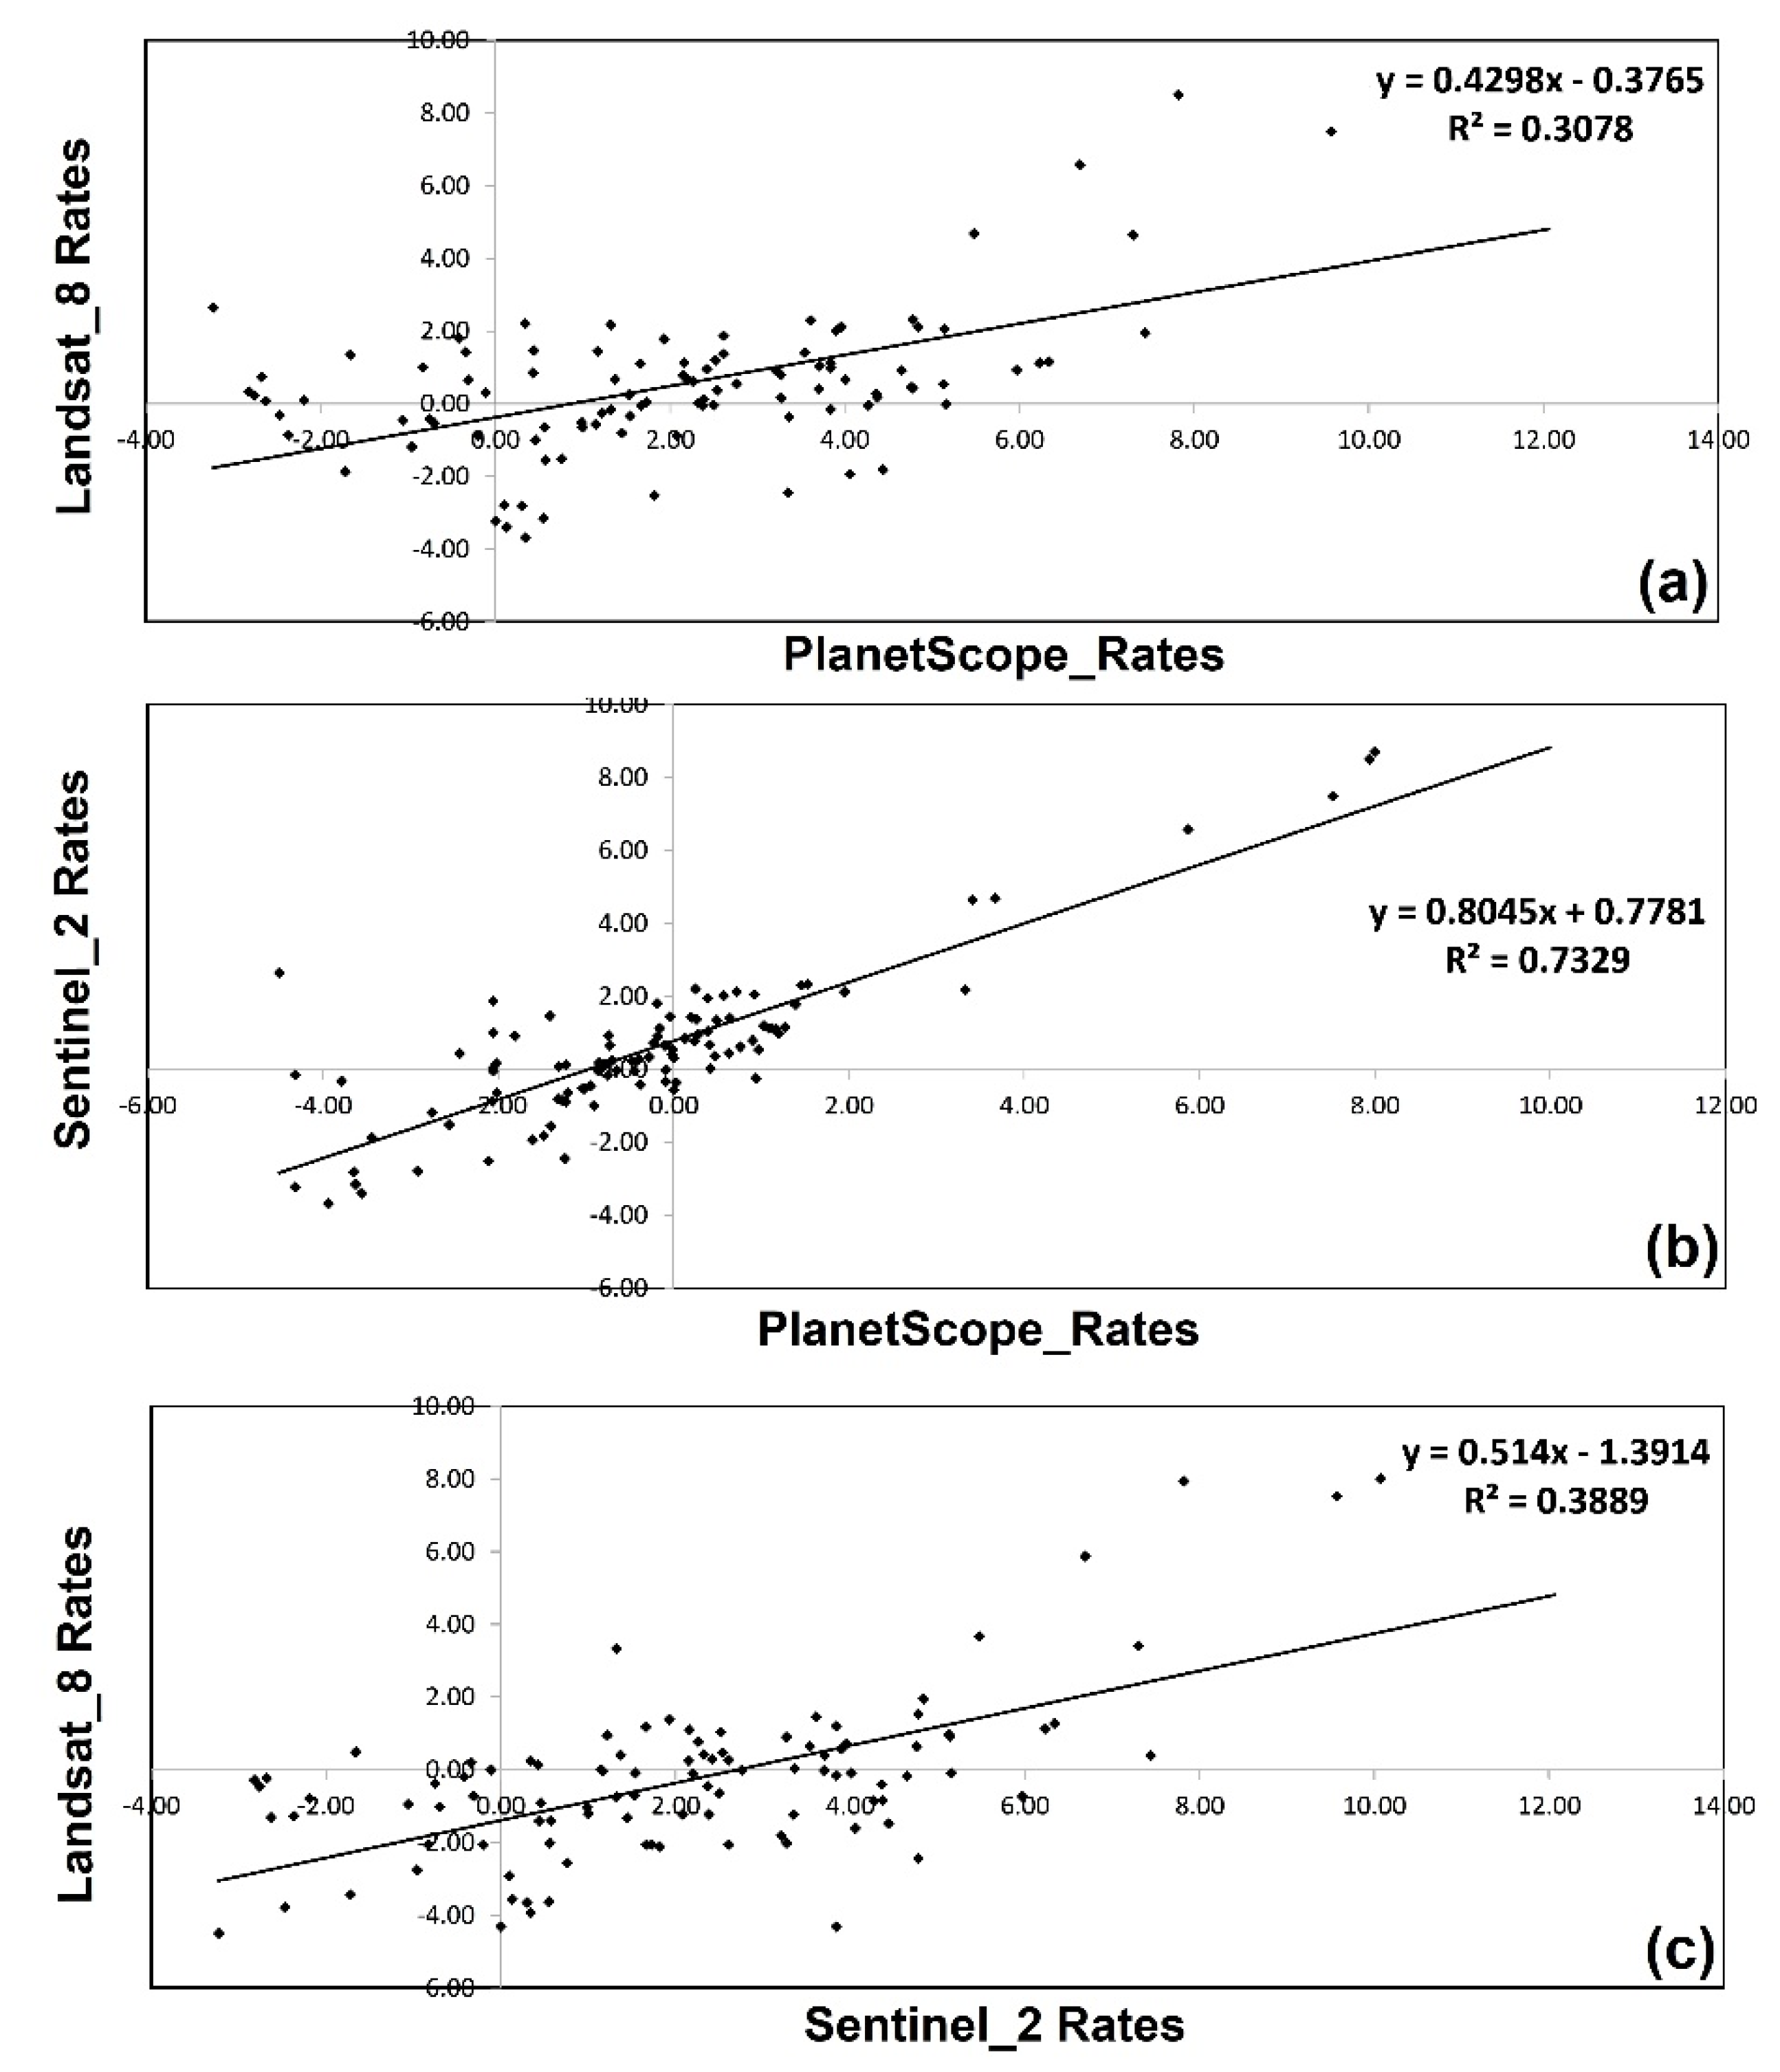
3. Results
4. Discussion
5. Conclusions
Author Contributions
Funding
Institutional Review Board Statement
Informed Consent Statement
Data Availability Statement
Conflicts of Interest
References
- Yasir, M.; Sheng, H.; Fan, H.; Nazir, S.; Niang, A.J.; Salauddin, M.D.; Khan, S. Automatic Coastline Extraction and Changes Analysis Using Remote Sensing and GIS Technology. IEEE Access 2020, 8, 180156–180170. [Google Scholar] [CrossRef]
- Kermani, S.; Boutiba, M.; Guendouz, M.; Guettouche, M.S.; Khelfani, D. Detection and analysis of shoreline changes using geospatial tools and automatic computation: Case of jijelian sandy coast (East Algeria). Ocean Coast. Manag. 2016, 132, 46–58. [Google Scholar] [CrossRef]
- Pardo-Pascual, J.E.; Almonacid-Caballer, J.; Ruiz, L.A.; Palomar-Vázquez, J. Automatic extraction of shorelines from Landsat TM and ETM+ multi-temporal images with subpixel precision. Remote Sens. Environ. 2012, 123, 1–11. [Google Scholar] [CrossRef] [Green Version]
- Boak, E.H.; Turner, I.L. Shoreline Definition and Detection: A Review. J. Coast. Res. 2005, 21, 688–703. [Google Scholar] [CrossRef] [Green Version]
- Olmanson, L.; Brezonik, P.; Bauer, M. Remote Sensing for Regional Lake Water Quality Assessment: Capabilities and Limitations of Current and Upcoming Satellite Systems. In The Handbook of Environmental Chemistry; Springer: Cham, Switzerland, 2015; Volume 33, pp. 111–140. [Google Scholar]
- Milad, N.-J.; Bovolo, F.; Bruzzone, L.; Gege, P. Physics-based Bathymetry and Water Quality Retrieval Using PlanetScope Imagery: Impacts of 2020 COVID-19 Lockdown and 2019 Extreme Flood in the Venice Lagoon. Remote Sens. 2020, 12, 2381. [Google Scholar]
- Cui, B.; Li, X. Coastline change of the Yellow River estuary and its response to the sediment and runoff (1976–2005). Geomorphology 2011, 127, 32–40. [Google Scholar] [CrossRef]
- Nguyen, U.N.T.; Pham, L.T.H.; Dang, T.D. An automatic water detection approach using Landsat 8 OLI and Google Earth Engine cloud computing to map lakes and reservoirs in New Zealand. Environ. Monit. Assess. 2019, 191, 235. [Google Scholar] [CrossRef]
- Ansper, A.; Alikas, K. Retrieval of Chlorophyll a from Sentinel-2 MSI Data for the European UnionWater Framework Directive Reporting Purposes. Remote Sens. 2019, 11, 64. [Google Scholar] [CrossRef] [Green Version]
- Planet. Planet Imagery Product Specification. Available online: https://assets.planet.com/docs/ Combined-Imagery-Product-Spec-Dec-2018.pdf (accessed on 28 September 2021).
- Gabr, B.; Ahmed, M.; Marmoush, Y. PlanetScope and Landsat 8 Imageries for Bathymetry Mapping. J. Mar. Sci. Eng. 2020, 8, 143. [Google Scholar] [CrossRef] [Green Version]
- Dewi, R.S.; Bijker, W. Dynamics of shoreline changes in the coastal region of Sayung, Indonesia. Egypt. J. Remote Sens. Space Sci. 2020, 23, 181–193. [Google Scholar] [CrossRef]
- Darwish, K.; Smith, S.E.; Torab, M.; Monsef, H.; Hussein, O. Geomorphological changes along the Nile Delta coastline between 1945 and 2015 detected using satellite remote sensing and GIS. J. Coast. Res. 2017, 33, 786–794. [Google Scholar] [CrossRef]
- Astiti, S.; Osawa, T.; Nuarsa, I. Identification Of Shoreline Changes Using Sentinel 2 Imagery Data In Canggu Coastal Area. ECOTROPHIC J. Environ. Sci. 2019, 13, 191–204. [Google Scholar] [CrossRef]
- Kelly, J.T.; Gontz, A.M. Rapid assessment of shoreline changes induced by Tropical Cyclone Oma using CubeSat imagery in southeast Queensland, Australia. J. Coast. Res. 2020, 36, 72–87. [Google Scholar] [CrossRef]
- Park, S.J.; Achmad, A.R.; Syifa, M.; Lee, C.-W. Machine learning application for coastal area change detection in Gangwon province, South Korea using high-resolution satellite imagery. J. Coast. Res. 2019, 90, 228–235. [Google Scholar] [CrossRef]
- Mitri, G.; Nader, M.; Abou Dagher, M.; Gebrael, K. Investigating the performance of sentinel-2A and Landsat 8 imagery in mapping shoreline changes. J. Coast. Conserv. 2020, 24, 40. [Google Scholar] [CrossRef]
- Mansaray, A.S.; Dzialowski, A.R.; Martin, M.E.; Wagner, K.L.; Gholizadeh, H.; Stoodley, S.H. Comparing PlanetScope to Landsat-8 and Sentinel-2 for Sensing Water Quality in Reservoirs in Agricultural Watersheds. Remote Sens. 2021, 13, 1847. [Google Scholar] [CrossRef]
- Mandanici, E.; Bitelli, G. Preliminary Comparison of Sentinel-2 and Landsat 8 Imagery for a Combined Use. Remote Sens. 2016, 8, 1014. [Google Scholar] [CrossRef] [Green Version]
- Frihy, O.; Deabes, E. Erosion chain reaction at El-Alamein Resorts on the western Mediterranean coast of Egypt. Coast. Eng. 2012, 69, 12–18. [Google Scholar] [CrossRef]
- Emam, W.W.M.; Soliman, K.M. Applying geospatial technology in quantifying spatiotemporal shoreline dynamics along Marina El-Alamein Resort, Egypt. Environ. Monit. Assess. 2020, 192, 459. [Google Scholar] [CrossRef]
- Emam, W.W.M.; Soliman, K.M. Quantitative analysis of shoreline dynamics along the Mediterranean coastal strip of Egypt. Case study: Marina El-Alamein resort. In Environmental Remote Sensing in Egypt; Elbeih, S., Negm, A., Kostianoy, A., Eds.; Springer: Cham, Switzerland, 2020. [Google Scholar]
- Awad, M.; El-Sayed, H.M. The analysis of shoreline change dynamics and future predictions using automated spatial techniques: Case of El-Omayed on the Mediterranean coast of Egypt. Ocean Coast. Manag. 2021, 205, 105568. [Google Scholar] [CrossRef]
- McFeeters, S.K. The use of the Normalized Difference Water Index (NDWI) in the delineation of open water features. Int. J. Remote Sens. 1996, 17, 1425. [Google Scholar] [CrossRef]
- Xu, H. Modification of normalised difference water index (NDWI) to enhance open water features in remotely sensed imagery. Int. J. Remote Sens. 2006, 27, 3025–3033. [Google Scholar] [CrossRef]

| Year | Acquired Date | Satellite/Sensor 1 | Path/Row | IFOV (m) |
|---|---|---|---|---|
| 08/25/2016 | Landsat-8/OLI | 178/39 | 30 | |
| 2016 | 08/20/2016 | Sentinel-2A/MSI | L1C_T35RPQ | 10 |
| 08/12/2016 | PlanetScope/3B | 075305 | 3 | |
| 08/07/2021 | Landsat-8/OLI | 178/39 | 30 | |
| 2021 | 08/14/2021 | Sentinel-2A/MSI | L1C_T35RPQ | 10 |
| 08/28/2021 | PlanetScope/3B | 082015 | 3 |
| Parameter | Landsat-8 | Sentienel-2 | PlanetScope |
|---|---|---|---|
| NSM 1 Highest Accretion | 49.83 | 39.87 | 43.84 |
| Highest Erosion | −15.97 | −22.44 | −18.61 |
| Highest | −3.23 | −4.60 | −3.69 |
| Erosion Average | −1.50 | −1.48 | −0.02 |
| Lowest | −0.11 | −0.01 | −1.19 |
| EPR 2 Highest | 10.07 | 8.00 | 8.70 |
| Accretion Average | 3.06 | 1.50 | 1.52 |
| Lowest | 0.00 | 0.00 | 0.01 |
Publisher’s Note: MDPI stays neutral with regard to jurisdictional claims in published maps and institutional affiliations. |
© 2021 by the authors. Licensee MDPI, Basel, Switzerland. This article is an open access article distributed under the terms and conditions of the Creative Commons Attribution (CC BY) license (https://creativecommons.org/licenses/by/4.0/).
Share and Cite
Darwish, K.; Smith, S. A Comparison of Landsat-8 OLI, Sentinel-2 MSI and PlanetScope Satellite Imagery for Assessing Coastline Change in El-Alamein, Egypt. Eng. Proc. 2021, 10, 23. https://doi.org/10.3390/ecsa-8-11258
Darwish K, Smith S. A Comparison of Landsat-8 OLI, Sentinel-2 MSI and PlanetScope Satellite Imagery for Assessing Coastline Change in El-Alamein, Egypt. Engineering Proceedings. 2021; 10(1):23. https://doi.org/10.3390/ecsa-8-11258
Chicago/Turabian StyleDarwish, Kamal, and Scot Smith. 2021. "A Comparison of Landsat-8 OLI, Sentinel-2 MSI and PlanetScope Satellite Imagery for Assessing Coastline Change in El-Alamein, Egypt" Engineering Proceedings 10, no. 1: 23. https://doi.org/10.3390/ecsa-8-11258
APA StyleDarwish, K., & Smith, S. (2021). A Comparison of Landsat-8 OLI, Sentinel-2 MSI and PlanetScope Satellite Imagery for Assessing Coastline Change in El-Alamein, Egypt. Engineering Proceedings, 10(1), 23. https://doi.org/10.3390/ecsa-8-11258