Abstract
Thiazolyl–pyrimidine hybrid plays significant roles in the biological activities and SAR of thiazolylpyrimidines (Tzpd), thiazolopyrimidines, and thienopyrimidines due to the combination of the thiazole and pyrimidine pharmacophores. The study developed regression-based models for the prediction of antiplasmodial activity of 43 Tzpd hybrid obtained from the ChEMBL database. The molecular descriptors (145 features) were scaled down to 6 using the recursive feature elimination. The X- and Y-matrix were split into 34 train and 9 test sets using a split ratio of 0.20. Regression models were built using scikit-learn algorithms: multiple linear regression (MLR), k-Nearest Neighbors (kNN), Support Vector Regressor (SVR), and Random Forest Regressor (RFR) to predict the pIC50 of the test set. The models were evaluated using R2, mean squared error (MSE), mean absolute error (MAE), root mean squared error (RMSE), p-values, F-statistic, and variance inflation factor (VIF). Of the 145 features calculated for the 43 Tzpd, 6 molecular features, FCASA-, MNDO_LUMO, E_str, vsurf_HB1, vsurf_G, and vsurf_DD12 (p < 0.05; VIF < 5), were found to significantly influence the antiplasmodial activity. Fivefold cross-validation performance scores of MLR, kNN, SVR, and RFR showed that the performance metrics of MLR (MSE = 0.1453; R2 = 0.680; MAE = 0.290; RMSE = 0.381; pIC50(predicted) = 8.06 − 0.45vsurf_G + 0.37FCASA- − 0.42MNDO_LUMO − 0.20E_str + 0.30vsurf_HB1 − 0.38vsurf_DD12) outperformed other models. The study developed predictive models and provided insights into the chemical features necessary for the optimization of thiazolyl–pyrimidine to enhance antiplasmodial activity.
1. Introduction
Malaria is a disease caused by the parasite of the genus Plasmodium and transmitted through the saliva of female anopheles mosquitoes [1]. Sub-Saharan Africa is currently overwhelmed by P. falciparum. Several heterocyclic compounds and their derivatives are important chemotherapeutic classes and are still useful singly and in combinations for the treatment of malaria [2]. Various structural modification of heterocycles with improved activities has been reported and translated into to useful drugs [3]. To date, artemisinin-based combination therapy has remained the most potent first-line treatment for P. falciparum. The emergence and rapid spread of artemisinin-resistant strains of P. falciparum are indications that a continuous search for a more efficacious remedy for malaria is imperative [2]. The combined safety, favorable physicochemical properties, and cost-effectiveness of hybrid designs make them good candidates for structural modifications to overcome resistance and declining efficacy.
Different strategies have been put forth to design new chemical entities with optimum pharmacokinetic and pharmacodynamic properties [4]. The QSAR method uses computation modeling to unravel associations between the biological activities and physicochemical properties of chemical substances to create a robust statistical model to predict the biological activities of novel chemical entities [5]. Pyrimidines are important substances in the synthesis of various active molecules that are extensively used in the intermediate skeleton of antiplasmodial activity and have attracted more attention due to their extensive biological activities including antiviral, antibacterial, antifungal, and insecticidal activities [5]. For example, pyrimidine derivatives bearing a dithioacetal moiety as effective antiviral agents have been reported [6]. Thiazolyl–pyrimidine hybrid plays significant roles in the biological activities and SAR of thiazolylpyrimidines (Tzpd), thiazolopyrimidines, and thienopyrimidines due to the combination of the thiazole and pyrimidine pharmacophores.
This study, therefore, developed a robust model using regression and classification such as k-nearest neighbors, kNN classifier, support vector classifier (SVC), and Random Forest Regressor (RFR) algorithms to: (i) develop a model to predict the pIC50 of any untested Tzpd analogues or similar derivatives against P. falciparum strains; and (ii) explain SARs of Tzpd derivatives against P. falciparum strains.
2. Methods
2.1. Chemical Data Set
The chemical data set comprises 43 derivatives of thiazolyl–pyrimidine hybrids obtained from the ChEMBL database of compounds with antimalarial activity against Plasmodium falciparum. The detailed chemical structures and pIC50 of the compounds used in this study are shown in the Supplementary Materials (Figure S1).
2.2. Preparation of Data Set
The SMILES were initially converted to structures to form a molecular database and converted to 3D by energy minimization using the MMFF94x force field. The energy-minimized compounds were subjected to conformational search using LM dynamics [5]. The molecules were then subjected to further energy minimization using the Hamiltonian semi-empirical AM1 MOPAC modules, and the resulting conformers were used for further studies.
2.3. Computation of Molecular Descriptors
The molecular fragments of the AM1 energy-minimized Tzpd were subjected to both 2D and 3D molecular descriptor calculation using the default settings of the molecular operating environment (MOE v 2014.0901) software [7].
2.4. Data Pretreatment
One hundred and forty-five chemical features/descriptors were computed for the compounds, and the pIC50 was calculated from the negative decadic logarithm of the IC50. The pIC50 column (the values to be predicted) formed the Y-matrix, while the rest of the data set formed the X-matrix. Standardization of the X-matrix was done using the StandardScaler function [8]. It is important to standardize the variables so that they will all have a comparable scale.
2.5. Selection of Relevant Descriptors
Recursive feature elimination (RFE) was used to select significant features using the linear regression function from Skearn for RFE [8]. The number of features considered to build the model was placed at 25 using m > n2, where m is the number of molecules, and n is the number of features.
2.6. Data Splitting
The X- and Y-matrices were split into the train (34 molecules) and test (9 molecules) sets using a split ratio of 0.2, where 80% is assigned to the train set and 20% is assigned to the test set. The size of the training data set was denoted as X-train, Y-train, while the size of the test data set was X-test and Y-test. The training set was used to train the model using a fit method, while 9 molecules belonging to the test set were used to validate the models. The hyperparameters of the models were adjusted on the test data set to obtain the best hyperparameter configuration using a random search because their hyperparameters were continuous.
2.7. Regression Modeling
The Statsmodel package of the Python software v. 3.12 was used to obtain the detailed statistics and summary of the model [8,9]. The machine learning scikit-learn algorithms, multiple linear regressor (MLR), k-Nearest Neighbors (kNN), Support Vector Regressor (SVR), and Random Forest Regressor (RFR), were deployed to predict the pIC50 values of the test set compounds. The goal was to discover the best algorithm capable of predicting the activity of untested compounds.
2.8. Model Evaluation
Different evaluation metrics such as the coefficient of determination (R2), mean squared error (MSE), mean absolute error (MAE), and root mean squared error (RMSE) were deployed to assess the performance of the models. The p-values, F-statistic, and variance inflation factor (VIF) were also used [10].
3. Results and Discussion
3.1. Chemical Data Set
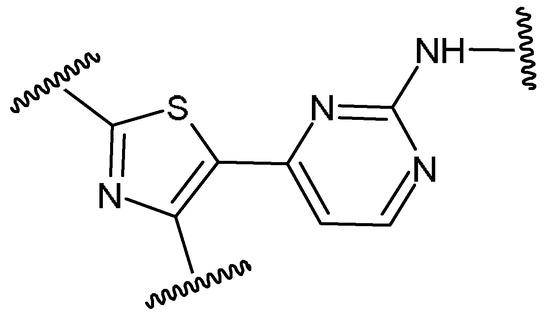
The 43 congeners of the thiazolyl–pyrimidine hybrid (Figure 1) used for the study were obtained from the ChEMBL. They were selected based on pharmacophore (thiazolyl–pyrimidine skeleton), the diverse chemical substituents forming the congeners, the in vitro antiplasmodial activity (against P. falciparum), and the high negative decadic logarithm values (3.04 units for 5.73 < pIC50 < 8.77).

Figure 1.
Pharmacophore of thiazolyl–pyrimidine hybrid derivatives.
3.2. Selection of Significant Features
The number of significant features to be considered to build the model was fixed at a hypothetical value of 25 out of 145 using the RFE. To further eliminate the insignificant features, the RFE-selected features were further subjected to the Statsmodelling function to check the detailed statistics and summary of the model from the selected features. The result of the analysis showed that there were still features with p-values greater than 0.05 on assumptions that the covariance matrix of the standard errors (SEs) was correctly specified and that the smallest eigenvalue of 1.99 × 10⁻³³ might indicate strong multicollinearity problems or that the design matrix was singular.
Then, the VIF values for each feature of the model were calculated (Table 1). All the features with VIF > 5 and p > 0.05 were considered insignificant and, as a result, dropped from the model. Since the p-values and VIF of FCASA-, vsurf_G, vsurf_HB1, E_str, MNDO_LUMO, and vsurf_DD12 were in the desired range, that means they are significant features and will be used to build the machine learning models.

Table 1.
Results of Statsmodel analysis.
3.3. Residual Analysis of the Model
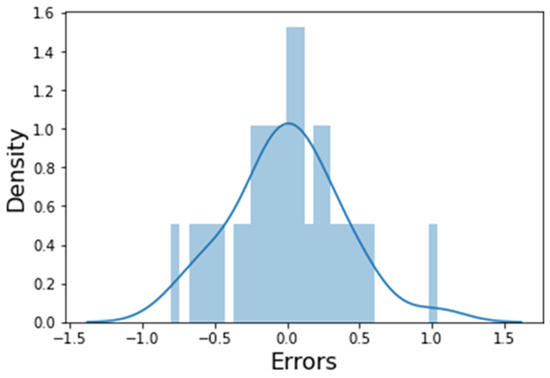
The residue analysis of the error terms was checked to ascertain their normal distribution, and the error terms of the histogram were plotted (Figure 2). A normal distribution is one of the major assumptions of multiple linear regression, and since the error terms are normally distributed, the model can be used to make predictions on the test data set.

Figure 2.
Histogram of error terms.
3.4. Model Building
Machine-learning-based algorithms were built from the significant features to predict the pIC50 values of the test molecules. The predicted pIC50 values for the test compounds are shown in Table 2.

Table 2.
Predicted pIC50 of the test molecules using the MLR model.
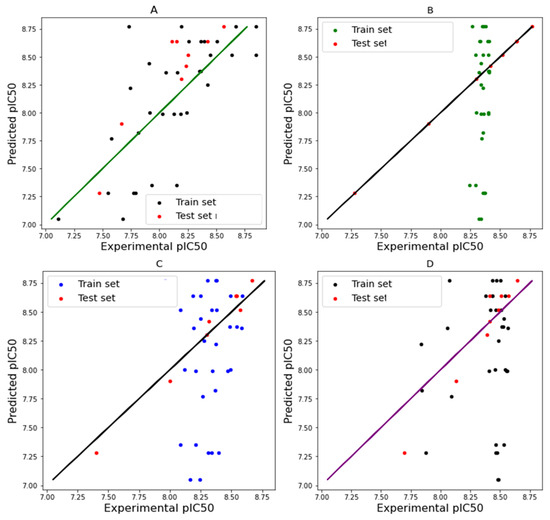
To prove further confidence in our predicted pIC50 values, the predicted pIC50 scores were plotted against the experimental pIC50 scores for both the train set and the test set, using different machine learning models (Figure 3). The closeness of the predicted pIC50 scores and the experimental scores for Figure 3A,C shows the robustness of the MLR and SVR models in predicting the antiplasmodial activity of Tzpd. This showed that the predictive powers of the models are competent. The correlations of the predicted and experimental pIC50 values are shown in Figure 3A–D. The R2 indicates how closely the data resemble the regression line and how well the data fit the regression line.

Figure 3.
Regression plots of different models ((A) = MLR; (B) = KNN; (C) = SVR; and (D) = RFR).
3.5. Model Evaluation and Comparison
The summary of the performance of the models is shown in Table 3.

Table 3.
Model prediction statistics.
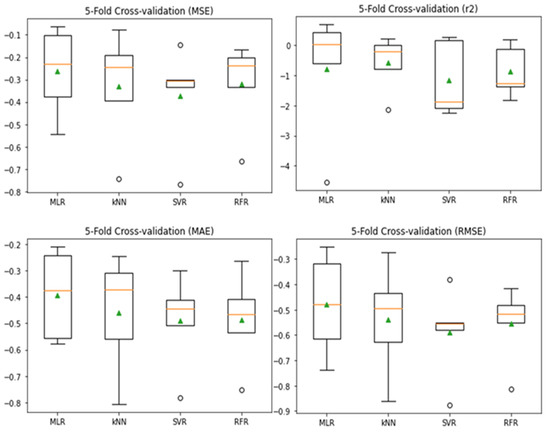
Fivefold cross-validation scores of MLR, kNN, SVR, and RFR were plotted on a boxplot, and their performances were compared (Figure 4). The performance metrics for each model were plotted as a box. Using the 5-fold cross-validation approach, MLR and SVR outperform the other models, as the median line was visibly higher in all the metrics used.

Figure 4.
Boxplots of 5-fold CV scores.
4. Conclusions
The study demonstrated that MLR and SVR are powerful predictive supervised learning models with reproducible outcomes and the lowest model errors when compared to kNN and RFR. The multiple linear regression equation, pIC50(predicted) = 8.06 − 0.45vsurf_G + 0.37FCASA- − 0.42MNDO_LUMO − 0.20E_str + 0.30vsurf_HB1 − 0.38vsurf_DD12), allows for the prediction of antiplasmodial activity which can be utilized in the design of new bioactive chemical entities using artificial intelligence qualities.
Supplementary Materials
The following supporting information can be downloaded at: https://www.mdpi.com/article/10.3390/ecsoc-27-16167/s1, Figure S1: Chemical data set.
Author Contributions
Conceptualization, design, and supervision, C.O.N. and W.O.O.; software, C.O.N.; validation, W.O.O.; formal analysis, K.S.U.; investigation, K.S.U.; resources and data curation, C.O.N. and K.S.U.; writing—original draft preparation, K.S.U.; writing—review and editing, C.O.N.; visualization, K.S.U. All authors have read and agreed to the published version of the manuscript.
Funding
This research received no external funding.
Institutional Review Board Statement
Not applicable.
Informed Consent Statement
Not applicable.
Data Availability Statement
Data are contained within the article.
Acknowledgments
The authors are grateful to Thecla Ayoka for the software she provided.
Conflicts of Interest
The authors declare no conflict of interest.
References
- Ikerionwu, C.; Ugwuishiwu, C.H.; Okpala, I.; James, I.; Okoronkwo, M.; Nnadi, C.; Orji, U.; Ebem, D.; Ike, A. Application of machine and deep learning algorithms in optical microscopic detection of Plasmodium: A malaria diagnostic tool for the future. Photodiagn. Photodyn. Ther. 2022, 40, 103198. [Google Scholar] [CrossRef] [PubMed]
- Oguike, E.; Ugwuishiwu, C.; Asogwa, C.; Nnadi, C.; Obonga, W.; Attama, A. A systematic review on the application of machine learning to quantitative structure-activity relationship modeling against Plasmodium falciparum. Mol. Divers. 2022, 26, 3447–3462. [Google Scholar] [CrossRef] [PubMed]
- Ikwuka, C.E.; Asogwa, C.M.; Ikwuka, O.J.; Ogbonna, J.E.; Onah, C.E.; Ohama, C.C.; Nnadi, C.O. Insights into the In-vivo Antiplasmodial Activity of Trisdimethylamino Pyrimidine Derivative in Plasmodium berghei Infected Mouse Model. J. Pharm. Res. Int. 2022, 34, 33–40. [Google Scholar] [CrossRef]
- Nnadi, C.O.; Ayoka, T.O.; Okorie, H.N. A ligand-based approach to lead optimization of N, N’-substituted diamines for leishmanicidal activity. Biointerface Res. Appl. Chem. 2022, 12, 7429–7437. [Google Scholar]
- Nnadi, C.O.; Althaus, J.B.; Nwodo, N.J.; Schmidt, T.J. A 3D-QSAR study on the antitrypanosomal and cytotoxic activities of steroid alkaloids by comparative molecular field analysis. Molecules 2018, 23, 1113. [Google Scholar] [CrossRef] [PubMed]
- Wu, W.; Chen, M.; Fei, Q.; Ge, Y.; Zhu, Y.; Chen, H.; Yang, M.; Ouyang, G. Synthesis and Bioactivities Study of Novel Pyridylpyrazol Amide Derivatives Containing Pyrimidine Motifs. Front. Chem. 2020, 8, 522. [Google Scholar] [CrossRef] [PubMed]
- Chemical Computing Group. Molecular Operating Environment (MOE) rel. 2011.10; Chemical Computing Group Inc.: Montreal, QC, Canada, 2014. [Google Scholar]
- Sydow, D.; Morger, A.; Driller, M.; Volkamer, A. TeachOpenCADD: A teaching platform for computer-aided drug design using open-source packages and data. J. Cheminform. 2019, 11, 29–36. [Google Scholar] [CrossRef] [PubMed]
- Du, Z.; Yang, H.; Lv, W.J.; Zhang, X.Y.; Zhai, H.L. prediction of the inhibitory concentrations of chloroquine derivatives using deep neural network models. J. Biomol. Struct. Dyn. 2021, 39, 672–680. [Google Scholar] [CrossRef] [PubMed]
- Afuwape, A.A.; Xu, Y.; Anajemba, J.H.; Srivasta, G. Performance evaluation of secured network traffic classification using machine learning approach. Comput. Stand. Interfaces 2021, 78, 103545. [Google Scholar] [CrossRef]
Disclaimer/Publisher’s Note: The statements, opinions and data contained in all publications are solely those of the individual author(s) and contributor(s) and not of MDPI and/or the editor(s). MDPI and/or the editor(s) disclaim responsibility for any injury to people or property resulting from any ideas, methods, instructions or products referred to in the content. |
© 2023 by the authors. Licensee MDPI, Basel, Switzerland. This article is an open access article distributed under the terms and conditions of the Creative Commons Attribution (CC BY) license (https://creativecommons.org/licenses/by/4.0/).