1. Introduction
Urban agriculture (UA) has become increasingly popular across cities in various systems such as individual plots on public and private lands, community gardens and building rooftops [
1]. Rooftop urban farms provide a solution for limited space at the ground level in cities. However, they pose several challenges, including an increased need for a workforce and a demand for efficient water use. Over the last decade, advancements in information and communication technology (ICT) and developments in the Internet of Things (IoT) have improved sensors’ potential to monitor, transmit and manage environment-related metrics [
2,
3]. IoT-enabled solutions in farming and agriculture applications can reduce the workforce and the need for human interaction, reducing overall operational costs. Furthermore, using the IoT on agricultural green infrastructure provides an opportunity to improve the general understanding of how these complex systems function, which results in better design/planning strategy and operation and, therefore, improved performance.
Several studies have investigated the potential of IoT for crop production, including works that used temperature and soil moisture as indicating parameters [
4,
5]. When used in agricultural applications, some researchers found evidence that IoT helps in soil management and nutrient detection [
6]. Others considered IoT to transform farming into a smart process by monitoring health diseases and sending alarm notifications to farmers [
7,
8]. Some studies have turned their attention to adaptive irrigation systems to conserve water, time and energy [
9].
Many cities are becoming water-stressed and are also experiencing challenges with urban drainage systems. Careful water use and managed stormwater have become imperative in achieving sustainability goals through urban farming. Water management in farms requires an understanding of drainage patterns, which can be monitored through sensors. A recent line of IoT-related research has focused on developing low-cost sensors to measure water levels in rivers using various approaches such as ultrasonic sensors [
10,
11]. However, ultrasonic sensors are limited to higher distances and are inapplicable in small drains. Moreover, most IoT literature records have dominantly used Wi-Fi and mobile technology as protocols. Fewer studies have used LoRaWAN, a communication technology known for its highly low-power requirements and long-range coverage.
This work proposes an IoT-enabled, wireless sensor node composed of low-cost, off-the-shelf water level sensors and microcontrollers that monitor and sends real-time data through LoRaWAN to the internet. The paper is divided into several sections to address the design stages, field deployment and suggestions for maintenance.
2. Materials and Methods
2.1. Description of Study Site: Urban Farm Living Lab
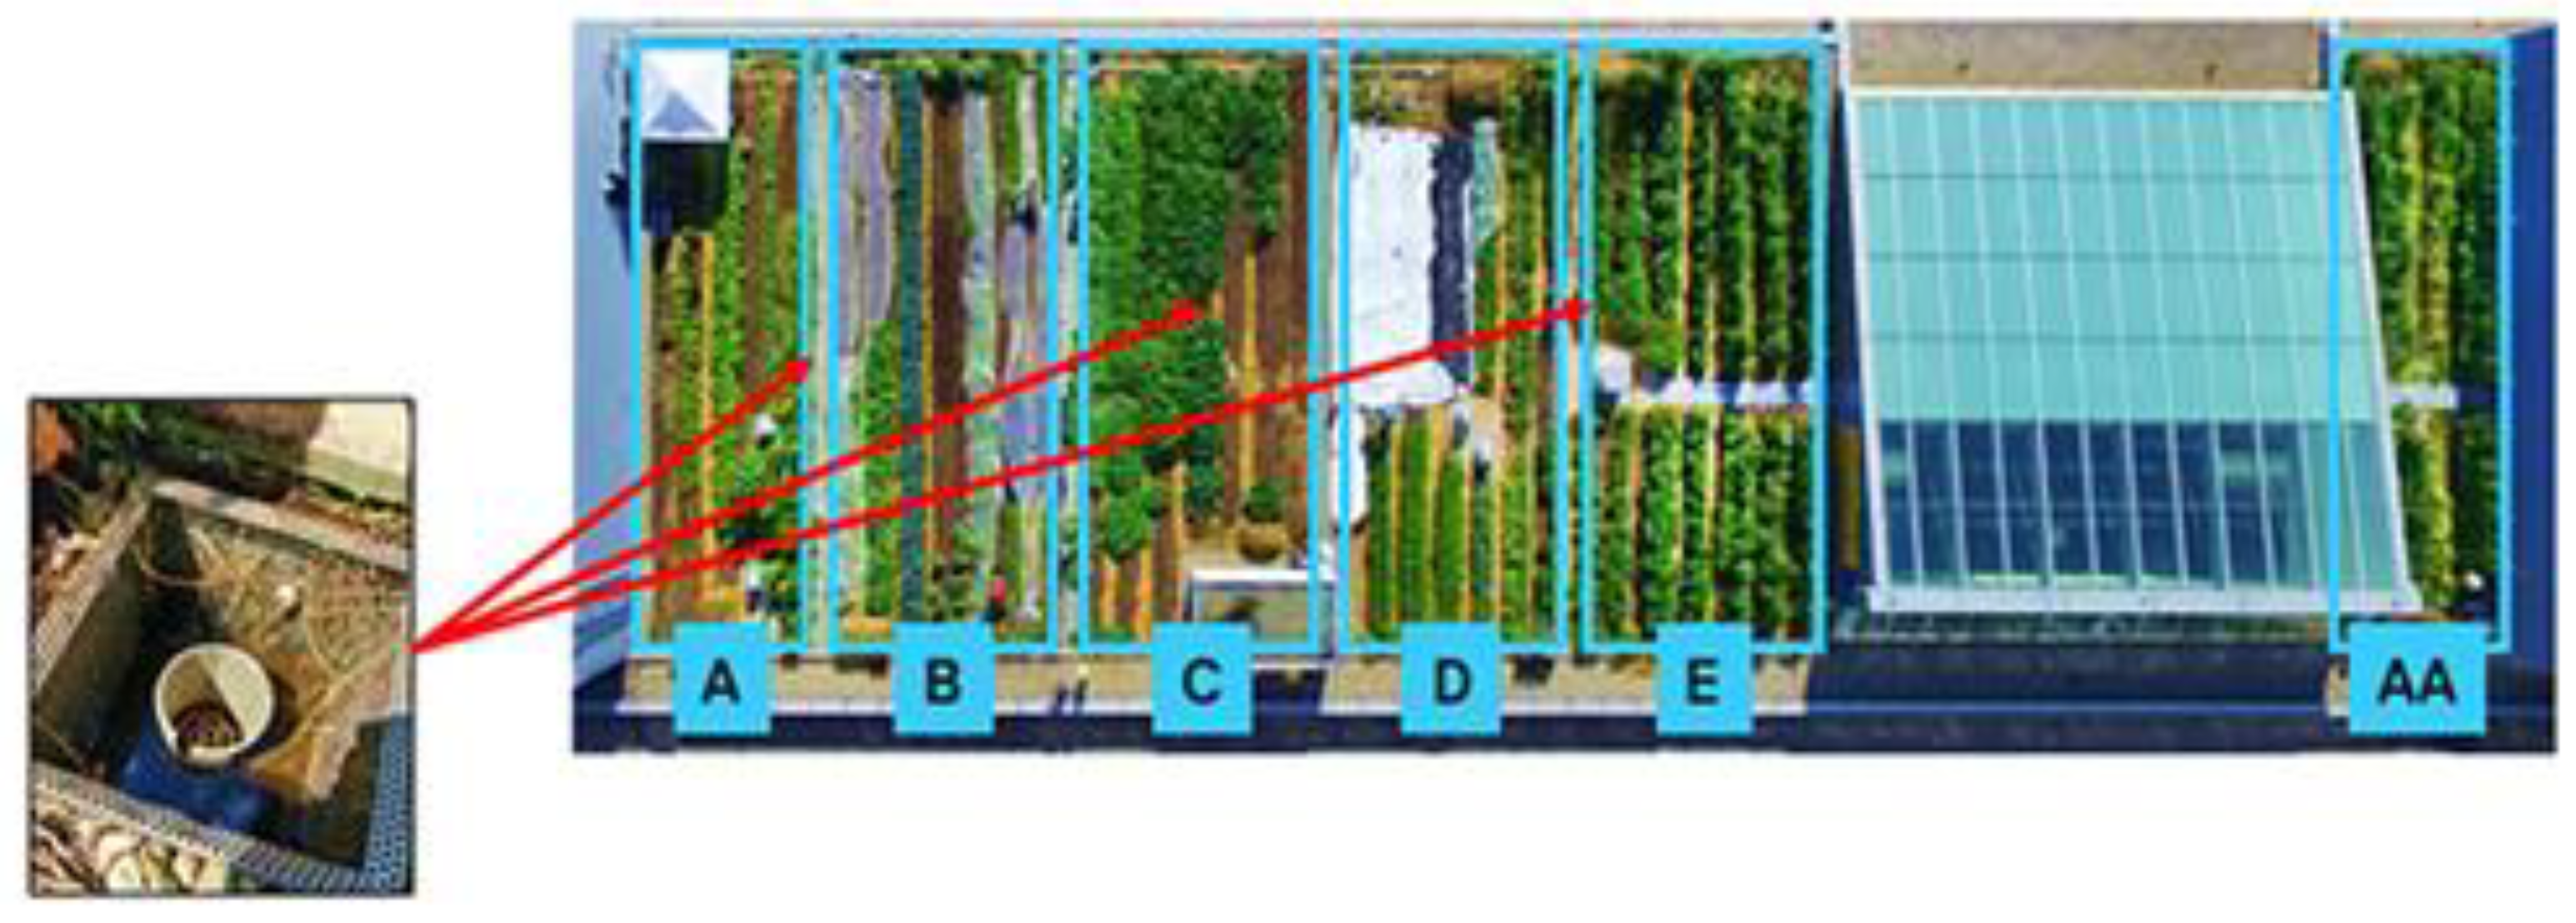
The Urban Farm Living Lab (UFLL) is located on the rooftop of George Vari Engineering and Computing Centre at the campus of Ryerson University (renaming in process) in downtown Toronto, Canada. Initially, it was an intensive green roof built in 2004 and converted to a farm in 2014. The Urban Farm grows roughly 3500 to 4500 kg of produce annually. The farm is split into different plots, A, B, C, D, E and AA, with three drains implemented across the plots (
Figure 1).
2.2. IoT System Architecture
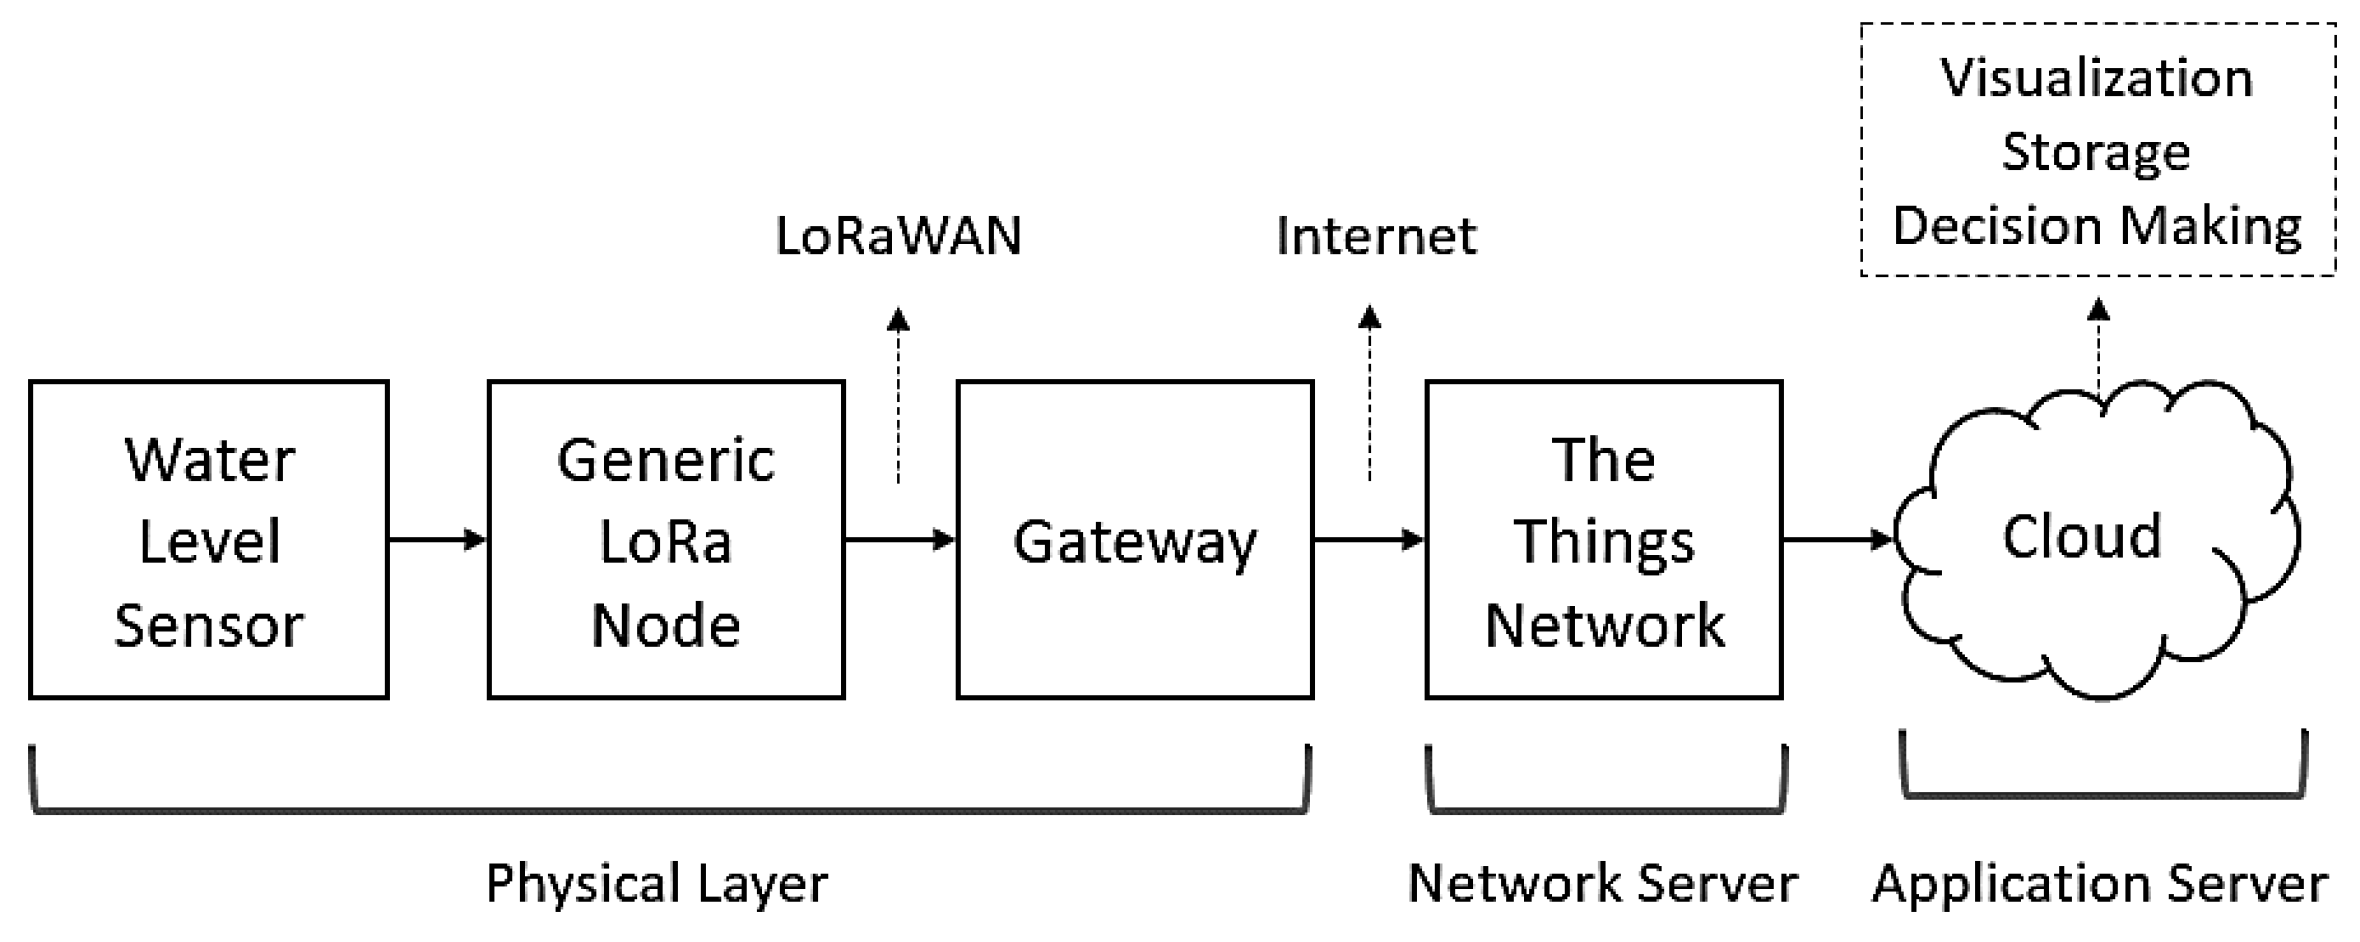
The proposed IoT system is based on LoRaWAN technology. It consists of a microcontroller-based LoRa generic node and a water level sensor combined in a ‘sensor node’ placed to acquire real-time values. The monitored information is transmitted in data packets through a nearby gateway to The Things Network (TTN). TTN is an open platform that acts as a network layer by receiving and rerouting the data from sensor nodes to the cloud. The cloud server, which can be accessed through desktop and mobile applications, allows users to store the water level data and visualize it in various forms to obtain information on the volume, rate and timing of drained water.
Figure 2 depicts the IoT system architecture.
2.2.1. Hardware Setup and Physical Circuit
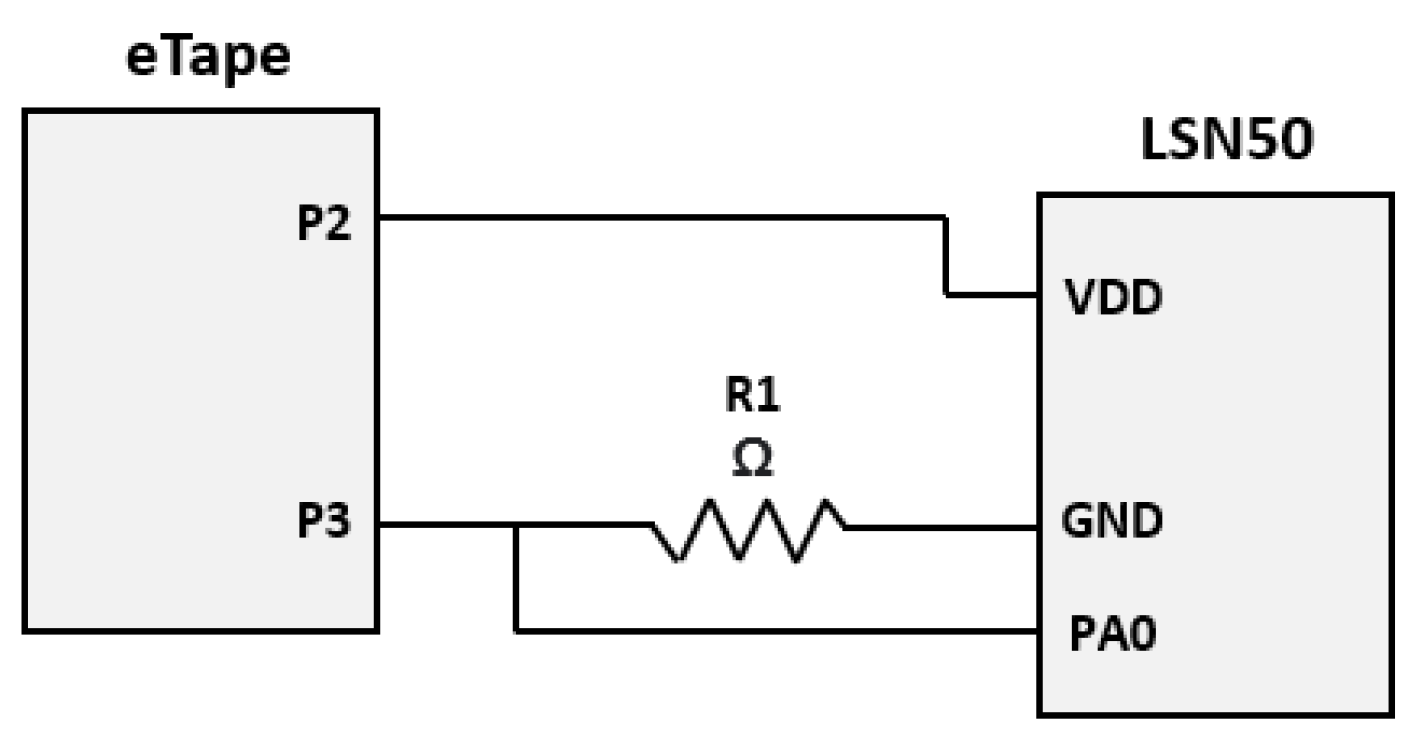
The water level sensor is commercially known as the eTape liquid level sensor (USD 49) and works by providing a corresponding resistance value inversely proportional to the liquid level (Milone Technologies, Sewell, NJ, United States). The used LoRa sensor node is commercially known as LSN50 (USD 43), powered by a 4000-mA battery and designed to provide secure data transmission of sensors’ data (LSN50, Dragino, Shenzhen, China). The sensor was connected to the node through a voltage-divider circuit, as shown in
Figure 3. The circuit utilized two pins on the eTape; pins 2 and 3 connected to VDD and GND of the LSN50, respectively. To create a voltage divider between the components, a resistor with a range of 0–2000 ohms was attached between pin 3 and GND. The exact value of the resistor is not prescribed, as the calibration (discussed in the next section) is performed based on the used resistor. Additionally, pin 3 of the eTape was connected to PA0 of the LSN50 to deliver the analog input information in volts.
The LSN50 was registered to TTN using the Device EUI, Application EUI and App Key provided by the manufacturer. This sensor node, similar to other LoRa devices, operates over the air authentication (OTTA) when connected to TTN, meaning that the registration keys cannot be compromised before activation. A LoRaWAN gateway installed previously on campus was used to connect the sensors. Gateways are an essential intermediary connection between sensors and TTN. This project’s gateway’s frequency was US-902-928, specific for North America.
2.2.2. Payload Encoder and Sensor Calibration
Motivated by the need for low-code IoT implementation, many LoRa device manufacturers have started to grant open access to coding documentation and online decoders requiring less user configuration. Data are exchanged over TTN through bytes which can be decoded into a usable format. In this work, the LSN50 node has an open-access code that was used in the TTN payload decoder after it was slightly modified to read the data from the used water level sensors.
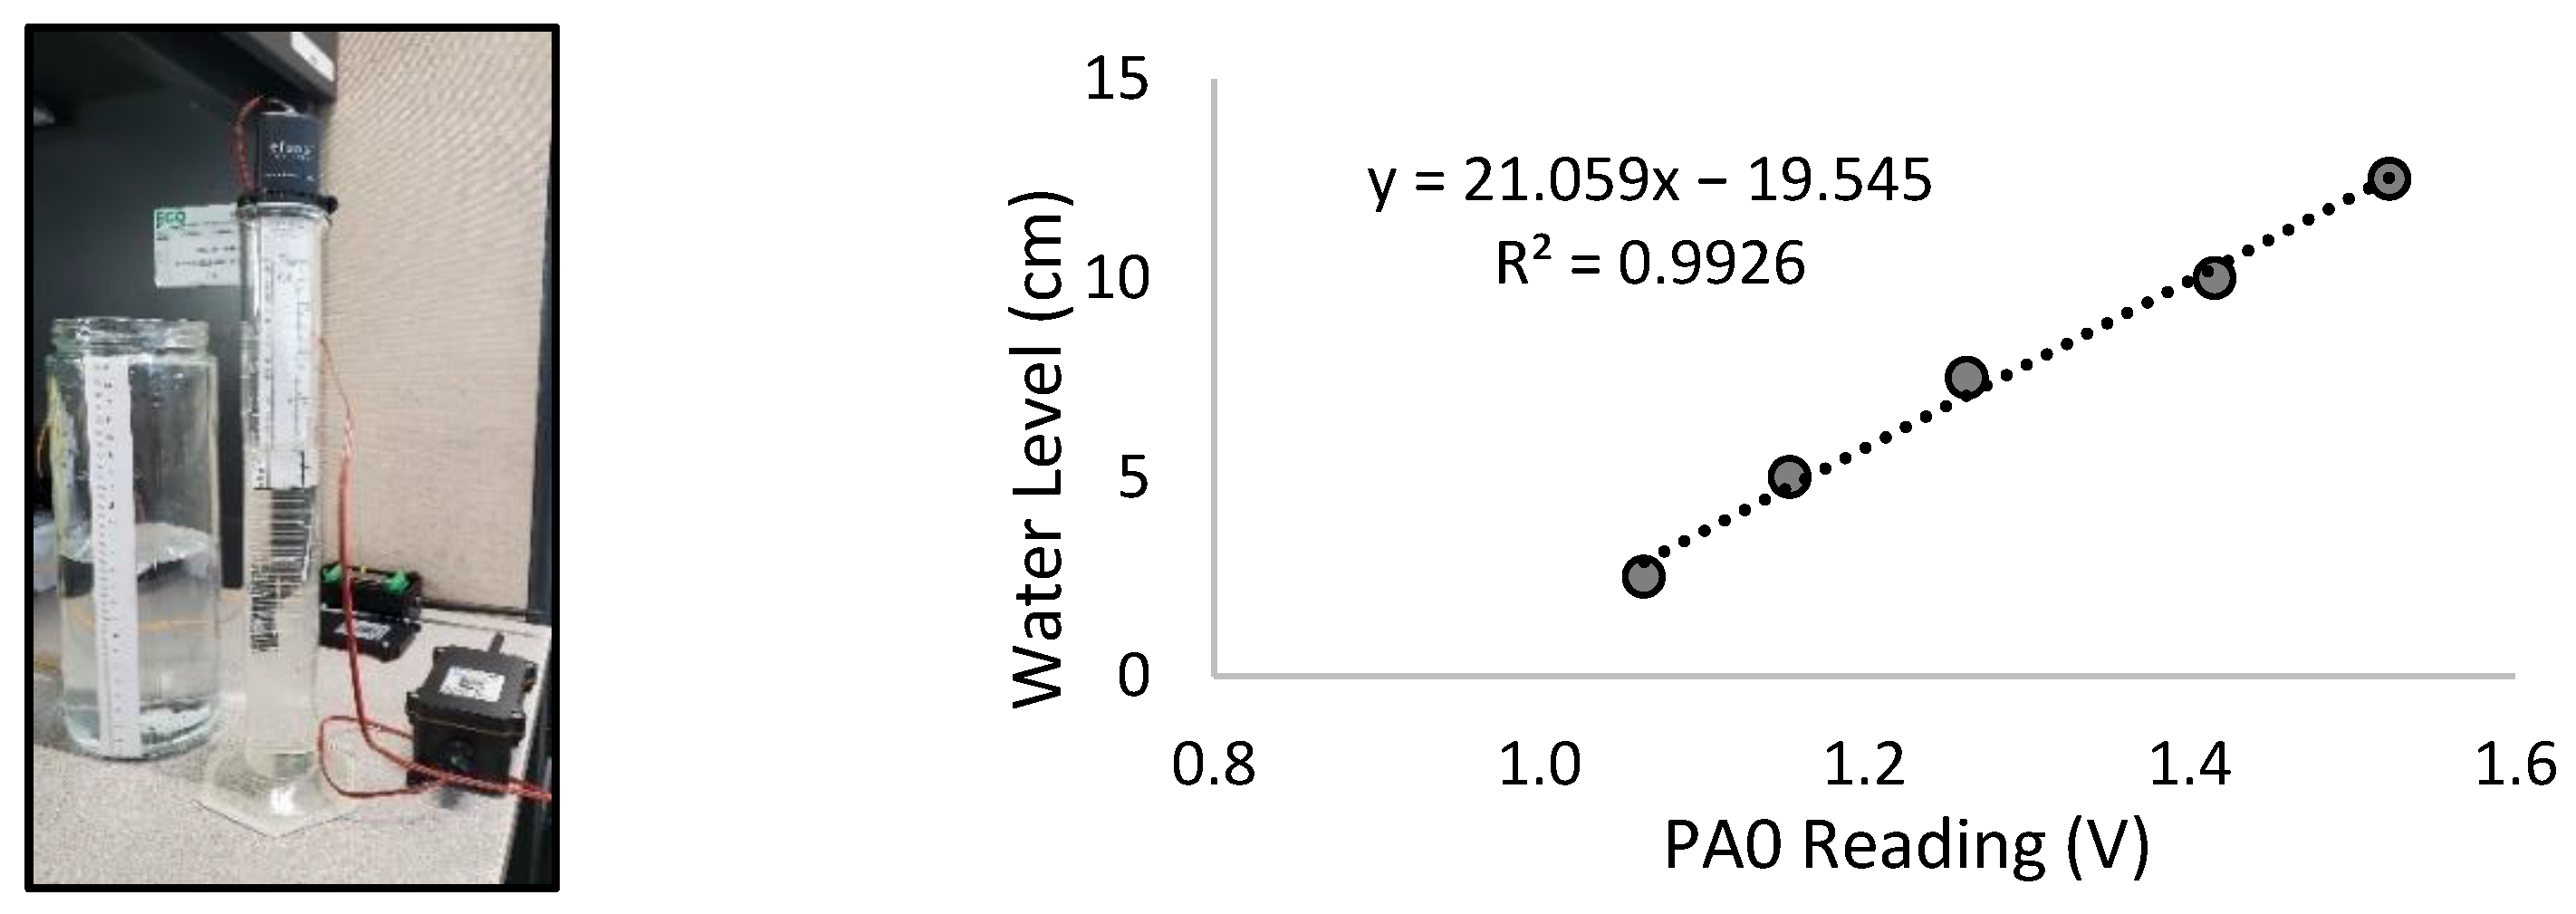
Once device registration and activation on TTN were complete, the data were decoded into the specified payload format and stored temporarily on the platform before migrating to the cloud. The initial decoded data were used to calibrate the water level sensors at this stage. The sensor sends analog input voltage, which needs to be converted into a water level value. The calibration started at a reference level equal to zero (i.e., in the absence of water), then water was gradually added to 2.5, 5, 7.5, 10 and 12.5 cm. The sensor was given sufficient time to report numerous readings at each water level, and an average reading was then recorded. This protocol was followed to minimize the sensor noise and ensure accuracy. The water levels were then plotted against their corresponding voltage values, as shown in
Figure 4, and the equation was used in the payload decoder to complete the calibration process.
2.3. Field Deployment
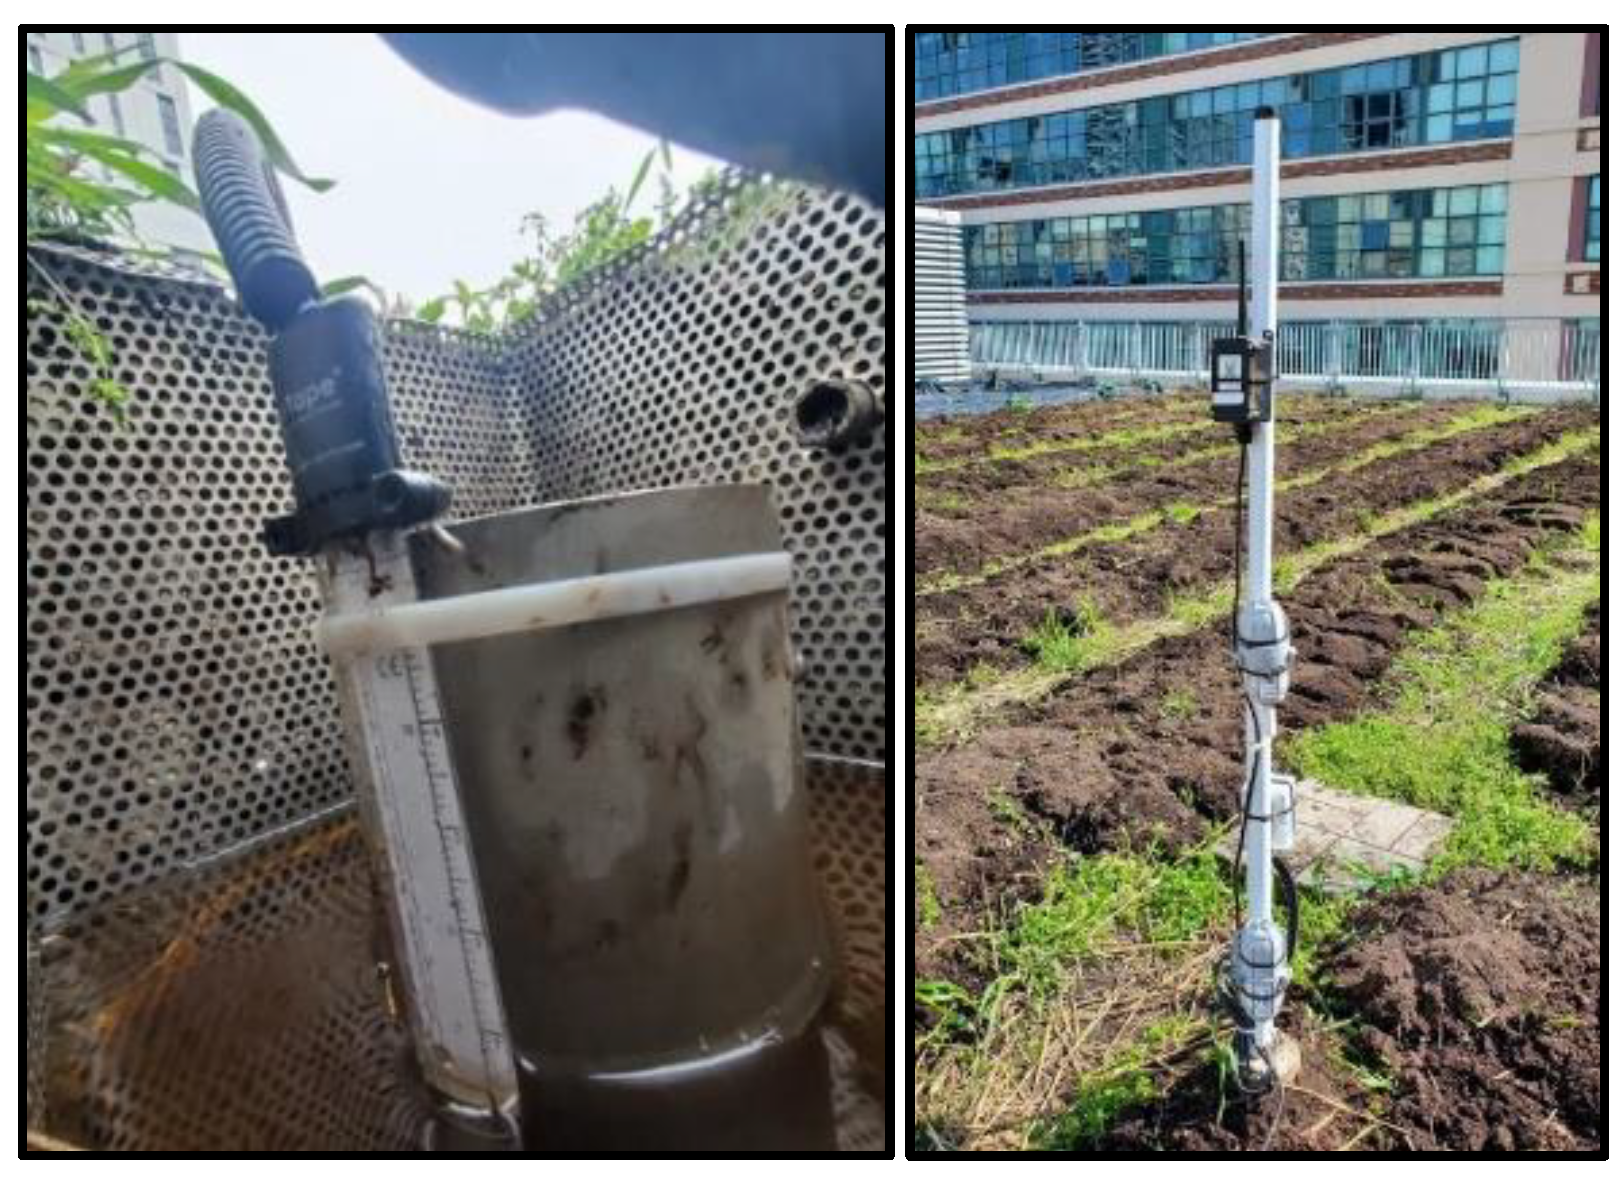
As previously mentioned, the farm had three outlets to drain water. Each of these drains was equipped with a developed water level sensor node. The eTape was fitted in a polycarbonate protective tube, and a housing cap covered its pins. The wires between the eTape and LSN50 were shielded, and the node itself was mounted on a custom-made pole to ensure that the antenna was unobstructed, as shown in
Figure 5.
2.4. Interactive Platform and Cloud Storage
Many open IoT development platforms have recently been used to visualize and store monitored data. Ubidots was used as a visualization platform and storage cloud in this case study. The platform also allows users to create conditional events and data-based alerts. Since the eTape does not come with LSN50 by default and it had been configured to suit the goal of this project, alerts were made to notify users through SMS messages whenever the sensor is off or its battery drops below a certain level.
3. Results and Discussion
3.1. Data Analysis of Rainfall Events
The sensor nodes were deployed during the growing season of 2021 between June to December on a monitoring frequency of 5 min. A sensor was fixed to a v-notch weir installed in each drain to allow flow estimation. The flow over the weir was determined using the weir rating curve developed through laboratory analysis. Precipitation data from a weather station located on the roof were used to analyze the amount of rainwater discharged by the farm.
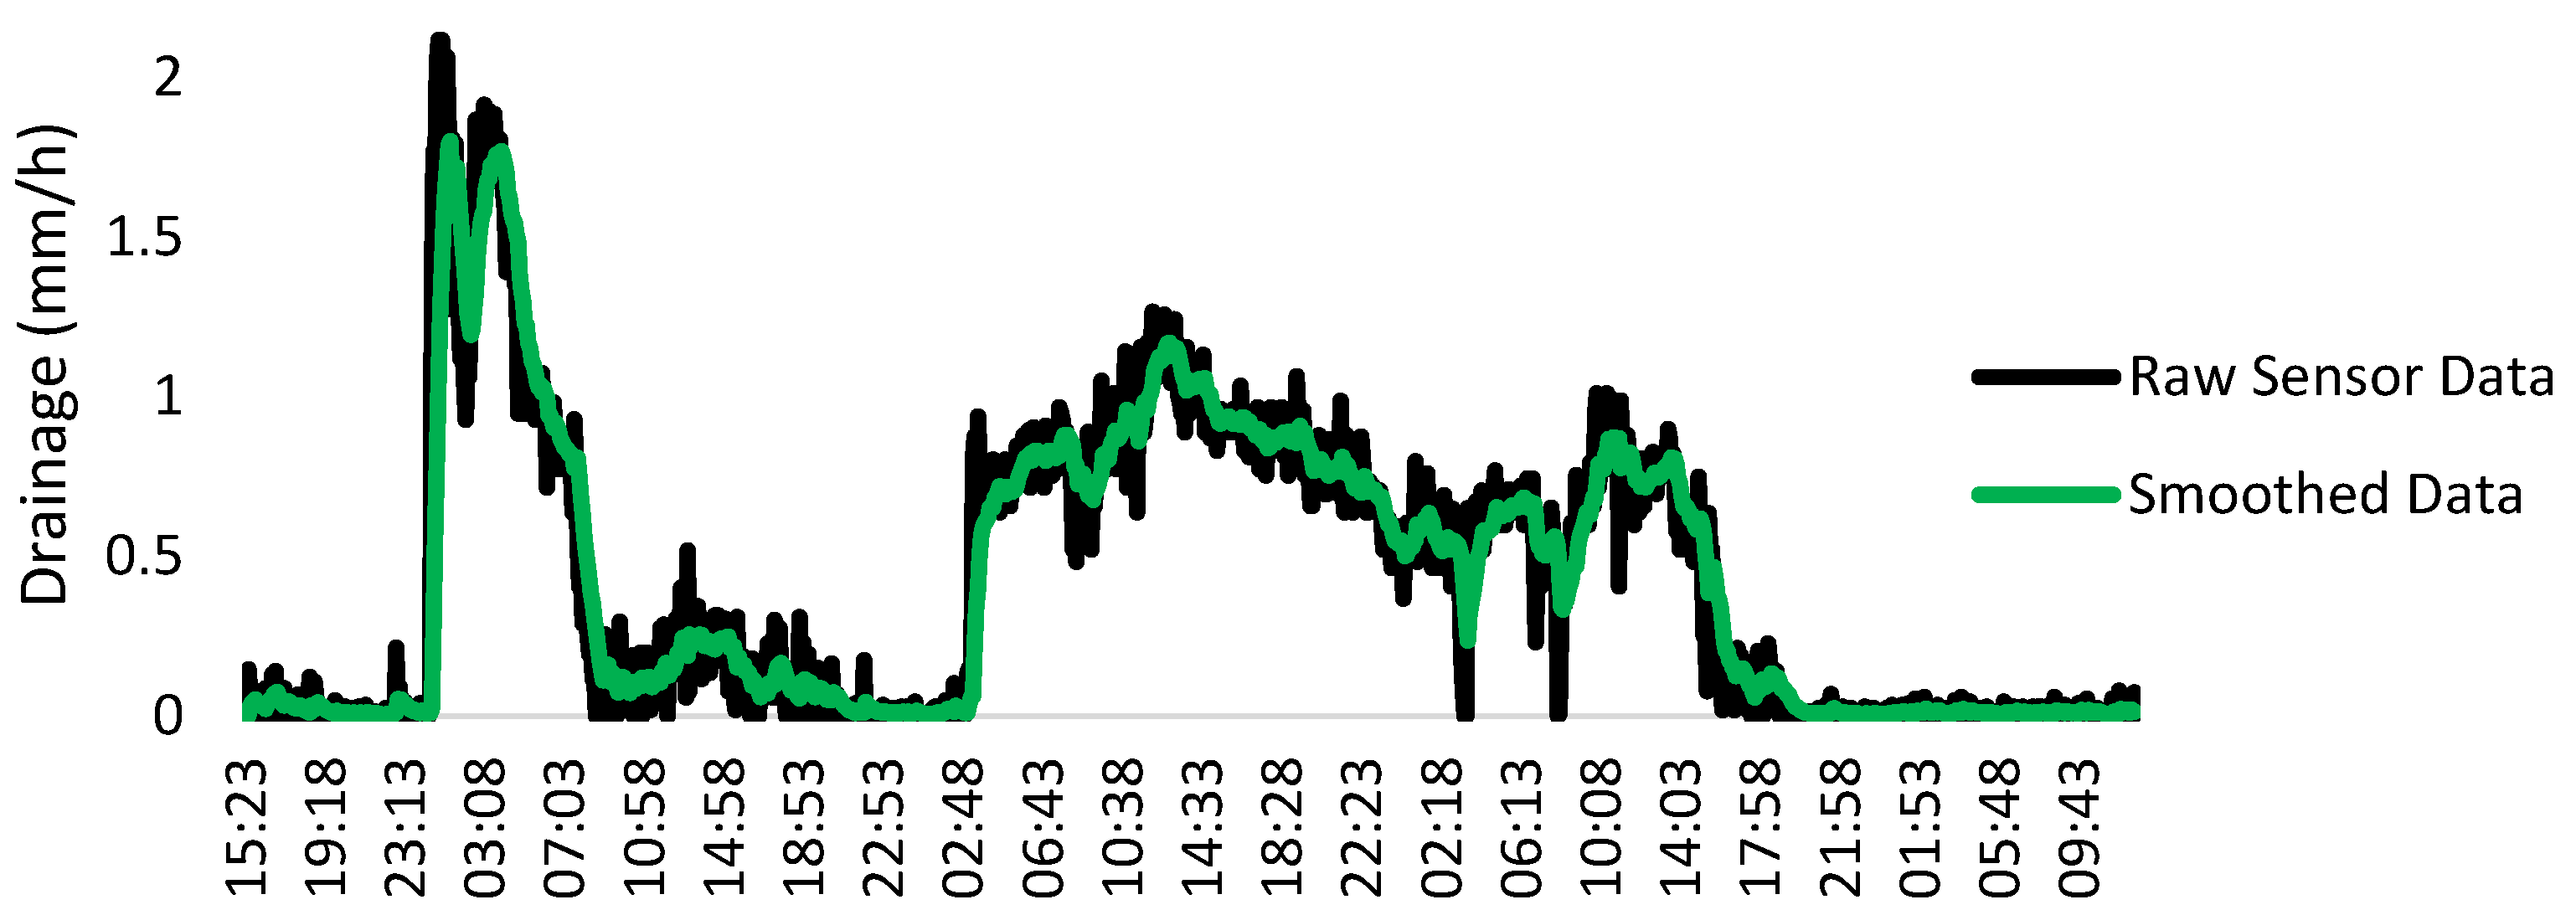
Considering that this project’s scope is limited to developing low-cost wireless water level sensor nodes using commercially available products, the gateway installed on campus had an insignificant distance to the sensor nodes, meaning that the signal strength was adequate, and data packet loss was not an issue. The developed sensor node provided consistency and high-quality data over the season. However, to address the sensor noise, water level data were smoothed to reduce dispersion and remove outliers using the exponential smoothing (ES) method.
Figure 6 shows an example of raw versus smoothed sensor data.
3.2. Energy Consumption and Maintenance Activities
One essential element that makes LoRaWAN sensors feasible is their low power need. Today, many of these sensors operate on replaceable batteries. Estimating the battery life is a critical step in designing IoT development projects. However, an accurate prediction is not always possible because battery life depends on other factors besides battery capacity and system current. In wireless sensor nodes, the drained current significantly varies during the ‘sleeping’ and ‘sampling’ modes.
Furthermore, the spreading factor (SF) is another variable that influences battery usage. It is defined as the number of bits per chirp signal and is a function of modulation bandwidth. Higher spreading factors result in longer transmission durations and consequently shorter life. In this work, the initial assessment considering the LSN50 battery capacity and eTape current revealed an approximate battery life of six months. However, batteries needed to be replaced every two months. A possible reason for this discrepancy might be that other factors such as sampling times and time on-air were not carefully analyzed. These observations suggest the need for in-depth energy usage analysis and the selection of optimal spreading factors.
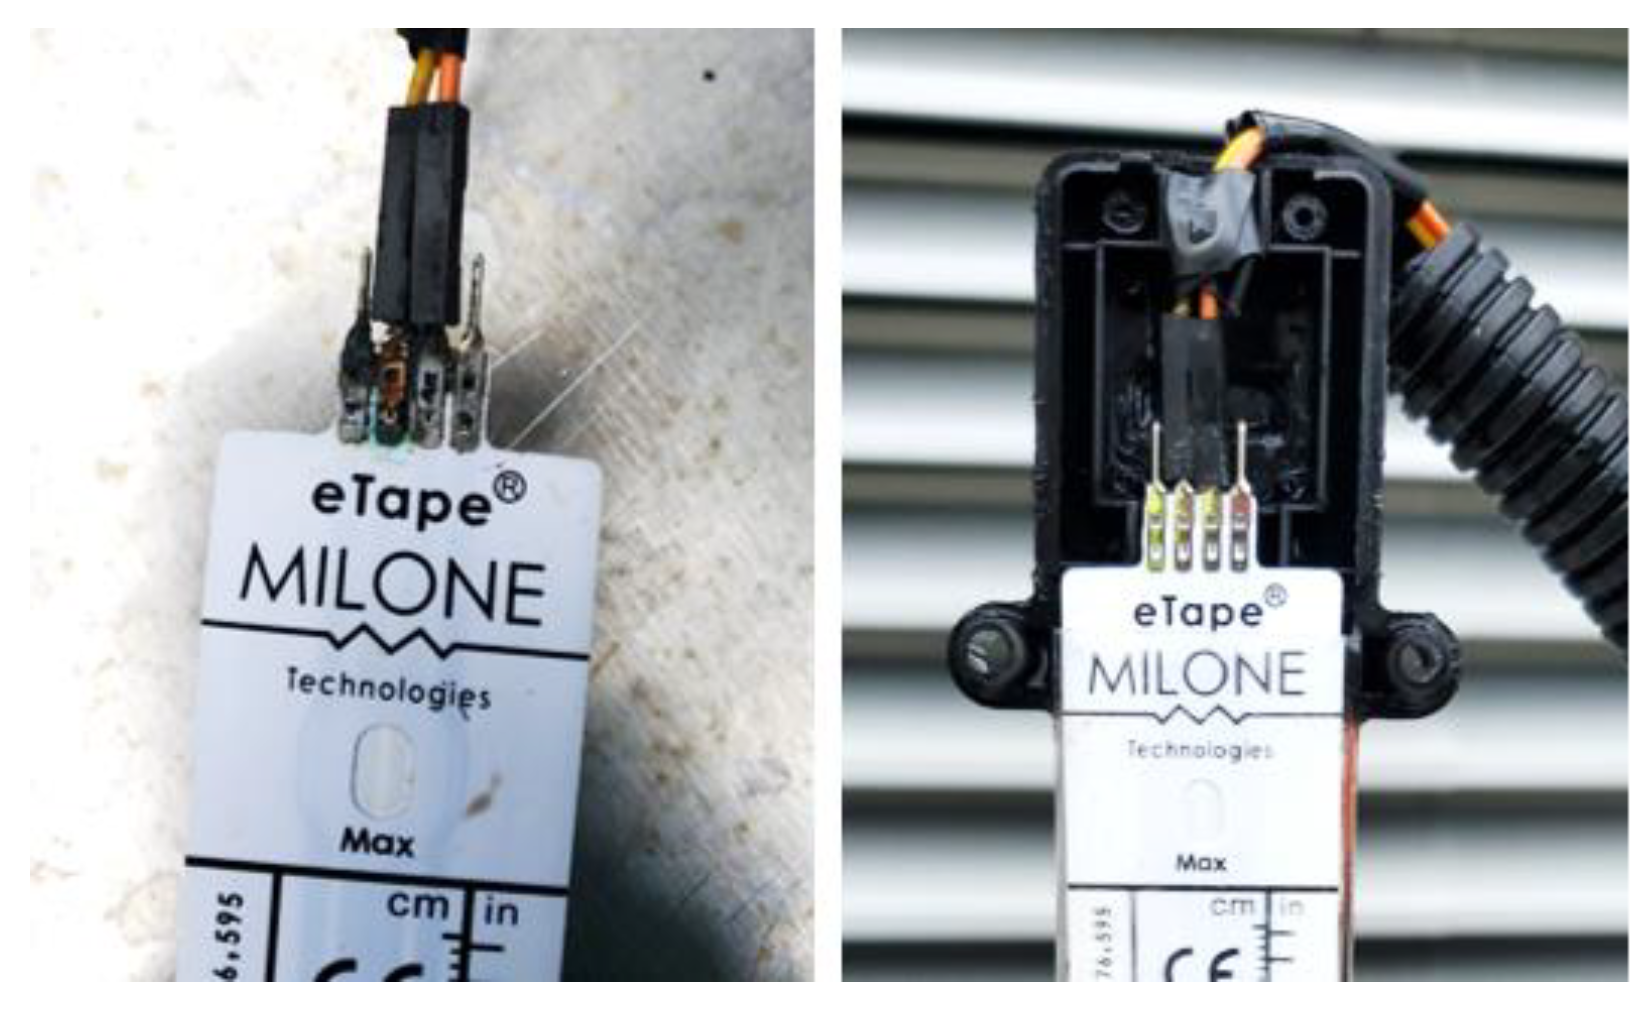
The developed sensor nodes performed as expected throughout the monitoring period, and other than battery replacements, they required no human interaction. Onsite calibration checks were performed several times, and the accuracy was found to be maintained without a need for recalibration. However, after several months of installation, some nodes disconnected and became faulty. Upon investigation, the sensor pins were found to be severely corroded. The problem could be avoided by isolating the pins with liquid electrical tape. The faulty sensors were replaced, as shown in
Figure 7.
4. Conclusions
This study presented the design and deployment of a custom-built, IoT-enabled sensor node to measure water level wirelessly through LoRaWAN at a rooftop farm using off-the-shelf products. Over an entire growing season, the sensor node demonstrated a reliable performance by providing real-time data of the runoff generated on the rooftop farm. However, the node unexpectedly required frequent battery replacements indicating the need for further analysis of energy usage. As rooftop farms are becoming popular in urban areas with drainage systems struggling to cope with increasing load, low-cost monitoring is crucial to evaluate stormwater management and the monitoring of inflows and outflows. Moreover, the IoT architecture presented in this work is scalable and extensible; the used off-the-shelf components can be replaced and combined with other sensors and microcontrollers to align with various agricultural goals, including water management, nutrient detection and crop health.
Author Contributions
Conceptualization, T.A. and D.J.; methodology, T.A., T.S. and D.J.; software T.A., T.S. and D.J.; validation, T.A.; formal analysis, T.A.; investigation, T.A.; resources, T.A. and D.J.; data curation, T.A.; writing—original draft preparation, T.A.; writing—review and editing, T.A. and D.J.; visualization, T.A.; funding acquisition, D.J. All authors have read and agreed to the published version of the manuscript.
Funding
This research was funded by the Natural Sciences and Engineering Research Council of Canada (NSERC) Collaborative Research and Training Experience Program (CREATE). Andrew and Valerie Pringle provided funding for equipment purchases through the Urban Farm Living Lab.
Institutional Review Board Statement
Not applicable.
Informed Consent Statement
Not applicable.
Data Availability Statement
The data are available from the corresponding author upon reasonable request.
Conflicts of Interest
The authors declare no conflict of interest.
References
- Orsini, F.; Gasperi, D.; Marchetti, L.; Piovene, C.; Draghetti, S.; Ramazzotti, S.; Bazzocchi, G.; Gianquinto, G. Exploring the production capacity of rooftop gardens (RTGs) in urban agriculture: The potential impact on food and nutrition security, biodiversity and other ecosystem services in the city of Bologna. Food Secur. 2014, 6, 781–792. [Google Scholar] [CrossRef]
- Kerkez, B.; Gruden, C.; Lewis, M.; Montestruque, L.; Quigley, M.; Wong, B.; Bedig, A.; Kertesz, R.; Braun, T.; Cadwalader, O.; et al. Smarter stormwater systems. Environ. Sci. Technol. 2016, 50, 7267–7273. [Google Scholar] [CrossRef] [PubMed]
- Ullo, S.L.; Sinha, G.R. Advances in Smart Environment Monitoring Systems Using IoT and Sensors. Sensors 2020, 20, 3113. [Google Scholar] [CrossRef] [PubMed]
- Pandithurai, O.; Aishwarya, S.; Aparna, B.; Kavitha, K. Agro-tech: A digital model for monitoring soil and crops using internet of things (IOT). In Proceedings of the 2017 Third International Conference on Science Technology Engineering & Management (ICONSTEM), Chennai, India, 23–24 March 2017. [Google Scholar]
- Roslin, N.A.; Che’Ya, N.N.; Rosle, R.; Ismail, M.R. Smartphone Application Development for Rice Field Management Through Aerial Imagery and Normalised Difference Vegetation Index (NDVI) Analysis. Pertanika J. Sci. Technol. 2021, 29, 809–836. [Google Scholar] [CrossRef]
- Ananthi, N.; Divya, J.; Divya, M.; Janani, V. IoT based smart soil monitoring system for agricultural production. In Proceedings of the 2017 IEEE Technological Innovations in ICT for Agriculture and Rural Development (TIAR), Chennai, India, 7–8 April 2017. [Google Scholar]
- Putjaika, N.; Phusae, S.; Chen-Im, A.; Phunchongharn, P.; Akkarajitsakul, K. A control system in an intelligent farming by using arduino technology. In Proceedings of the 2016 Fifth ICT International Student Project Conference (ICT-ISPC), Nakhonpathom, Thailand, 27–28 May 2016. [Google Scholar]
- Mekala, M.; Viswanathan, P. A novel technology for smart agriculture based on IoT with cloud computing. In Proceedings of the 2017 International Conference on I-SMAC (IoT in Social, Mobile, Analytics and Cloud) (I-SMAC), Palladam, India, 10–11 February 2017. [Google Scholar]
- Suciu, G.; Fratu, O.; Vulpe, A.; Butca, C.; Suciu, V. IoT agrometeorology for viticulture disease warning. In Proceedings of the 2016 IEEE International Black Sea Conference on Communications and Networking (BlackSeaCom), Varna, Bulgaria, 6–9 June 2016. [Google Scholar]
- Prafanto, A.; Budiman, E. A Water Level Detection: IoT Platform Based on Wireless Sensor Network. In Proceedings of the 2018 2nd East Indonesia Conference on Computer and Information Technology (EIConCIT), Makassar, Indonesia, 6–7 November 2018. [Google Scholar]
- Moreno, C.; Aquino, R.; Ibarreche, J.; Pérez, I.; Castellanos, E.; Álvarez, E.; Rentería, R.; Anguiano, L.; Edwards, A.; Lepper, P.; et al. RiverCore: IoT Device for River Water Level Monitoring over Cellular Communications. Sensors 2019, 19, 127. [Google Scholar] [CrossRef] [PubMed] [Green Version]
| Publisher’s Note: MDPI stays neutral with regard to jurisdictional claims in published maps and institutional affiliations. |
© 2022 by the authors. Licensee MDPI, Basel, Switzerland. This article is an open access article distributed under the terms and conditions of the Creative Commons Attribution (CC BY) license (https://creativecommons.org/licenses/by/4.0/).
