Article

Threshold-Optimized Electronic Health Record-Based Machine Learning for Predicting 1-Year Acute Care Use in Adults with Diabetes at an Urban Health Care System


1
Center for Biostatistics and Epidemiology, Lewis Katz School of Medicine, Temple University, Kresge Science Hall, Suite 340, 3440 N. Broad Street, Philadelphia, PA 19140, USA
2
Center for Data Analytics and Biomedical Informatics, Temple University, 386 SERC, 1925 N. 12th Street, Philadelphia, PA 19122, USA
3
Division of Endocrinology, Diabetes and Nutrition, Department of Medicine, School of Medicine, University of Maryland, Baltimore, Health Sciences Facility III, Room 4050, 670 West Baltimore Street, Baltimore, MD 21201, USA
4
Institute for Health Computing, University of Maryland, 6116 Executive Blvd, Suite 200, North Bethesda, MD 20852, USA
5
Section of Endocrinology, Diabetes and Metabolism, Department of Medicine, Lewis Katz School of Medicine, Temple University, 3322 N. Broad Street, Suite 205, Philadelphia, PA 19140, USA
*
Author to whom correspondence should be addressed.
These authors contributed equally to this work.
Diabetology 2026, 7(6), 116; https://doi.org/10.3390/diabetology7060116
Submission received: 16 April 2026 / Revised: 6 June 2026 / Accepted: 11 June 2026 / Published: 17 June 2026

Abstract

Background/Objectives: Acute care use (ACU)—emergency department visits, inpatient hospitalizations, and observation stays—drives morbidity and costs among adults with diabetes. We developed and evaluated machine-learning models to predict 1-year ACU risk using electronic health record (EHR) data and neighborhood-level data. Methods: We performed a retrospective cohort study using de-identified EHR data from a large urban academic health center, including adults (≥18 years) with diabetes (N = 23,052). The index date was defined as one year before each patient’s last encounter, and ACU was assessed during the subsequent year. We modeled 180 predictors spanning demographics, Area Deprivation Index (ADI), prior healthcare utilization, vitals/BMI, comorbidities, medications, and laboratory results. Decision tree and gradient-boosted models (XGBoost, LightGBM, CatBoost) were tuned with Optuna using 8-fold stratified cross-validation, optimizing area under the receiver operating characteristic curve (AUC). To improve class-balanced classification performance under outcome imbalance, we selected post hoc probability thresholds that maximized Macro F1 and quantified interpretability with permutation feature importance. Results: ACU occurred in 30.53% of patients (7039/23,052). Boosted models achieved AUC ≈ 0.78, with LightGBM performing best (AUC = 0.7839). Macro F1–optimized thresholds (<0.5; typically 0.375–0.40) improved class-balanced performance versus a 0.5 cutoff. Across boosted models, prior utilization features dominated, followed by discharge-related factors and neighborhood deprivation; comorbidities and laboratory results contributed. Conclusions: In this single urban academic health-system cohort of adults with diabetes, EHRbased boosted models demonstrated moderate discrimination for predicting 1-year ACU and identified interpretable predictive signals. Threshold optimization improved class-balanced statistical performance. Prior utilization, care transitions, and neighborhood deprivation emerged as dominant predictive features. External and temporal validation are needed before broader application.

Graphical Abstract

1. Introduction

Diabetes mellitus is a pervasive chronic condition that affects approximately 40.1 million people in the United States, representing 12% of the population in 2023 [1]. The estimated economic burden of diagnosed diabetes reached $412.9 billion in 2022, with direct medical costs accounting for $306.6 billion [1,2]. A primary driver of these expenditures is the utilization of acute care services, including nearly 49 million hospital days and more than 19 million emergency department (ED) visits. Patients with diabetes are more likely to require hospitalization compared to those without the condition [3,4,5]. Furthermore, these patients have a 30-day hospital readmission rate of 14.4% to 22.7%. These unplanned readmissions account for $20 to $25 billion in annual hospital costs, making the identification of high-risk patients a critical priority for healthcare systems, particularly under the Hospital Readmissions Reduction Program (HRRP), which penalizes institutions for excessive readmission rates [6,7,8,9].
The risk of ACU is influenced by a complex interplay of clinical, demographic, and socioeconomic factors [10,11]. Poor glycemic control (elevated HbA1c), insulin use, a high comorbidity burden—especially heart failure and renal disease—and a history of prior hospitalizations are among the most significant clinical predictors for ACU among people with diabetes [6,12,13,14,15]. Acute and chronic complications of diabetes are the most common proximate causes for ACU in this population. Meanwhile, non-medical risk factors include lower socioeconomic status, smoking, poor health literacy, and limited access to primary care physicians.
Most of this prior work has focused on predicting whether a patient will be readmitted within 30 days of hospital discharge [6,7,14,16,17,18,19,20,21,22]. While 30-day readmission is an important endpoint, it neglects other acute care use, such as ED visits and hospital observation stays, subsequent admissions, the first hospitalization (i.e., not a readmission), and events that occur more than 30 days after discharge. Furthermore, because these risk models focus on hospitalized patients, they cannot be used to predict acute care outcomes among non-hospitalized individuals. Lastly, a timeframe longer than 30 days is more relevant for health systems eager to prevent these complications in an outpatient setting, allowing time for interventions to take effect [23]. Thus, a way to predict the longer-term risk of all acute care for people with diabetes is needed.
Despite the body of literature describing risk factors for ACU among people with diabetes, predicting individual patient risk remains a persistent challenge because the phenomenon arises from complex interdependencies that are difficult to represent in standard analytic frameworks. ACU is shaped not only by non-modifiable clinical markers (e.g., chronic disease burden, prior utilization patterns), but also by diverse social drivers of health such as housing insecurity, access to transportation, social support, and structural barriers to outpatient care [6]. These factors interact in dynamic and often context-specific ways, producing risk profiles that cannot be fully captured by clinical variables alone. Consequently, models that rely primarily on biomedical indicators may miss meaningful upstream drivers of hospitalization and fail to generalize across populations with different social and environmental exposures [15]. In addition to conceptual complexity, predictive efforts are constrained by significant data limitations. Further, historical datasets may not reflect contemporary clinical practice, evolving treatment standards, or changes in healthcare delivery [7]. Major disruptions, most notably the COVID-19 pandemic, have also altered patterns of healthcare seeking, admission thresholds, and resource availability, potentially rendering pre-pandemic models less reliable when applied to current patient populations [6]. Technical modeling hurdles further complicate risk prediction in high-dimensional electronic health record (EHR) environments. Traditional regression approaches can struggle to represent the non-linear, interactive relationships that commonly arise among diagnoses, laboratory trajectories, medications, and care processes [24]. Even when advanced machine learning methods are applied, evaluation can be undermined by inappropriate sampling or validation strategies [25,26].
Failing to account for clustering, in which the same patient contributes multiple encounters, may inflate performance estimates and yield overly optimistic conclusions about model accuracy [27]. Robust modeling requires careful attention to feature engineering, temporal structure, and patient-level dependence to avoid misleading results [3]. The limitations of clinical judgment highlight why algorithmic support is often pursued, yet they also underscore the difficulty of the task [28]. However, substituting clinical judgment with automated predictions introduces an additional tension between interpretability and accuracy. High-performing “black box” models may achieve improved predictive metrics. Still, clinicians may hesitate to trust outputs they cannot explain or reconcile with their mental models of disease and local patient populations [29]. This tradeoff creates a practical implementation barrier: even accurate algorithms can fail to improve care if they are not transparent, clinically coherent, and demonstrably applicable to the specific context in which they are deployed [29,30].
Machine learning (ML)-based predictive models are increasingly valuable in diabetes research because they enable automated clinical decision support that identifies high-risk patients early in hospitalization [2,3], creating opportunities for timely, targeted interventions that can improve safety and outcomes [13,31,32,33]. Unlike traditional statistical approaches that often assume linear relationships, ML methods can learn complex, non-linear interactions among heterogeneous predictors commonly available in electronic health records (EHR), including laboratory results, comorbidities, medication exposures, prior utilization, and social determinants of health, better reflecting the multifactorial nature of diabetes complications [3,4,5,12,31,32,34,35]. The advantages of ML are particularly evident when predicting clinically significant but infrequent events, such as severe hypoglycemia or 30-day readmissions, where class imbalance can limit conventional model performance [5,12,29,35,36,37]. In addition to potential clinical benefit, accurate risk stratification can reduce avoidable hospitalizations and associated costs by directing scarce resources (e.g., diabetes education, care management, medication review, discharge planning) to patients most likely to benefit [3,6,34,38]. Notably, the growing use of explainable AI (XAI) techniques (e.g., SHAP, LIME) helps translate “black-box” predictions into interpretable feature-level explanations, supporting clinician trust and actionable decision-making [5,7,29,31,32,35]. Finally, privacy-preserving, multi-institution learning paradigms (e.g., domain generalization, swarm learning) [8,16] offer a pathway to more robust models that generalize across sites without requiring centralized sharing of raw patient data [30]. Together, these developments support a shift from reactive management to more personalized, proactive diabetes care [36,37,39].
In this study, we applied multiple machine-learning classification models to identify factors associated with the one-year risk of ACU among individuals with diabetes using de-identified EHR data from the Temple University Health System (TUHS). We compared patients who experienced ACU, defined as one or more emergency department (ED) visits, inpatient hospitalizations (IP), or observation stays (OS) within one year, to a comparison group without ACU. Using a rich set of demographic, clinical, laboratory, and medication variables, we aimed to identify key features associated with ACU risk in this population. Our findings demonstrate that machine-learning models can achieve moderate discrimination while also providing clinically meaningful insights that may inform and enhance patient care.
The contribution of this study is not the introduction of a new algorithm, but the development and evaluation of an EHR-based predictive model for a broader and clinically meaningful endpoint—all-cause 1-year ACU among adults with diabetes, including ED visits, inpatient hospitalizations, and observation stays. This target differs from the more common 30-day readmission setting and may better support outpatient risk stratification and longer-horizon care management.

2. Materials and Methods

2.1. Study Cohort

This study leveraged a real-world, multimodal clinical dataset comprising records of patients with diabetes receiving care in an academic, urban, safety-net health system. The retrospective cohort was derived from de-identified electronic health record (EHR) data from the Temple University Health System (TUHS). The dataset was organized into seven relational tables, each contributing essential information for comprehensive clinical characterization and longitudinal analysis: (1) an Encounter table containing unique patient identifiers and longitudinal visit records across TUHS facilities; (2) a Demographic table including age, sex, race, and ethnicity; (3) an Address/ADI table linking patients to neighborhood-level socioeconomic context using the ADI; (4) a Vitals table capturing physiological measures, including systolic and diastolic blood pressure and body mass index (BMI); (5) a Diagnosis table documenting diagnosis codes and descriptions over time to support assessment of comorbidity burden; (6) a Prescribing table detailing medication orders, including drug class and prescription duration; and (7) a Laboratory Results table containing longitudinal lab test values to support clinical assessment and outcome tracking.
To ensure data quality and cohort relevance, we included individuals with admissions between 1 January 2017, and 31 December 2023, and required at least 12 months of continuous data to provide adequate historical context. Each patient timeline was structured around two windows: a Lookback Period used to extract clinical history and an Observation Period used to assess the outcome, ACU. The Index Date was defined as the one-year period prior to each patient’s last clinical encounter, with the last clinical encounter occurring on or before 31 December 2023. The Lookback Period spanned the 365 days preceding the Index Date, and the Observation Period extended from the Index Date through the patient’s last documented encounter. Figure 1 illustrates how the two windows were defined.
The index date was defined retrospectively as 365 days before the patient’s last documented encounter to ensure a uniform 365-day observation window for outcome ascertainment. This approach should be interpreted as retrospective patient-level risk stratification rather than as a fully prospective deployment framework. All predictors were measured during the lookback period before the index date, and ACU outcomes were assessed after the index date. The 1-year observation period began the day after the index date and ended on the patient’s last documented clinical encounter; the index date itself was therefore excluded from outcome ascertainment.
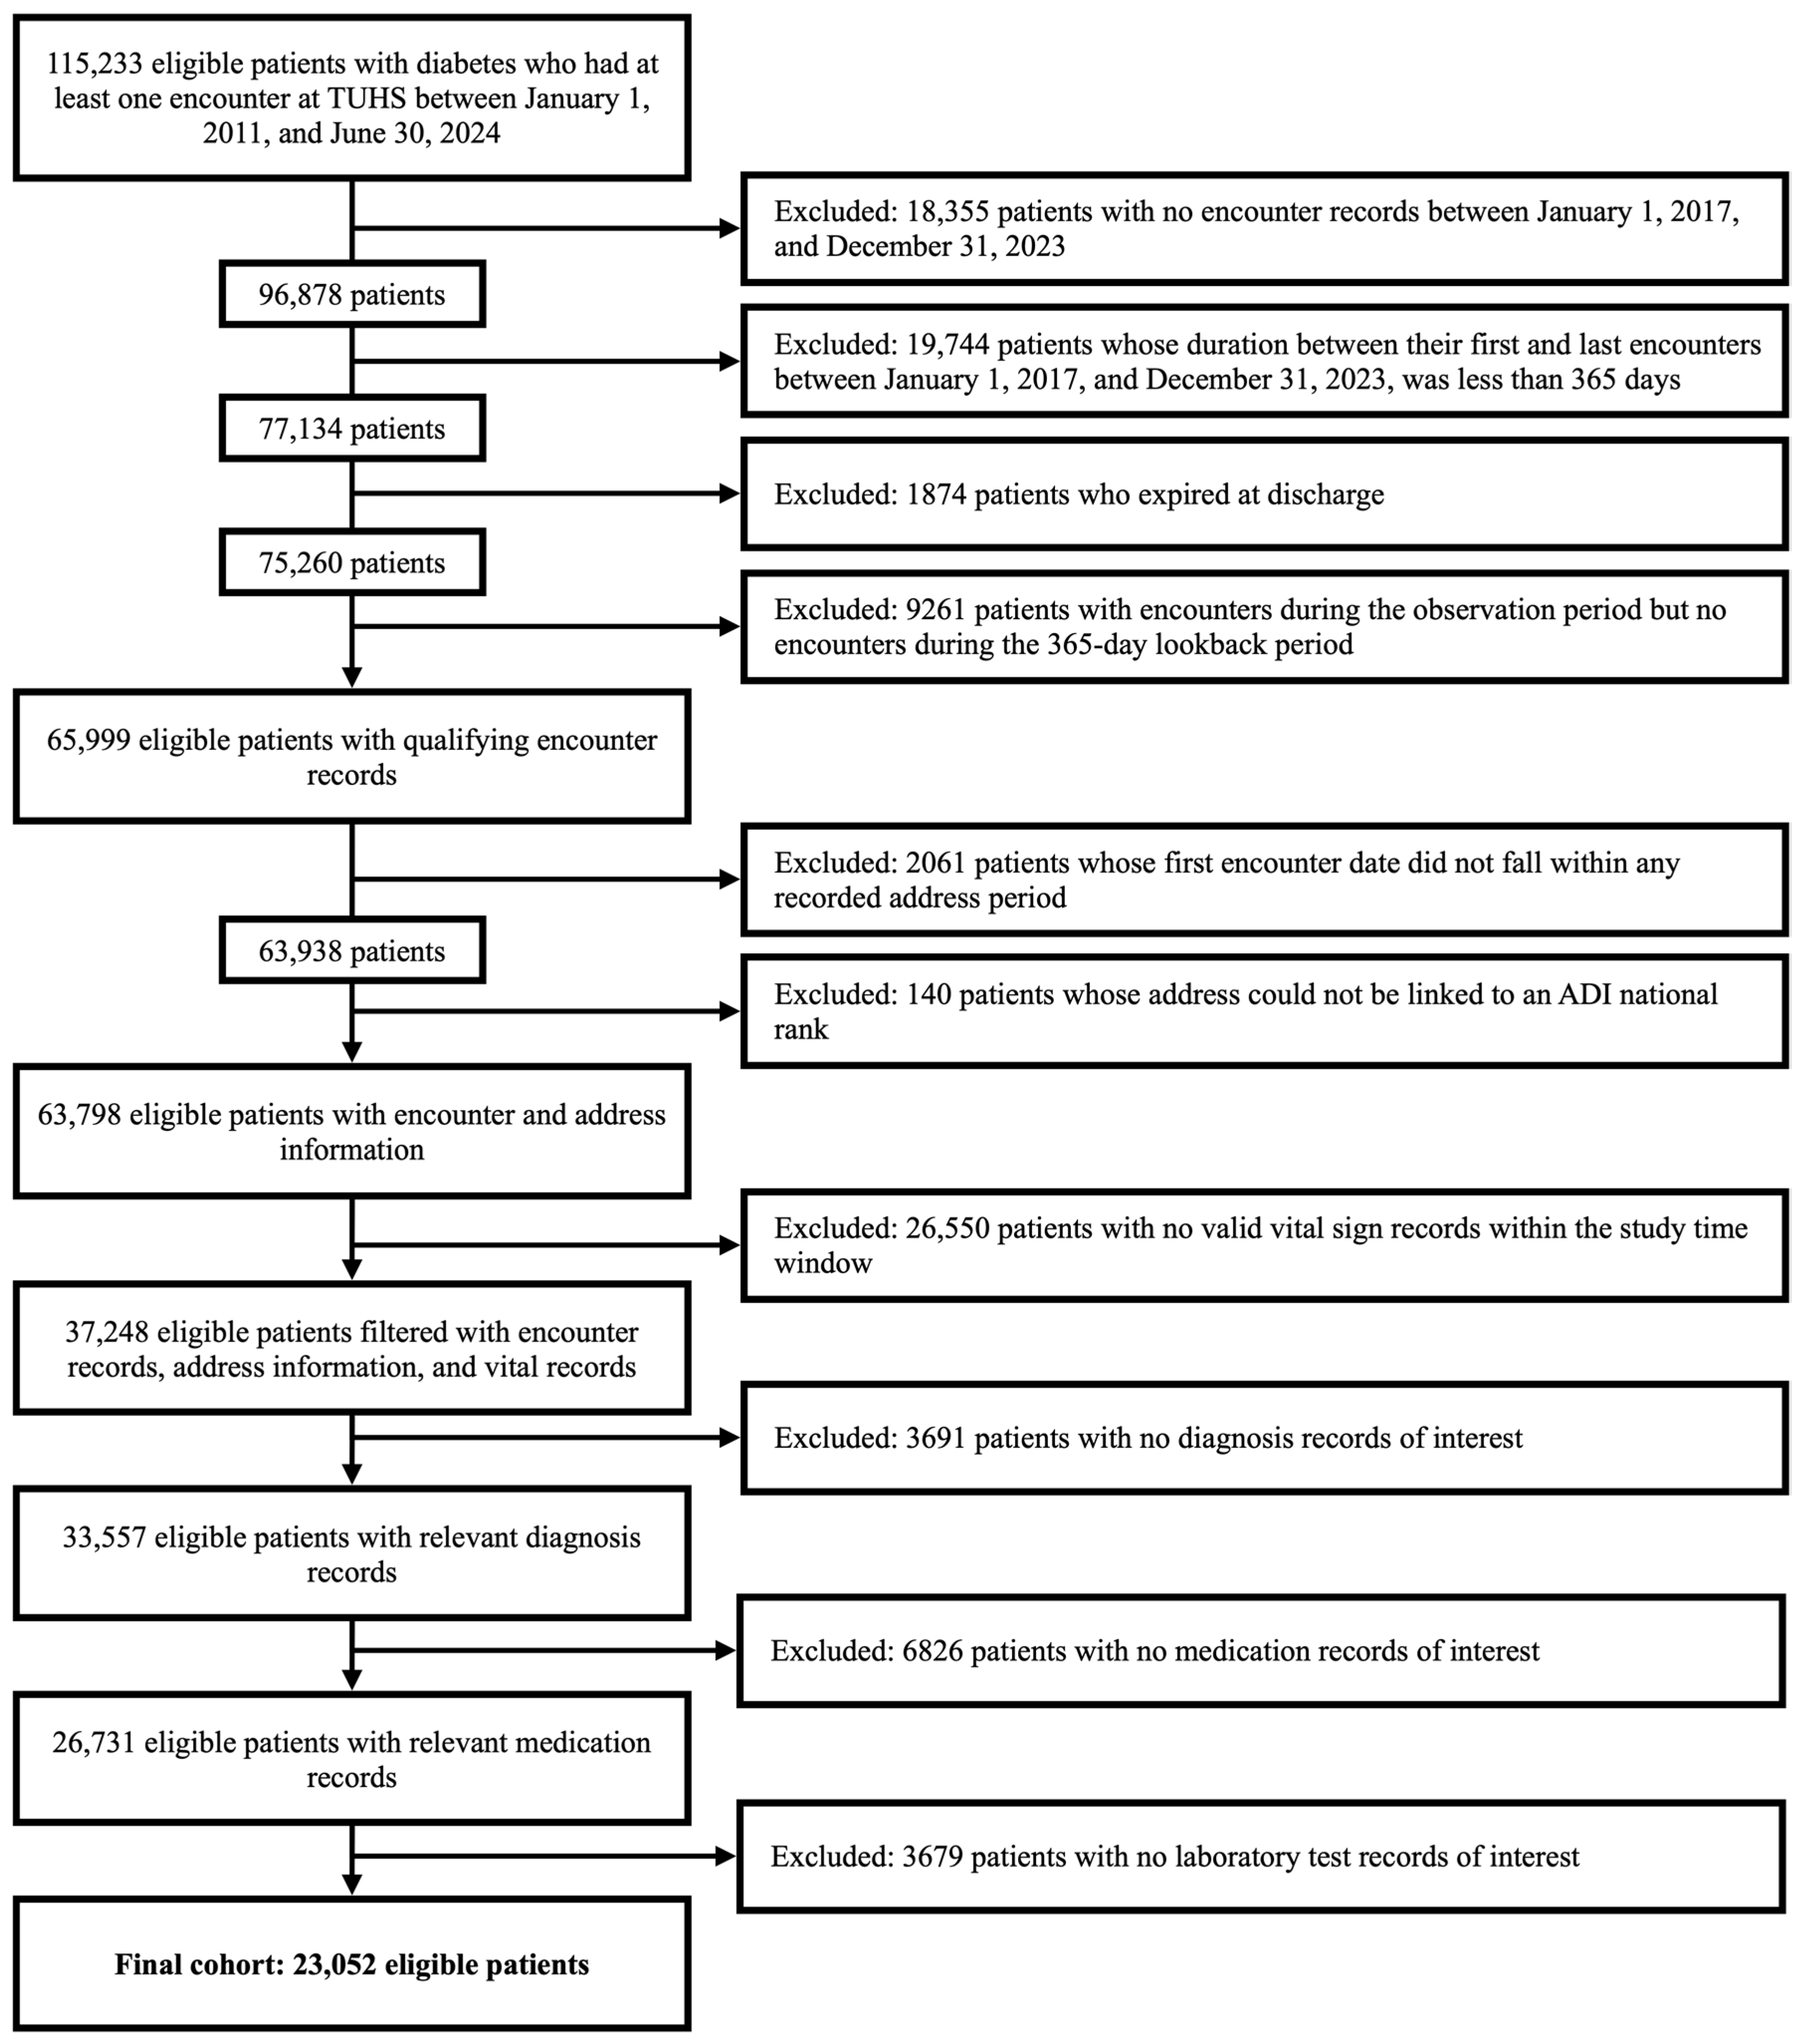
Diabetes was identified if any of the following criteria were met during the initial extraction window: (1) an ICD-9-CM diagnosis code of 249 or 250; (2) an ICD-10-CM diagnosis code of E08–E13; or (3) a documented HbA1c laboratory result ≥ 6.5%. Prescription records were not used as an identifying criterion, to avoid misclassifying patients prescribed diabetes medications for non-diabetes indications. Analyses were limited to adults aged 18 years and older. The final cohort included 23,052 patients. The detailed flow to build the cohort is presented in Appendix A.

2.2. Data Preprocessing

Unless otherwise specified, all preprocessing and feature construction used only data recorded during the lookback period before the index date; observation-period data were used only to define the ACU outcome.

2.2.1. Encounter

Encounter data included encounter type, admission and discharge dates, and discharge disposition, and served as the primary source for temporal feature engineering and patient-level predictors. We excluded patients with a discharge disposition of “expired” and those without any encounters in the Lookback Period due to inadequate history for feature extraction. Encounter-level records were aggregated to construct a single feature vector per patient.
Seventeen features were engineered to capture utilization, care intensity, and temporal dynamics, including age, year of the first lookback encounter, total encounters and encounter-type counts, cumulative inpatient days, time span from first to last encounter, and discharge disposition from the final lookback encounter. We also summarized inter-encounter intervals (minimum, maximum, mean, and median) and created two 30-day revisit indicators: one for acute care (ED, IP, OS) and one for all other encounter types. These features collectively characterized each patient’s healthcare engagement.

2.2.2. Demographics

Demographic data captured key patient-level attributes that characterized the social and ethnocultural composition of the diabetes cohort. Each patient contributed a single demographic record containing sex, ethnicity (Hispanic vs. non-Hispanic), race, preferred language, and Rural–Urban Commuting Area (RUCA) code. RUCA codes [40] classify geographic areas by population density, urbanization, and commuting patterns. As such, RUCA provides a nuanced measure of residential context and is particularly relevant for examining disparities in healthcare access and utilization.
To improve usability for predictive modeling in this cohort, we applied the following preprocessing steps. First, the original RUCA codes were converted into a binary indicator, with a value of 1.0 denoting residence in a core urban area, representing most of the study population, and all other codes were categorized as non–core urban. Second, we created a binary indicator for English as the preferred language. Third, race was consolidated into four categories to improve interpretability and reduce sparsity: (1) White, (2) Black, (3) Other, and (4) No information. The “Other” category included patients who identified as American Indian or Alaska Native, Asian, Native Hawaiian or Other Pacific Islander, or multiple races.

2.2.3. Address and the Area Deprivation Index (ADI)

Address-level ADI data provided socioeconomic context for each patient through the ADI, a census-based measure of neighborhood disadvantage derived from 17 indicators spanning income, education, employment, and housing quality [41]. We used the ADI National Rank (NATRANK), which is reported on a 1–100 scale, where lower values indicate less deprivation and higher values indicate greater deprivation. For analysis, NATRANK was discretized into six groups: five ordinal categories (Q1: 1–20, Q2: 21–40, Q3: 41–60, Q4: 61–80, Q5: 81–100) and a sixth category (“Other”) capturing special or suppressed codes in the source files indicating unreliable or unavailable neighborhood estimates (e.g., low population density, group quarters, or missing census information). To ensure temporal alignment with clinical predictors, only ADI records overlapping the patient’s Lookback Period were retained; patients without an ADI value during this window were excluded. When multiple ADI values mapped to the same measurement window for a given patient, we selected the most frequently occurring non-missing NATRANK to reduce the influence of anomalous values.

2.2.4. Vitals

The Vitals table contained key clinical measurements, including height (inches), weight (pounds), body mass index (BMI), systolic and diastolic blood pressure (mm Hg), and smoking status, which collectively reflect baseline health status. To ensure temporal consistency, we retained only the most recent vital signs recorded during each patient’s final encounter within the Lookback Period. Patients without any vital signs documented during the Lookback Period were excluded because the data were insufficient for model development. When multiple measurements were recorded on the same day, we applied variable-specific aggregation strategies. For height, weight, and BMI, which typically exhibit minimal within-day variability, we used the mean. For systolic and diastolic blood pressure, we summarized clinical variability by computing the mean, minimum, maximum, and standard deviation.
To address missingness in height, weight, and BMI, we implemented a two-step imputation strategy. First, when any two of the three components were available, the third was calculated using the standard formula for U.S. units: BMI = 703 × weight(lb)/[height(in)]2. Second, when only weight was available, and BMI was missing due to unreliable or unavailable height measurements, we fit a univariate linear regression model to predict BMI from weight. This model demonstrated good performance (MAE = 2.98; MSE = 14.59; RMSE = 3.82; R2 = 0.76) and was used to impute BMI for 2757 patients (11.96% of the final cohort of 23,052) for whom height was unavailable. Because BMI was not among the dominant predictors in any model, the primary findings are not driven by this imputation step. Patients missing blood pressure measurements were excluded, given the clinical importance of blood pressure for risk prediction and the small number of such cases. Finally, to ensure clinical validity, we removed physiologically implausible values (e.g., systolic blood pressure > 400 mmHg or BMI > 120 kg/m2).

2.2.5. Diagnosis

Diagnosis data consisted of longitudinal ICD-10 codes. We applied the Elixhauser Comorbidity Index [42] to map ICD-10 codes to 39 comorbidity categories reflecting chronic disease burden. For each patient, comorbidities were assessed during the Lookback Period and encoded as binary indicators, with a category marked present if any corresponding ICD-10 code was observed. This yielded a patient-level binary feature vector summarizing comorbidity burden for model development.

2.2.6. Prescribing

Prescribing data included medication names, dates, quantities, dosing frequency, and refill counts. To reduce dimensionality while preserving clinical interpretability, we extracted features across four expert-selected therapeutic domains: cholesterol, blood pressure, diabetes, and systemic steroids. Medications were standardized to RxNorm Concept Unique Identifiers (CUIs) to harmonize drug terminology across records. For each patient and domain, we created a binary indicator denoting whether any corresponding prescription occurred during the Lookback Period, yielding a scalable summary of medication exposure for downstream modeling.

2.2.7. Laboratory Results

The Laboratory Results table provided longitudinal laboratory measurements reflecting patients’ clinical status across a wide range of tests. Each record included the laboratory test name and result value, along with test priority, quality indicators, and flags for out-of-range results. To ensure temporal alignment with model inputs and maintain analytic tractability, we retained only laboratory test names and corresponding result values recorded during the Lookback Period. Because the modeling objective was patient-level, laboratory results were aggregated to produce a single structured feature set per individual. For tests performed multiple times during the Lookback Period, we computed four summary statistics per test—minimum, maximum, mean, and standard deviation—to capture both overall level and within-patient variability over time.
To enhance clinical relevance and reduce dimensionality, we selected a curated panel of 21 laboratory tests in consultation with clinical experts, spanning multiple diagnostic domains. Electrolyte and metabolic markers included carbon dioxide, anion gap, sodium, glucose, blood urea nitrogen, creatinine, lactate, and estimated glomerular filtration rate. Liver function markers included alanine aminotransferase, aspartate aminotransferase, bilirubin, and albumin. Renal and acid–base status was characterized using arterial and venous pH and partial pressures of carbon dioxide and oxygen. Hematologic indicators included hematocrit, white blood cell count, and hemoglobin A1c. Cardiac status was represented by troponin I, and lipid status was assessed using low-density lipoprotein cholesterol.
Not all patients underwent every test in the curated panel. To handle missingness while preserving interpretability, we included missingness indicators for each laboratory test, enabling the models to distinguish unmeasured tests from physiological abnormalities. Together, these features provided a robust and clinically interpretable laboratory profile for downstream modeling.

2.3. Outcome

The primary outcome was ACU during the 1-year Observation Period, defined as one or more ED visits, IP, or OS for any cause. Patients were classified as “Yes” if they experienced at least one qualifying ACU event and “No” if they experienced none. Preliminary outcome assessment indicated a moderate class imbalance, which is common in clinical prediction settings: 69.46% of patients (n = 16,013) had no ACU events, whereas 30.53% (n = 7039) had at least one event. Because accuracy can be misleading under class imbalance, model performance was evaluated using less imbalance-sensitive metrics (e.g., recall/sensitivity and precision–recall–based measures) rather than accuracy alone.

2.4. Covariates

We adjusted for 180 covariates, including:
  • Demographics/ADI: 29 covariates;
  • Encounter Statistics: 14 covariates;
  • BMI and Vitals: 9 covariates;
  • Prescribing: 5 covariates;
  • Diagnoses: 39 covariates;
  • Laboratory Results: 84 covariates;
  • A detailed list of covariates in each group is described in Appendix B.

2.5. Predictive Models

2.5.1. Baseline Models

We compared four tree-based classifiers (Decision Tree, XGBoost, LightGBM, and CatBoost) selected for their ability to model nonlinear effects, scale to high-dimensional features, and handle missing values natively. Missingness was treated as informative; thus, no additional imputation was performed beyond prior preprocessing. Hyperparameters were tuned with Optuna using model-specific search spaces and 8-fold stratified cross-validation, optimizing mean AUC across folds. The best configuration from 500 trials per model was retained for downstream evaluation.

2.5.2. Threshold Selection

Because the default 0.50 probability cutoff may not optimize class-balanced performance under outcome imbalance, we evaluated alternative probability thresholds as statistical operating points for converting predicted probabilities into binary ACU classifications. In clinical prediction settings, the relative consequences of false-negative and false-positive classifications may differ, and threshold choice can therefore affect the balance between identifying patients who experience ACU and avoiding unnecessary positive classifications [43,44]. In the present study, threshold selection was used to characterize this sensitivity–specificity tradeoff and improve class-balanced statistical performance; it was not intended to establish clinical utility, cost-effectiveness, or a definitive implementation threshold.
After hyperparameter selection, we performed a second-stage threshold-selection procedure for the binary task of predicting whether a patient would experience ACU during the 1-year Observation Period. Because AUC is threshold-independent, hyperparameters optimized for AUC do not necessarily yield optimal threshold-dependent performance metrics such as Macro F1 [45,46]. For each tuned model, we generated out-of-fold predicted probabilities within the training partition using the same 8-fold stratified cross-validation scheme. In each fold, the model was refit on the training partition using the selected hyperparameters, and predictions were produced for the held-out fold. Candidate thresholds were then evaluated using these out-of-fold predictions, and the threshold that maximized Macro F1 was selected.
Thresholds were evaluated over [0, 0.50] in increments of 0.025. The upper bound of 0.50 corresponds to the conventional default cutoff; thresholds above 0.50 would make the classifier more conservative than the default and were therefore not considered for this sensitivity-oriented operating-point analysis. There was no lower-bound restriction within the sub-default range, and the selected thresholds emerged empirically from the training-data threshold search. Macro F1 was selected because it summarizes performance across both outcome classes under imbalance, but it should be interpreted as a statistical operating criterion rather than a direct measure of clinical utility or cost-sensitive net benefit. Final threshold-dependent metrics were reported on the held-out test set using the selected operating thresholds.

2.5.3. Model Development and Evaluation Pipeline

The full analytic cohort was partitioned into a training set (80%) and an independent held-out test set (20%) using stratified random sampling to preserve the 1-year ACU outcome prevalence across splits. This split was performed at the patient level. All hyperparameter tuning (Optuna, 8-fold stratified cross-validation) and threshold selection were performed exclusively within the training partition; the test set was withheld until final performance evaluation. Threshold selection used out-of-fold predicted probabilities from the training partition only; test-set labels were not accessed during this step. All preprocessing decisions—including the BMI imputation model, RUCA binary recoding, and categorical variable mappings—were derived from the training partition and applied to the test set. Performance metrics (AUC, accuracy, Macro F1, balanced accuracy, Brier score, and bootstrap CIs for AUC) were evaluated on the held-out test set. This split provided internal validation; no external validation cohort was used.

2.5.4. Probability Calibration

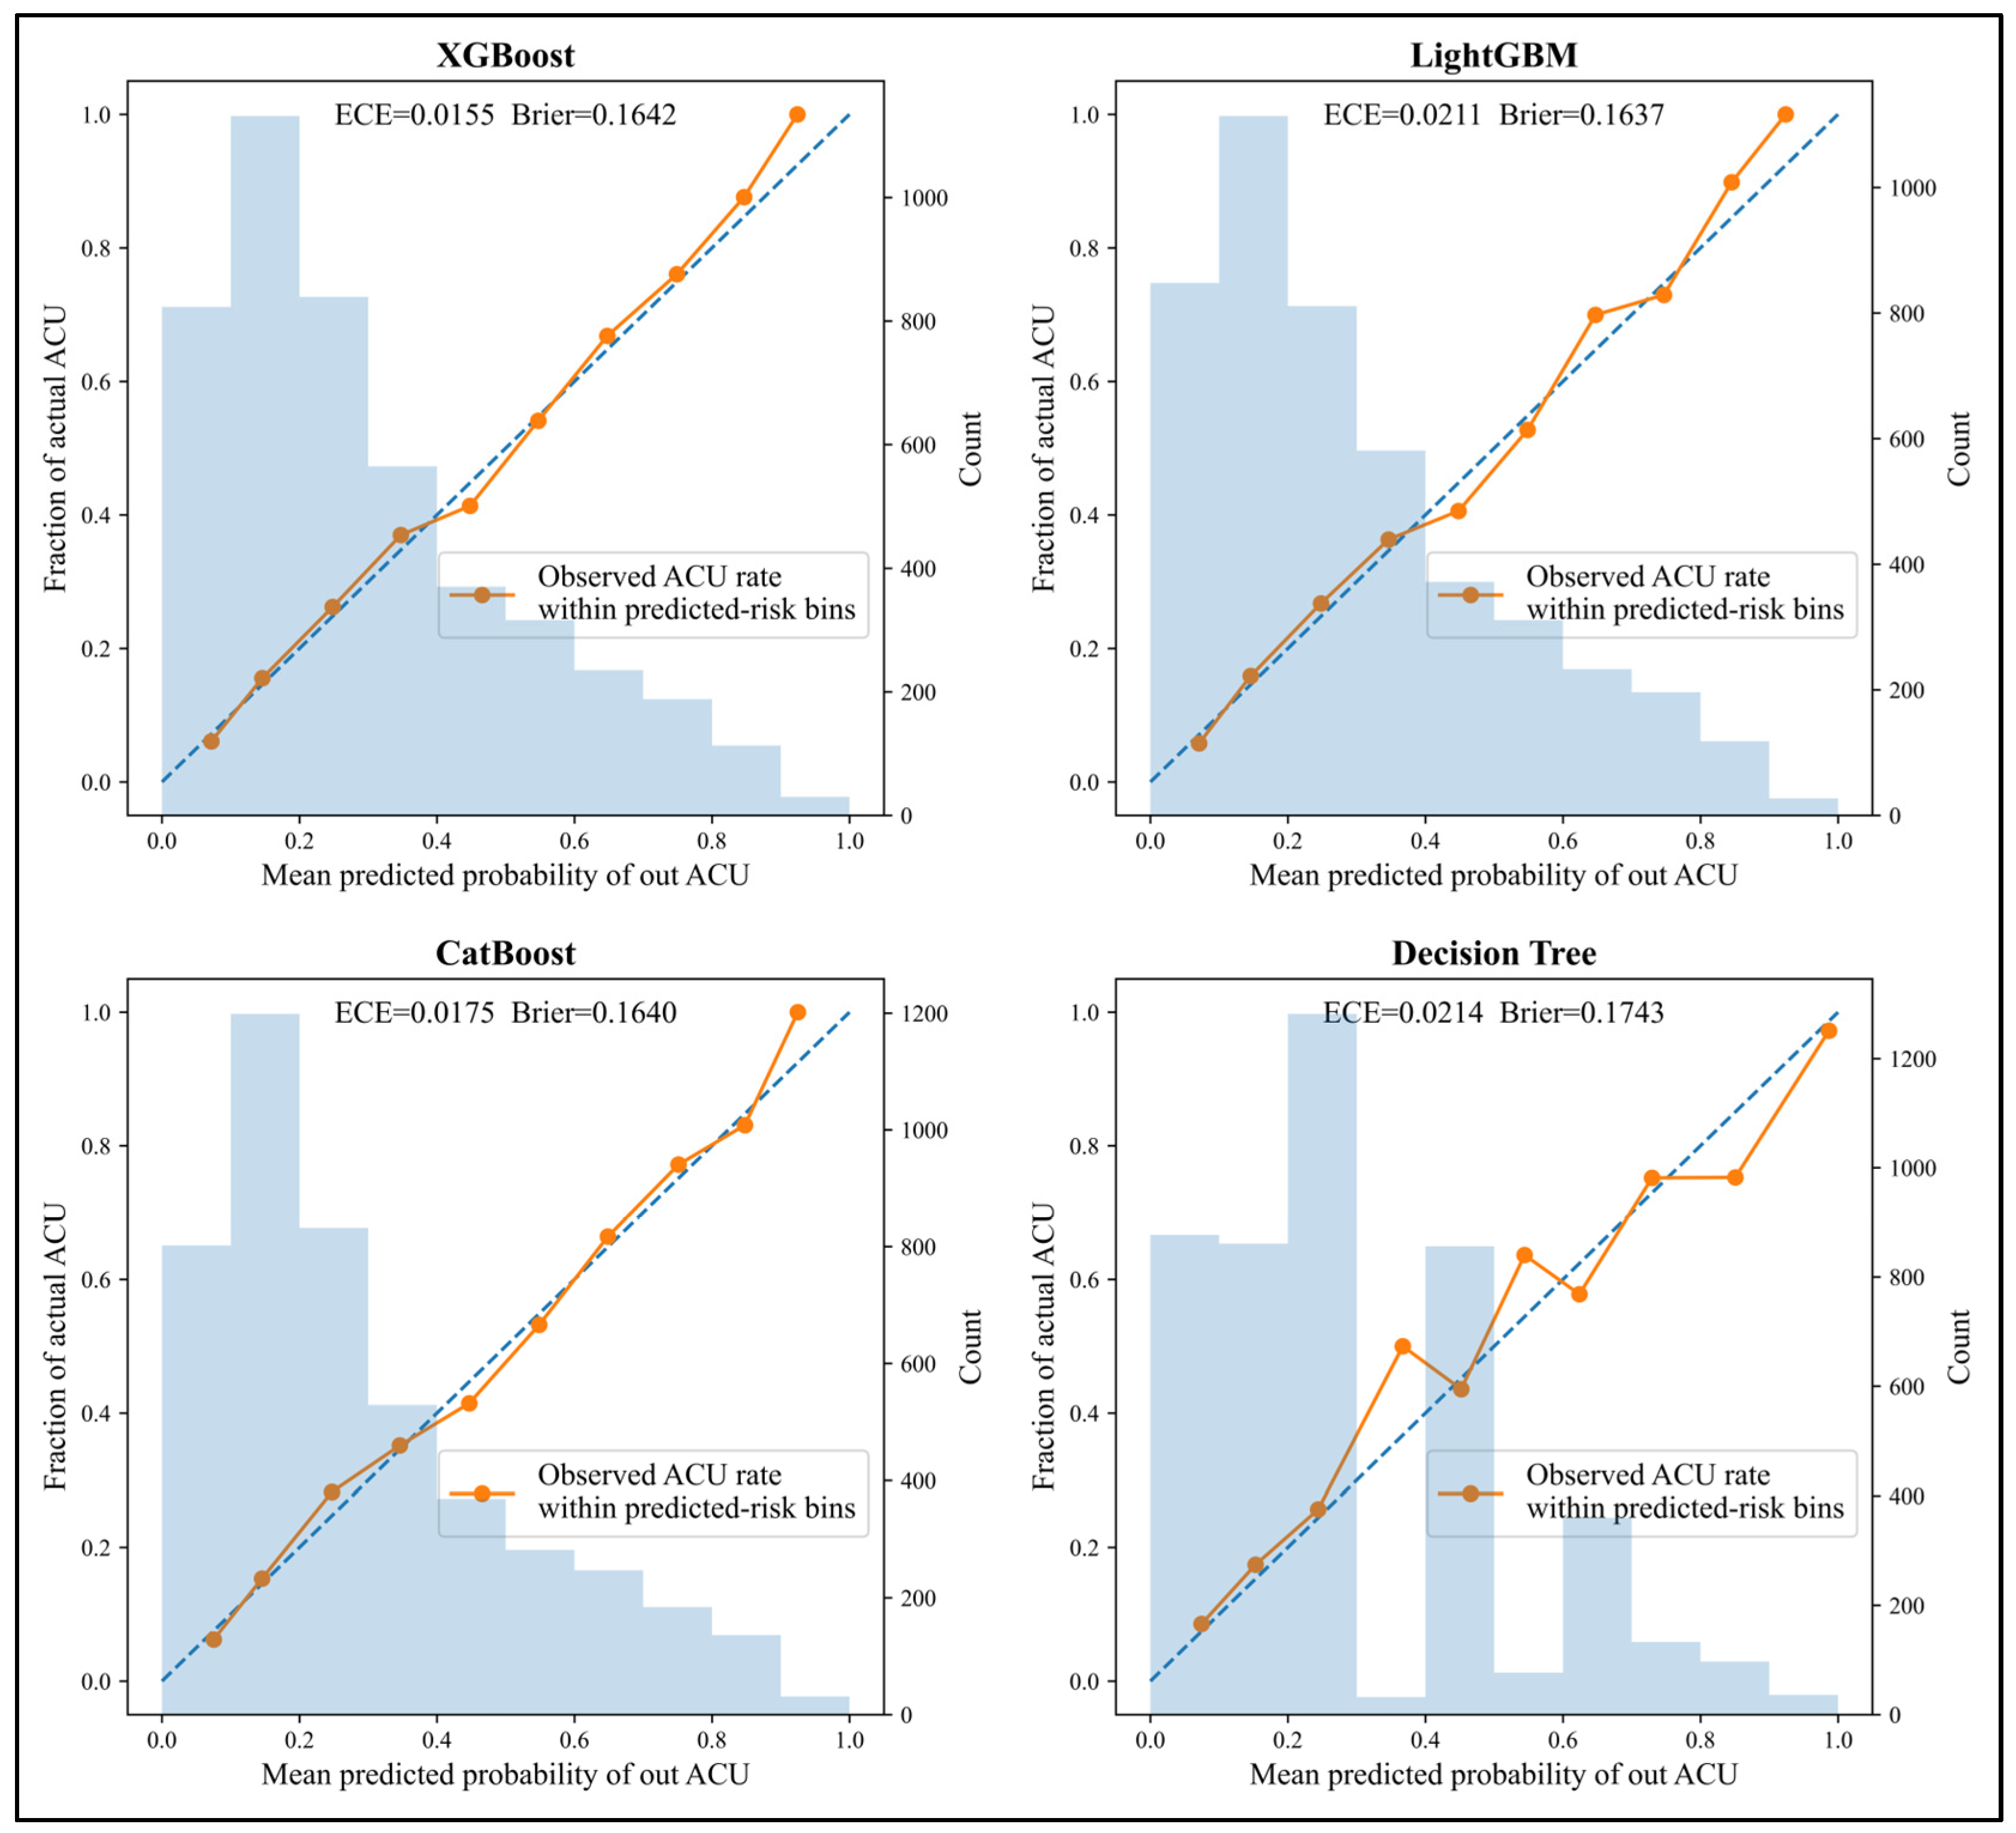
Model calibration was assessed to evaluate whether the predicted probabilities from the boosted classifiers agreed with observed event rates. Two complementary measures were used. First, the Brier score was computed for all boosted models on the held-out test set. The Brier score is a proper scoring rule that quantifies overall prediction error as the mean squared difference between predicted probabilities and binary outcomes; it captures contributions from calibration, discrimination, and uncertainty, with lower values indicating better overall predictive accuracy. Second, a calibration plot (reliability diagram) was generated for all classifiers by grouping predicted probabilities into decile bins and plotting the mean predicted probability within each bin against the observed ACU event rate within that bin; a perfectly calibrated model produces points close to the diagonal. Both assessments were performed on the held-out 20% test set. We note that calibration is conceptually distinct from threshold optimization: the Macro F1–optimized threshold identifies a statistical operating point for classification, whereas calibration assesses the agreement of the continuous predicted probabilities with observed event rates, independent of any threshold.

2.5.5. Software

Analyses were conducted in Python version 3.12.6.

2.6. AI Use Statement

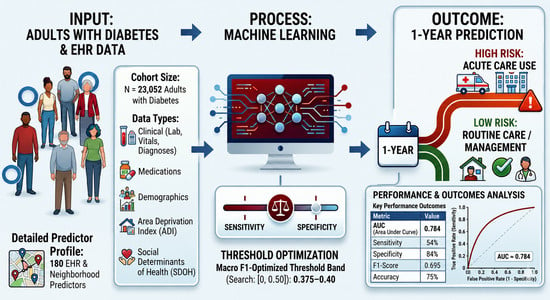
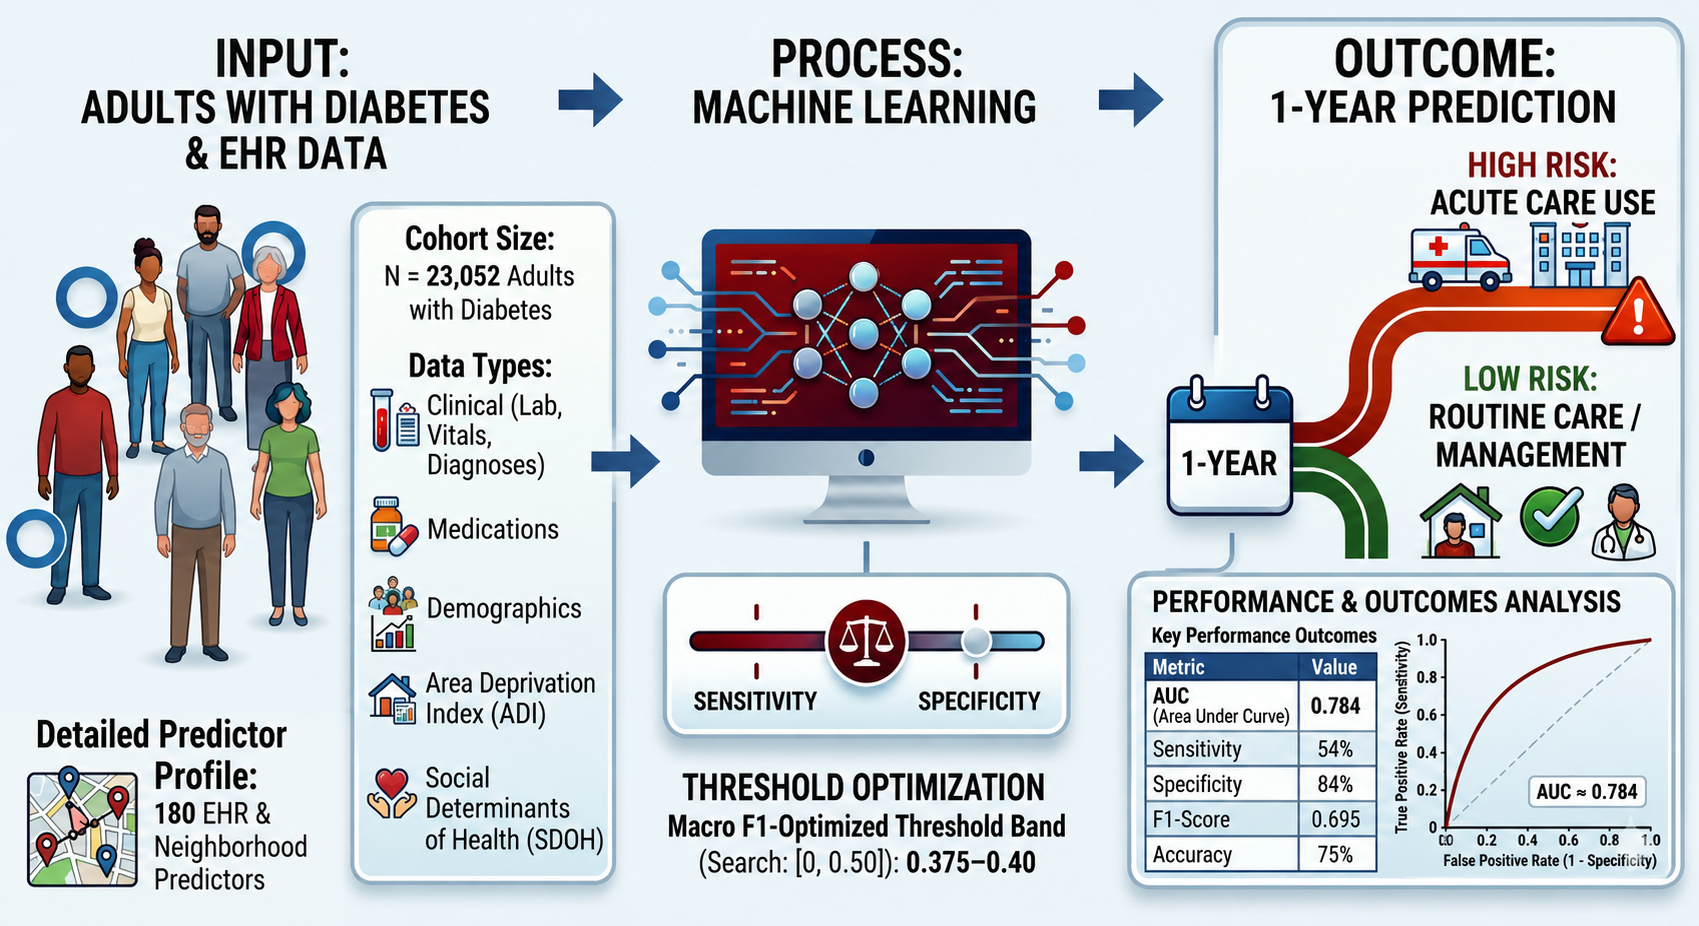
During preparation of this manuscript, the authors used Nano Banana 2 to generate a graphical abstract illustrating the study workflow. The graphical abstract was reviewed and edited by the authors for accuracy. No AI tool was used to analyze data or generate study results.

3. Results

3.1. Study Population and Descriptive Characteristics

Descriptive statistics of the study population are presented in Table 1. Among 23,052 patients, 7039 (30.53%) experienced at least one event during the Observation Period, while 16,013 (69.46%) had no ACU events. Demographic characteristics differed significantly between the ACU and non-ACU groups (all p < 0.001). Patients with ACU were slightly more likely to be female (54.48% vs. 51.48%) and were marginally less likely to reside in a core urban area (98.78% vs. 97.69%). However, the cohort was predominantly urban overall (>97% in both groups). Age distributions were broadly similar, with the largest fraction of patients in both groups aged 45–64 years (42.55% with ACU vs. 40.49% without ACU); however, patients with ACU showed a modestly higher representation in the 18–44 age group (9.01% vs. 8.17%). Marked differences were observed by race and ethnicity: compared with patients without ACU, those with ACU included a higher proportion of Black patients (44.48% vs. 30.39%) and a lower proportion of White patients (20.78% vs. 41.12%), and Hispanic ethnicity was more common among patients with ACU (30.22% vs. 18.52%). Socioeconomic context also differed: patients with ACU were more likely to reside in the most disadvantaged neighborhoods (ADI Q5: 53.49% vs. 30.23%) and less likely to reside in the least disadvantaged neighborhoods (ADI Q1: 2.19% vs. 6.19%), consistent with a gradient of higher ACU among patients from more deprived areas. However, these unadjusted comparisons do not provide an individualized, actionable means of identifying patients at the highest risk, nor do they account for correlations among predictors or potential non-linear and interaction effects. Therefore, we developed a machine learning predictive model that integrates multiple patient and neighborhood factors simultaneously and generates patient-level ACU risk estimates to support targeted prevention strategies.

3.2. Machine Learning Predictive Model Outcomes

3.2.1. Baseline Model Performance (0.5 Threshold)

Model performance is presented in Table 2. Binary predictions were obtained by thresholding predicted probabilities at 0.5; discrimination was assessed using the area under the receiver operating characteristic (ROC) curve (AUC), which is threshold-independent. Across all evaluated metrics, ensemble gradient-boosting methods demonstrated superior performance relative to the Decision Tree (AUC range 0.7824–0.7839 vs. 0.7529). LightGBM yielded the highest AUC (0.7839) and the strongest class-balanced performance (Balanced Accuracy = 0.6701; Macro F1 = 0.6845), with CatBoost and XGBoost showing comparable results. Accuracy was similar across the three boosted models (~0.764), indicating consistent gains over the simpler tree-based baseline. Balanced Accuracy and Macro F1 were included to reflect performance across classes.

3.2.2. Threshold Optimization and Operating-Point Performance

As shown in Table 3, we optimized the probability threshold for each classifier to maximize Macro F1, rather than using the default 0.50 cutoff. Across models, the selected operating thresholds were consistently below 0.50 (approximately 0.375–0.40), indicating that a lower action threshold better balanced errors under the observed outcome imbalance. This threshold optimization improved class-balanced performance across all models, reflected by higher Macro F1 and balanced accuracy compared with the fixed 0.50 threshold analysis. Among the boosted models, Macro F1 values clustered tightly in the ~0.695–0.696 range, with balanced accuracy similarly concentrated around ~0.69, suggesting that the three gradient-boosted approaches achieved comparable decision performance once an appropriate threshold was selected. In contrast, overall accuracy decreased modestly after threshold tuning (Table 3), consistent with the expected trade-off when the decision rule is adjusted to better capture the minority outcome rather than maximize correctness dominated by the majority class. Importantly, AUC remained unchanged by threshold selection (Table 3), because AUC is threshold-independent and reflects discrimination/ranking rather than a specific classification operating point. Collectively, Table 3 demonstrates that treating the threshold as a tunable decision parameter—rather than a fixed convention—meaningfully improves the clinical balance between missed ACU events and false alarms, while preserving overall discrimination.
Bootstrap analysis confirmed stable discrimination across models, presented in Table 4. The three boosted models had similar test-set AUCs: XGBoost 0.7824, LightGBM 0.7839, and CatBoost 0.7834, with overlapping 95% bootstrap confidence intervals. Brier loss was also similar across boosted models and lower than that of the Decision Tree, indicating better overall probabilistic prediction performance. These findings suggest that the boosted models performed comparably, and that small numerical differences in AUC should not be overinterpreted. Comparison of calibration performance for all classifiers is presented in Appendix C. In addition, cross-validated AUC stability within the 80% training set is summarized in Appendix D.
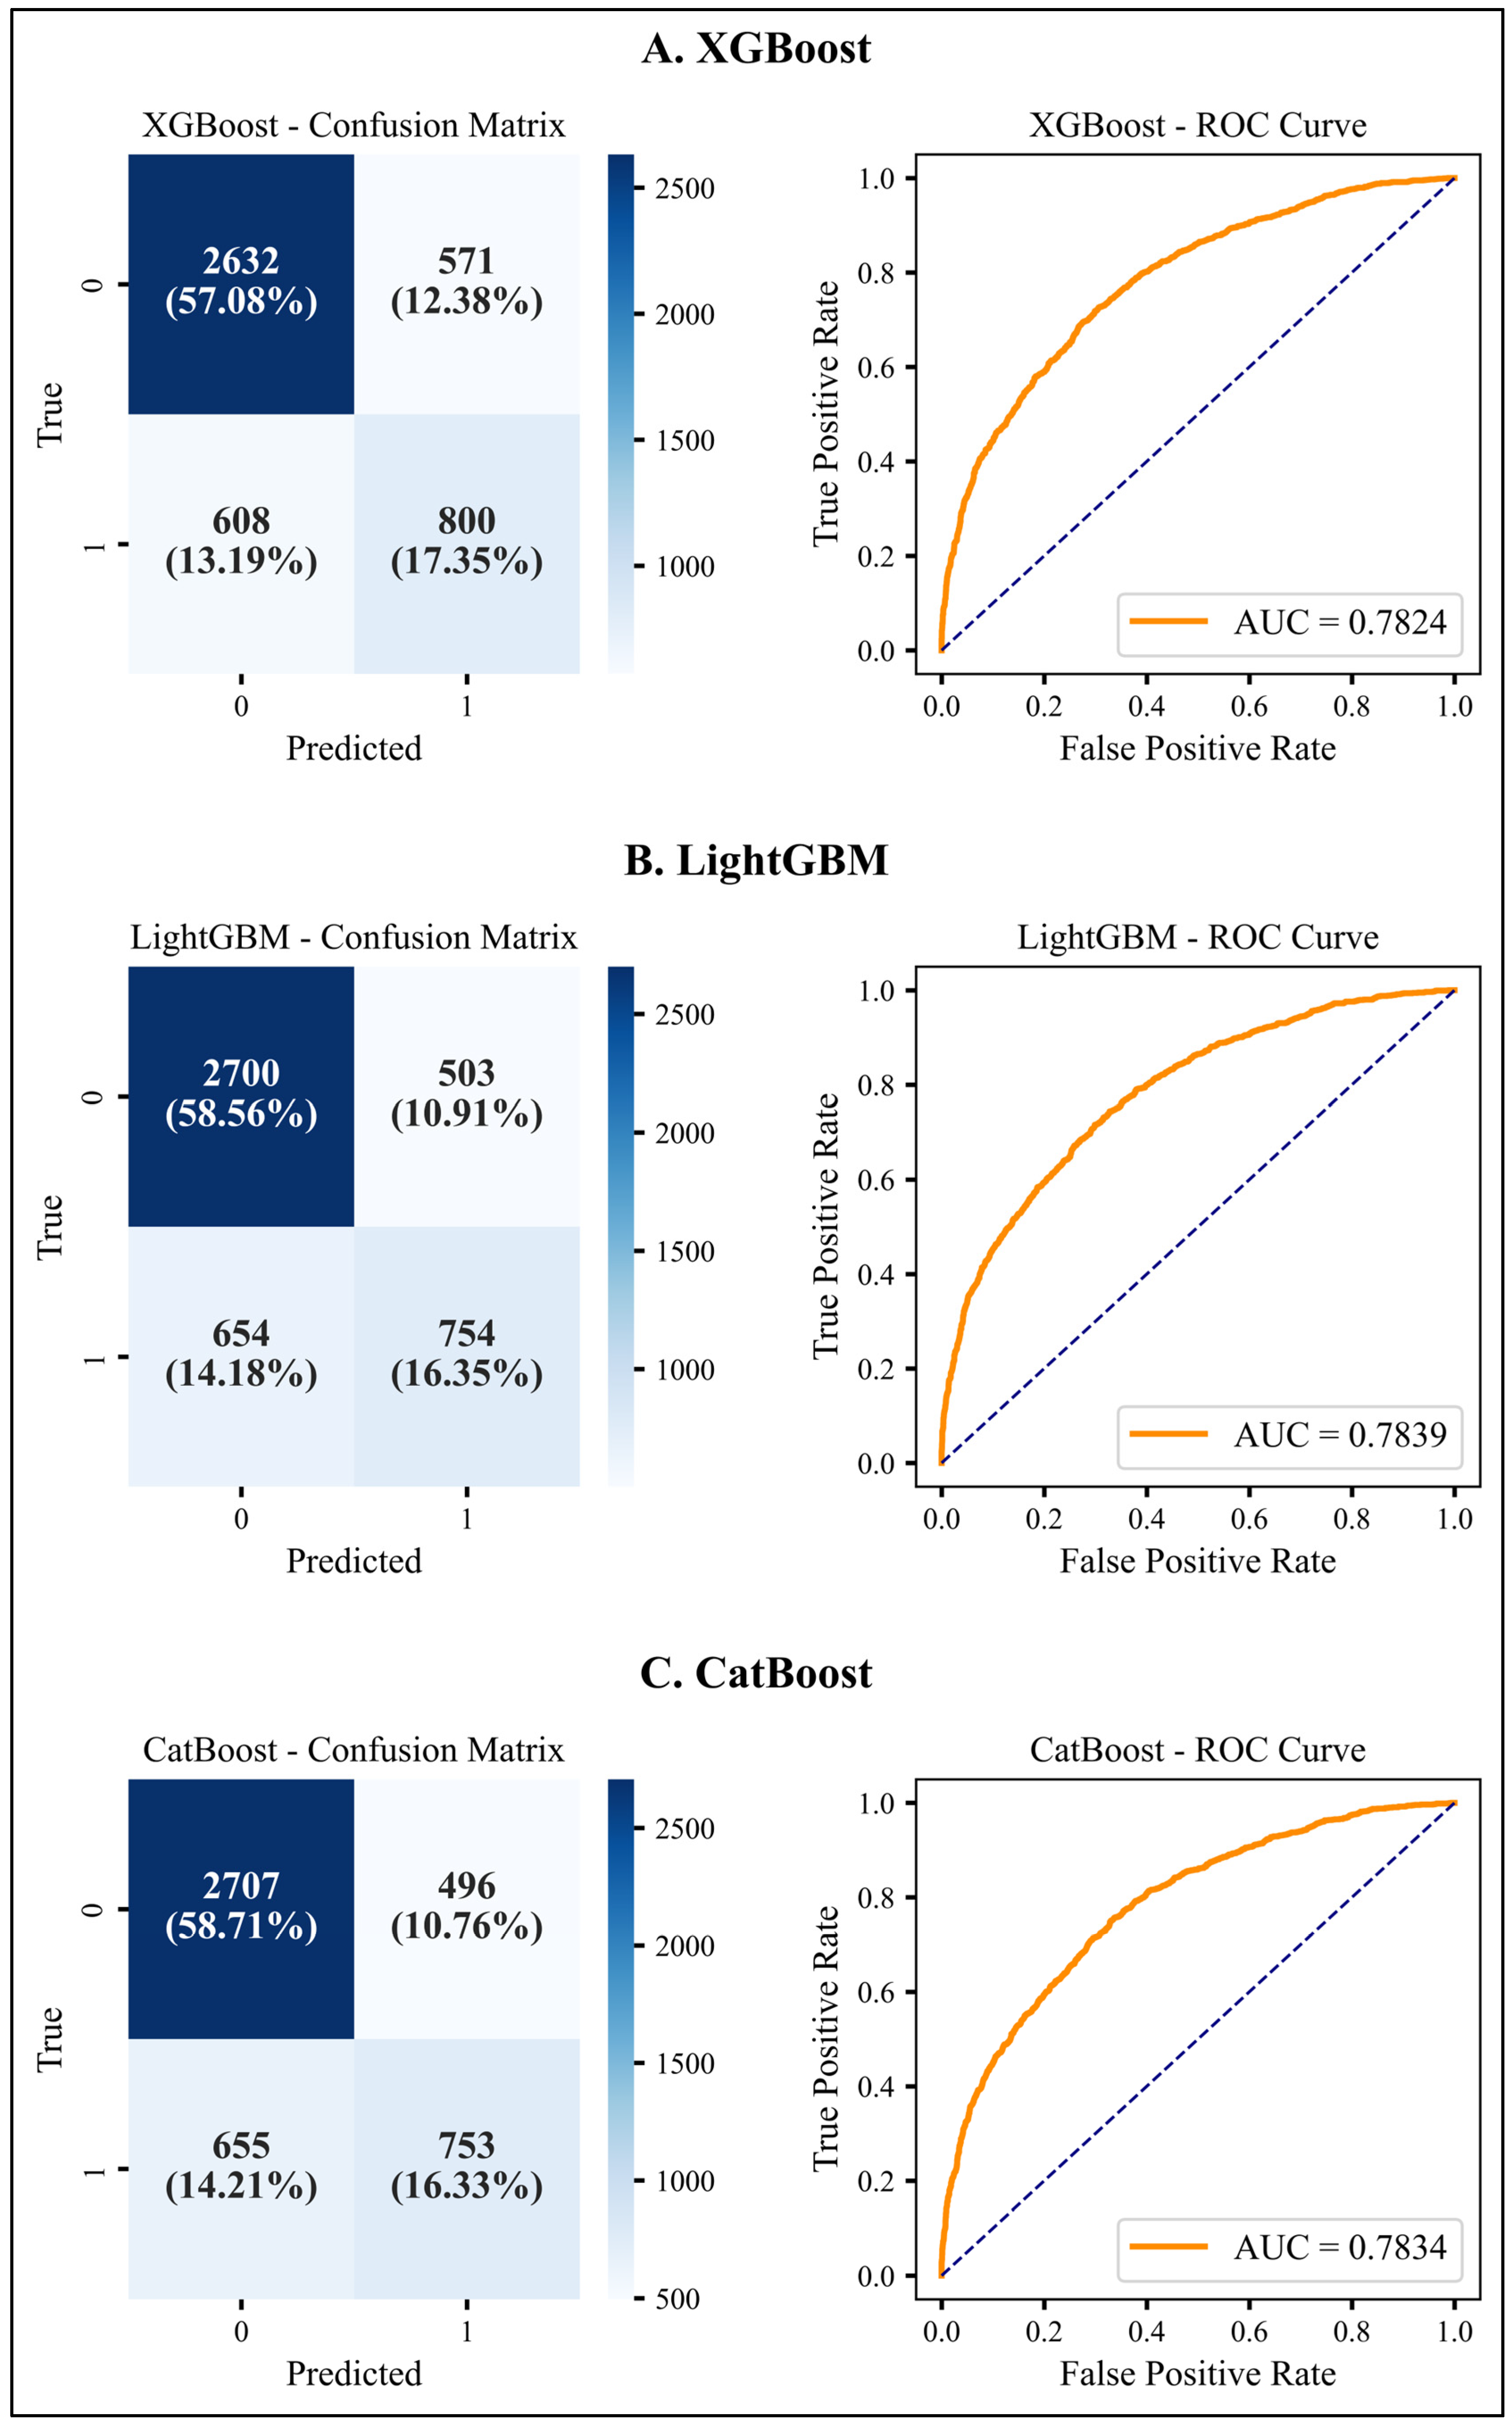
Figure 2 illustrates how the threshold-optimized operating points translate into classification behavior. First, the ROC curves show similar discrimination across boosted models, with AUC values all near 0.78, consistent with Table 3. Second, the confusion matrices visualize the practical trade-off introduced by lowering the threshold below 0.50: relative to default thresholding, the models classify more patients as at risk for ACU, which increases detection of true ACU cases but also increases false positives. Across boosted models at the Macro F1–optimized thresholds, the confusion matrices indicate high specificity (approximately 0.82–0.85) alongside moderate sensitivity (approximately 0.53–0.57). This pattern is typical in imbalanced clinical prediction settings when optimizing a balanced metric: the models remain strong at correctly identifying patients without ACU, while achieving moderate capture of ACU events. Differences between models are primarily in how aggressively they shift toward identifying ACU cases. For example, the model with the lowest fitted threshold (0.375) identifies more ACU cases (higher true positives) but also generates more false positives, reflecting a more sensitivity-favoring operating point; the models using 0.40 show slightly more conservative behavior with fewer false positives. Overall, Figure 2 reinforces the key message from Table 3 and Table 4: threshold optimization changes the decision policy (how predictions are converted into actions) without changing discrimination, and it clarifies the expected clinical trade-off when selecting an operating point designed to improve class-balanced performance. Comparison of selected prior machine-learning prediction studies is presented in Appendix E.

3.2.3. Model Interpretability with Optimization: Permutation Feature Importance

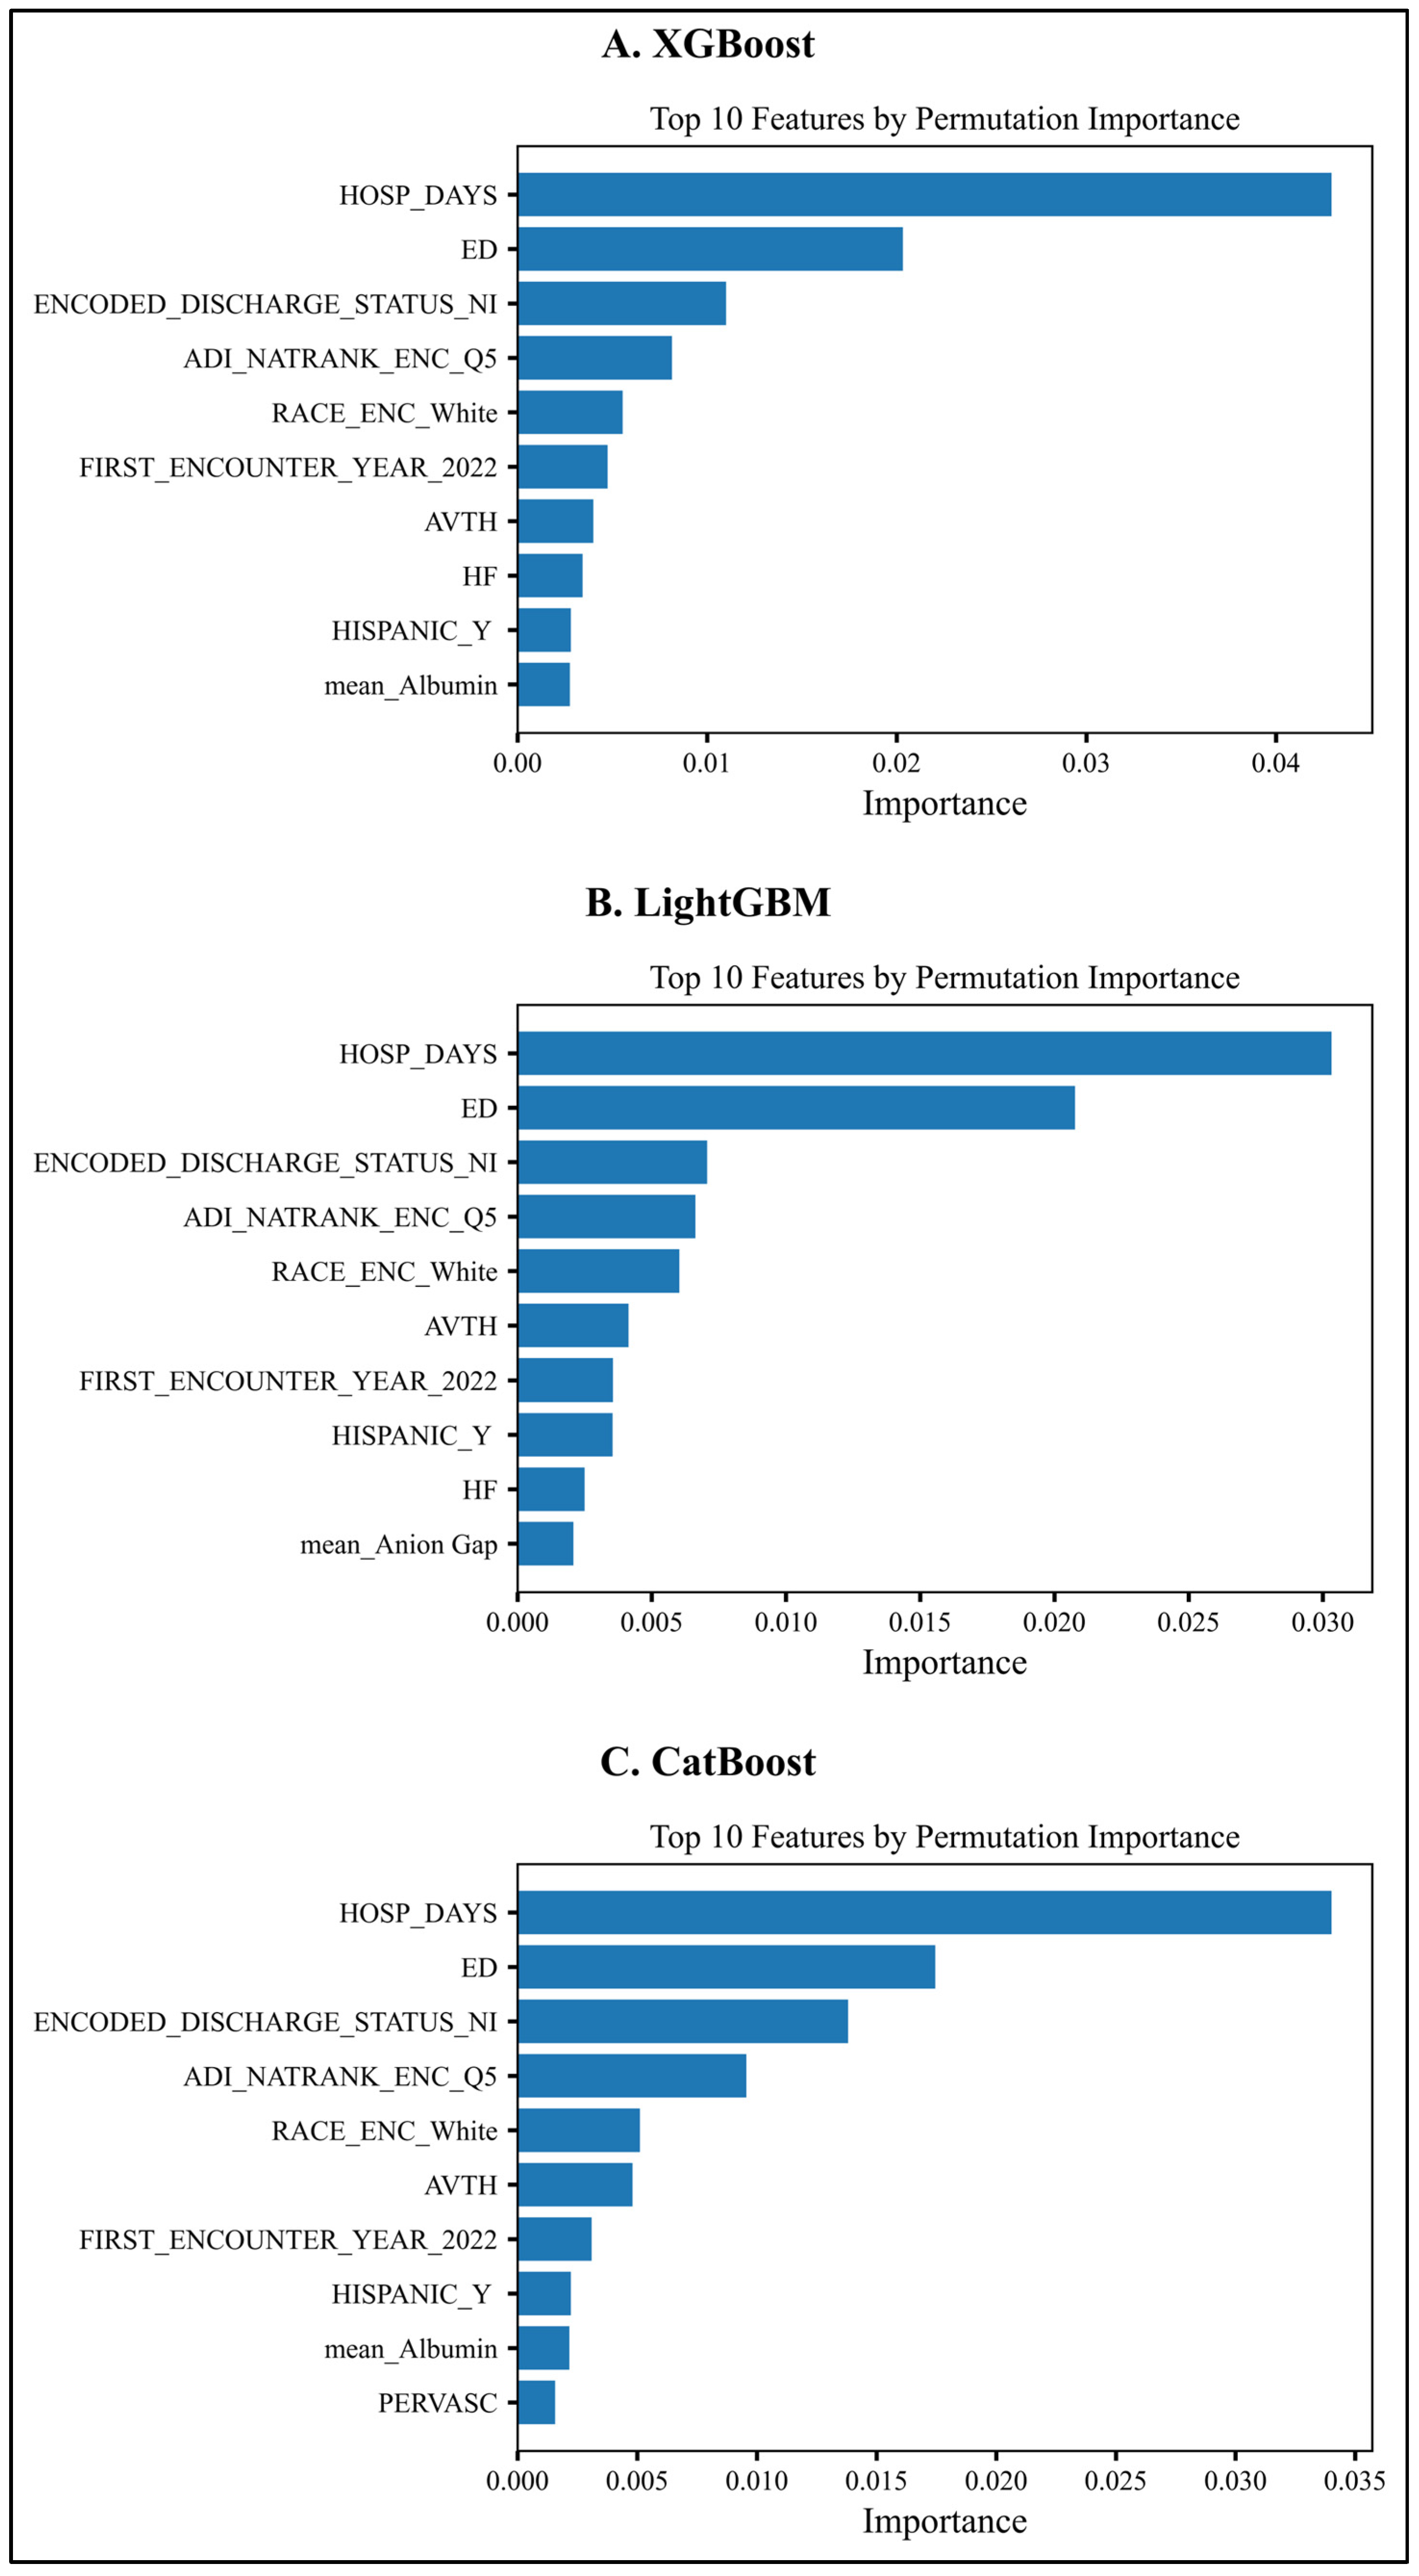
Figure 3 displays permutation-based feature importance rankings with the top 10 features for XGBoost, LightGBM, and CatBoost.
Across the three gradient-boosting classifiers, the permutation importance profiles were highly consistent (Figure 3A–C), indicating that the models relied on a similar set of predictors to estimate ACU risk. In all three models, prior ACU signals, particularly days hospitalized (HOSP_DAYS) and ED encounters, were the most influential features by a substantial margin. This pattern suggests that recent or historical utilization intensity (HOSP_DAY and ED) is the dominant source of predictive information, consistent with the notion that prior utilization captures a composite of illness severity, instability, and unmet outpatient needs. Notably, the steep drop in importance after these utilization variables implies that they contribute disproportionately to model performance compared with other demographic and clinical markers.
Beyond utilization history, several contextual and care-transition variables were repeatedly ranked among the top predictors. Discharge status (ENCODED_DISCHARGE_STATUS_NI) appeared consistently as a high-importance feature, highlighting the predictive role of disposition or discharge-related factors, likely reflecting differences in post-acute support, care continuity, and clinical readiness at transition points. Neighborhood-level disadvantage (ADI_NATRANK_ENC_Q5) also ranked in the top set across models, suggesting that the socioeconomic environment contributes meaningfully to risk estimation even after accounting for utilization history. Demographic indicators, including race (RACE_ENC_White) and ethnicity (HISPANIC_Y), also appeared among the top features; these variables may be functioning as proxies for differences in structural access, care pathways, and underlying risk distributions observed in the data rather than direct causal drivers of utilization.
Finally, a smaller set of clinical features (e.g., HF and comorbidity markers such as PERVASC) and laboratory summaries (e.g., mean_Albumin, and mean_Anion Gap in one model) appeared among the top 10 but generally with lower relative importance than utilization and contextual variables. This pattern suggests that, in this dataset, aggregated labs and individual comorbidity indicators add incremental predictive value but do not dominate prediction once prior utilization and social/contextual factors are included. The appearance of encounters recorded for the first time in 2022 (FIRST_ENCOUNTER_YEAR_2022) among the top predictors in multiple models may also reflect temporal shifts in practice patterns, coding practices, access, or cohort composition, reinforcing the importance of monitoring model stability over time. Overall, feature importance patterns were stable across boosted classifiers, with prior utilization measures contributing most of the predictive signal, and contextual factors such as discharge status and neighborhood deprivation providing additional explanatory value.

4. Discussion

4.1. Principal Findings

In this retrospective cohort study of adults with diabetes receiving care in an academic, urban safety-net health system, 30.53% of patients experienced ≥1 ACU event for any cause within one year, emphasizing the high burden of acute care needs in this population. Using structured EHR-derived predictors spanning demographics, neighborhood deprivation (ADI), encounter/utilization patterns, diagnoses, medications, vitals, and laboratory summaries, ensemble gradient-boosting models (XGBoost, LightGBM, CatBoost) demonstrated moderate discrimination for predicting one-year ACU (AUC ~0.78) and consistently outperformed a single decision tree. Importantly, moving from a default 0.5 threshold to Macro F1–optimized thresholds improved balanced performance across models, with scores approaching 0.70 at thresholds below 0.5 (0.375–0.40). Finally, permutation importance was stable across boosted classifiers: prior utilization intensity (hospital days and ED encounters) dominated the predictive signal, followed by discharge-related factors and neighborhood deprivation, with smaller contributions from select comorbidities and laboratory markers.

4.2. Clinical Implications: Clinical Risk Stratification for ACU Within One Year

4.2.1. Using One-Year ACU Prediction to Shift from Reactive to Proactive Diabetes Care

Predicting ACU within 1 year can support proactive care management rather than reactive responses to recurrent ED visits and hospitalizations, a key issue in diabetes given the high acute care burden and associated costs [6,38]. ML-enabled risk stratification can help identify patients who may benefit from earlier and more intensive outpatient support (e.g., diabetes education, medication optimization, and care coordination), aligning with calls [47] to improve outcomes by targeting high-risk patients before avoidable utilization occurs [6,13,34].

4.2.2. Prior Utilization as a Pragmatic Trigger for Care Management Escalation

The strong importance of utilization features (e.g., inpatient days, ED use) reinforces the evidence that prior hospitalization and acute care history are among the most consistent predictors of future ACU and readmission risk in diabetes populations [6,14,34]. Operationally, these signals can be used to triage care management resources toward patients with repeated acute care contact, for whom structured transitional care and outpatient engagement may yield the greatest return [6,15].

4.2.3. Care Transitions Are High-Yield Intervention Points

Discharge-related predictors among the most influential features support the clinical premise that discharge processes and the early post-discharge period are critical windows for preventing subsequent ACU [6,15]. Many preventable returns are linked to gaps in discharge understanding, follow-up planning, and post-acute support, and interdisciplinary transitional care strategies are frequently emphasized for high-risk diabetes patients [15,48]. Therefore, a model-derived risk flag could be used to trigger targeted transitional care bundles—e.g., early follow-up scheduling, medication reconciliation, reinforcement of self-management instructions, and rapid outreach—consistent with prior diabetes readmission prevention recommendations [6,15].

4.2.4. Social Context and Neighborhood Disadvantage Should Inform Intervention Design

The recurring importance of neighborhood deprivation (ADI) aligns with the literature showing that socioeconomic determinants are predictive of healthcare utilization and that risk models improve when they incorporate social context [11,41]. In safety-net settings, integrating ADI-informed risk stratification may help direct navigation and resource linkage, such as transportation, medication affordability, and food access, to patients most likely to face structural barriers to outpatient care, which are known contributors to avoidable acute care use [6,11,39].

4.2.5. Equity Considerations When Race/Ethnicity Is Predictive

Because prior studies document racial/ethnic differences in diabetes readmissions and hospital utilization, the presence of race/ethnicity features among the top predictors should be interpreted as reflecting structural and access-related pathways rather than causal biological differences [5,10]. Race, ethnicity, and ADI should therefore be understood as markers of structural inequity, differential access to outpatient care, neighborhood-level deprivation, and other unmeasured social determinants—not as biological predictors of ACU risk. Consistent with the equity-promotion principle outlined by Chin et al. [49], feature importance in this context reflects predictive association, not causal or biological effect; whether the model exhibits disparate impact across subgroups requires a formal fairness evaluation. Before clinical deployment, model performance should be evaluated prospectively across demographic and socioeconomic subgroups—including pre-deployment and post-deployment monitoring for differential false-negative and false-positive rates—consistent with the harm-avoidance and accountability principles of responsible algorithm deployment [49].

4.3. Modeling Implications: Discrimination, Calibration, and Threshold-Based Decisions

4.3.1. Discrimination (AUC) vs. Decision Performance (Macro F1): Why Thresholding Matters

Our results illustrate a core principle in clinical prediction: the AUC summarizes ranking/discrimination. It is not tied to a specific probability threshold, whereas Macro F1 and balanced accuracy depend on the operating cutoff used to convert predicted probabilities into binary actions [45]. Consequently, optimizing model training for AUC can yield strong discrimination while still leaving room for improved decision performance through threshold selection tuned to the intended clinical use case [45,46].
AUC ≈ 0.78 for 1-year all-cause ACU in a general outpatient-plus-inpatient cohort compares favorably with published diabetes-related prediction tools, including widely cited 30-day readmission risk scores achieving AUC 0.65–0.68 in recently hospitalized patients [18,19]—a pre-selected high-risk population addressing a comparatively narrower and shorter-horizon task. Discrimination should be interpreted relative to the difficulty of the prediction task and the relevant comparators, not against abstract thresholds. We maintain appropriate caution that deployment would require prospective validation, calibration assessment, and threshold selection informed by local intervention capacity.

4.3.2. Calibration and Threshold Selection Support Clinically Meaningful Action Policies

In healthcare, false negatives often carry greater clinical risk than false positives, motivating cost-sensitive decision-making rather than default thresholding [44]. Our threshold adjustment approach is consistent with the idea that thresholds should be treated as decision parameters aligned with clinical priorities and resource constraints, such as identifying more high-risk patients for preventive intervention [44,45]. Complementing discrimination metrics with decision-oriented evaluation frameworks (e.g., net benefit) is recommended to connect predictions to clinical value [43].
Threshold optimization changed the classification operating point and improved class-balanced statistical performance, as measured by Macro F1 and balanced accuracy. These results should not be interpreted as demonstrating clinical utility, which would require explicit assessment of intervention costs, calibration in the intended setting, and prospective implementation outcomes. Decision curve analysis, which connects predicted probabilities to net clinical benefit across a range of threshold probabilities, is an important direction for future work.

4.3.3. Imbalanced Outcomes: Why Accuracy Alone Is Insufficient

Given the observed class imbalance (≈30% ACU), relying on accuracy can be misleading, as models may appear “good” while underestimating the minority outcome [46]. Macro F1 and balanced accuracy are appropriate additions because they better reflect performance across classes and penalize models that fail to identify actual cases [46]. Our finding that thresholds < 0.5 improve Macro F1 aligns with theoretical work showing that the optimal threshold for F1 is not necessarily 0.5, particularly under imbalance [45].

4.3.4. Interpretability and Clinician Trust: Connecting “Black Box” Models to Actionable Signals

A key interpretive issue is that the strongest predictors in this study were prior utilization measures. This finding is operationally useful but requires caution. Prior hospital days and ED encounters may capture clinical instability and disease severity, but they may also reflect healthcare access barriers, fragmented outpatient care, socioeconomic vulnerability, local admission practices, and historical patterns of resource use. Thus, the model may partly learn a pattern of “utilization predicting utilization,” rather than purely estimating underlying physiologic risk. For this reason, utilization features should be interpreted as markers of both clinical need and healthcare-system interaction. Model-guided interventions should therefore focus not only on medical optimization but also on care coordination, transitional support, access barriers, and social needs.
A model restricted to prior utilization features alone might achieve similar overall AUC in this cohort, given the dominance of HOSP_DAYS and prior ED encounters in the permutation importance analysis. However, such a model would primarily recapitulate known high utilizers and would not differentiate patients with comparable utilization histories who diverge in physiological risk, comorbidity trajectory, medication burden, or neighborhood deprivation—the signals most relevant to identifying patients whose risk trajectory may be modifiable. Feature ablation analysis comparing utilization-only and full-feature models is an important direction for future work.
Implementation often requires transparency, which even high-performing models may face clinical resistance if their predictions are not explainable or clinically coherent [28,29]. Our use of permutation importance supports interpretability by identifying which variables drive prediction, consistent with the broader push toward explainable machine learning in clinical settings [29,31,35]. However, feature importance should be framed as predictive association, not causation, and future work can extend interpretability with techniques such as SHAP/LIME that offer directional and individualized explanations [29,31].
Future work could incorporate SHAP (SHapley Additive exPlanations)-based explanations to provide directional and individualized feature-level interpretations, which would be particularly valuable in a prospective clinical deployment context where clinicians need to understand why a specific patient was flagged as high-risk.

4.4. Limitations

Several limitations merit consideration. This study used data from a single health system, and acute care encounters occurring outside the system may not have been fully captured. As a result, one-year ACU may have been underestimated for patients receiving fragmented care elsewhere. Although the feature set was broad, structured EHR data may not fully capture upstream drivers of ACU, including housing instability, caregiving support, health literacy, transportation barriers, and other social needs. Relatedly, a true continuity-of-care measure could not be calculated because the denominator—total patient encounters across all health systems—is not observable in single-system EHR data without external claims or health-information-exchange data. The model included within-system encounter-density features that partially reflect observed care engagement, but these variables cannot fully account for out-of-system utilization.
The retrospective design also has implications for generalizability and prospective deployment. The index date was defined relative to each patient’s last documented encounter to ensure a complete 365-day observation window for outcome ascertainment. However, this approach does not fully emulate a prospective deployment scenario in which the prediction date would be selected in real time. Future work should validate the model using a fixed calendar date or qualifying outpatient encounter as the index date, followed by prospective or temporally forward follow-up. In addition, temporal validation was not performed. Because the data span 2017–2023, including the COVID-19 pandemic period, future studies should evaluate model stability using chronological validation designs that account for evolving healthcare utilization patterns.
Several modeling considerations should also be noted. Prior utilization was among the dominant predictors, suggesting that the model may perform best for patients with established utilization patterns and may be less sensitive to newly emerging risk among patients with limited prior healthcare contact. The fitted thresholds were selected using Macro F1 as a statistical criterion under class imbalance. Macro F1 does not directly encode clinical utilities, intervention capacity, or asymmetric costs of false positives and false negatives. Therefore, the selected thresholds should be interpreted as empirical operating points for internal evaluation rather than definitive clinical decision thresholds. Future work should assess calibration, decision-curve net benefit, and implementation-specific thresholds within defined care-management workflows.
BMI imputation from weight alone was applied to 2757 patients (11.96%) for whom height was unavailable. Although the imputation model showed acceptable internal accuracy and BMI was not among the dominant predictors, this approach may not fully capture variation by height, age, sex, or demographic subgroup. Future work could evaluate multiple imputation or more flexible nonlinear imputation approaches.
Finally, the present study was not designed as a comprehensive algorithmic fairness audit. Although race, ethnicity, and ADI were included and interpreted as markers of structural and contextual risk rather than biological determinants, formal fairness evaluation requires prespecified fairness criteria, adequate subgroup sample sizes, subgroup-specific calibration and threshold-governance strategies, community engagement, and prospective monitoring of downstream intervention effects. These analyses are necessary before clinical deployment but were beyond the scope of the current model-development study.

4.5. Future Directions

Future work should prioritize validation, implementation readiness, and methodological refinement. Temporal and external validation are especially important next steps. Because this study was conducted within a single health system using data from 2017 to 2023, future studies should evaluate how model performance changes under evolving utilization patterns, post-pandemic care-delivery environments, and across health systems with different patient populations, EHR coding practices, and social-risk distributions.
Further work is also needed to connect statistical prediction performance with clinical utility. Decision curve analysis may be useful within a defined care-management deployment context, particularly when the target population, intervention, resource requirements, and relative costs of false-positive and false-negative classifications are prespecified. The Macro F1–optimized classification threshold used in this study should be interpreted as a statistical operating point, whereas the threshold probability used in decision curve analysis reflects a clinical preference or harm-benefit tradeoff. Therefore, decision curve analysis would be most informative when evaluated in relation to a specific intervention pathway.
Future deployment-oriented studies should also incorporate individualized model explanations. In this study, permutation feature importance was used to characterize population-level predictors of ACU risk. Instance-level explainability methods, such as SHAP, could extend this work by providing directional, patient-specific feature contributions for individuals flagged as high risk, supporting clinical interpretation and trust during implementation.
Equity considerations should be integrated into future validation and deployment work. A formal algorithmic fairness evaluation would require prespecified fairness criteria, subgroup-specific calibration assessment, threshold-governance strategies, community engagement, and prospective monitoring of whether model-guided interventions reduce or amplify existing disparities. Such evaluation is essential before clinical deployment, particularly because race, ethnicity, and neighborhood deprivation may reflect structural and contextual risk rather than biological determinants.
Finally, future models may benefit from richer longitudinal data and broader social-risk measurement. Rather than relying primarily on summary statistics, future work could incorporate trajectories of laboratory values, vital signs, medication changes, and healthcare utilization over time. Additional social determinants of health, such as housing instability, food insecurity, transportation access, caregiving support, and health literacy, may further improve risk characterization. Ultimately, prospective clinical trials are needed to determine whether model-guided risk stratification can reduce one-year ACU and improve outcomes among adults with diabetes.

5. Conclusions

In this retrospective cohort from a single urban academic health system, electronic health record-based machine-learning models demonstrated moderate discrimination for predicting all-cause 1-year ACU among adults with diabetes. Threshold selection improved class-balanced statistical performance relative to the default 0.50 cutoff, and feature-importance analyses consistently highlighted prior utilization intensity, discharge-related factors, and neighborhood deprivation as the dominant predictive signals. These findings support further temporal and external validation before clinical implementation or generalization to other populations and settings.

Author Contributions

Conceptualization, J.L. and D.J.R.; methodology, J.L., H.S., G.Y. and D.J.R.; formal analysis, G.Y. and H.S.; investigation, G.Y. and H.S.; writing—original draft preparation, J.L. and H.S.; writing—review and editing, All authors; visualization, G.Y.; funding acquisition, D.J.R. All authors have read and agreed to the published version of the manuscript.

Funding

Research reported in this publication was supported by the National Institute of Diabetes and Digestive and Kidney Diseases of the National Institutes of Health under Award Number R01DK122073. The content is solely the responsibility of the authors and does not necessarily represent the official views of the National Institutes of Health.

Institutional Review Board Statement

The study was conducted in accordance with the Declaration of Helsinki, and deemed exempt by the Institutional Review Board of Temple University (protocol code 31697, 30 July 2024) for studies involving humans.

Informed Consent Statement

This is a study of pre-existing retrospective data, we received a waiver of consent and a waiver of HIPAA authorization to use the data.

Data Availability Statement

Data are available on request due to institutional privacy restrictions on data use.

Conflicts of Interest

The authors declare no conflicts of interest. The funders had no role in the design of the study; in the collection, analyses, or interpretation of data; in the writing of the manuscript; or in the decision to publish the results.

Abbreviations

The following abbreviations are used in this manuscript:
ACUAcute Care Use
ADIArea Deprivation Index
AUCArea Under the Receiver Operating Characteristic Curve
MLMachine Learning
EHRElectronic Health Record
TUHSTemple University Health System
EDEmergency Department
IPInpatient Hospitalizations
OSObservation Stays
BMIBody Mass Index
RUCARural–Urban Commuting Area
NATRANKADI National Rank
ROCReceiver Operating Characteristic
AVTHAmbulatory and Telehealth Visits

Appendix A. Cohort Selection Process

Figure A1. Cohort selection flow diagram.
Diabetology 07 00116 g0a1

Appendix B. Model Covariates

Appendix B.1. Demographics/ADI (29 Covariates)

We included demographic and socioeconomic characteristics comprising the calendar year of a patient’s first encounter within the lookback period (FIRST_ENCOUNTER_YEAR), encoded discharge status (ENCODED_DISCHARGE_STATUS), sex (SEX_M), Hispanic ethnicity, race, English proficiency, age, and smoking status (current or former, never, or not available). Geographic and neighborhood context were captured using RUCA classification (metropolitan core vs. non-core) and the NATRANK. Categorical variables with more than two levels were transformed into sets of binary indicator variables, with each indicator denoting the presence or absence of a specific category: first encounter year (5 binary covariates), discharge status (5 binary covariates), Hispanic ethnicity (4 binary covariates), race (3 binary covariates), ADI (5 binary covariates), and smoking (3 binary covariates).

Appendix B.2. Encounter Statistics (14 Covariates)

Healthcare utilization patterns were characterized using encounter-based summary measures, including total number of encounters (NUM_ENC), number of hospital days (HOSP_DAYS), number of activity days (ACTIVITY_DAYS), counts of ED, IP, OS, AVTH, and other encounter types (MISC). Temporal utilization dynamics were further summarized using the minimum, maximum, mean, and median intervals between consecutive encounters (MIN_INTERVAL, MAX_INTERVAL, AVG_INTERVAL, and MEDIAN_INTERVAL). Additionally, we computed 30-day revisit counts for acute care encounters (ED, IP, and OS) as well as 30-day revisit counts for all other encounter types (REVISIT_30_EOI and REVISIT_30_OTH).

Appendix B.3. BMI and Vitals (9 Covariates)

We included the mean inferred BMI and descriptive statistics (mean, minimum, maximum, and standard deviation) of diastolic and systolic blood pressure measured during the lookback period.

Appendix B.4. Medications (5 Covariates)

We defined five binary medication indicators, each denoting whether a patient had at least one prescription record in the corresponding medication category during the lookback period (True) or not (False): use of cholesterol-modifying medications (MED_CHOLESTEROL), use of medications for diabetes management (MED_DIABETES), use of antihypertensive medications not acting on the renin–angiotensin–aldosterone system (MED_NON_RAAS_BP), use of antihypertensive medications acting on the renin–angiotensin–aldosterone system (MED_RAAS_BP), and use of prescribed systemic corticosteroids (MED_STEROIDS).

Appendix B.5. Diagnoses (39 Covariates)

We constructed 39 binary diagnostic variables, each indicating whether a patient had at least one diagnosis record in the corresponding comorbidity category during the lookback period (True) or not (False): HIV/AIDS (AIDS), alcohol use disorder (ALCOHOL), deficiency anemia (ANEMDEF), autoimmune diseases (AUTIMMUNE), blood loss anemia (BLOODLOSS), leukemia (CANCER_LEUK), lymphoma (CANCER_LYMPH), metastatic cancer (CANCER_METS), carcinoma in situ (CANCER_NSITU), solid tumor malignancy (CANCER_SOLID), cerebrovascular disease (CBVD_POA and CBVD_SQLA), coagulation disorders (COAG), dementia and degenerative cognitive disorders (DEMENTIA), depressive disorders (DEPRESS), diabetes with and without chronic complications (DIAB_CX and DIAB_UNCX), substance use disorder/drug abuse (DRUG_ABUSE), heart failure (HF), hypertension with complications (HTN_CX), uncomplicated hypertension (HTN_UNCX), mild liver disease (LIVER_MLD), moderate-to-severe liver disease (LIVER_SEV), chronic pulmonary disease (LUNG_CHRONIC), neurologic disorders with movement impairment (NEURO_MOVT), other neurologic disorders (NEURO_OTH), seizure disorders/epilepsy (NEURO_SEIZ), obesity (OBESE), paralysis (PARALYSIS), peripheral vascular disease (PERIVASC), psychotic disorders (PSYCHOSES), pulmonary circulation disorders (PULMCIRC), moderate renal failure (RENLFL_MOD), severe renal failure (RENLFL_SEV), hypothyroidism (THYROID_HYPO), other thyroid disorders (THYROID_OTH), peptic ulcer disease (ULCER_PEPTIC), valvular heart disease (VALVE), and weight loss/malnutrition (WGHTLOSS).

Appendix B.6. Laboratory Results (84 Covariates)

We summarized laboratory measurements using descriptive statistics (mean, minimum, maximum, and standard deviation) for 21 distinct laboratory tests: ALT, AST, Albumin, Bilirubin, Blood Urea Nitrogen, CO2, Creatinine, eGFR, Sodium, Glucose, HbA1c, Anion Gap, Hematocrit, White Blood Cell, Troponin-i, Lactate, Arterial pH, Venous pH, PaCO2, PaO2, and LDL.

Appendix C. Comparison of Calibration Performance, ECE, and Brier Scores Across XGBoost, LightGBM, CatBoost, and Decision Tree Models

Figure A2. Calibration plots for XGBoost, LightGBM, CatBoost, and Decision Tree.
Diabetology 07 00116 g0a2

Appendix D. Training-Set Cross-Validation AUC Stability

Table A1. Summary of training-set generalization stability.
ClassifierMean AUCSDMean ± SD
Decision Tree0.75550.00540.7555 ± 0.0054
XGBoost0.78690.00730.7869 ± 0.0073
LightGBM0.78720.00730.7872 ± 0.0073
CatBoost0.78710.00680.7871 ± 0.0068
AUC stability was evaluated exclusively within the 80% training set using 8-fold stratified cross-validation and optimized hyperparameters for each classifier. These values summarize training-stage generalization stability and should not be interpreted as final held-out test-set performance. The final test-set AUCs were reported separately.

Appendix E. Comparison of Selected Prior Studies Predicting Diabetes-Related Hospitalization, Readmission, or Acute Care Use

Table A2. Comparison of selected prior studies versus the present study.
StudyPopulationOutcomeHorizonModelValidationAUCKey Difference from the Present Study
Rubin et al., 2016 [19]Diabetes, hospitalized30-day readmission30-dayRisk scoreInternal0.65–0.6830-day readmission; hospitalized patients only
Rubin et al., 2017 [18]Diabetes + CVD, hospitalized30-day readmission30-dayRisk scoreInternal~0.6730-day readmission; CVD subset only
Shang et al., 2021 [50]Diabetes, hospitalized30-day readmission30-dayML classifiersInternal0.70–0.7830-day readmission; single hospitalization
Hai et al., 2023 [7]Diabetes, hospitalized30-day readmission30-dayDeep learningInternal~0.7430-day readmission; hospitalized patients only
Rubin et al., 2023 [14]Diabetes (±discharge Dx)30-day readmission30-dayRisk scoreInternal0.64–0.7030-day readmission; mixed inpatient/outpatient
Present studyDiabetes, outpatient + inpatient1-year all-cause ACU (ED + IP + OS)1-yearXGBoost, LightGBM, CatBoostInternal (80/20 split)~0.78Broader 1-year composite ACU; full outpatient + inpatient cohort; ADI integrated

References

  1. National Diabetes Statistics Report. Available online: https://www.cdc.gov/diabetes/php/data-research/index.html (accessed on 30 September 2025).
  2. Parker, E.D.; Lin, J.; Mahoney, T.; Ume, N.; Yang, G.; Gabbay, R.A.; Elsayed, N.A.; Bannuru, R.R. Economic Costs of Diabetes in the U.S. in 2022. Diabetes Care 2024, 47, 26–43. [Google Scholar] [CrossRef] [Scilit] [PubMed]
  3. Nirantharakumar, K.; Hemming, K.; Narendran, P.; Marshall, T.; Coleman, J.J. A Prediction Model for Adverse Outcome in Hospitalized Patients with Diabetes. Diabetes Care 2013, 36, 3566–3572. [Google Scholar] [CrossRef] [Scilit] [PubMed]
  4. Wändell, P.; Wierzbicka, M.; Sigurdsson, K.; Olofsson, A.; Wachtler, C.; Wessman, T.; Melander, O.; Ekelund, U.; Björkelund, A.; Carlsson, A.C. Development and evaluation of a machine learning prediction model for short-term mortality in patients with diabetes or hyperglycemia at emergency department admission. Cardiovasc. Diabetol. 2025, 24, 383. [Google Scholar] [CrossRef] [Scilit] [PubMed]
  5. Cook, C.B.; Naylor, D.B.; Hentz, J.G.; Miller, W.J.; Tsui, C.; Ziemer, D.C.; Waller, L.A. Disparities in diabetes-related hospitalizations: Relationship of age, sex, and race/ethnicity with hospital discharges, lengths of stay, and direct inpatient charges. Ethn. Dis. 2006, 16, 126–131. [Google Scholar] [PubMed]
  6. Rubin, D.J.; Shah, A.A. Predicting and Preventing Acute Care Re-Utilization by Patients with Diabetes. Curr. Diabetes Rep. 2021, 21, 34. [Google Scholar] [CrossRef] [Scilit] [PubMed]
  7. Hai, A.A.; Weiner, M.G.; Paranjape, A.; Livshits, A.; Brown, J.R.; Obradovic, Z.; Rubin, D.J. Deep learning vs traditional models for predicting hospital readmission among patients with diabetes. In Proceedings of the AMIA Annual Symposium Proceedings; AMIA: Los Angeles, CA, USA, 2023; p. 512. [Google Scholar]
  8. Neto, C.; Senra, F.; Leite, J.; Rei, N.; Rodrigues, R.; Ferreira, D.; Machado, J. Different scenarios for the prediction of hospital readmission of diabetic patients. J. Med. Syst. 2021, 45, 11. [Google Scholar] [CrossRef] [Scilit] [PubMed]
  9. Wadhera, R.K.; Joynt Maddox, K.E.; Desai, N.R.; Landon, B.E.; Md, M.V.; Gilstrap, L.G.; Shen, C.; Yeh, R.W. Evaluation of hospital performance using the excess days in acute care measure in the hospital readmissions reduction program. Ann. Intern. Med. 2021, 174, 86–92. [Google Scholar] [CrossRef] [Scilit] [PubMed]
  10. Rodriguez-Gutierrez, R.; Herrin, J.; Lipska, K.J.; Montori, V.M.; Shah, N.D.; McCoy, R.G. Racial and Ethnic Differences in 30-Day Hospital Readmissions Among US Adults with Diabetes. JAMA Netw. Open 2019, 2, e1913249. [Google Scholar] [CrossRef] [Scilit] [PubMed]
  11. Chen, S.; Bergman, D.; Miller, K.; Kavanagh, A.; Frownfelter, J.; Showalter, J. Using applied machine learning to predict healthcare utilization based on socioeconomic determinants of care. AM J. Manag. Care 2020, 26, 26–31. [Google Scholar] [CrossRef] [Scilit] [PubMed]
  12. Liu, V.B.; Sue, L.Y.; Wu, Y. Comparison of machine learning models for predicting 30-day readmission rates for patients with diabetes. J. Med. Artif. Intell. 2024, 7, 23. [Google Scholar] [CrossRef] [Scilit]
  13. Hu, T.-L.; Chao, C.-M.; Wu, C.-C.; Chien, T.-N.; Li, C. Machine Learning-Based Predictions of Mortality and Readmission in Type 2 Diabetes Patients in the ICU. Appl. Sci. 2024, 14, 8443. [Google Scholar] [CrossRef] [Scilit]
  14. Rubin, D.J.; Maliakkal, N.; Zhao, H.; Miller, E.E. Hospital Readmission Risk and Risk Factors of People with a Primary or Secondary Discharge Diagnosis of Diabetes. J. Clin. Med. 2023, 12, 1274. [Google Scholar] [CrossRef] [Scilit] [PubMed]
  15. Gregory, N.S.; Seley, J.J.; Dargar, S.K.; Galla, N.; Gerber, L.M.; Lee, J.I. Strategies to Prevent Readmission in High-Risk Patients with Diabetes: The Importance of an Interdisciplinary Approach. Curr. Diab. Rep. 2018, 18, 54. [Google Scholar] [CrossRef] [Scilit] [PubMed]
  16. Hai, A.A.; Weiner, M.G.; Livshits, A.; Brown, J.R.; Paranjape, A.; Hwang, W.; Kirchner, L.H.; Mathioudakis, N.; French, E.K.; Obradovic, Z. Domain generalization for enhanced predictions of hospital readmission on unseen domains among patients with diabetes. Artif. Intell. Med. 2024, 158, 103010. [Google Scholar] [CrossRef] [Scilit] [PubMed]
  17. Rubin, D.J. Hospital Readmission of Patients with Diabetes. Curr. Diabetes Rep. 2015, 15, 17. [Google Scholar] [CrossRef] [Scilit] [PubMed]
  18. Rubin, D.J.; Golden, S.H.; McDonnell, M.E.; Zhao, H. Predicting readmission risk of patients with diabetes hospitalized for cardiovascular disease: A retrospective cohort study. J. Diabetes Its Complicat. 2017, 31, 1332–1339. [Google Scholar] [CrossRef] [Scilit] [PubMed]
  19. Rubin, D.J.; Handorf, E.A.; Golden, S.H.; Nelson, D.B.; McDonnell, M.E.; Zhao, H. Development and validation of a novel tool to predict hospital readmission risk among patients with diabetes. Endocr. Pract. 2016, 22, 1204–1215. [Google Scholar] [CrossRef] [PubMed]
  20. Li, T.-C.; Li, C.-I.; Liu, C.-S.; Lin, W.-Y.; Lin, C.-H.; Yang, S.-Y.; Chiang, J.-H.; Lin, C.-C. Development and validation of prediction models for the risks of diabetes-related hospitalization and in-hospital mortality in patients with type 2 diabetes. Metabolism 2018, 85, 38–47. [Google Scholar] [CrossRef] [Scilit] [PubMed]
  21. Rubin, D.J.; Donnell-Jackson, K.; Jhingan, R.; Golden, S.H.; Paranjape, A. Early readmission among patients with diabetes: A qualitative assessment of contributing factors. J. Diabetes Its Complicat. 2014, 28, 869–873. [Google Scholar] [CrossRef] [Scilit] [PubMed]
  22. Karunakaran, A.; Zhao, H.; Rubin, D.J. Predischarge and Postdischarge Risk Factors for Hospital Readmission Among Patients with Diabetes. Med. Care 2018, 56, 634–642. [Google Scholar] [CrossRef] [Scilit] [PubMed]
  23. Liss, D.T.; Ackermann, R.T.; Cooper, A.; Finch, E.A.; Hurt, C.; Lancki, N.; Rogers, A.; Sheth, A.; Teter, C.; Schaeffer, C. Effects of a Transitional Care Practice for a Vulnerable Population: A Pragmatic, Randomized Comparative Effectiveness Trial. J. Gen. Intern. Med. 2019, 34, 1758–1765. [Google Scholar] [CrossRef] [Scilit] [PubMed]
  24. Lo, Y.-T.; Liao, J.C.; Chen, M.-H.; Chang, C.-M.; Li, C.-T. Predictive modeling for 14-day unplanned hospital readmission risk by using machine learning algorithms. BMC Med. Inform. Decis. Mak. 2021, 21, 288. [Google Scholar] [CrossRef] [Scilit] [PubMed]
  25. Maleki, F.; Ovens, K.; Gupta, R.; Reinhold, C.; Spatz, A.; Forghani, R. Generalizability of machine learning models: Quantitative evaluation of three methodological pitfalls. Radiol. Artif. Intell. 2022, 5, e220028. [Google Scholar] [PubMed]
  26. Vabalas, A.; Gowen, E.; Poliakoff, E.; Casson, A.J. Machine learning algorithm validation with a limited sample size. PLoS ONE 2019, 14, e0224365. [Google Scholar] [CrossRef] [Scilit] [PubMed]
  27. Zhao, H.; Tanner, S.; Golden, S.H.; Fisher, S.G.; Rubin, D.J. Common sampling and modeling approaches to analyzing readmission risk that ignore clustering produce misleading results. BMC Med. Res. Methodol. 2020, 20, 281. [Google Scholar] [CrossRef] [Scilit] [PubMed]
  28. De Hond, A.; Raven, W.; Schinkelshoek, L.; Gaakeer, M.; Ter Avest, E.; Sir, O.; Lameijer, H.; Hessels, R.A.; Reijnen, R.; De Jonge, E. Machine learning for developing a prediction model of hospital admission of emergency department patients: Hype or hope? Int. J. Med. Inform. 2021, 152, 104496. [Google Scholar] [CrossRef] [Scilit] [PubMed]
  29. Lu, H.; Uddin, S. Explainable Stacking-Based Model for Predicting Hospital Readmission for Diabetic Patients. Information 2022, 13, 436. [Google Scholar] [CrossRef] [Scilit]
  30. Abdel Hai, A.; Weiner, M.G.; Livshits, A.; Brown, J.R.; Paranjape, A.; Obradovic, Z.; Rubin, D.J. Spatial Knowledge Transfer with Deep Adaptation Network for Predicting Hospital Readmission. In Artificial Intelligence in Medicine; Springer: Cham, Switzerland, 2023; pp. 130–139. [Google Scholar]
  31. Liu, C.; Huang, Z.; Liu, T.; Ge, Y.; Yuan, J.; Lin, Y.; Wang, C.; Zhang, J.; Wang, X.; Hua, Y.; et al. Construction and validation of a hypoglycemia risk prediction model for hospitalized type 2 diabetes patients based on machine learning. BMC Endocr. Disord. 2025, 25, 291. [Google Scholar] [CrossRef] [Scilit] [PubMed]
  32. Fingar, K.R.; Reid, L.D. Diabetes-Related Inpatient Stays, 2018; Agency for Healthcare Research and Quality: Rockville, ND, USA, 2021.
  33. Zhang, Y.; Bullard, K.M.; Imperatore, G.; Holliday, C.S.; Benoit, S.R. Proportions and trends of adult hospitalizations with diabetes, United States, 2000–2018. Diabetes Res. Clin. Pract. 2022, 187, 109862. [Google Scholar] [CrossRef] [Scilit] [PubMed]
  34. Brisimi, T.S.; Xu, T.; Wang, T.; Dai, W.; Paschalidis, I.C. Predicting diabetes-related hospitalizations based on electronic health records. Stat. Method Med. Res. 2019, 28, 3667–3682. [Google Scholar]
  35. Emi-Johnson, O.G.; Nkrumah, K.J. Predicting 30-Day Hospital Readmission in Patients with Diabetes Using Machine Learning on Electronic Health Record Data. Cureus 2025, 17, e82437. [Google Scholar] [CrossRef] [Scilit] [PubMed]
  36. Shi, M.; Yang, A.; Lau, E.S.H.; Luk, A.O.Y.; Ma, R.C.W.; Kong, A.P.S.; Wong, R.S.M.; Chan, J.C.M.; Chan, J.C.N.; Chow, E. A novel electronic health record-based, machine-learning model to predict severe hypoglycemia leading to hospitalizations in older adults with diabetes: A territory-wide cohort and modeling study. PLoS Med. 2024, 21, e1004369. [Google Scholar] [CrossRef] [Scilit] [PubMed]
  37. Tan, J.K.; Quan, L.; Salim, N.N.M.; Tan, J.H.; Goh, S.-Y.; Thumboo, J.; Bee, Y.M. Machine Learning–Based Prediction for High Health Care Utilizers by Using a Multi-Institutional Diabetes Registry: Model Training and Evaluation. JMIR AI 2024, 3, e58463. [Google Scholar] [CrossRef] [Scilit] [PubMed]
  38. Cannon, A.; Handelsman, Y.; Heile, M.; Shannon, M. Burden of illness in type 2 diabetes mellitus. J. Manag. Care Spec. Pharm. 2018, 24, S5–S13. [Google Scholar] [CrossRef] [Scilit] [PubMed]
  39. Alizadeh, J.M.; Patel, J.S.; Tajeu, G.; Chen, Y.; Hollin, I.L.; Patel, M.K.; Fei, J.; Wu, H. Predicting Emergency Department Visits for Patients with Type II Diabetes. arXiv 2024, arXiv:2412.08984. [Google Scholar]
  40. 2020 Rural-Urban Commuting Area Codes. Available online: https://www.ers.usda.gov/data-products/rural-urban-commuting-area-codes (accessed on 30 December 2025).
  41. Kind, A.J.; Buckingham, W.R. Making neighborhood-disadvantage metrics accessible—The neighborhood atlas. N. Engl. J. Med. 2018, 378, 2456. [Google Scholar] [CrossRef] [Scilit] [PubMed]
  42. Elixhauser Comorbidity Software Refined for ICD-10-CM. Available online: https://hcup-us.ahrq.gov/toolssoftware/comorbidityicd10/comorbidity_icd10.jsp (accessed on 12 January 2026).
  43. Vickers, A.J.; Elkin, E.B. Decision curve analysis: A novel method for evaluating prediction models. Med. Decis. Mak. 2006, 26, 565–574. [Google Scholar] [CrossRef] [Scilit] [PubMed]
  44. Elkan, C. The foundations of cost-sensitive learning. In Proceedings of the International Joint Conference on Artificial Intelligence; ACM: New York, NY, USA, 2001; pp. 973–978. [Google Scholar]
  45. Lipton, Z.C.; Elkan, C.; Naryanaswamy, B. Optimal thresholding of classifiers to maximize F1 measure. In Proceedings of the Joint European Conference on Machine Learning and Knowledge Discovery in Databases; Springer: Berlin/Heidelberg, Germany, 2014; pp. 225–239. [Google Scholar]
  46. O’Brien, R.; Ishwaran, H. A random forests quantile classifier for class imbalanced data. Pattern Recognit. 2019, 90, 232–249. [Google Scholar] [CrossRef] [Scilit] [PubMed]
  47. Draznin, B.; Gilden, J.; Golden, S.H.; Inzucchi, S.E.; PRIDE investigators; Baldwin, D.; Bode, B.W.; Boord, J.B.; Braithwaite, S.S.; Cagliero, E. Pathways to quality inpatient management of hyperglycemia and diabetes: A call to action. Diabetes Care 2013, 36, 1807–1814. [Google Scholar] [CrossRef] [Scilit] [PubMed]
  48. Sezik, S.; Cingiz, M.Ö.; İbiş, E. Machine Learning-Based Model for Emergency Department Disposition at a Public Hospital. Appl. Sci. 2025, 15, 1628. [Google Scholar] [CrossRef] [Scilit]
  49. Chin, M.H.; Afsar-Manesh, N.; Bierman, A.S.; Chang, C.; Colón-Rodríguez, C.J.; Dullabh, P.; Duran, D.G.; Fair, M.; Hernandez-Boussard, T.; Hightower, M.; et al. Guiding Principles to Address the Impact of Algorithm Bias on Racial and Ethnic Disparities in Health and Health Care. JAMA Netw. Open 2023, 6, e2345050. [Google Scholar] [CrossRef] [Scilit] [PubMed]
  50. Shang, Y.; Jiang, K.; Wang, L.; Zhang, Z.; Zhou, S.; Liu, Y.; Dong, J.; Wu, H. The 30-days hospital readmission risk in diabetic patients: Predictive modeling with machine learning classifiers. BMC Med. Inform. Decis. Mak. 2021, 21, 1472–6947. [Google Scholar] [CrossRef] [Scilit] [PubMed]
Figure 1. Study windows for each patient timeline.
Diabetology 07 00116 g001
Figure 2. ROC curves and confusion matrices for boosted classifiers at Macro F1–optimized thresholds. Panels show (A) XGBoost, (B) LightGBM, and (C) CatBoost. ROC curves summarize discrimination (AUC), while confusion matrices summarize classification outcomes at the fitted thresholds.
Diabetology 07 00116 g002
Figure 3. Permutation feature importance (top 10 features) for ACU prediction models: (A) XGBoost, (B) LightGBM, and (C) CatBoost. Higher values indicate greater contribution to predictive performance.
Diabetology 07 00116 g003
Table 1. Demographic and neighborhood characteristics of patients with and without ACU.
CharacteristicsAll Patients
N = 23,052
Patients with ACU
N = 7039
Patients Without ACU
N = 16,013
p-Value
Sex, N (%) <0.001
Male10,973 (47.60)3204 (45.52)7769 (48.52)
Female12,079 (52.40)3835 (54.48)8244 (51.48)
Rural/Urban, N (%) <0.001
Rural (RUCA = 0.0)456 (1.98)86 (1.22)370 (2.31)
Urban (RUCA = 1.0)22,596 (98.02)6953 (98.78)15,643 (97.69)
Age years, N (%) <0.001
18–44 1942 (8.42)634 (9.01)1308 (8.17)
45–649479 (41.12)2995 (42.55)6484 (40.49)
65–746652 (28.86)1932 (27.45)4720 (29.48)
≥54979 (21.60)1478 (21.00)3501 (21.86)
Race, N (%) <0.001
White8048 (34.91)1463 (20.78)6585 (41.12)
Black7998 (34.70)3131 (44.48)4867 (30.39)
Other1012 (4.39)164 (2.33)848 (5.30)
Unknown and not reported5994 (26.00)2281 (32.41)3713 (23.19)
Ethnicity, N (%) <0.001
Hispanic5093 (22.09)2127 (30.22)2966 (18.52)
Non-Hispanic16,758 (72.70)4482 (63.67)12,276 (76.66)
Unknown and not reported1201 (5.21)430 (6.11)771 (4.81)
Area Deprivation Index (ADI), N (%) <0.001
Q11146 (4.97)154 (2.19)992 (6.19)
Q23913 (16.97)653 (9.28)3260 (20.36)
Q34559 (19.78)970 (13.78)3589 (22.41)
Q44682 (20.31)1443 (20.50)3239 (20.23)
Q58606 (37.33)3765 (53.49)4841 (30.23)
Other146 (0.63)54 (0.77)92 (0.57)
Note: Values are n (%). p-values are from χ2 tests comparing ACU vs. non-ACU groups. RUCA = Rural–Urban Commuting Area; ADI = Area Deprivation Index.
Table 2. Predictive performance of machine learning classifiers at a 0.5 threshold.
ClassifierAccuracyBalanced AccuracyMacro F1SensitivitySpecificityAUC
(Test Set)
Decision Tree0.74390.62800.63720.33030.92570.7529
XGBoost0.76360.66900.68340.42610.91200.7824
LightGBM0.76430.67010.68450.42830.91200.7839
CatBoost0.76400.66940.68380.42610.91260.7834
Table 3. Predictive performance of machine learning classifiers using Macro F1-optimized thresholds.
ClassifierAccuracyBalanced AccuracyMacro F1SensitivitySpecificityFitted ThresholdAUC
(Test Set)
Decision Tree0.72000.68500.67920.59520.77490.4000.7529
XGBoost0.74430.69500.69640.56820.82170.3750.7824
LightGBM0.74910.68920.69470.53550.84300.4000.7839
CatBoost0.75040.69000.69570.53480.84510.4000.7834
Table 4. Bootstrap AUC confidence intervals and Brier loss for evaluated models.
ClassifierAUC
(Test Set)
Bootstrap AUC Mean95% CIBrier Loss
Decision Tree0.75290.75300.7389–0.76770.1743
XGBoost0.78240.78250.7681–0.79690.1642
LightGBM0.78390.78390.7694–0.79840.1637
CatBoost0.78340.78350.7691–0.79800.1640
AUC was evaluated on the held-out test set. Bootstrap estimates were obtained using 1000 resamples of the held-out test set. Brier loss was calculated from predicted probabilities on the held-out test set, with lower values indicating better probabilistic prediction performance. CI = confidence interval; AUC = area under the receiver operating characteristic curve.
Disclaimer/Publisher’s Note: The statements, opinions and data contained in all publications are solely those of the individual author(s) and contributor(s) and not of MDPI and/or the editor(s). MDPI and/or the editor(s) disclaim responsibility for any injury to people or property resulting from any ideas, methods, instructions or products referred to in the content.