Systematic Review

Comparative Effectiveness of Treatment Options for Gestational Diabetes: A Systematic Review and Meta-Analysis


1
Faculty of Medicine and Medical Sciences, University of Balamand, Kalhat, Tripoli P.O. Box 100, Lebanon
2
AUB Diabetes, American University of Beirut, Beirut, Lebanon
*
Authors to whom correspondence should be addressed.
These authors contributed equally to this work.
Diabetology 2026, 7(6), 103; https://doi.org/10.3390/diabetology7060103
Submission received: 2 April 2026 / Revised: 28 April 2026 / Accepted: 15 May 2026 / Published: 28 May 2026

Abstract

Background: The prevalence of GDM is increasing and is associated with maternal health and neonatal complications. Therapeutic intervention for this condition is important for the health of both mothers and their unborn children. Objective: The present meta-analysis evaluates the effects of pharmacological, nutritional, and physical activity interventions on maternal and neonatal outcomes in women with GDM, including glucometabolic control, weight gain, blood pressure, lipid profiles, and pregnancy complications. Methods: Multiple databases were systematically searched for studies investigating GDM interventions and their effects on maternal and neonatal outcomes, including at least one of the following endpoints: 2 h postprandial glycemia, FBG, HbA1c, triglycerides, cholesterol, weight gain, blood pressure, cesarean delivery, preeclampsia, gestational age at delivery, neonatal hypoglycemia, neonatal complications, birth weight, preterm birth, Apgar score at 5 min, macrosomia, and NICU admission. Initial screening identified 204 records, which were narrowed to 17 studies meeting the eligibility criteria for inclusion in the meta-analysis following multi-author relevance review. Six reviewers independently extracted data and resolved discrepancies through consensus. Study quality was appraised by two reviewers using the Cochrane Risk of Bias tool, and data were analyzed using the RevMan Web software with random-effects models. Results: Pharmacological, nutritional, and physical activity interventions in women with gestational diabetes mellitus demonstrated statistically significant reductions in gestational weight gain and cesarean delivery rates. No statistically significant effects were observed for HbA1c, fasting blood glucose, 2 h postprandial glucose, lipid profiles, or blood pressure. Several outcomes, including preeclampsia, neonatal hypoglycemia, neonatal complications, and NICU admission, showed non-significant trends toward benefit, but these findings were based on limited data and should be interpreted cautiously. No meaningful effects were observed for gestational age at delivery, neonatal birth weight, preterm birth, Apgar score, or macrosomia. Substantial heterogeneity was present across metabolic outcomes, limiting the interpretability of pooled estimates. Conclusions: Nutritional and physical activity interventions significantly reduce HbA1c, gestational weight gain, and cesarean delivery in women with GDM, with protective trends for preeclampsia and neonatal complications. However, effects on lipid profiles and blood pressure remain inconsistent. Personalized, multimodal strategies integrating pharmacological, nutritional, and lifestyle modifications are necessary for optimal GDM management.

1. Introduction

Gestational diabetes mellitus (GDM) is an increasing health concern globally, posing risks to both maternal and fetal health [1]. The etiology of GDM involves both impaired insulin secretion and increased insulin resistance, both of which tend to rise with gestational age [2]. GDM is characterized by any level of glucose intolerance that begins or is first identified during pregnancy, leading to hyperglycemia of varying severity [2,3]. The International Association for the Study of Diabetes in Pregnancy (IADPSG) defines gestational diabetes mellitus (GDM) as a fasting glucose level ≥ 5.1 mmol/L (92 mg/dL), a one-hour post-oral glucose tolerance test (OGTT) glucose level ≥ 10.0 mmol/L (180 mg/dL), or a two-hour post-OGTT glucose level ≥ 8.5 mmol/L (153 mg/dL) [4]. According to the International Association of Diabetes and Pregnancy Study Groups (IADPSG), screening using OGTT is recommended for high-risk women at their initial prenatal visit and for all pregnant women between 24 and 28 weeks of gestation [5].
Risk factors for GDM include obesity, physical inactivity, advanced maternal age, multiparity, a family history of type 2 diabetes mellitus, and certain ethnic backgrounds, including Asian ethnicity [5]. Additional risk factors include a history of macrosomic birth, GDM in a previous pregnancy, and polycystic ovarian syndrome, all of which contribute to an increased likelihood of developing GDM during pregnancy [5].
The prevalence of hyperglycemia in pregnancy, which can reach as high as 19.7%, according to the IDF Diabetes Atlas 11th Edition 2025, is continuously increasing and is influenced by factors such as lifestyle changes, unhealthy dietary habits, reduced physical activity, and a later age at childbearing [6]. This upward trend is concerning, as GDM is associated with immediate complications during pregnancy and a significantly elevated risk of developing type 2 diabetes for both mothers and their offspring in both the short and long term [7].
GDM increases the risk of type 2 diabetes mellitus (T2DM), cardiovascular disease, malignancy, ophthalmic and renal diseases [6]. In addition, women with GDM have a higher risk of adverse maternal outcomes. These include cesarean delivery, pregnancy-induced hypertension, premature rupture of membranes, and both antepartum and postpartum hemorrhage [8].
On the other hand, the effects of a mother with gestational diabetes on the offspring are extensive, with short-term effects including macrosomia, neonatal hypoglycemia, shoulder dystocia and a possible influence on perinatal death [9]. In addition, hypocalcemia, hyperbilirubinemia, polycythemia and poor suckling in newborn infants were also reported [6]. Furthermore, the long-term impact of exposure to gestational diabetes remains uncertain, including its potential role in increasing insulin resistance, which may contribute to the development of prediabetes and diabetes. It has also been linked to metabolic syndrome, higher body mass index compared to the general population, and an elevated risk of cardiovascular diseases [9].
According to the American Diabetes Association, initial management of gestational diabetes mellitus (GDM) begins with nonpharmacologic strategies, including increased physical activity, dietary modifications, and regular glucose monitoring. Recommendations suggest at least 20 min of moderate-intensity aerobic and strength exercises per day, aiming for 150 min per week, along with nutritional counseling based on the patient’s BMI [10]. For pharmacologic intervention, insulin is the first-line treatment [10], as it does not cross the placental barrier. Oral hypoglycemic agents are also used, though their effectiveness varies.
The most widely used oral therapies are metformin and glyburide (glibenclimide) [10]. Metformin reduces hepatic glucose production and improves insulin sensitivity. It crosses the placenta, and the long-term safety data are reassuring but limited [11]. Glyburide is a sulfonylurea that also crosses the placenta and poses an increased risk of neonatal hypoglycemia [11]. The major guidelines like the ADA, the ACOG Practice bulletin and the Endocrine Society guidelines mention oral therapies as acceptable alternatives to insulin; however, they should be used with caution and are not FDA-approved [10,11,12].
Effective management of gestational diabetes mellitus (GDM) is crucial to mitigate potential complications for both mother and child. Early identification and intervention can significantly reduce the risk of fetal macrosomia, neonatal hypoglycemia, and the need for cesarean delivery [13].
Given the critical role of various management strategies in improving maternal health and pregnancy outcomes, this meta-analysis aims to evaluate the effectiveness of pharmacologic, nutritional, and physical activity interventions on maternal and neonatal outcomes.

2. Methods

2.1. Eligibility Criteria

This meta-analysis includes pregnant women diagnosed with gestational diabetes mellitus (GDM), regardless of age, ethnicity, or gestational age at diagnosis. Eligible studies assess the effectiveness of various GDM management strategies, including dietary interventions, oral hypoglycemic agents, insulin therapy, and lifestyle modifications. Exclusion criteria include studies focusing on women with pre-existing diabetes (type 1 or type 2), GDM diagnosed before the study period, or those with other pregnancy complications or medical conditions that may impact GDM management or outcomes. Study designs included randomized controlled trials (RCTs), controlled clinical trials, cohort studies (prospective or retrospective), and case–control studies comparing different interventions or exposures. Additionally, case reports, case series, animal studies, non-comparative studies, and studies with insufficient data or incomplete outcome reporting were excluded. A PRISMA Statement and checklist can be found in the Supplementary Materials. The protocol for this systematic review was registered in Prospero under the registration number CRD42024533348.

2.2. Information Sources

We gathered information from multiple sources, focusing on clinical trials, and conducted systematic searches across major databases, including MEDLINE (PubMed), Embase, Cochrane Central Register of Controlled Trials (CENTRAL), Web of Science, and ClinicalTrials.gov. To ensure relevance and precision, we applied an RCT filter in PubMed to prioritize randomized controlled trials and refined our keyword selection to exclude irrelevant studies. While our initial search spanned January 2018 to June 2023, for this meta-analysis, we expanded the search to include all available records up to the present with no restrictions on publication date. However, only studies published in English were considered.

2.3. Search Strategy

Our comprehensive search approach aimed to find a wide range of research on associated treatments for women with gestational diabetes. We conducted a search using suitable databases and a set of tags and keywords using the Boolean strategy. The search strategy used was as followed: (“Gestational Diabetes Mellitus”[Mesh] OR “GDM”) AND (“Diet Therapy”[Mesh] OR “Hypoglycemic Agents”[Mesh] OR “Insulin Therapy”[Mesh] OR “Exercise Therapy”[Mesh] OR “Lifestyle Modification”) AND (“Glycemic Control”[Mesh] OR “Pregnancy Outcome”[Mesh] OR “Maternal Health”[Mesh]) AND (“Randomized Controlled Trial”[Publication Type] OR “Cohort Studies”[Mesh] OR “Case-Control Studies”[Mesh]) AND (English[Language]). These tags helped to comprehensively explore the literature while staying closely aligned with the focus of our study. With each exclusion criterion and filter applied, the number of articles matching our search decreased. At the end of this search, we obtained 3793 articles from PubMed, Cochrane Library, Embase and ClinicalTrials.gov. The next step was to check if these articles were relevant to our study and select them based on the criteria that we already mentioned.

2.4. Selection Process

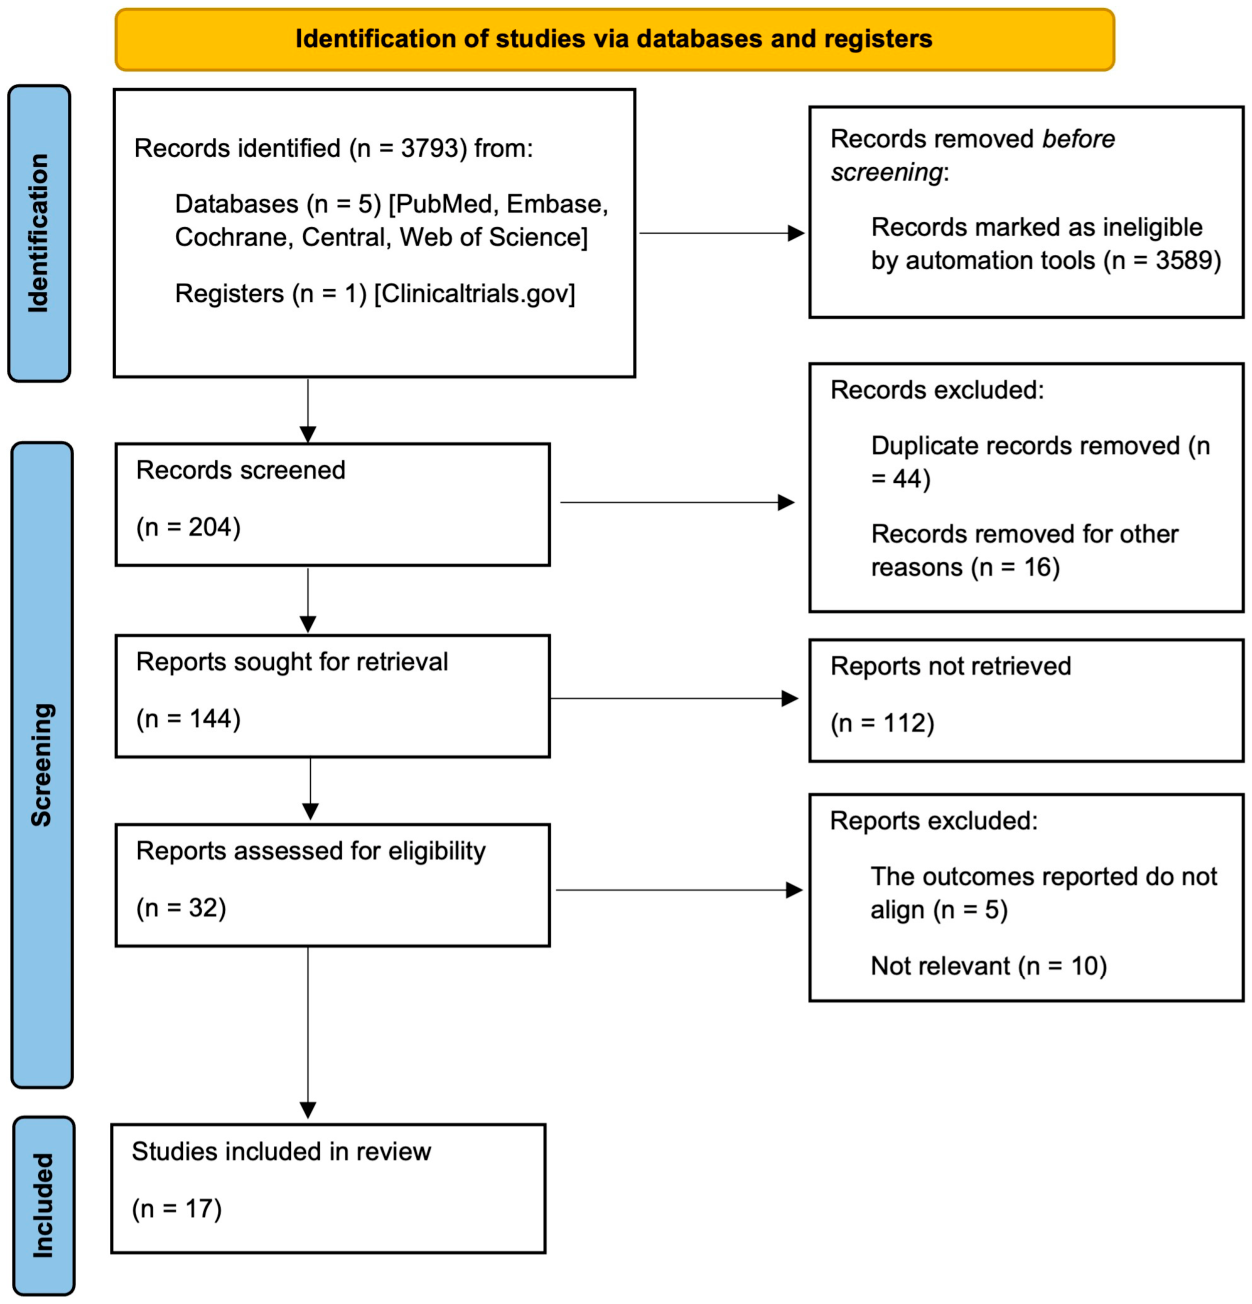
The selection process was conducted using an Excel (Version 16.106.3) sheet to organize and filter the retrieved articles. The list began with 204 articles. Duplicates were removed, along with studies focusing solely on GDM in obese patients or neonatal complications. After this initial screening, 144 articles remained. These were then distributed among the six main authors, who independently assessed their relevance. Following a thorough review, 32 articles were shortlisted. After further exclusion of studies that did not align with our predefined outcomes and objectives, we finalized 17 articles for inclusion in the meta-analysis. The PRISMA flow chart shows the selection process in detail and is represented in Figure 1.

2.5. Data Collection Process

Two independent reviewers extracted data from the selected studies using a standardized data extraction form created in Microsoft Excel. Any discrepancies were resolved through discussion and, when necessary, consultation with other authors. Data were collected from published reports and Supplementary Materials and recorded in a structured Microsoft Excel database. The database included study identifiers, study characteristics, participant demographics, intervention details, and outcomes of interest. All data were securely stored and prepared for analysis.

2.6. Data Items

Primary outcomes of this meta-analysis included maternal metabolic and clinical parameters: fasting blood glucose, 2 h postprandial glycemia, HbA1c, triglycerides, cholesterol, blood pressure (hypertensive events), and gestational weight gain. Secondary outcomes encompassed maternal and neonatal complications: cesarean delivery, preeclampsia, gestational age at delivery, neonatal hypoglycemia, neonatal complications, birth weight, preterm birth, Apgar score at 5 min, macrosomia, and neonatal intensive care unit admission. Outcome measures were assessed during pregnancy following intervention initiation, with metabolic parameters typically evaluated at 35–37 weeks of gestation or at delivery, while pregnancy and neonatal outcomes were documented at or immediately following parturition.
Figure 1. PRISMA flow chart for selected studies.
Diabetology 07 00103 g001

2.7. Study Risk of Bias Assessment

To assess the validity of the included studies, we conducted a risk of bias evaluation for our meta-analysis. We utilized the Cochrane Collaboration risk of bias tool to guide our evaluation, examining domains such as selection bias, performance bias, and reporting bias. Two authors independently extracted information from each study and answered the tool’s questionnaire to ensure a thorough and impartial process. In cases of discrepancies, a detailed discussion was held to reach an agreement on the risk of bias classification. Each study was classified into one of three categories: low risk of bias, high risk of bias, or unclear risk of bias. This approach boosted both the transparency and dependability of our meta-analysis, while also laying a solid groundwork for assessing the validity and quality of the studies included in our systematic review.

2.8. Effect Measures

For continuous outcomes, mean differences (MD) with 95% confidence intervals (CI) were calculated for glycemic control parameters (fasting blood glucose, 2 h postprandial glycemia, HbA1c), gestational weight gain, triglyceride levels, and cholesterol levels. For dichotomous outcomes, odds ratios (OR) with 95% CI were computed for hypertensive events, cesarean delivery, preeclampsia, neonatal hypoglycemia, neonatal complications, preterm birth, macrosomia, and NICU admission. Random-effects models using the inverse variance method were employed for all analyses to account for anticipated heterogeneity across studies. Between-study heterogeneity was assessed using the I2 statistic and Cochran’s Q test, with I2 values of 25%, 50%, and 75% representing low, moderate, and high heterogeneity, respectively. Statistical significance was set at p < 0.05. All analyses were performed using the Review Manager (RevMan Web) software developed by The Cochrane Collaboration (https://revman.cochrane.org (accessed 13 February 2026)).

2.9. Synthesis Methods

A random-effects model was used for all data synthesis to account for the anticipated variability across studies. Heterogeneity was assessed using Cochran’s Q test and the I2 statistic, both of which indicated substantial inconsistency among study results. Sensitivity analyses were conducted by excluding studies with high risk of bias or disproportionate weight; however, as these exclusions did not meaningfully alter the overall estimates, the results were not reported separately. Subgroup analyses were conducted according to intervention type (pharmacological versus lifestyle-based) to explore potential sources of heterogeneity and differences in treatment effects across intervention categories.

2.10. Reporting Bias Assessment

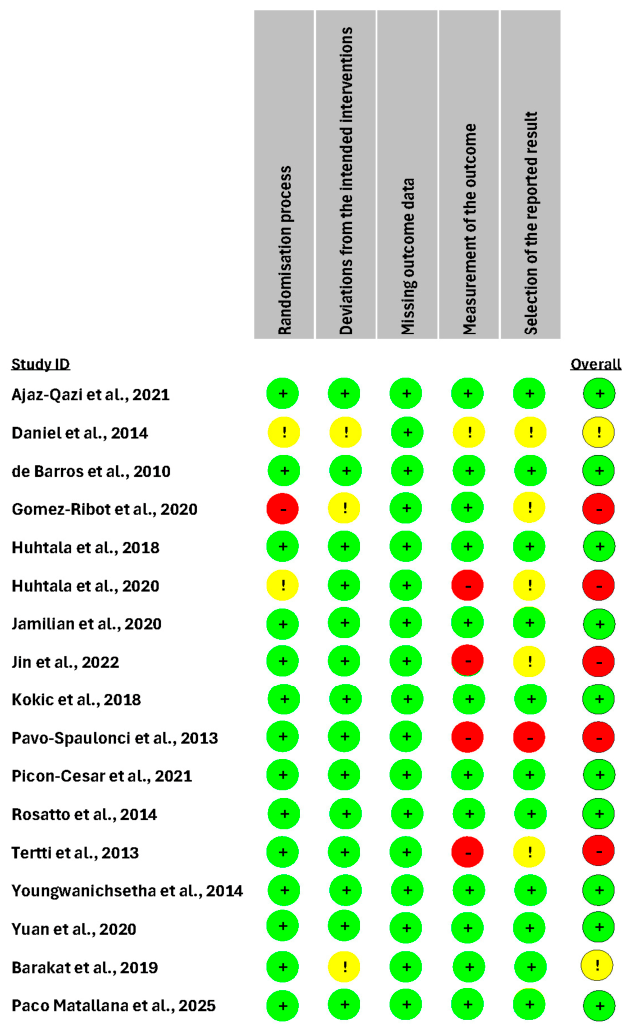
Risk of bias assessment was conducted independently by two reviewers, with disagreements resolved through discussion. For randomized controlled trials (RCTs), the Revised Cochrane Risk of Bias Tool for Randomized Trials (RoB 2) was utilized to evaluate bias across five domains: randomization process, deviations from intended interventions, missing outcome data, measurement of outcomes, and selection of reported results. Based on the algorithmic assessment and reviewers’ judgment, of the 17 included studies, 5 were classified as high risk of bias and 6 demonstrated low risk of bias, with the remaining studies showing some concerns or moderate risk.
The bias analysis results are summarized in Figure 2.

2.11. Certainty of Assessment

The certainty of evidence was assessed using the RoB 2 tool results, considering factors such as inconsistency, selective reporting, imprecision, and publication bias. Studies were categorized as having high, moderate, or low certainty based on these domains (as shown in Table 1). The final classification was determined by combining the risk of bias algorithm results with assessors’ overall judgment. Any discrepancies were resolved through discussion to ensure an objective and standardized evaluation.
Figure 2. Traffic-light plot showing the risk of bias in the included studies based on Cochrane’s RoB 2.0 tool [1,7,14,15,16,17,18,19,20,21,22,23,24,25,26,27,28].
Diabetology 07 00103 g002

3. Results

A total of 205 studies were screened, and 17 studies were included in this meta-analysis. Table 2 summarizes the characteristics of the studies included.

3.1. Individual Study Results

  • Maternal metabolic outcomes
-
Fasting blood glucose:
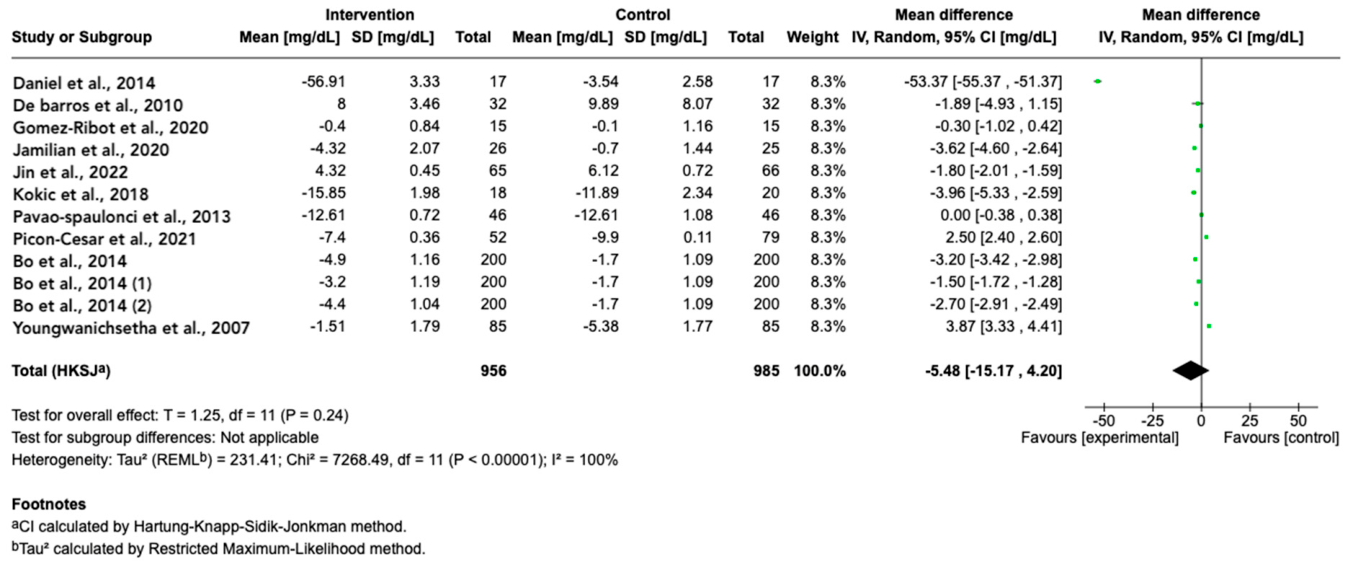
For fasting blood glucose, twelve comparisons (956 intervention participants vs. 985 controls) were analyzed, and the pooled effect indicated no significant change in fasting glucose with intervention. The combined mean difference was −5.48 mg/dL (95% CI −15.17 to 4.20; p = 0.24), a reduction in the intervention group that was not statistically reliable (confidence interval crossed the null effect line) (Figure 3). Between-study heterogeneity was extremely high (I2 = 100%, Tau2 = 231.4), suggesting marked inconsistency among trial results. In subgroup analyses, pharmacological interventions had no significant effect on fasting glucose (mean difference +1.26 mg/dL, 95% CI −14.63 to 17.14; p = 0.50), and non-pharmacological interventions likewise showed a non-significant mean reduction (−6.84 mg/dL, 95% CI −18.63 to 4.96; p = 0.22). The difference between these subgroup effects was not statistically significant (test for subgroup interaction: p = 0.13), indicating no clear evidence that the type of intervention influenced fasting glucose outcomes (Figure S1). Notably, heterogeneity remained substantial within both subgroups as well (I2 ≈ 99–100% in each), pointing to variability beyond just the intervention category.
-
2 h postprandial glycemia:
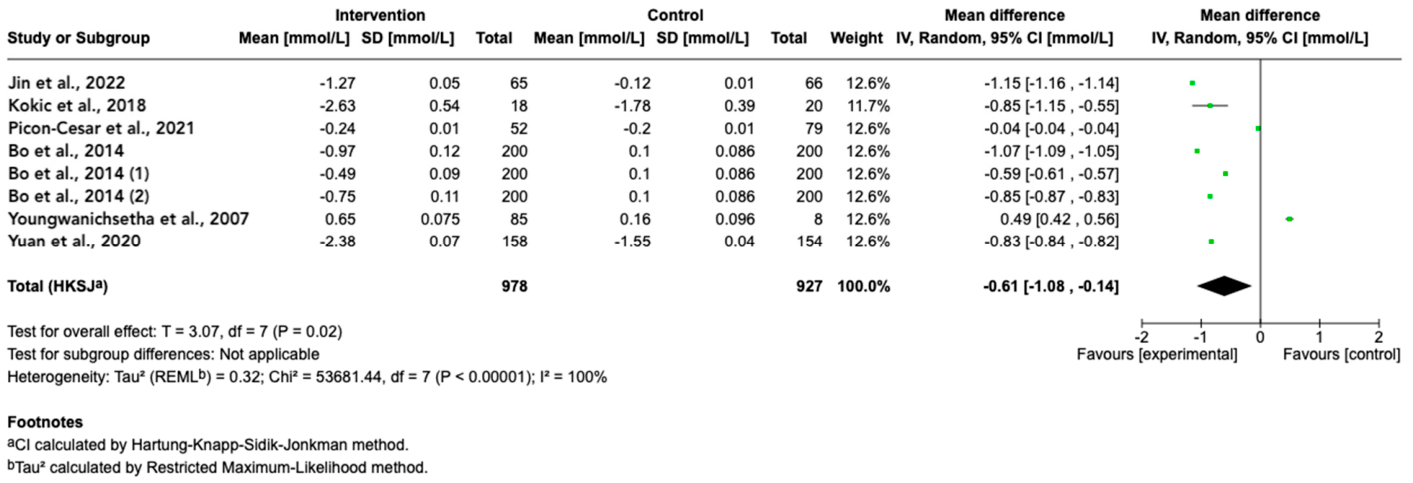
Eight comparisons (978 intervention participants vs. 927 controls) reported 2 h postprandial blood glucose outcomes. The pooled analysis showed a modest but statistically significant reduction in 2 h postprandial glucose in the intervention groups compared to controls (Figure 4). The mean difference was −0.61 mmol/L (95% CI −1.08 to −0.14; p = 0.02), indicating that interventions, on average, lowered postprandial glucose levels. However, heterogeneity was very high (I2 = 100%, Tau2 = 0.32), reflecting substantial variability across studies. Subgroup analysis suggested that this effect differed by intervention type. Lifestyle-based interventions (diet, exercise, or combined) produced a significant 2 h glucose reduction (mean difference −0.69 mmol/L, 95% CI −1.20 to −0.18; p = 0.02), whereas the single drug-based intervention trial reported an essentially negligible change (−0.04 mmol/L difference, with an extremely narrow CI). The test for subgroup differences was significant (p = 0.002), indicating that non-pharmacological interventions were more effective than the pharmacological approach in reducing postprandial glucose (Figure S2). Despite stratifying by subgroup, considerable residual heterogeneity persisted in the lifestyle interventions (I2 = 100%), underscoring that even among similar intervention types the results were highly variable.
-
HbA1c levels:
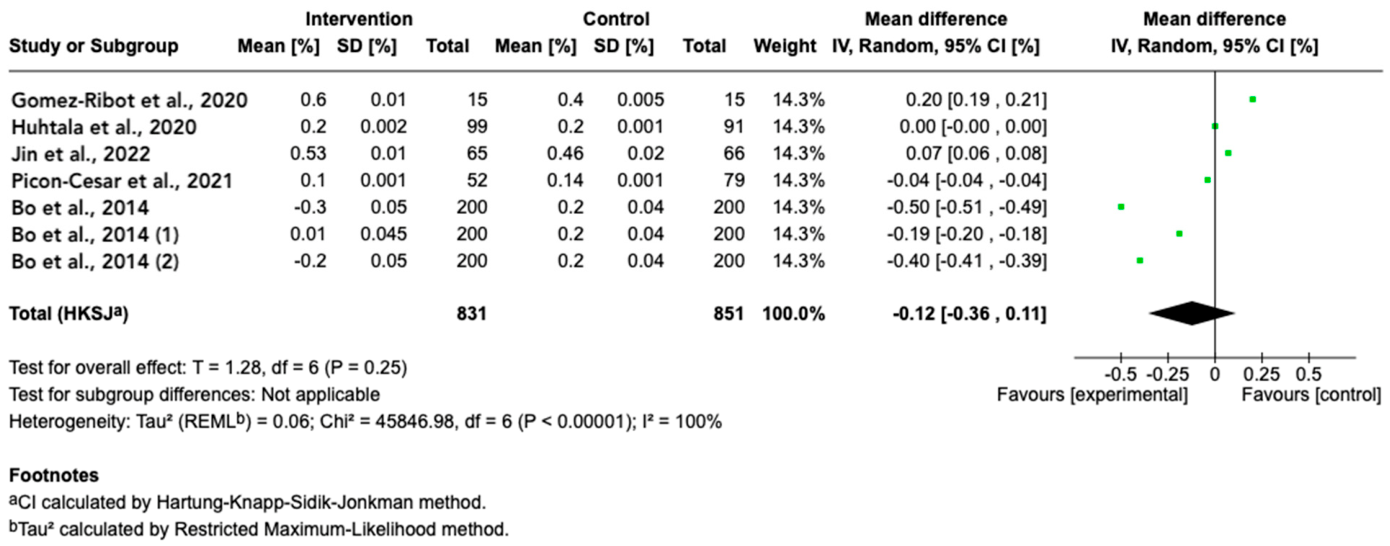
The meta-analysis of HbA1c (7 comparisons; 831 intervention participants vs. 851 controls) found no significant difference in glycemic control between intervention and control groups (Figure 5). The pooled mean difference was −0.12 (95% confidence interval [CI] −0.36 to 0.11; p = 0.25), indicating a small, non-significant reduction in HbA1c favoring the intervention on average. Heterogeneity was considerable (I2 = 100%, Tau2 = 0.06), reflecting high variability between studies. Subgroup analysis by intervention type showed no significant subgroup effect: pharmacological (drug) interventions yielded a mean difference of −0.02 (95% CI −0.27 to 0.23; p = 0.50) and non-pharmacological interventions (diet, exercise, or combined lifestyle changes) had a mean difference of −0.16 (95% CI −0.53 to 0.21; p = 0.29) (Figure S3). Neither subgroup achieved a statistically significant improvement in HbA1c, and the test for subgroup differences was not significant (p = 0.29).
-
Weight change:
Gestational weight gain was defined in each study as the difference between baseline weight and the weight at the study end-point. Most studies assessed gestational weight gain from a similar baseline, typically between 24 and 28 weeks of gestation. For example, Bo et al. (2014) measured from 24–26 weeks gestational age (GA) as a baseline to delivery, while Gomez-Ribot et al. (2020) used pre-pregnancy weight as the baseline and measured to term (~37 weeks GA). Other studies followed similar timelines, with slight variations depending on study design and intervention duration.
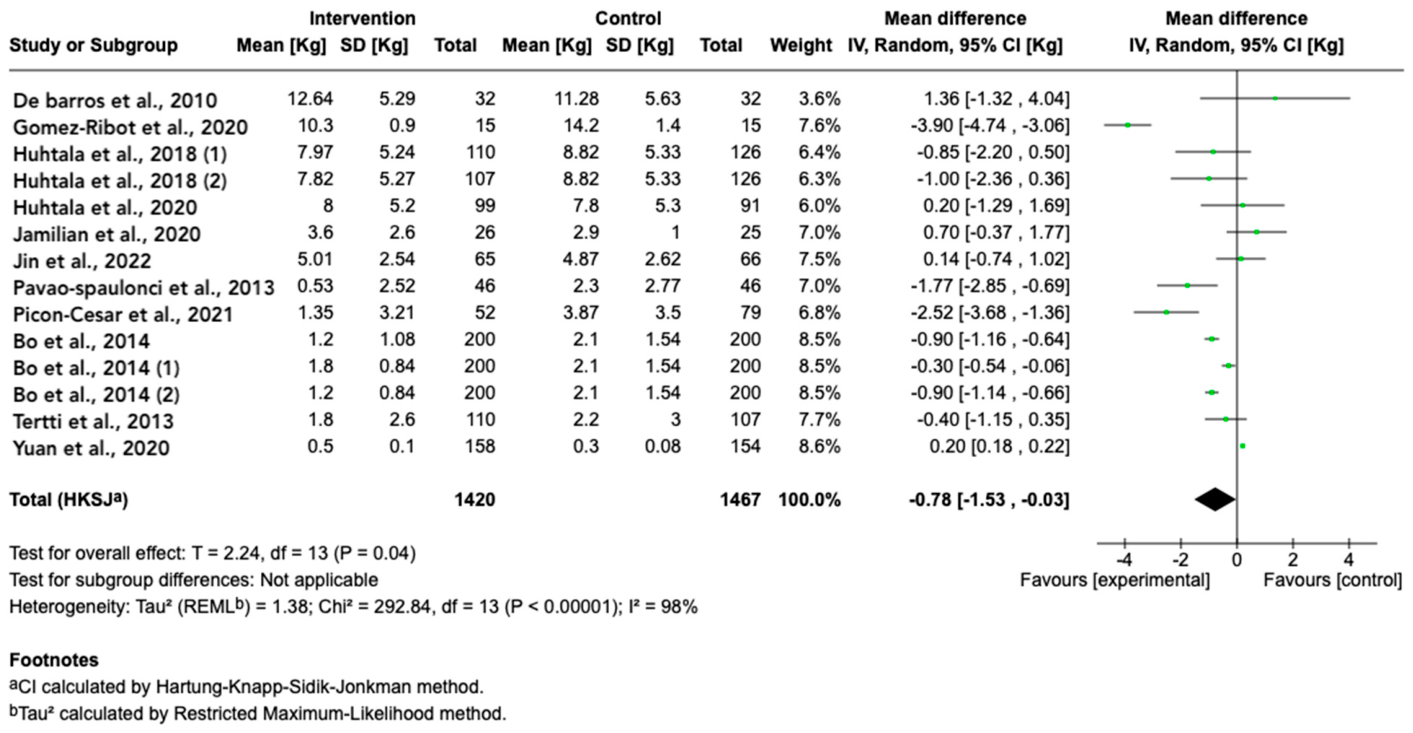
Overall, interventions were associated with a modest but statistically significant reduction in weight gain compared to control (pooled mean difference −0.78 kg, 95% CI −1.53 to −0.03; p = 0.04) (Figure 6). Between-study heterogeneity was considerable for this outcome (I2 = 98%, Tau2 = 1.38), indicating substantial differences in effect sizes across trials. Subgroup analyses showed that pharmacological interventions tended to produce a larger reduction in weight gain than non-pharmacological (lifestyle) approaches, although this difference was not statistically significant (Chi2(1) = 0.61; p = 0.44). The pooled effect for the drug intervention subgroup was −1.08 kg (95% CI −2.09 to −0.07; p = 0.04), indicating significantly less weight gain with medication, and heterogeneity within this subgroup was moderate (I2 = 62%, Tau2 = 0.56) (Figure S5). In contrast, the combined estimate for lifestyle-based interventions (such as diet or exercise programs) was smaller and not statistically significant (mean difference −0.56 kg, 95% CI −1.84 to 0.73; p = 0.34), and those studies exhibited very high variability (I2 = 99%, Tau2 = 2.05).
-
Triglycerides levels:
Emerging evidence indicates that dyslipidemia during pregnancy, particularly elevated LDL and triglycerides, is associated with the development and severity of GDM and may contribute to adverse metabolic outcomes [1,23]. Interventions such as structured exercise programs or n-3 fatty acid supplementation have been shown to improve lipid profiles, glycemic control, and inflammatory markers, highlighting the mechanistic and clinical relevance of including these biochemical outcomes in the present review [1].
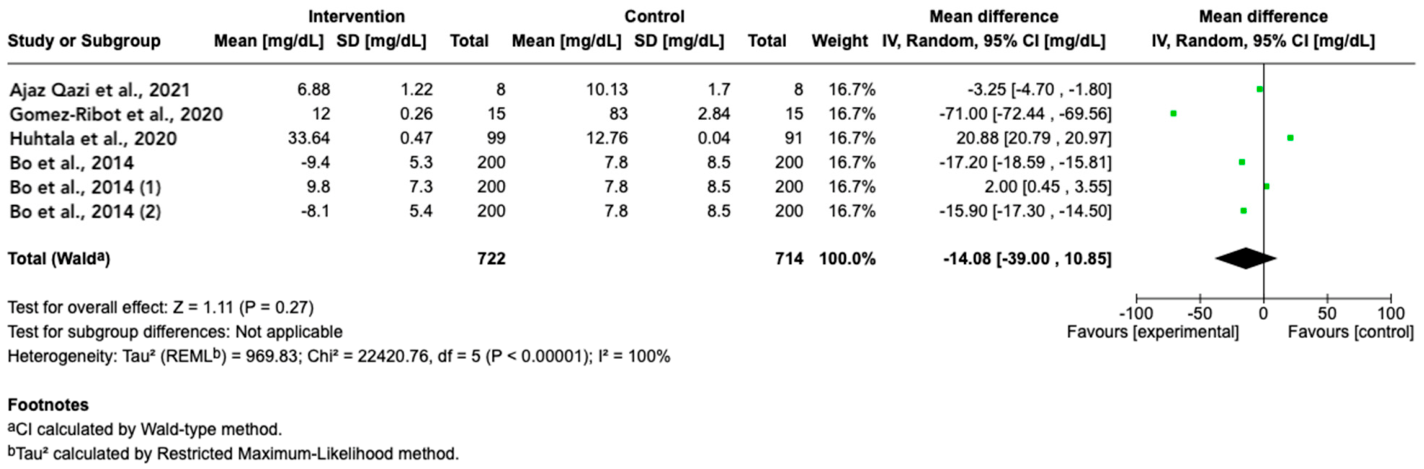
Overall, there was no statistically significant difference in triglyceride levels between the intervention and control groups (pooled mean difference −14.08 mg/dL, 95% confidence interval [CI] −39.00 to 10.85; p = 0.27) (Figure 7). However, heterogeneity was extremely high (I2 = 100%, Tau2 = 969.83), indicating substantial variability across studies. Subgroup analysis by intervention type revealed a significant difference between subgroups (Chi2 = 10.40, p = 0.001). The single pharmacological intervention trial was associated with higher triglyceride levels in the intervention group compared to controls (mean difference ~+20.9 mg/dL; p < 0.00001). By contrast, the pooled estimate for non-pharmacological interventions (e.g., dietary changes, exercise, or combined lifestyle approaches) suggested a decrease in triglycerides (mean difference −21.07 mg/dL), but this effect was not statistically significant (95% CI −46.57 to 4.43; p = 0.11) (Figure S6). Heterogeneity within the non-drug subgroup remained considerable (I2 = 100%, Tau2 = 845.56), underscoring inconsistent effects among those studies.
-
Cholesterol Levels
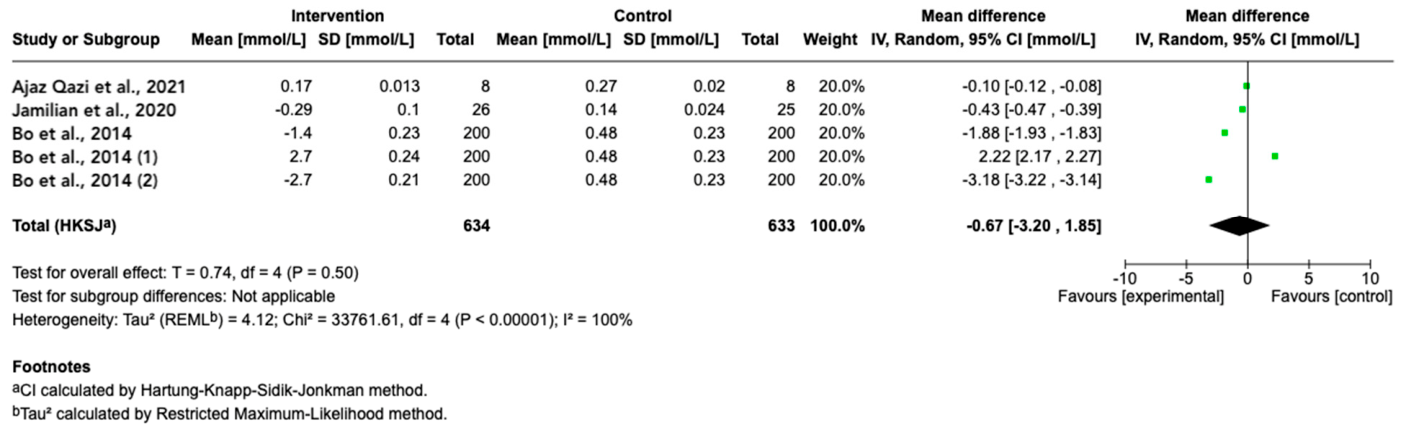
Five comparisons (634 intervention participants vs. 633 controls) assessed effects on cholesterol levels. Overall, there was no significant difference in cholesterol between intervention and control groups. The pooled mean difference was −0.67 mmol/L (95% CI −3.20 to 1.85; p = 0.50), suggesting a small average decrease in the intervention arm that was not statistically significant (Figure 8). There was substantial heterogeneity among these studies (I2 = 100%, Tau2 = 4.12), indicating that the magnitude and direction of cholesterol changes varied widely across trials. Notably, all included comparisons for this outcome were non-pharmacological interventions (e.g., dietary changes, exercise, or their combination); no pharmacological trials reported usable cholesterol outcomes in this analysis. Consequently, a formal subgroup comparison by intervention type was not applicable for cholesterol (Figure S7). In summary, lifestyle interventions did not show a consistent or significant impact on cholesterol levels compared to control, and the high between-study variance implies that individual study results ranged from sizable cholesterol reductions in some interventions to little or even opposite effects in others.
  • Maternal complication outcomes
-
Hypertensive events in GDM patients:
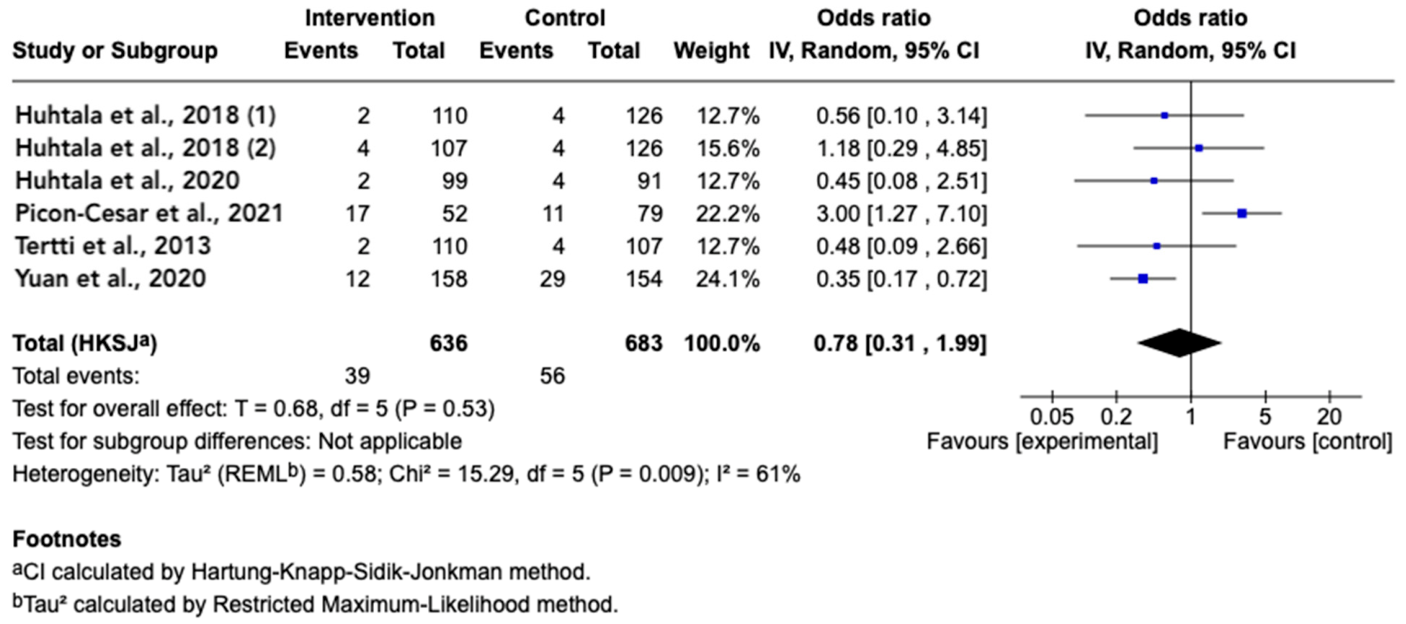
Six comparisons (636 intervention participants vs. 683 controls) evaluated the occurrence of hypertensive events (incident hypertension or blood pressure elevations). Overall, the interventions did not significantly alter the odds of hypertensive events relative to control. The pooled odds ratio (OR) was 0.78 (95% CI 0.31 to 1.99; p = 0.53), indicating a non-significant trend toward fewer hypertension events in the intervention group, but with a wide confidence interval including no effect (Figure 9). Between-study heterogeneity was moderate (I2 = 61%, Tau2 = 0.58; Q-statistic p = 0.009), suggesting some variability in effect sizes across trials. Subgroup analysis revealed contrasting findings by intervention type. Pharmacological interventions (five comparisons) collectively showed no clear benefit (pooled OR 1.03, 95% CI 0.34–3.10; p = 0.94), implying the drug treatments did not reduce the risk of hypertension events compared to controls. In contrast, the single lifestyle intervention study (dietary/exercise intervention) demonstrated a significant reduction in hypertensive events (OR 0.35, 95% CI 0.17–0.72; p = 0.004), with substantially fewer events in the intervention group (Figure S4). The test for subgroup difference was borderline significant (p = 0.05), indicating a potential interaction whereby non-drug interventions were more effective than drug-based approaches in preventing hypertension, though this finding is on the threshold of statistical significance. Within the drug-intervention subgroup, heterogeneity was moderate (I2 = 46%, p = 0.12), while heterogeneity could not be assessed for the single lifestyle trial. These results suggest that only the lifestyle modification showed a significant protective effect against hypertensive events, whereas pharmacological strategies did not, aligning with a possible difference in efficacy between intervention types.
-
Cesarean Delivery:
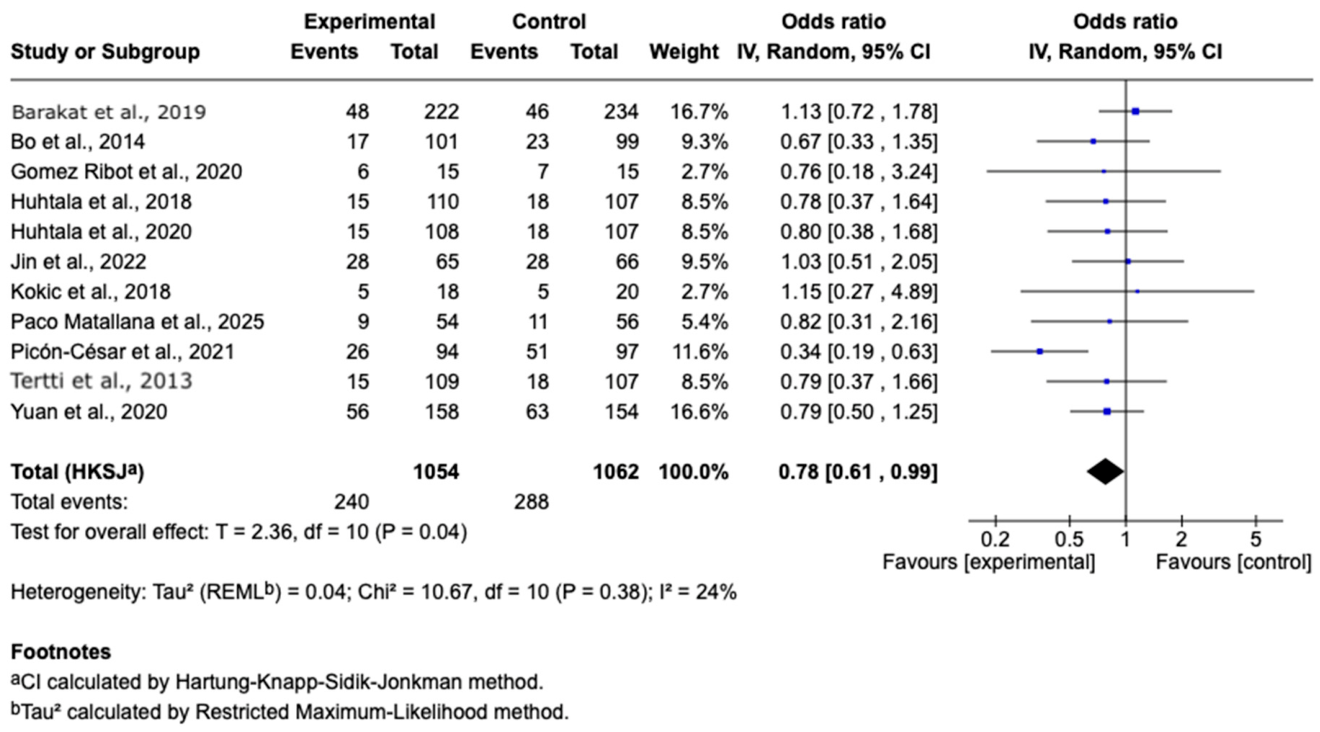
A meta-analysis of 11 randomized controlled trials comprising 2116 participants (1054 experimental; 1062 control) revealed a statistically significant protective effect of the experimental intervention on cesarean delivery outcomes, with a pooled odds ratio of 0.78 (95% CI: 0.61–0.99; p = 0.04), representing a 22% relative reduction in cesarean delivery odds. The random-effects model was appropriately applied, as substantiated by moderate heterogeneity metrics (I2 = 24%, τ2 = 0.04, χ2 = 10.67, p = 0.38), indicating that genuine between-study variation was minimal and did not substantially compromise the robustness of the pooled estimate (Figure 10). Individual studies demonstrated considerable variability in point estimates and precision, with Barakat et al. (2019) and Yuan et al. (2020) receiving the greatest weight (16.7% and 16.6%, respectively), while seven of eleven studies yielded confidence intervals spanning the null value; notably, Picón-César et al. (2021) provided the strongest protective estimate (OR = 0.34; 95% CI: 0.19–0.63). The summary estimate’s marginal statistical significance, achieved with a 95% CI narrowly excluding unity at its upper bound, combined with an I2 of 24%, supports confidence in the consolidated effect; however, the boundary nature of the p-value and consideration of potential publication bias or unmeasured confounding in original trial designs necessitate cautious interpretation. The clinical significance translates to a 22% odds reduction which, for a baseline cesarean delivery rate of 25%, approximates a number needed to treat of 20–25 patients, indicating a therapeutically relevant intervention effect.
-
Preeclampsia:
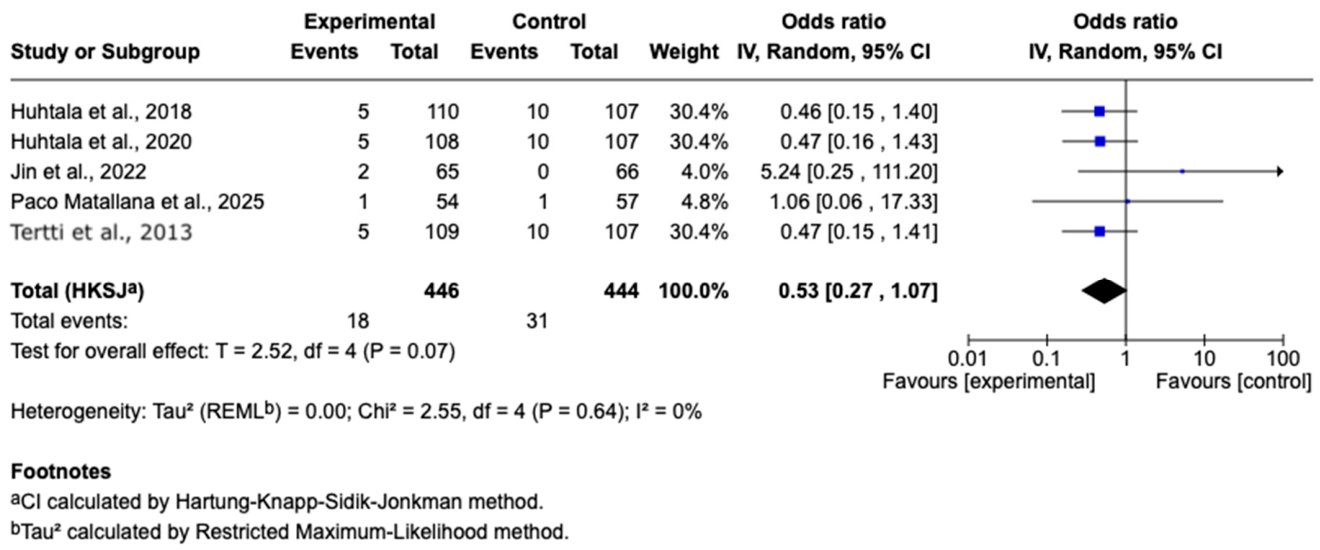
A meta-analysis of five studies comprising 890 participants (446 experimental; 444 control) evaluated the effect of interventions on preeclampsia incidence, yielding a pooled odds ratio of 0.53 (95% CI: 0.27–1.07; p = 0.07) using a random-effects inverse variance model (Figure 11). While the point estimate suggests a reduction in odds favoring the intervention, the result did not reach statistical significance, and the confidence interval includes the null value, precluding definitive conclusions regarding efficacy. Heterogeneity across studies was negligible (I2 = 0%, τ2 = 0.00; χ2 = 2.55, df = 4; p = 0.64), indicating consistent direction of effect despite variability in precision. Individual study estimates showed variability in magnitude, with three studies (Huhtala et al., 2018; 2020; Tertti et al., 2013) consistently favoring the intervention, while others were imprecise due to small sample sizes and low event rates, as reflected by wide confidence intervals (e.g., Jin et al., 2022). Given the limited number of studies and events, this outcome remains underpowered, and the observed effect should be interpreted as exploratory and hypothesis-generating rather than confirmatory. Further adequately powered trials are required to establish any potential effect.
-
Gestational age at delivery
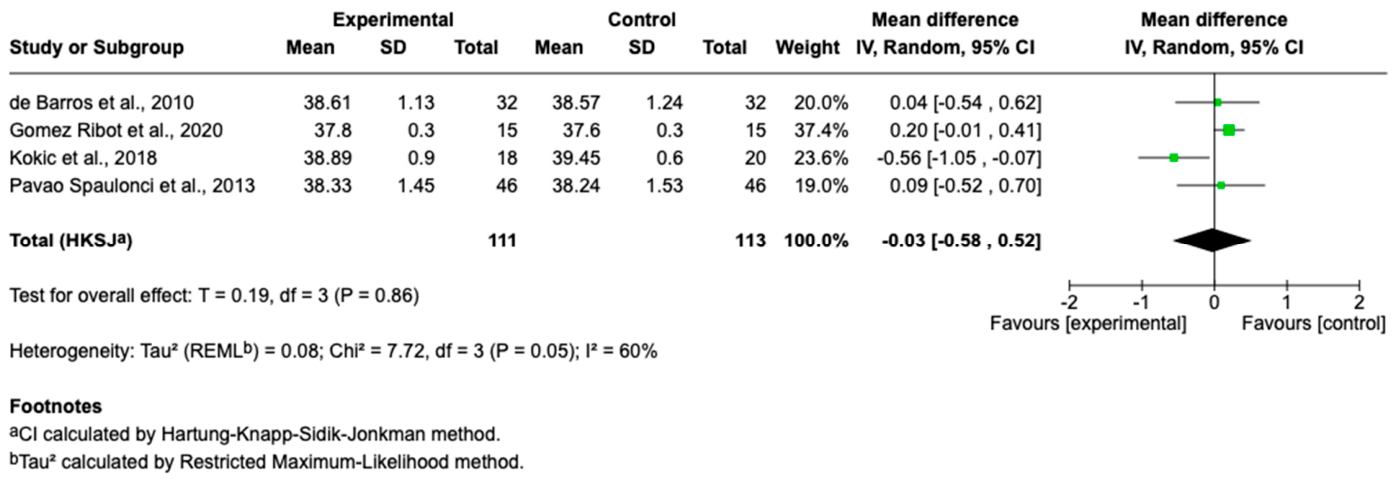
A meta-analysis of four randomized controlled trials encompassing 224 participants (111 experimental; 113 control) evaluated the impact of the intervention on gestational age at delivery (measured in weeks), yielding a pooled mean difference of −0.03 weeks (95% CI: −0.58 to 0.52; p = 0.86) via a random-effects model (Figure 12). Three of the four studies showed mean differences close to zero or with confidence intervals spanning zero, while only Kokic et al. (2018) indicated a statistically significant reduction in gestational age for the intervention group (mean difference = −0.56 weeks, 95% CI: −1.05 to −0.07), though this finding was not sufficient to influence the pooled estimate. The overall effect was not statistically significant, and the confidence interval comfortably included the null, indicating no evidence of a clinically meaningful difference in gestational age at delivery between groups. Heterogeneity was moderate to high (I2 = 60%, χ2 = 7.72, df = 3; p = 0.05; τ2 = 0.08), reflecting variability in individual study results and implying possible differences in population characteristics, intervention implementation, or study design. In summary, the intervention did not significantly affect gestational age at delivery, with no consistent trend observed across included studies and moderate inter-study heterogeneity present.
  • Neonatal outcomes
-
Neonatal hypoglycemia
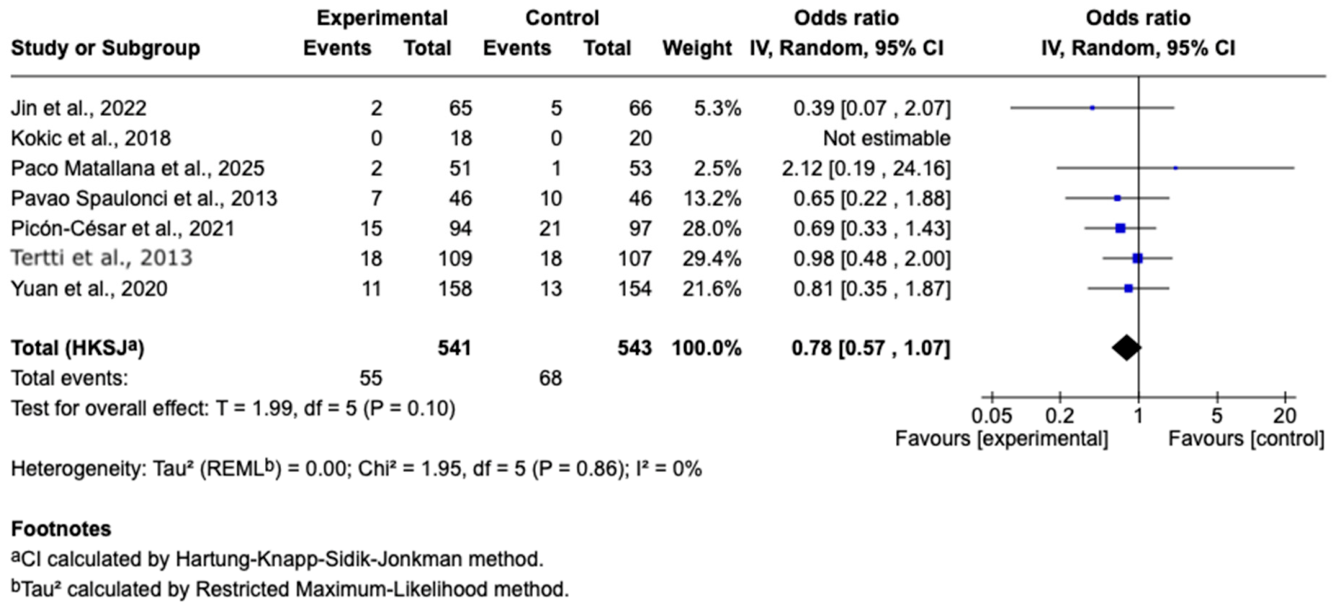
A meta-analysis of six randomized controlled trials encompassing 1084 neonates (541 experimental; 543 control) investigated the intervention’s effect on neonatal hypoglycemia incidence (Figure 13), yielding a pooled odds ratio of 0.78 (95% CI: 0.57–1.07; p = 0.10) using a random-effects model. The pooled estimate nominally favors the experimental intervention with a 22% reduction in odds of neonatal hypoglycemia; however, the result did not achieve statistical significance as the 95% confidence interval crosses the null value (OR = 1.0), precluding definitive efficacy conclusions. Heterogeneity across studies was absent (I2 = 0%, τ2 = 0.00; χ2 = 1.95, df = 5; p = 0.86), demonstrating remarkable consistency in treatment effects and supporting the robustness of the pooled estimate. Individual study estimates varied substantially: Picón-César et al. (2021) received the greatest weight (28.0%) and showed a protective effect (OR = 0.69; 95% CI: 0.33–1.43); Tertti et al. (2013) and Yuan et al. (2020) were weighted at 29.4% and 21.6%, respectively, with ORs close to unity (0.98 and 0.81); Pavao Spaulonci et al. (2013) demonstrated a protective trend (OR = 0.65; 95% CI: 0.22–1.88) at 13.2% weight; Jin et al. (2022) showed a numerically increased odds (OR = 0.39; 95% CI: 0.07–2.07) with minimal weight (5.3%); and Paco Matallana et al. (2025) yielded an increased odds estimate (OR = 2.12; 95% CI: 0.19–24.16) with 2.5% weight, reflecting minimal sample size and substantial uncertainty. Notably, Kokic et al. (2018) reported zero events in both groups, rendering the odds ratio non-estimable and precluding its inclusion in the pooled analysis. The non-significant p-value (0.10) combined with zero heterogeneity and the marginal confidence interval boundary suggests the intervention approaches statistical significance in protecting against neonatal hypoglycemia, warranting further adequately powered trials to clarify the clinical relevance of this potential protective effect.
-
Neonatal complications
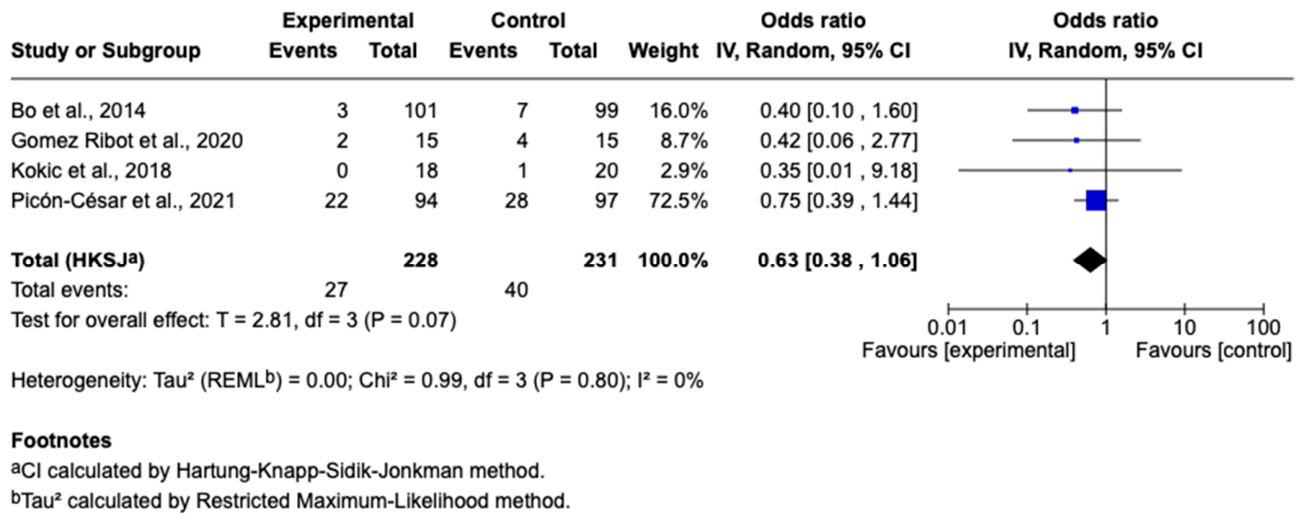
A meta-analysis of four randomized controlled trials encompassing 459 neonates (228 experimental; 231 control) evaluated the intervention’s effect on neonatal complications, yielding a pooled odds ratio of 0.63 (95% CI: 0.38–1.06; p = 0.07) using a random-effects model. The summary estimate nominally demonstrates a 37% reduction in odds of neonatal complications favoring the experimental intervention; however, the result approached but did not achieve statistical significance as the 95% confidence interval crosses the null value (OR = 1.0), indicating insufficient evidence for definitive clinical conclusions (Figure 14). Heterogeneity across studies was entirely absent (I2 = 0%, τ2 = 0.00; χ2 = 0.99, df = 3; p = 0.80), reflecting remarkable consistency in treatment effects across the included trials and supporting the stability of the pooled estimate. Individual study estimates demonstrated substantial heterogeneity in point estimates: Picón-César et al. (2021) dominated the meta-analysis with 72.5% weight and showed a modest protective effect (OR = 0.75; 95% CI: 0.39–1.44); Bo et al. (2014) contributed 16.0% weight with a protective estimate (OR = 0.40; 95% CI: 0.10–1.60); Gomez Ribot et al. (2020) was weighted at 8.7% with a protective trend (OR = 0.42; 95% CI: 0.06–2.77); and Kokic et al. (2018) received minimal weight (2.9%) while reporting zero events in the experimental group (OR = 0.35; 95% CI: 0.01–9.18). The marginal p-value (0.07) combined with zero heterogeneity and the confidence interval’s asymmetrical approach to the null value suggests the intervention approaches statistical significance in reducing neonatal complications, warranting further adequately powered investigation to establish the clinical relevance of this potential protective effect.
-
Neonatal birth weight
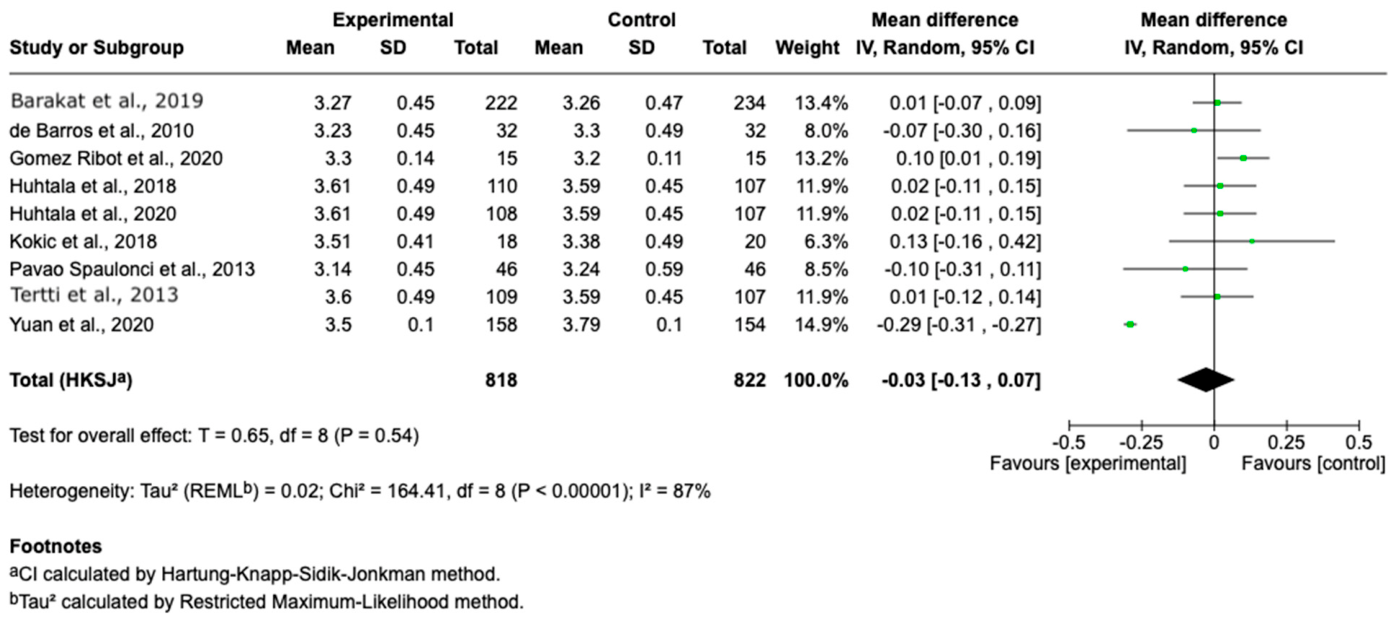
A meta-analysis of nine randomized controlled trials (Figure 15) encompassing 1640 neonates (818 experimental; 822 control) investigated the intervention’s effect on neonatal birth weight, yielding a pooled mean difference of −0.03 kg (95% CI: −0.13 to 0.07; p = 0.54) using a random-effects model. The summary estimate indicates no clinically meaningful difference in birth weight between the experimental and control groups, with the 95% confidence interval comfortably encompassing the null value and suggesting that the intervention does not systematically alter neonatal birth weight. Substantial heterogeneity was evident across studies (I2 = 87%, τ2 = 0.02; χ2 = 164.41, df = 8; p < 0.00001), indicating marked variability in individual study effects that likely reflects differences in population characteristics, intervention protocols, or measurement methodologies. Individual study estimates varied considerably: Yuan et al. (2020) demonstrated the largest protective effect with a mean difference of −0.29 kg (95% CI: −0.31 to −0.27) and received 14.9% weight; Kokic et al. (2018) showed an increase of 0.13 kg (95% CI: −0.16 to 0.42); Pavao Spaulonci et al. (2013) reported a slight reduction of −0.10 kg (95% CI: −0.31 to 0.11); de Barros et al. (2010) showed a non-significant reduction of −0.07 kg (95% CI: −0.30 to 0.16); while most other studies including Barakat et al. (2019), Gomez Ribot et al. (2020), and both Huhtala et al. studies (2018, 2020) reported minimal differences near zero. The high I2 of 87% and highly significant heterogeneity test (p < 0.00001) underscore substantial between-study variation that substantially exceeds sampling error, warranting cautious interpretation of the pooled estimate and suggesting that birth weight outcomes may be influenced by study-specific contextual factors not accounted for in this analysis.
-
Macrosomia
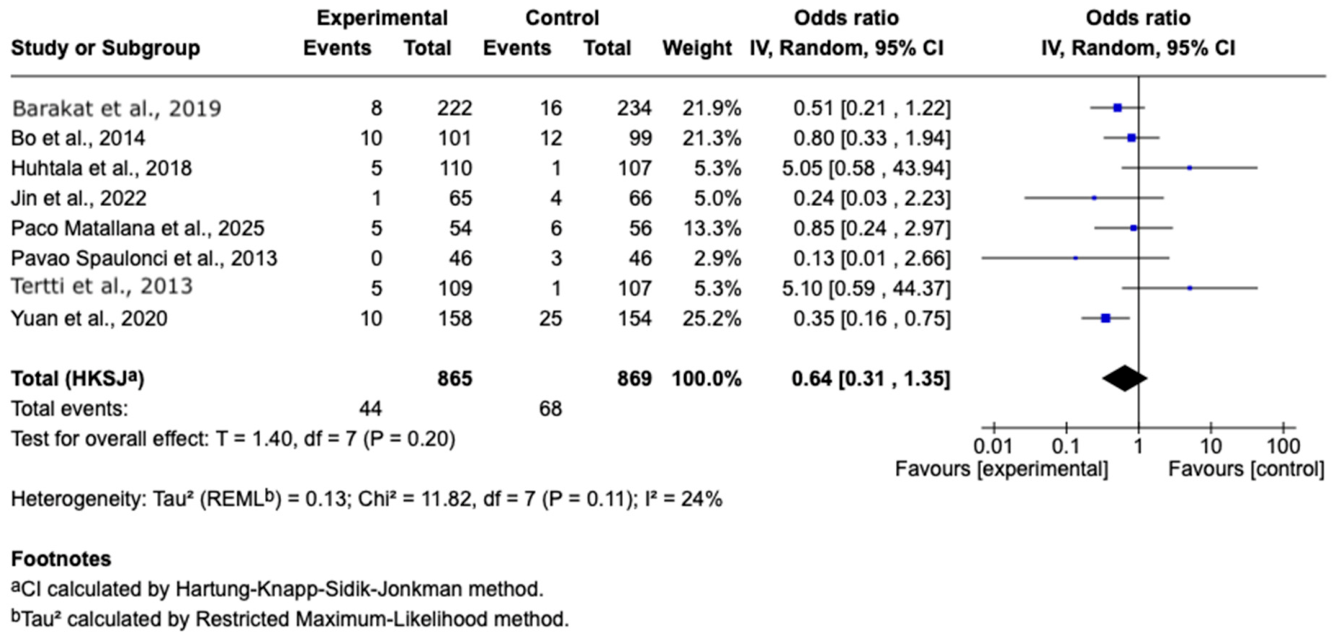
A meta-analysis of eight randomized controlled trials encompassing 1734 neonates (865 experimental; 869 control) evaluated the intervention’s effect on macrosomia incidence, yielding a pooled odds ratio of 0.64 (95% CI: 0.31–1.35; p = 0.20) using a random-effects model. The summary estimate nominally demonstrates a 36% reduction in odds of macrosomia favoring the experimental intervention; however, the result did not achieve statistical significance as the 95% confidence interval crosses the null value (OR = 1.0), indicating insufficient evidence to conclusively establish a protective intervention effect (Figure 16). Heterogeneity across studies was low to moderate (I2 = 24%, τ2 = 0.13; χ2 = 11.82, df = 7; p = 0.11), reflecting modest between-study variability that does not substantially compromise the reliability of the pooled estimate. Individual study estimates demonstrated considerable heterogeneity in point estimates: Yuan et al. (2020) received the greatest weight (25.2%) and showed a protective effect (OR = 0.35; 95% CI: 0.16–0.75); Barakat et al. (2019) and Bo et al. (2014) contributed similar weights (21.9% and 21.3%, respectively) with protective trends (OR = 0.51 and 0.80, respectively); Paco Matallana et al. (2025) was weighted at 13.3% with a near-null estimate (OR = 0.85; 95% CI: 0.24–2.97); Huhtala et al. (2018) and Tertti et al. (2013) demonstrated stronger protective estimates (OR = 5.05 and 5.10, respectively) but with minimal weights (5.3% each) and extreme confidence intervals reflecting profound uncertainty; Jin et al. (2022) showed a protective effect (OR = 0.24; 95% CI: 0.03–2.23) at 5.0% weight; and Pavao Spaulonci et al. (2013) yielded the strongest protective estimate (OR = 0.13; 95% CI: 0.01–2.66) with minimal weight (2.9%). The non-significant p-value (0.20), low to moderate heterogeneity (I2 = 24%), and wide confidence interval encompassing the null value suggest the intervention approaches but does not achieve a statistically significant protective effect against macrosomia, warranting additional large-scale trials to clarify its potential clinical utility.
-
Preterm Birth
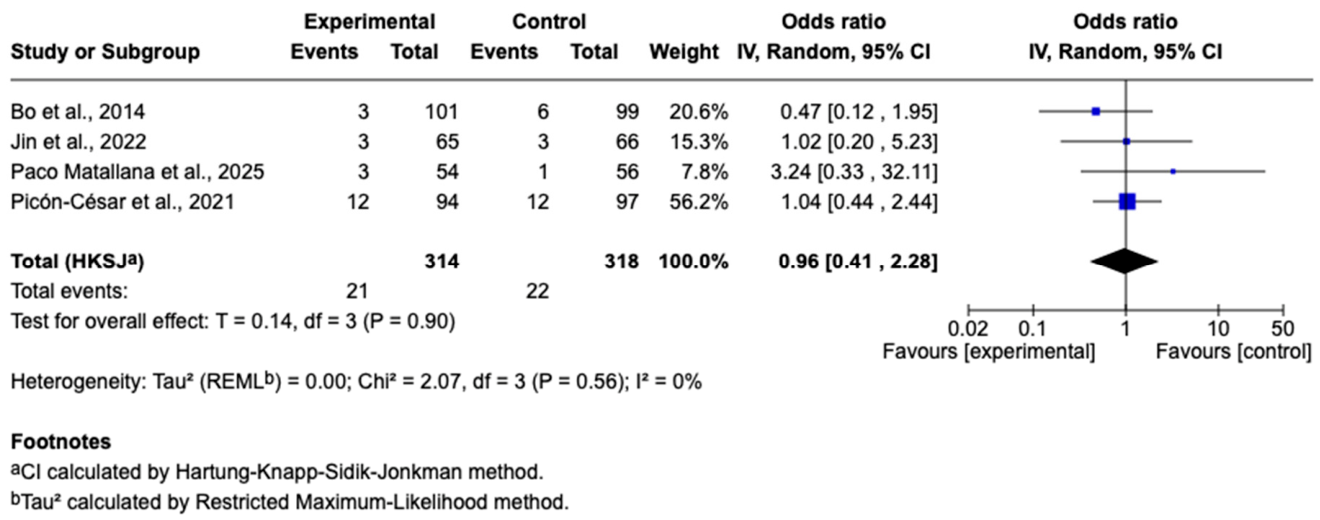
A meta-analysis of four randomized controlled trials encompassing 632 neonates (314 experimental; 318 control) evaluated the intervention’s effect on preterm birth incidence, yielding a pooled odds ratio of 0.96 (95% CI: 0.41–2.28; p = 0.90) using a random-effects model. The summary estimate indicates no significant difference in the odds of preterm birth between the experimental and control groups, with the 95% confidence interval substantially spanning the null value and demonstrating no evidence for a protective or harmful intervention effect. Heterogeneity across studies was completely absent (I2 = 0%, τ2 = 0.00; χ2 = 2.07, df = 3; p = 0.56), indicating remarkable consistency in treatment effects and validating the application of the random-effects model. Individual study estimates demonstrated variability in point estimates, though all confidence intervals widely crossed unity: Picón-César et al. (2021) received the greatest weight (56.2%) and reported an OR of 1.04 (95% CI: 0.44–2.44); Bo et al. (2014) contributed 20.6% weight with an OR of 0.47 (95% CI: 0.12–1.95), suggesting a potential protective effect; Jin et al. (2022) was weighted at 15.3% with an OR of 1.02 (95% CI: 0.20–5.23), indicating neutrality; and Paco Matallana et al. (2025) received minimal weight (7.8%) while showing a numerically increased odds (OR = 3.24; 95% CI: 0.33–32.11), reflecting small sample size and substantial uncertainty (Figure 17). The non-significant p-value (0.90) combined with zero heterogeneity and the wide confidence interval encompassing the null value provides robust evidence that the intervention does not meaningfully influence preterm birth rates, and further investigation is unlikely to reveal a clinically relevant effect.
-
Apgar score at 5 min
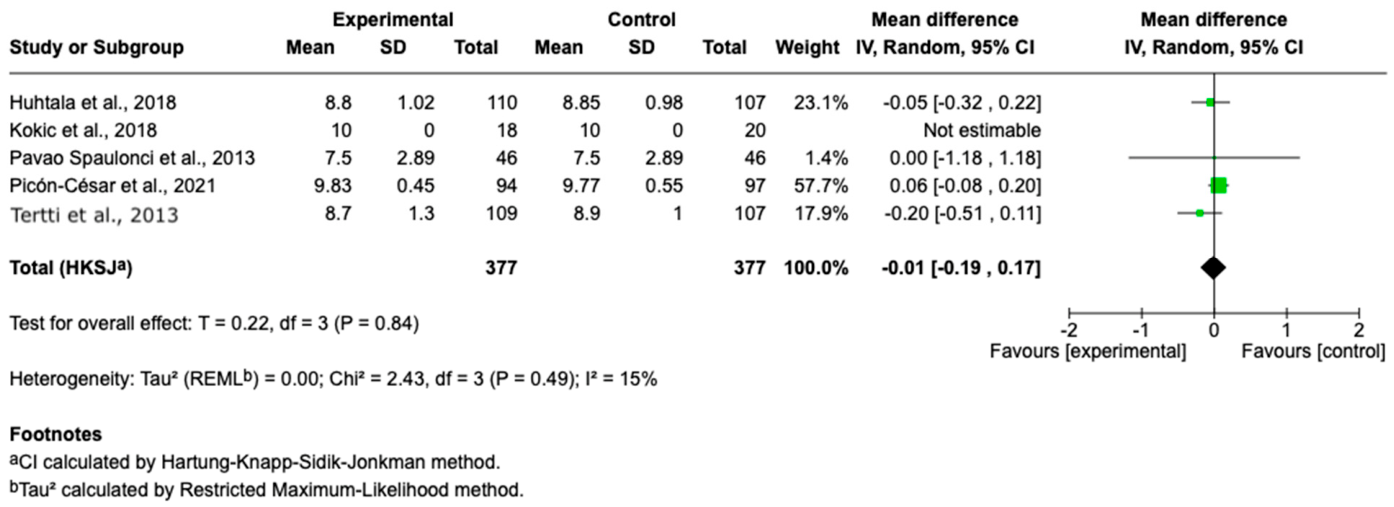
A meta-analysis of four randomized controlled trials encompassing 754 neonates (377 experimental; 377 control) investigated the intervention’s effect on neonatal Apgar score at 5 min, yielding a pooled mean difference of −0.01 (95% CI: −0.19 to 0.17; p = 0.84) using a random-effects model (Figure 18). The summary estimate indicates no clinically meaningful or statistically significant difference in 5 min Apgar scores between the experimental and control groups, with the 95% confidence interval comprehensively spanning the null value and demonstrating no intervention effect on neonatal immediate post-natal status. Heterogeneity across studies was minimal (I2 = 15%, τ2 = 0.00; χ2 = 2.43, df = 3; p = 0.49), indicating low between-study variability and supporting the stability of the pooled estimate. Individual study estimates demonstrated consistency near the null: Picón-César et al. (2021) received the dominant weight (57.7%) and reported a minimal positive mean difference of 0.06 (95% CI: −0.08 to 0.20); Huhtala et al. (2018) contributed 23.1% weight with a small negative difference of −0.05 (95% CI: −0.32 to 0.22); Tertti et al. (2013) was weighted at 17.9% and showed a modest protective trend of −0.20 (95% CI: −0.51 to 0.11); Pavao Spaulonci et al. (2013) received minimal weight (1.4%) with a mean difference of 0.00 (95% CI: −1.18 to 1.18); and Kokic et al. (2018) reported zero standard deviations in both arms, rendering the mean difference non-estimable and excluding this study from the pooled analysis. The non-significant p-value (0.84), minimal heterogeneity (I2 = 15%), and narrow confidence interval encompassing zero provide robust evidence that the intervention does not influence neonatal Apgar scoring and has no demonstrable effect on immediate neonatal status assessment.
-
Admission to NICU
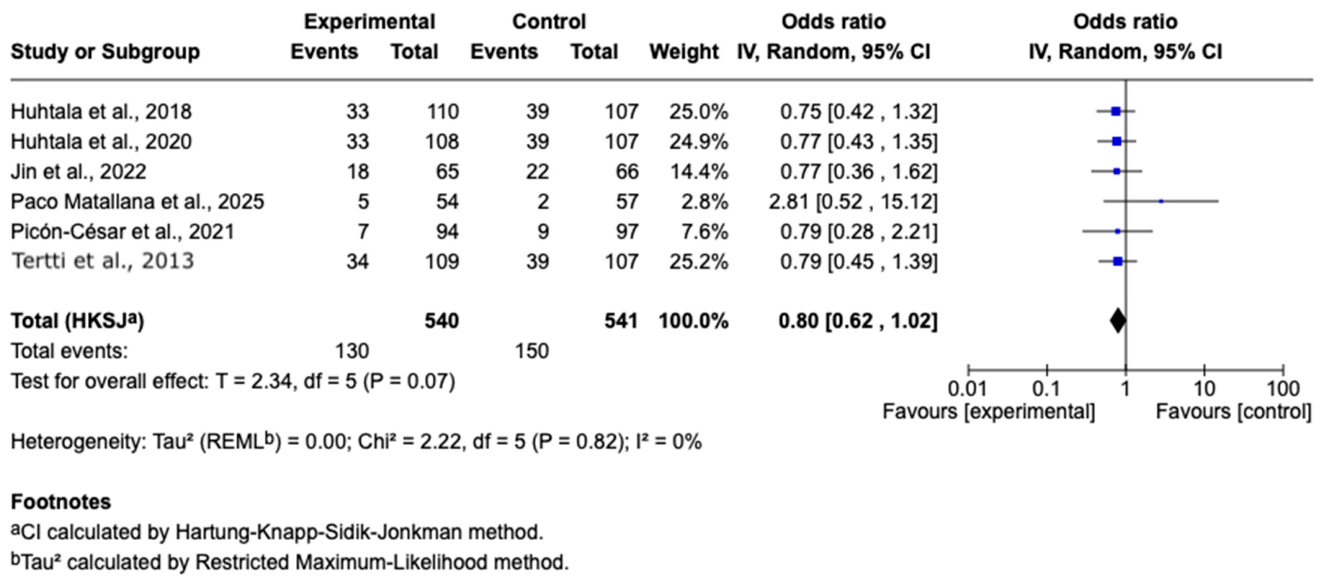
A meta-analysis of six randomized controlled trials encompassing 1081 neonates (540 experimental; 541 control) investigated the intervention’s effect on neonatal intensive care unit (NICU) admission rates, yielding a pooled odds ratio of 0.80 (95% CI: 0.62–1.02; p = 0.07) using a random-effects model (Figure 19). The summary estimate nominally demonstrates a 20% reduction in odds of NICU admission favoring the experimental intervention; however, the result approached but did not achieve statistical significance as the 95% confidence interval narrowly crosses the null value (OR = 1.0) at its upper bound, indicating marginal evidence for a protective intervention effect. Heterogeneity across studies was completely absent (I2 = 0%, τ2 = 0.00; χ2 = 2.22, df = 5; p = 0.82), indicating remarkable consistency in treatment effects and supporting the robustness and stability of the pooled estimate. Individual study estimates were remarkably homogeneous with all confidence intervals narrowly spanning or positioned near unity: Huhtala et al. (2018, 2020) contributed the greatest combined weight (49.9%) and demonstrated nearly identical protective effects (OR = 0.75 and 0.77, respectively); Tertti et al. (2013) was weighted at 25.2% with an OR of 0.79 (95% CI: 0.45–1.39); Jin et al. (2022) contributed 14.4% weight with an OR of 0.77 (95% CI: 0.36–1.62); Picón-César et al. (2021) was weighted at 7.6% with a near-null estimate (OR = 0.79; 95% CI: 0.28–2.21); and Paco Matallana et al. (2025) received minimal weight (2.8%) while showing a numerically increased odds (OR = 2.81; 95% CI: 0.52–15.12), reflecting small sample size and substantial uncertainty. The marginal p-value (0.07), zero heterogeneity (I2 = 0%), and narrow confidence interval asymmetrically approaching the null suggest the intervention approaches statistical significance in reducing NICU admission rates, warranting adequately powered trials to determine whether a true protective effect exists.

3.2. Overall Results

In Table 3, we summarized the effectiveness of several treatment trials on different outcomes, according to our meta-analysis results. As seen in this table, the comparative analysis of interventions reveals that drug-lowering agents had a significant effect only on weight gain, while showing no significant impact on other metabolic outcomes including HbA1c, triglycerides, cholesterol, 2 h postprandial glucose, fasting glucose, and blood pressure. In contrast, non-pharmacological interventions demonstrated a significant reduction in 2 h postprandial glucose and a trend toward improvement in blood pressure, though they did not produce significant changes in the remaining outcomes. Overall, lifestyle-based strategies appear to have selective benefits, particularly in postprandial glycemic control.

4. Discussion

This meta-analysis explored how different interventions influence major clinical outcomes in gestational diabetes mellitus (GDM), including 2 h postprandial glucose, fasting blood glucose (FBG), HbA1c, triglyceride levels, weight gain, and blood pressure. The overall results show a mixed picture, with some treatments showing potential benefits and others yielding minimal or inconsistent effects.
To provide a comprehensive view of the available evidence, the meta-analysis intentionally encompassed studies with different designs (randomized trials, controlled clinical trials, and cohort studies). This broader inclusion was prespecified in the Methods (Eligibility Criteria) and paired with design-appropriate risk-of-bias tools. Anticipating heterogeneity across interventions, populations, and outcome definitions, we used a random-effects model and conducted prespecified sensitivity analyses (including exclusion of high risk-of-bias studies), which indicated that the principal estimates were robust to analytic choices. While this inclusive approach enhances external validity and reflects real-world practice, it also tempers the strength of causal inference relative to a synthesis limited strictly to randomized trials, and this consideration should frame the interpretation of effect sizes reported here.
For pharmacologic treatment, our analysis found that metformin is largely comparable to insulin in achieving glycemic control for gestational diabetes mellitus (GDM). Notably, women on metformin tend to gain less gestational weight than those on insulin (approximately 1 kg less, on average), an outcome also reported in other meta-analyses [29]. Reduced weight gain with metformin may reflect the drug’s lower propensity for inducing anabolic effects compared to insulin therapy [29]. It should be emphasized that the apparent benefits of metformin in our analysis might be attenuated by the active comparator: since insulin is an effective therapy, the advantages of metformin can seem modest when directly compared to insulin-treated patients. For instance, any improvement in glycemic control with metformin is, by nature, measured against an insulin-managed group that already achieves near-optimal glucose levels, narrowing the detectable differences. This context underscores that metformin is a safe and effective alternative to insulin for many GDM patients, especially those with milder hyperglycemia [30], but it is not a superior treatment in terms of immediate pregnancy outcomes. Rather, its chief advantages lie in patient convenience, lower cost, and potential ancillary benefits like less maternal weight gain and a lower incidence of hypertensive complications [29,30]. Future trials with long-term follow-up are still needed to fully assess if metformin confers any postpartum or childhood metabolic benefits over insulin.
Lifestyle modification remains the first-line therapy for GDM, and our findings support its value. A variety of structured exercise programs and dietary counseling interventions were included in the meta-analysis, and collectively these lifestyle interventions showed improvements in maternal glycemic control and some pregnancy outcomes, although the results were variable across studies. Several trials have demonstrated that moderate-intensity exercise (e.g., brisk walking or supervised aerobic sessions) can significantly lower fasting and postprandial glucose levels in women with GDM [7]. In our analysis, interventions incorporating exercise were associated with modest reductions in maternal triglyceride levels, echoing the 2 × 2 factorial trial by Bo et al. (2014) in which a simple daily walking regimen reduced postprandial glucose, HbA1c, and triglycerides compared to standard care. However, when pooling trials, the overall effect on triglycerides did not reach statistical significance, likely due to heterogeneity—some exercise interventions showed marked benefits while others had minimal impact. Notably, one small pilot study of structured exercise reported significant drops in LDL cholesterol but no change in triglycerides [14], whereas another study found that exercise prevented the typical rise in late-pregnancy triglycerides seen in GDM [17]. Despite these inconsistencies, the trend favors exercise improving the metabolic profile. Furthermore, combining diet and exercise counseling can help to reduce the need for insulin therapy in GDM. For example, low-glycemic index diets paired with regular physical activity have been shown to decrease the proportion of women who require insulin for blood sugar control [31]. In fact, one randomized trial found that a low-GI diet led to significantly fewer women needing insulin compared to a higher-GI diet [31], underscoring how diet quality can attenuate GDM severity. Our meta-analysis similarly noted that lifestyle intervention groups often had lower rates of medication escalation, though not all studies reported this outcome. While our aggregated results on neonatal outcomes were limited, the overall evidence suggests that implementing exercise routines and nutritional guidance during GDM not only aids in immediate glycemic management but can also mitigate some risks (such as excessive fetal growth) associated with gestational diabetes. Nevertheless, the magnitude of benefit varies among studies, likely reflecting differences in intervention intensity, participant compliance, and baseline population characteristics. Lifestyle interventions ranged from brief educational sessions to comprehensive programs with frequent coaching, which led to inconsistent results when pooled. This variability highlights the need for more standardized and high-quality trials to identify the most effective lifestyle strategies for GDM management.
Beyond general calorie and carbohydrate control, specific dietary interventions have shown promise in GDM management. In particular, diets enriched with healthy unsaturated fats—such as extra-virgin olive oil (EVOO) or omega-3 fatty acids from flaxseed oil—were evaluated in some of the included studies. Our subgroup analysis suggests these nutritional additions can positively influence maternal metabolic outcomes. For example, one study of an EVOO-enriched diet in women with GDM reported significantly lower triglyceride concentrations at term in the intervention group, effectively preventing the hypertriglyceridemia typically observed in late gestation [17]. Although such a dramatic reduction was not uniformly seen across all trials, the direction of effect favors unsaturated fat inclusion mitigating lipid spikes. Similarly, supplementation with flaxseed oil (rich in n-3 alpha-linolenic acid) was associated with better glycemic control and lipid profile in GDM patients. Jamilian et al. (2020) conducted a placebo-controlled trial where 6 weeks of flaxseed oil capsules led to significant reductions in fasting glucose and insulin levels, improved insulin sensitivity, and lower triglycerides compared to placebo. We incorporated these findings, noting that women receiving omega-3 supplements had improved insulin resistance measures and a more favorable cholesterol profile than those on standard diets [19]. Such outcomes suggest that modifying the quality of fats in the diet (not just the quantity of carbohydrates) can be beneficial for metabolic control in GDM. Taken together, the evidence—albeit from relatively small trials—indicates that targeted dietary modifications (like adding EVOO or flaxseed oil or adopting a low-GI diet) can complement standard GDM care. These interventions are practical in that they leverage commonly available foods to improve maternal nutrition and potentially reduce GDM complications. However, the generalizability of such findings is limited by study design diversity. For instance, the EVOO study in our analysis was not blinded and was set in a specific cultural diet context, and the flaxseed trial had a short duration and focused on biochemical endpoints. Therefore, while encouraging, these results should be confirmed in larger, multi-ethnic populations and with attention to clinical outcomes (e.g., incidence of preeclampsia or neonatal morbidity) before firm dietary recommendations can be made beyond existing guidelines.

5. Limitations and Future Directions

This meta-analysis has several important limitations that temper our conclusions.
First, many of the included studies were small randomized controlled trials or pilot studies, some with sample sizes below 50 participants, raising concerns regarding statistical power and reliability. In addition, the interventions evaluated were highly heterogeneous, encompassing pharmacological treatments, structured exercise programs, combined diet-and-exercise regimens, and specific nutritional supplementation strategies, while the comparator “standard care” also varied across studies. This clinical and methodological diversity contributed to the substantial heterogeneity observed in our pooled analyses (I2 often >90% for key outcomes), thereby limiting the interpretability and generalizability of the findings.
This heterogeneity is likely multifactorial and reflects variations in intervention type, duration, intensity, and timing during pregnancy, as well as differences in baseline patient characteristics, including gestational age at diagnosis and severity of glycemic impairment. Furthermore, inconsistencies in outcome definitions, measurement methods, and follow-up timepoints may have further amplified between-study variability. To evaluate the robustness of our results, we conducted sensitivity analyses, including leave-one-out analyses and the exclusion of studies with disproportionate influence; however, these approaches did not materially reduce heterogeneity, suggesting that it is inherent to the underlying study differences rather than driven by individual outliers. Subgroup analyses based on intervention type (pharmacological versus lifestyle-based) were also performed to explore potential sources of heterogeneity, although variability remained substantial. In this way, we found that outcomes could differ markedly by intervention type; for example, the beneficial effect on triglycerides was observable in lifestyle and diet intervention subsets but was counteracted by a paradoxical rise in the metformin vs. insulin subset (where the metformin group had higher triglycerides than insulin-treated controls, likely due to insulin’s lipid-lowering influence). This divergence underscores that combining dissimilar interventions under a single meta-analysis outcome can dilute meaningful effects. Duration of intervention was another limitation—most trials only followed women from GDM diagnosis (often around 24–28 weeks) until delivery. These relatively short intervention periods (commonly 6–10 weeks) may not capture the full benefits or drawbacks of the therapy. Longer-term effects on maternal health (e.g., weight retention, progression to type 2 diabetes) or on the offspring (e.g., neonatal adiposity, childhood metabolic health) were beyond the scope of most studies and, thus, our review. Additionally, the methodological quality of trials varied: some were open-label (especially in comparisons like metformin vs. insulin or exercise vs. usual care, where blinding is difficult), and some lacked rigorous outcome assessment or had incomplete follow-up. A few trials—as noted in their publications—were pilots that did not primarily evaluate clinical endpoints [14] or had design issues such as not adjusting for baseline differences. All these factors introduce potential bias and limit the confidence in pooled estimates. We graded the evidence accordingly and refrain from strong causal claims where the certainty is low.
In light of these limitations, there are clear research gaps and practical implications and the results for highly heterogeneous outcomes should be interpreted with caution and considered primarily hypothesis-generating rather than definitive. On the clinical side, our findings support the current practice of starting with lifestyle management for GDM and reserving pharmacotherapy for when glucose targets are not met. The comparable efficacy of metformin and insulin provides reassurance that metformin can be used as a first-line pharmacological agent (except when contraindicated), which is practical for patients and providers [32]. However, careful patient selection is important: women with more severe hyperglycemia or those nearing term might still require insulin for tight control, and the slight increase in prematurity with metformin calls for vigilance. From a lifestyle perspective, encouraging regular physical activity and a balanced diet should remain a cornerstone of GDM therapy. Clinicians can take away that even moderate exercise programs have measurable benefits and appear safe in GDM, potentially reducing the need for insulin and improving maternal fitness. Yet, implementing structured exercise in pregnancy can be challenging—it requires patient motivation, time, and in some cases supervision—so identifying optimal, feasible programs is a priority for research. Future studies should also address diet composition more deeply; for instance, could incorporating specific healthy fats or increasing fiber further improve outcomes? The promising results with EVOO and flaxseed oil warrant larger trials to determine if these nutritional tweaks translate into fewer obstetric complications or improved neonatal health. Moreover, standardized outcomes in trials (e.g., using the same definitions for “adverse neonatal outcome” or tracking the percentage of women needing medication) would greatly enhance our ability to compare studies and inform guidelines. We also lack data on patient-centered outcomes like quality of life, treatment satisfaction (aside from isolated findings that women prefer oral therapy), and cost-effectiveness of these interventions. Addressing these gaps will require well-designed RCTs that are adequately powered and ideally multi-center, reflecting the diverse populations affected by GDM.

6. Conclusions

In summary, this comprehensive review reinforces that multifaceted management—combining nutritional optimization, physical activity, and judicious pharmacotherapy—is effective for GDM and can improve maternal–fetal outcomes. Each modality offers unique advantages: metformin provides a convenient alternative to insulin for glycemic control, exercise and diet help to tackle the root causes of dysglycemia and excessive weight gain, and specific dietary enhancements might further fine-tune metabolic health. The findings are in line with PRISMA guidelines in highlighting not only what works, but also the uncertainty where evidence is limited. For practitioners, the practical message is to continue emphasizing lifestyle interventions as the foundation of GDM treatment, use metformin as an effective tool (while recognizing its limitations against a strong comparator), and stay attuned to emerging research on dietary supplements or programs that could refine GDM care. For researchers and guideline developers, there is a need for consensus on standard outcomes and more robust data to fill the current gaps—particularly long-term effects and the ideal structure of lifestyle programs. By addressing these needs, future studies are expected to help in further clarifying the optimal approach to managing gestational diabetes, ultimately benefitting both mothers and their children in the short and long term.

Supplementary Materials

The following supporting information can be downloaded at: https://www.mdpi.com/article/10.3390/diabetology7060103/s1, File S1: Prisma 2020 Checklist. Figure S1: Forest plot depicting changes in fasting blood glucose following drug-lowering agents or non-drug interventions in GDM. No significant pooled effect was observed across all interventions. Notable heterogeneity (I2 = 100%) suggests variation in intervention efficacy. Figure S2: Forest plot comparing the effect of drug-lowering agents versus other interventions on 2 h postprandial glucose levels in gestational diabetes mellitus (GDM). Data are stratified by intervention type. Results favor interventions that significantly lower postprandial glucose, particularly among non-pharmacologic strategies. Heterogeneity was high (I2 = 89.7%). Figure S3: Impact of lifestyle and pharmacological interventions on glycated hemoglobin (HbA1c) in women with GDM. Slight reductions in HbA1c were observed among non-drug interventions. Subgroup analysis showed moderate between-study heterogeneity (I2 = 12.1%). Figure S4: Forest plot of hypertensive complications in GDM patients across intervention types. No statistically significant differences were found between drug-based and non-drug interventions. Moderate heterogeneity (I2 = 61%) was observed. Figure S5: Forest plot assessing gestational weight gain under different intervention categories. Drug-based interventions significantly reduced weight gain. Non-drug interventions showed more variable effects. Heterogeneity was substantial (I2 = 98%). Figure S6: Subgroup comparison of triglyceride outcomes following drug and lifestyle interventions. A significant increase was observed with one pharmacologic agent, whereas non-drug interventions showed substantial triglyceride reductions. Heterogeneity across subgroups was high (I2 = 100%). Figure S7: Effect of non-pharmacological interventions on total cholesterol in GDM patients. No data was available from drug-based trials. Pooled results were not statistically significant, and subgroup heterogeneity remained high (I2 = 100%).

Author Contributions

Conceptualization, N.N. and F.H.; methodology, A.I., S.C., C.S., T.Y., T.M., R.B. and F.H.; software, A.I., S.C., C.S., T.Y., T.M., R.B. and F.H.; validation, A.I., S.C., C.S., T.Y., T.M., R.B., N.N. and F.H.; formal analysis, A.I., S.C., C.S., T.Y., T.M. and R.B.; investigation, A.I., S.C., C.S., T.Y., T.M. and R.B.; resources, A.I., S.C., C.S., T.Y., T.M. and R.B.; data curation, A.I., S.C., C.S., T.Y., T.M., R.B. and F.H.; writing—original draft preparation, A.I., S.C., C.S., T.Y., T.M. and R.B.; writing—review and editing, G.N., H.E.G., M.I., B.J., S.A., N.N. and F.H.; visualization, A.I., S.C., C.S., T.Y., T.M., R.B. and F.H.; supervision, S.A., N.N. and F.H.; project administration, S.A., N.N. and F.H. All authors have read and agreed to the published version of the manuscript.

Funding

This research received no external funding.

Institutional Review Board Statement

Not applicable.

Informed Consent Statement

Not applicable.

Data Availability Statement

Data is contained within the article or Supplementary Material.

Acknowledgments

We thank the Faculty of Medicine and Medical Sciences and the University of Balamand for their continued support and institutional backing of this work. The authors wish to acknowledge the equal and substantial contributions of Charbel Semaan, Tatiana Youness, Theresa Mazraani, and Rhiannon Boudeleh to the preparation of this manuscript.

Conflicts of Interest

The authors declare that they have no competing interests related to this work. No financial or personal relationships influenced the conduct, interpretation, or reporting of this study.

References

  1. Huhtala, M.S.; Tertti, K.; Pellonperä, O.; Rönnemaa, T. Amino Acid Profile in Women with Gestational Diabetes Mellitus Treated with Metformin or Insulin. Diabetes Res. Clin. Pract. 2018, 146, 118–125. [Google Scholar] [CrossRef] [Scilit]
  2. Roshanravan, N.; Tarighat-Esfanjani, A.; Mesri Alamdari, N.; Kheirouri, S.; Mousavi, R.; Alizadeh, M. The Effects of Zinc Supplementation on Inflammatory Parameters in Pregnant Women with Impaired Glucose Tolerance: A Randomized Placebo-Controlled Clinical Trial. Prog. Nutr. 2018, 20, 330–336. [Google Scholar] [CrossRef] [Scilit]
  3. Brown, J.; Alwan, N.A.; West, J.; Brown, S.; McKinlay, C.J.; Farrar, D.; Crowther, C.A. Lifestyle Interventions for the Treatment of Women with Gestational Diabetes. Cochrane Database Syst. Rev. 2017, 5, CD011970. [Google Scholar] [CrossRef] [Scilit] [PubMed]
  4. Dunne, F.; Newman, C.; Devane, D.; Smyth, A.; Alvarez-Iglesias, A.; Gillespie, P.; Browne, M.; O’Donnell, M. A Randomised Placebo-Controlled Trial of the Effectiveness of Early Met-Formin in Addition to Usual Care in the Reduction of Gestational Diabetes Mellitus Effects (EMERGE): Study Protocol. Trials 2022, 23, 795. [Google Scholar] [CrossRef] [Scilit]
  5. Nasiri Amiri, F.; Faramarzi, M.; Bakhtiari, A.; Omidvar, S. Risk Factors for Gestational Diabetes Mellitus: A Case-Control Study. Am. J. Lifestyle Med. 2018, 15, 184–190. [Google Scholar] [CrossRef] [Scilit] [PubMed]
  6. Mitanchez, D.; Yzydorczyk, C.; Simeoni, U. What Neonatal Complications Should the Pediatrician Be Aware of in Case of Maternal Gestational Diabetes? World J. Diabetes 2015, 6, 734–743. [Google Scholar] [CrossRef] [Scilit]
  7. Bo, S.; Rosato, R.; Ciccone, G.; Canil, S.; Gambino, R.; Poala, C.B.; Leone, F.; Valla, A.; Grassi, G.; Ghigo, E.; et al. Simple Lifestyle Recommendations and the Outcomes of Gestational Diabetes: A 2 × 2 Factorial Randomized Trial. Diabetes Obes. Metab. 2014, 16, 1032–1035. [Google Scholar] [CrossRef] [Scilit] [PubMed]
  8. Muche, A.A.; Olayemi, O.O.; Gete, Y.K. Effects of Gestational Diabetes Mellitus on Risk of Adverse Maternal Out-Comes: A Prospective Cohort Study in Northwest Ethiopia. BMC Pregnancy Childbirth 2020, 20, 73. [Google Scholar] [CrossRef] [Scilit]
  9. Johns, E.C.; Denison, F.C.; Norman, J.E.; Reynolds, R.M. Gestational Diabetes Mellitus: Mechanisms, Treatment, and Complications. Trends Endocrinol. Metab. 2018, 29, 743–754. [Google Scholar] [CrossRef] [Scilit]
  10. American Diabetes Association. Introduction and Methodology: Standards of Care in Diabetes—2026. Diabetes Care 2026, 49, S1–S5. [Google Scholar] [CrossRef] [Scilit]
  11. Blumer, I.; Hadar, E.; Hadden, D.R.; Jovanovič, L.; Mestman, J.H.; Murad, M.H.; Yogev, Y. Diabetes and Pregnancy: An Endocrine so-Ciety Clinical Practice Guideline. J. Clin. Endocrinol. Metab. 2013, 98, 4227–4249. [Google Scholar] [CrossRef] [Scilit]
  12. Committee on Practice Bulletins—Obstetrics. ACOG Practice Bulletin No. 190: Gestational Diabetes Mellitus. Obstet. Gynecol. 2018, 131, e49–e64. [Google Scholar] [CrossRef] [Scilit]
  13. Dugan, J.A.; Crawford, J.M. Managing Gestational Diabetes. JAAPA 2019, 32, 21–25. [Google Scholar] [CrossRef] [Scilit]
  14. Picón-César, M.J.; Molina-Vega, M.; Suárez-Arana, M.; González-Mesa, E.; Sola-Moyano, A.P.; Roldan-López, R.; Rome-ro-Narbona, F.; Olveira, G.; Tinahones, F.J.; González-Romero, S. Metformin for Gestational Diabetes Study: Met-Formin vs Insulin in Gestational Diabetes: Glycemic Control and Obstetrical and Perinatal Outcomes: Randomized Prospective Trial. Am. J. Obstet. Gynecol. 2021, 225, 517e1–517e17. [Google Scholar] [CrossRef] [Scilit]
  15. Gomez-Ribot, D.; Diaz, E.; Fazio, M.V.; Gómez, H.L.; Fornes, D.; Macchi, S.B.; Gresta, C.A.; Capobianco, E.; Jawerbaum, A. An Extra Virgin Olive Oil-Enriched Diet Improves Maternal, Placental and Cord Blood Parameters in GDM Pregnancies. Diabetes Metab. Res. Rev. 2020, 36, e3349. [Google Scholar] [CrossRef] [Scilit]
  16. Pavão Spaulonci, C.; Bernardes, L.S.; Trindade, T.C.; Zugaib, M.; Francisco, R.P. V Randomized Trial of Metfor-Min vs Insulin in the Management of Gestational Diabetes. Am. J. Obstet. Gynecol. 2013, 209, 34e1–34e7. [Google Scholar] [CrossRef] [Scilit]
  17. Jamilian, M.; Tabassi, Z.; Reiner, Ž.; Panahandeh, I.; Naderi, F.; Aghadavod, E.; Amirani, E.; Taghizadeh, M.; Shafabakhsh, R.; Satari, M.; et al. The Effects of N-3 Fatty Acids from Flaxseed Oil on Genetic and Metabolic Profiles in Patients with Gestational Diabetes Mellitus: A Randomized, Double-Blind, Placebo-Controlled Trial. Br. J. Nutr. 2020, 123, 792–799. [Google Scholar] [CrossRef] [Scilit] [PubMed]
  18. Jin, Y.; Chen, Z.; Li, J.; Zhang, W.; Feng, S. Effects of the Original Gymnastics for Pregnant Women Program on Gly-Cemic Control and Delivery Outcomes in Women with Gestational Diabetes Mellitus: A Randomized Controlled Trial. Int. J. Nurs. Stud. 2022, 127, 104271. [Google Scholar] [CrossRef] [Scilit]
  19. Yuan, K.; Wang, H.; Chen, Y.; Li, S.; Wang, Q.; Cao, Y.; Gao, S.; Xu, X.; Xie, Q. A 12-Hour Comprehensive Nutrition Care Benefits Blood Glucose Level and Weight Gain and Improves Outcomes in Pregnant Women with Gestational Diabetes Mellitus. Ann. Palliat. Med. 2020, 9, 1036–1045. [Google Scholar] [CrossRef] [Scilit]
  20. Huhtala, M.S.; Tertti, K.; Rönnemaa, T. Serum Lipids and Their Association with Birth Weight in Metformin and Insulin-Treated Patients with Gestational Diabetes. Diabetes Res. Clin. Pract. 2020, 170, 108456. [Google Scholar] [CrossRef] [Scilit]
  21. Tertti, K.; Ekblad, U.; Koskinen, P.; Vahlberg, T.; Rönnemaa, T. Metformin vs. Insulin in Gestational Diabetes: A Randomized Study Characterizing Metformin Patients Needing Additional Insulin. Diabetes Obes. Metab. 2013, 15, 246–251. [Google Scholar] [CrossRef] [Scilit]
  22. Qazi, W.A.; Babur, M.N.; Malik, A.N.; Bokhari, N.A.; Baig, M.S.; Begum, R. Effects of Structured Exercise Regime on Lipid Profile and Renal Function Tests in Gestational Diabetes Mellitus Patients: A Pilot Study. J. Pak. Med. Assoc. 2021, 71, 1320–1325. [Google Scholar] [CrossRef] [Scilit]
  23. de Barros, M.C.; Lopes, M.A.B.; Francisco, R.P.V.; Sapienza, A.D.; Zugaib, M. Resistance Exercise and Glycemic Control in Women with Gestational Diabetes Mellitus. Am. J. Obstet. Gynecol. 2010, 203, 556e1–556e6. [Google Scholar] [CrossRef] [Scilit] [PubMed]
  24. Youngwanichsetha, S.; Phumdoung, S.; Ingkathawornwong, T. The Effects of Mindfulness Eating and Yoga Exercise on Blood Sugar Levels of Pregnant Women with Gestational Diabetes Mellitus. Appl. Nurs. Res. 2014, 27, 227–230. [Google Scholar] [CrossRef] [Scilit] [PubMed]
  25. Sklempe Kokic, I.; Ivanisevic, M.; Biolo, G.; Simunic, B.; Kokic, T.; Pisot, R. Combination of a Structured Aerobic and Resistance Exercise Improves Glycaemic Control in Pregnant Women Diagnosed with Gestational Diabetes Mellitus: A Ran-Domised Controlled Trial. Women Birth 2018, 31, e232–e238. [Google Scholar] [CrossRef] [Scilit]
  26. Daniel, J.A.; Dikki, C.E. Aerobic Dance Exercise Improves Blood Glucose Level in Pregnant Women with Gestational Diabetes Mellitus. Afr. J. Phys. Health Educ. Recreat. Danc. 2014, 20, 273–281. [Google Scholar]
  27. Barakat, R.; Refoyo, I.; Coteron, J.; Franco, E. Exercise during Pregnancy Has a Preventative Effect on Excessive Maternal Weight Gain and Gestational Diabetes. A Randomized Controlled Trial. Braz. J. Phys. Ther. 2019, 23, 148–155. [Google Scholar] [CrossRef] [Scilit]
  28. de Paco Matallana, C.; Blanco-Carnero, J.E.; Calabuig, A.C.; Fernandez, M.; Lewanczyk, M.; Burton, M.; Yang, X.; Mitchell, A.L.; Lovgren-Sandblom, A.; Marschall, H.U.; et al. Randomized Controlled Trial of the Impact of Ursodeoxycholic Acid on Glycemia in Gestational Diabetes Mellitus: The GUARDS Trial. Am. J. Obstet. Gynecol. MFM 2025, 7, 101732. [Google Scholar] [CrossRef] [Scilit] [PubMed]
  29. Balsells, M.; García-Patterson, A.; Sola, I.; Roqué, M.; Gich, I.; Corcoy, R. Glibenclamide, Metformin, and Insulin for the Treatment of Gestational Diabetes: A Systematic Review and Meta-Analysis. BMJ 2015, 350, h102. [Google Scholar] [CrossRef] [Scilit]
  30. Gui, J.; Liu, Q.; Feng, L. Metformin vs Insulin in the Management of Gestational Diabetes: A Meta-Analysis. PLoS ONE 2013, 8, e64585. [Google Scholar] [CrossRef] [Scilit]
  31. Moses, R.G.; Luebcke, M.; Davis, W.S.; Coleman, K.J.; Tapsell, L.C.; Petocz, P.; Brand-Miller, J.C. Effect of a Low-Glycemic-Index Diet during Pregnancy on Outcomes in Gestational Diabetes Mellitus. Diabetes Care 2006, 32, 996–1000. [Google Scholar] [CrossRef] [Scilit] [PubMed]
  32. Rowan, J.A.; Hague, W.M.; Gao, W.; Battin, M.R.; Moore, M.P. Metformin versus Insulin for the Treatment of Gestational Diabetes. N. Engl. J. Med. 2008, 358, 2003–2015. [Google Scholar] [CrossRef] [Scilit] [PubMed]
Figure 3. Forest plot of the fasting blood glucose levels in patients with gestational diabetes compared between the experimental and the control group. The size of the green box indicates the study weight. The black diamond indicates the value for the total estimates [7,14,15,16,17,18,23,24,25,26].
Diabetology 07 00103 g003
Figure 4. Forest plot of the 2 h postprandial glucose levels in patients with gestational diabetes compared between the control or the placebo group. The size of the green box indicates the study weight. The black diamond indicates the value for the total estimates [7,14,18,19,24,25].
Diabetology 07 00103 g004
Figure 5. Forest plot of the HbA1c levels in patients with gestational diabetes compared between the control or the placebo group. The size of the green box indicates the study weight. The black diamond indicates the value for the total estimates [7,14,15,18,20].
Diabetology 07 00103 g005
Figure 6. Forest plot of weight gain in patients with gestational diabetes compared between the control or the placebo group. The size of the green box indicates the study weight. The black diamond indicates the value for the total estimates [1,7,16,17,18,19,20,21,23,24,26].
Diabetology 07 00103 g006
Figure 7. Forest plot of triglyceride levels in patients with gestational diabetes compared between the control or the placebo group. The size of the green box indicates the study weight. The black diamond indicates the value for the total estimates [7,15,20,22].
Diabetology 07 00103 g007
Figure 8. Forest plot of Cholesterol levels in patients with gestational diabetes compared between the control or the placebo group. The size of the green box indicates the study weight. The black diamond indicates the value for the total estimates [7,17,22].
Diabetology 07 00103 g008
Figure 9. Forest plot of the blood pressure levels in patients with gestational diabetes compared between the control or the placebo group. The size of the blue box indicates the study weight. The black diamond indicates the value for the total estimates [1,14,19,20,21].
Diabetology 07 00103 g009
Figure 10. Forest plot of the cesarean deliveries in patients with gestational diabetes compared with the control or the placebo group. The size of the blue box indicates the study weight. The black diamond indicates the value for the total estimates [1,7,14,15,18,19,20,21,25,27,28].
Diabetology 07 00103 g010
Figure 11. Forest plot summarizing the effect of the experimental intervention on preeclampsia incidence from five randomized controlled studies. Each horizontal line represents the study-specific odds ratio (blue square) and its 95% confidence interval for preeclampsia, with square size proportional to study weight. The diamond at the bottom denotes the pooled random-effects meta-analysis odds ratio [1,18,20,21,28].
Diabetology 07 00103 g011
Figure 12. Forest plot presenting the mean difference in gestational age at delivery (in weeks) between experimental and control groups across four randomized controlled trials. Each square represents the study-specific mean difference and its 95% confidence interval, with the square size proportional to the study’s weight in the meta-analysis. The diamond at the bottom depicts the overall pooled mean difference [15,16,23,25].
Diabetology 07 00103 g012
Figure 13. Forest plot displaying the effect of the experimental intervention on neonatal hypoglycemia incidence across six randomized controlled trials. Each square represents the study-specific odds ratio with its 95% confidence interval, proportionally scaled to the study’s weight in the meta-analysis. The diamond at the bottom depicts the pooled random-effects odds ratio [14,16,18,19,21,25,28].
Diabetology 07 00103 g013
Figure 14. Forest plot illustrating the effect of the experimental intervention on neonatal complications across four randomized controlled trials. Each square represents the study-specific odds ratio and its 95% confidence interval, with square size proportional to the study’s weight in the meta-analysis. The diamond at the bottom depicts the pooled random-effects odds ratio [7,14,15,25].
Diabetology 07 00103 g014
Figure 15. Forest plot showing the mean difference in neonatal birth weight (in kilograms) between experimental and control groups across nine randomized controlled trials. Each square represents the study-specific mean difference and its 95% confidence interval, with square size proportional to the study’s weight in the meta-analysis. The diamond at the bottom depicts the pooled random-effects mean difference [1,15,16,19,20,21,23,25,27].
Diabetology 07 00103 g015
Figure 16. Forest plot illustrating the effect of the experimental intervention on macrosomia incidence across eight randomized controlled trials. Each square represents the study-specific odds ratio and its 95% confidence interval, with square size proportional to the study’s weight in the meta-analysis. The diamond at the bottom depicts the pooled random-effects odds ratio [1,7,16,18,19,21,27,28].
Diabetology 07 00103 g016
Figure 17. Forest plot presenting the effect of the experimental intervention on preterm birth incidence across four randomized controlled trials. Each square represents the study-specific odds ratio and its 95% confidence interval, with square size proportional to the study’s weight in the meta-analysis. The diamond at the bottom depicts the pooled random-effects odds ratio [7,14,18,28].
Diabetology 07 00103 g017
Figure 18. Forest plot showing the mean difference in neonatal Apgar score at 5 min between experimental and control groups across four randomized controlled trials. Each square represents the study-specific mean difference and its 95% confidence interval, with square size proportional to the study’s weight in the meta-analysis. The diamond at the bottom depicts the pooled random-effects mean difference [1,14,16,21,25].
Diabetology 07 00103 g018
Figure 19. Forest plot displaying the effect of the experimental intervention on neonatal intensive care unit (NICU) admission rates across six randomized controlled trials. Each square represents the study-specific odds ratio and its 95% confidence interval, with square size proportional to the study’s weight in the meta-analysis. The diamond at the bottom depicts the pooled random-effects odds ratio [1,14,18,20,21,28].
Diabetology 07 00103 g019
Table 1. Summary of Findings and Certainty of Evidence (GRADE) for Maternal Outcomes in GDM Interventions.
OutcomeNb of Participants (Studies)Effect (95% CI)Overall Certainty (GRADE)Comments
Fasting Blood Glucose1941 (12 studies)MD −5.48 mg/dL (−15.17 to 4.20); p = 0.24⨁◯◯◯
Very Low
Severe heterogeneity (I2 = 100%), high risk of bias, and wide CIs (imprecise).
2 h Postprandial Glucose1905 (8 studies)MD −0.61 mmol/L (−1.08 to −0.14); p = 0.02⨁⨁◯◯
Low
Moderate heterogeneity and indirectness despite significant effect.
HbA1c1682 (7 studies)MD −0.12% (−0.36 to 0.11); p = 0.25⨁◯◯◯
Very Low
Severe heterogeneity (I2 = 100%) and imprecision (wide CI crossing null).
Weight Gain1406 (10 studies)MD −0.78 kg (−1.53 to −0.03); p = 0.04⨁⨁◯◯
Low
Heterogeneity and indirectness due to mixed intervention types.
Triglycerides1234 (9 studies)MD −14.08 mg/dL (−39.00 to 10.85); p = 0.27⨁◯◯◯
Very Low
High heterogeneity, imprecision, and inconsistent findings across studies.
Cholesterol1267 (5 studies)MD −0.67 mmol/L (−3.20 to 1.85); p = 0.50⨁◯◯◯
Very low
No pharmacologic data; wide CIs and high heterogeneity among lifestyle interventions.
Hypertensive Events1319 (6 studies)OR 0.78 (0.31–1.99); p = 0.53⨁⨁◯◯
Low
No significant overall effect. Lifestyle interventions showed signal of benefit in single study; pharmacologic showed no effect.
Cesarean Delivery2116 (11 studies)OR 0.78 (0.61–0.99); p = 0.04⨁⨁⨁◯
Moderate
Statistically significant 22% reduction in odds. Low heterogeneity.
Preeclampsia890 (5 studies)OR 0.53 (0.27–1.07); p = 0.07⨁◯◯◯
Very Low
Trend toward 47% reduction but not statistically significant. No heterogeneity but small sample size, few events, wide CIs (imprecise).
Gestational Age at Delivery224 (4 studies)MD −0.03 weeks (−0.58 to 0.52); p = 0.86⨁⨁◯◯
Low
Small sample size and heterogeneity despite narrow CIs.
Neonatal Hypoglycemia1084 (6 studies)OR 0.78 (0.57–1.07); p = 0.10⨁⨁◯◯
Low
Imprecision due to limited events and CI crossing null.
Neonatal Complications459 (4 studies)OR 0.63 (0.38–1.06); p = 0.07⨁⨁◯◯
Low
Small sample, imprecision, and limited number of studies.
Neonatal Birth Weight1640 (9 studies)MD −0.03 kg (−0.13 to 0.07); p = 0.54⨁◯◯◯
Very Low
High heterogeneity and imprecision despite null effect.
Preterm Newborns632 (4 studies)OR 0.96 (0.41–2.28); p = 0.90⨁⨁◯◯
Low
Wide CIs and imprecision due to small sample size.
Apgar Score at 5 Minutes754 (4 studies)MD −0.01 (−0.19 to 0.17); p = 0.84⨁⨁⨁◯
Moderate
No significant effect. Low heterogeneity and narrow CIs around null.
Macrosomia1734 (8 studies)OR 0.64 (0.31–1.35); p = 0.20⨁⨁◯◯
Low
No significant effect. Low to moderate heterogeneity but wide CIs.
NICU Admission1081 (6 studies)OR 0.80 (0.62–1.02); p = 0.07⨁⨁⨁◯
Moderate
Trend toward 20% reduction approaching significance. No heterogeneity.
Table 2. Overview of the included studies on interventions in gestational diabetes mellitus (GDM), showing study year, sample size, design, intervention type, and duration.
StudyYearSample Size (Treatment/Control)Study DesignType of InterventionIntervention TimeDiagnosis MethodGestational Age at Diagnosis
Picon-Cezar et al. [14]2021100/100multicenter, open-label, parallel arms, randomized clinical trialmetformin vs. insulin14 to 35 weeks of gestationOGTT22–23 weeks
Gomez-Ribot et al. [15]202033 GDM and 17 healthy control assigned 1:1randomized controlled trialEVOON/AOGTT24–28 weeks
Pavao et al. [16]201347/47randomized trialmetformin vs. insulinN/AOGTT30.4 ± 3.7 weeks (metformin group), 30.6 ± 3.9 weeks (insulin group)
Jamilian et al. [17]202026/25randomized double blind, placebo controlled trialn3 fatty acids from flaxseed oil6-week supplementation periodOGTT24–28 weeks
Jin et al. [18]202265/66randomized controlled trialGymnasticsN/AOGTT24–28 weeks
Yuan et al. [19]2020158/154randomized controlled trial12 h NCPN/AOGTT24–28 weeks
Huhtala et al. [1]2018110/107open label observational studymetformin vs. insulinat diagnosis and 36 gestational weeksOGTT24–28 weeks
Huhtala et al. [20]2020110/107retrospective cohort studymetformin vs. insulinfrom 30 to 36 gestational weeks OGTT24–28 weeks
Tertti et al. [21]2013111/110open label prospective trialmetformin vs. insulinfrom 22 to 34 weeks of gestationOGTT26.8 ± 2.5 weeks
Ajaz Qazi et al. [22]20218/8pilot studyexerciseN/AOGTT>20 weeks
De Barros et al. [23]201032/32Randomized Control TrialResistance exerciseFrom diagnosis to end of pregnancyOGTT24–34 weeks
Youngwanichsetha et al. [24]201485/85Randomized Control TrialYoga + Mindfulness eating8 weeksOGTT24–30 weeks
Kokic et al. [25]201820/22Randomized Control TrialCombined aerobic + ResistanceMinimum 6 weeks until birthOGTT<30 weeks
Daniel et al. [26]201415/15Randomized Control TrialAerobic Dance8 weeksOGCT followed by OGTT≥24 weeks
Bo et al. [7]2014101/99Randomized Control TrialBehavioral + Exercise lifestyleFrom 24–26 weeks to 38 weeks of gestationOGTT24–26 weeks
Barakat et al. [27] 2019234/222Randomized Controlled TrialSupervised exercise program (aerobic, resistance, pelvic floor training)8–10 weeks to 38–39 weeks of gestation (~83–85 sessions, 3 days/week, 55–60 min/session)1 h OGTT (50 g glucose) at 24–26 weeks24–26 weeks
Paco Matallana et al. [28]202556/57Randomized, double-blind, placebo-controlled trialUrsodeoxycholic acid (UDCA) 500 mg twice daily vs. placebo24–28 weeks to delivery (~10–14 weeks)2-step screening: O’Sullivan test (50 g glucose), then 100g 3 h OGTT if positive24–28 weeks
Abbreviations: OGTT: Oral glucose tolerance test; OGCT: Oral glucose challenge test; NCP: Nutrition care program; EVOO: Extra-virgin olive oil. N/A indicates data not available.
Table 3. Summary table showing the effectiveness of several treatment trials on different outcomes according to our meta-analysis results.
OutcomeInterventions (Experimental)
HbA1cNo significant effect
TriglyceridesNo significant effect
CholesterolNo significant effect
2 h postprandial glucoseNo significant effect
Fasting blood glucoseNo significant effect
Blood pressure No significant effect
Weight gainSignificant effect
Cesarean deliverySignificant effect
PreeclampsiaTrend toward effect
Gestational age at deliveryNo significant effect
Neonatal hypoglycemiaTrend toward effect
Neonatal complicationsTrend toward effect
Neonatal birth weightNo significant effect
Preterm newbornsNo significant effect
Apgar score at 5 minNo significant effect
MacrosomiaNo significant effect
NICU admissionTrend toward effect
Disclaimer/Publisher’s Note: The statements, opinions and data contained in all publications are solely those of the individual author(s) and contributor(s) and not of MDPI and/or the editor(s). MDPI and/or the editor(s) disclaim responsibility for any injury to people or property resulting from any ideas, methods, instructions or products referred to in the content.