Evaluation of a Digital Health Application for Diabetics Under Real-World Conditions: Superior Outcomes Compared to Standard Care in an Observational Matched Case–Control Study
Abstract
1. Introduction
2. Subjects, Materials, and Methods
2.1. Study Design
2.2. Intervention
2.3. Participants and Matching
2.4. Outcomes
- H1.1/H1.1: The IG using ESYSTA® shows a clinically relevant reduction in HbA1c (in %) after 6/12 months.
- H2.1/H2.2: The IG using ESYSTA® shows a more pronounced HbA1c (in %) reduction compared to the CG after 6/12 months.
2.5. Statistical Analysis
3. Results
3.1. Matching
3.2. Primary and Secondary Endpoints
3.3. Exploratory Endpoint
4. Discussion
4.1. Principal Findings
4.2. Comparison to Other Studies
4.3. Strengths and Limitations
5. Conclusions
Author Contributions
Funding
Institutional Review Board Statement
Informed Consent Statement
Data Availability Statement
Conflicts of Interest
Abbreviations
| CG | Control group |
| CIR | Copy increments to reference |
| df | Degrees of freedom |
| DMP | Disease management program |
| HbA1c | Glycated hemoglobin |
| IG | Intervention group |
| MAR | Missing at random |
| pFDR | p-value adjusted with the False Discovery Rate |
| PP | Per-protocol |
| SD | Standard deviation |
| SoC | Standard of care |
| T1DM | Diabetes mellitus type 1 |
| T2DM | Diabetes mellitus type 2 |
Appendix A
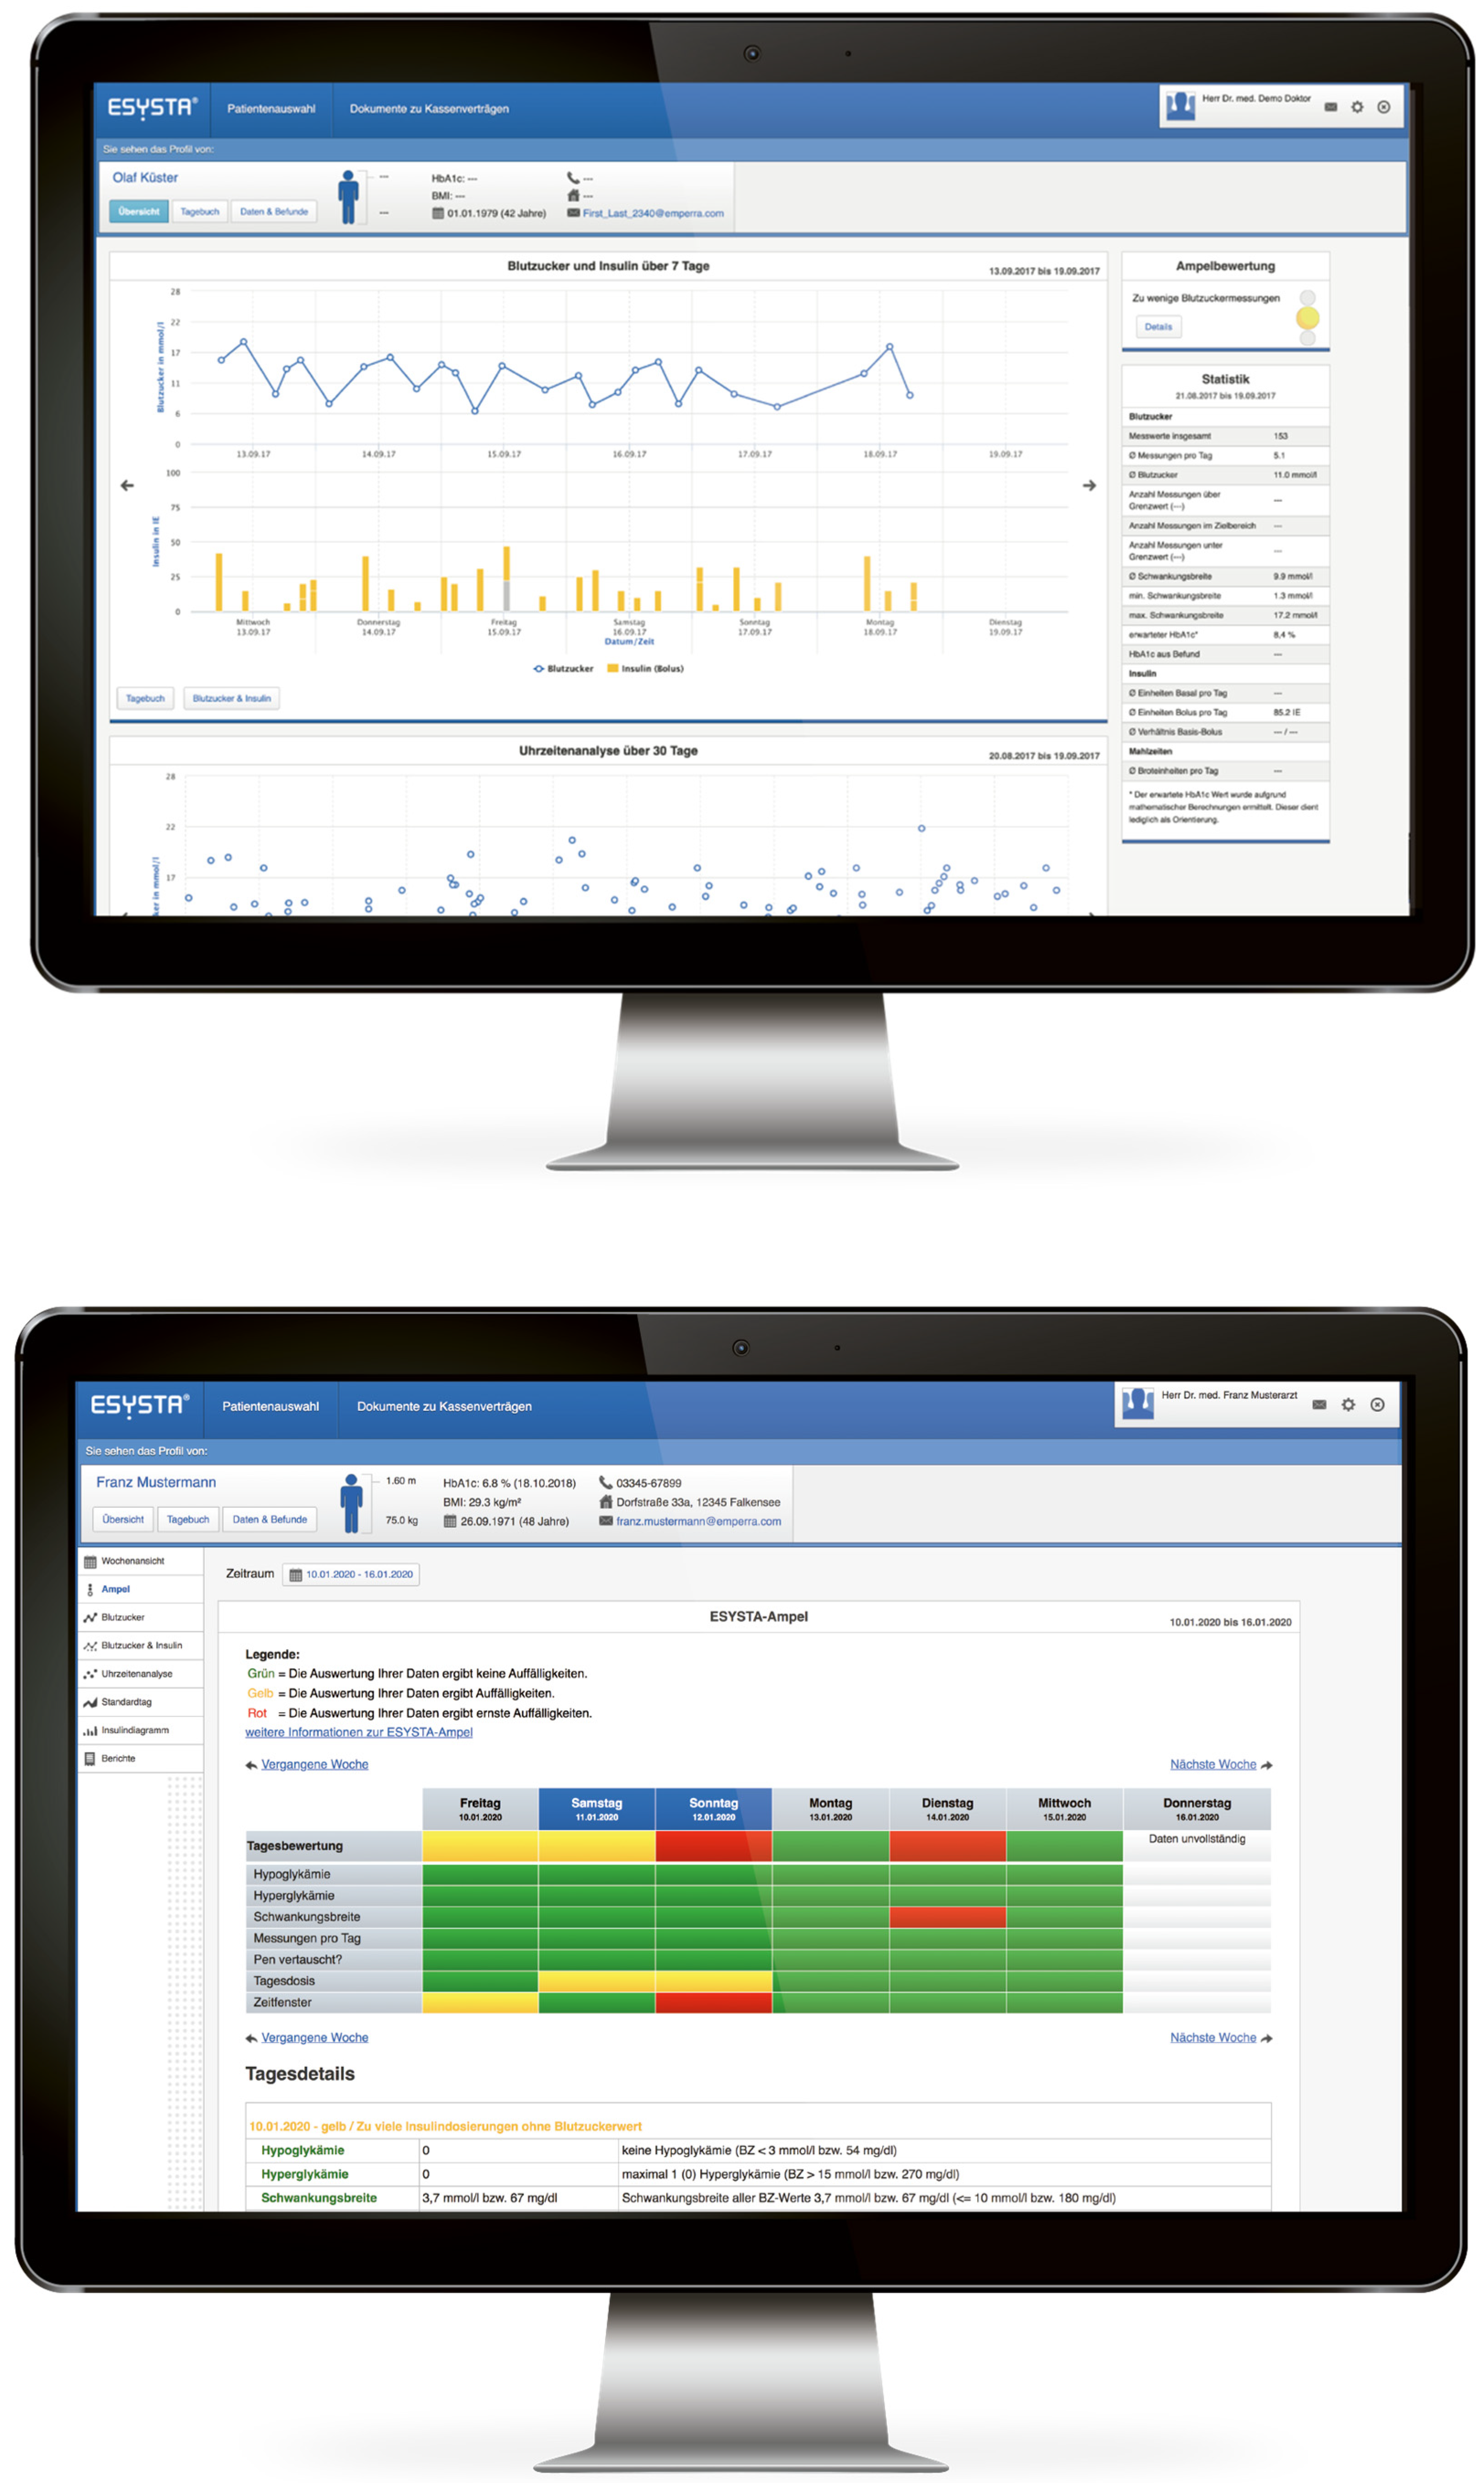
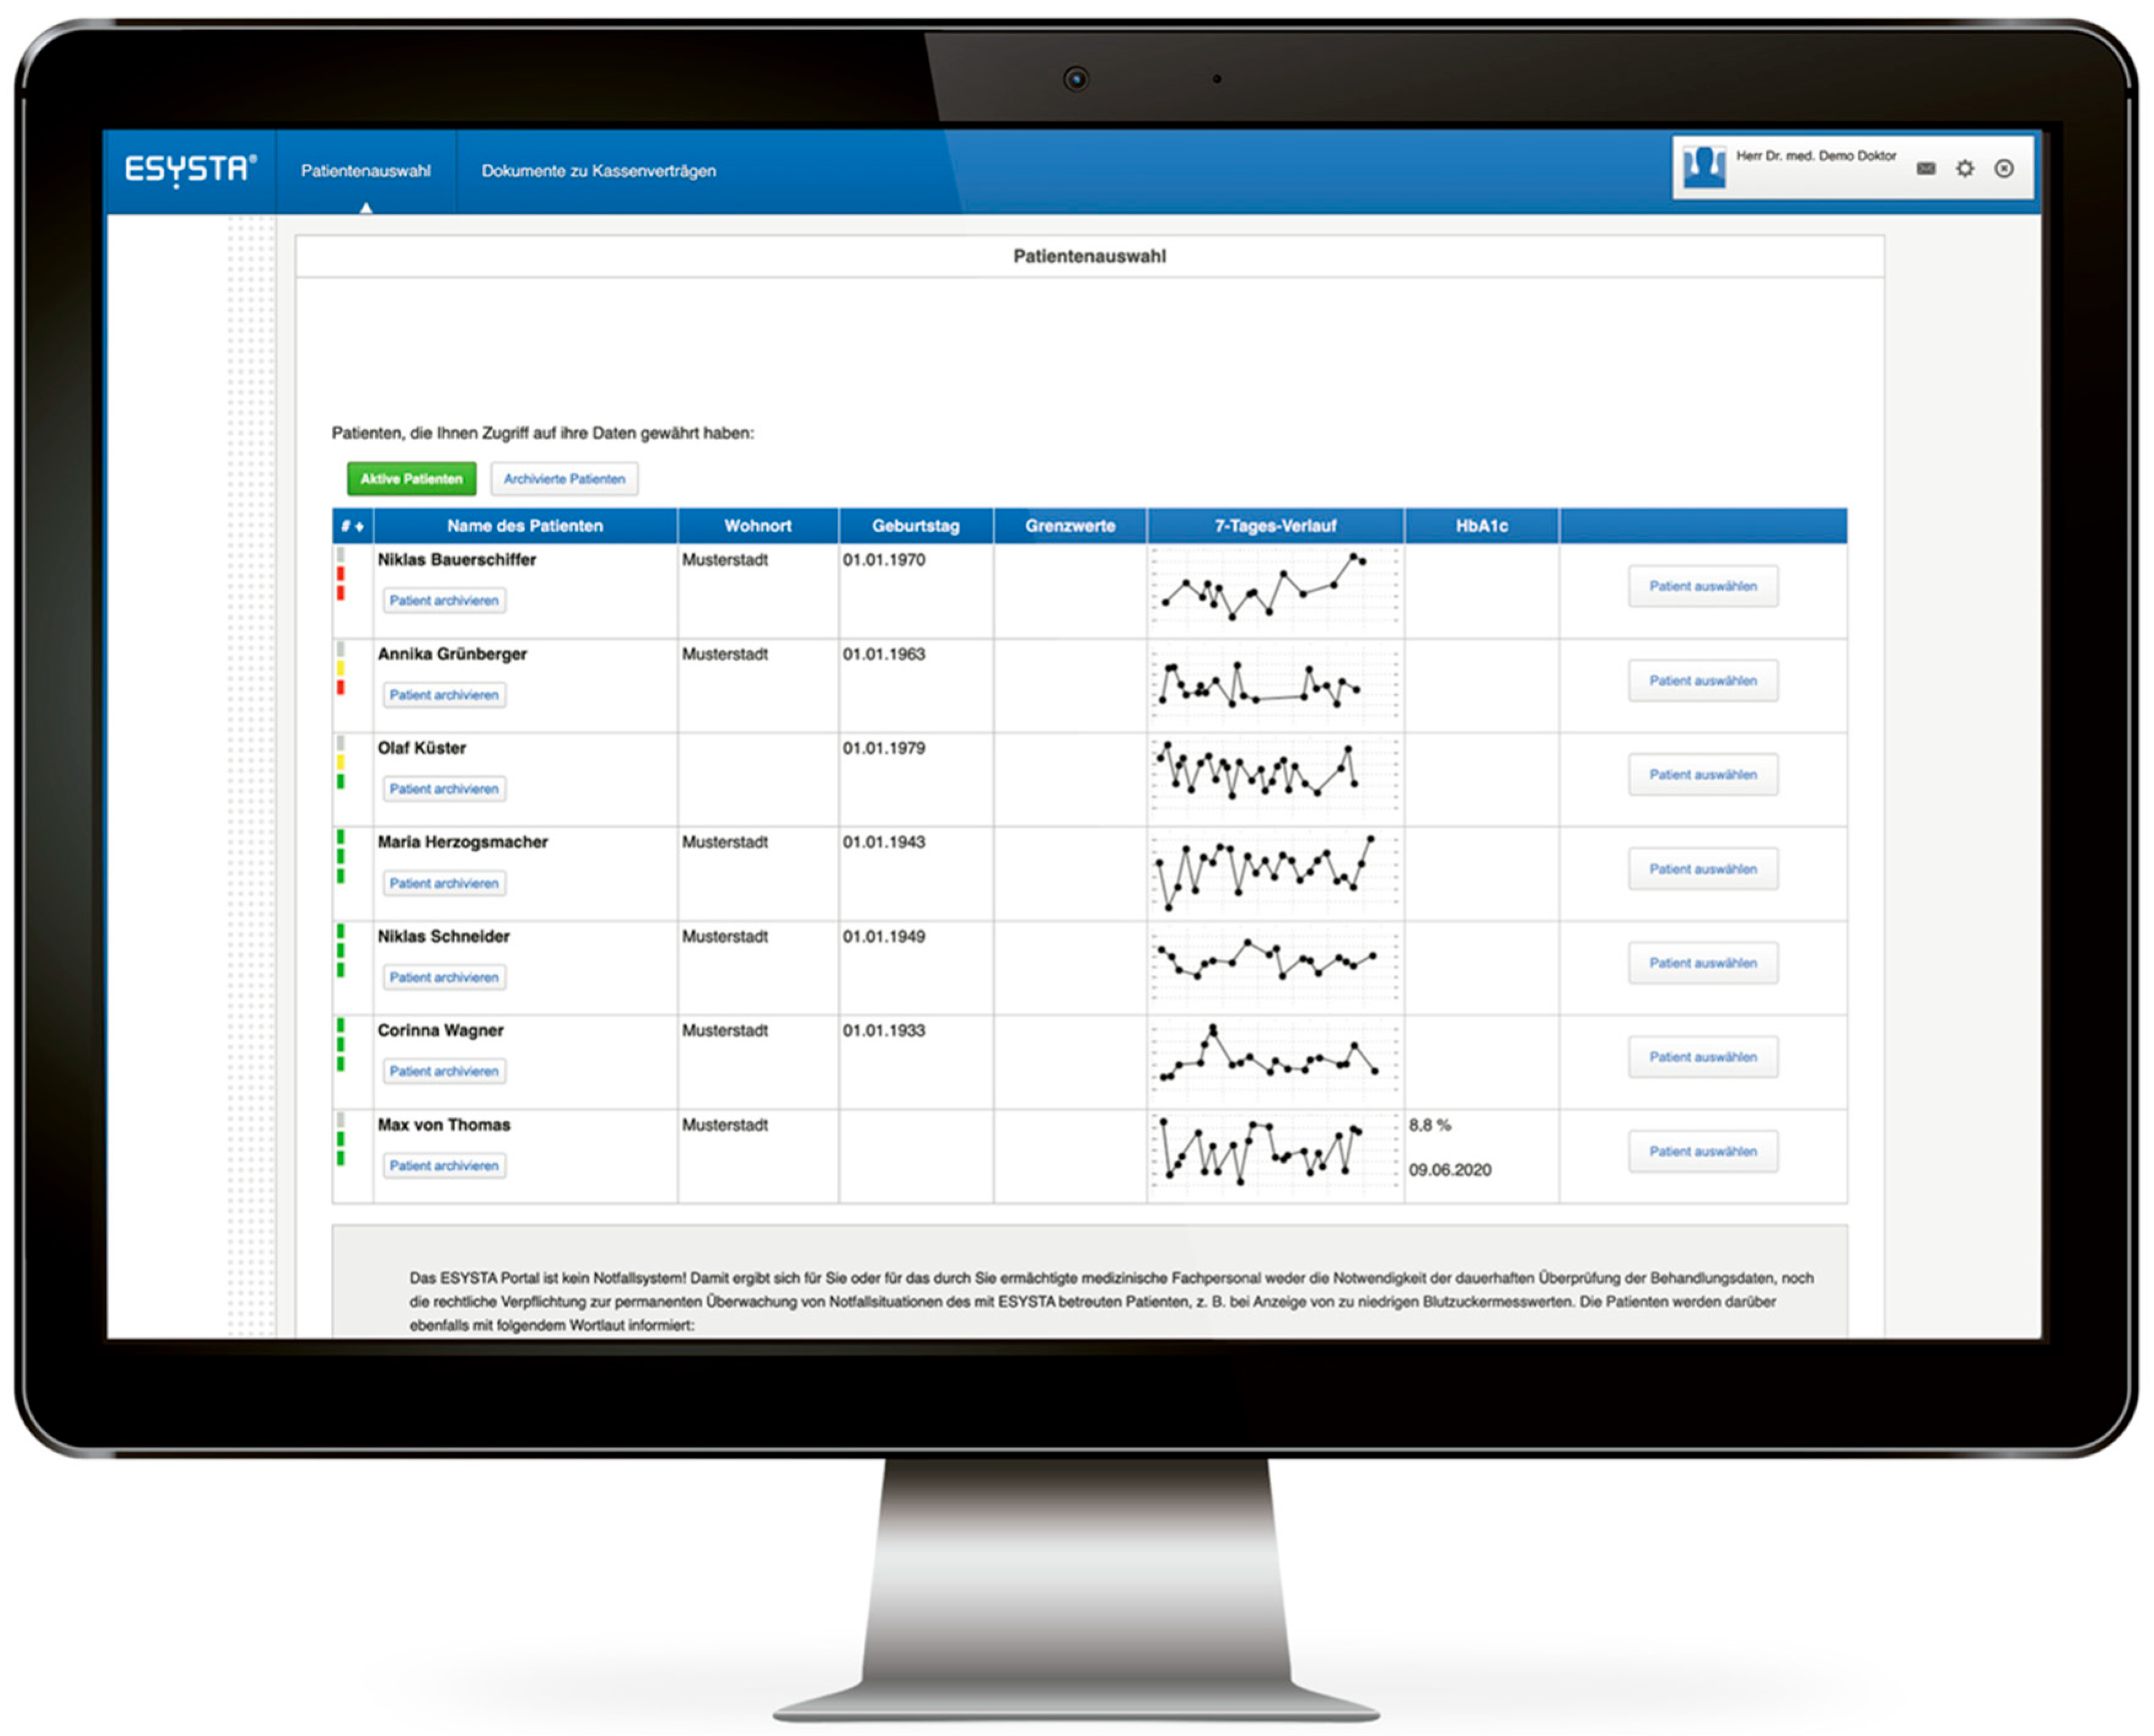
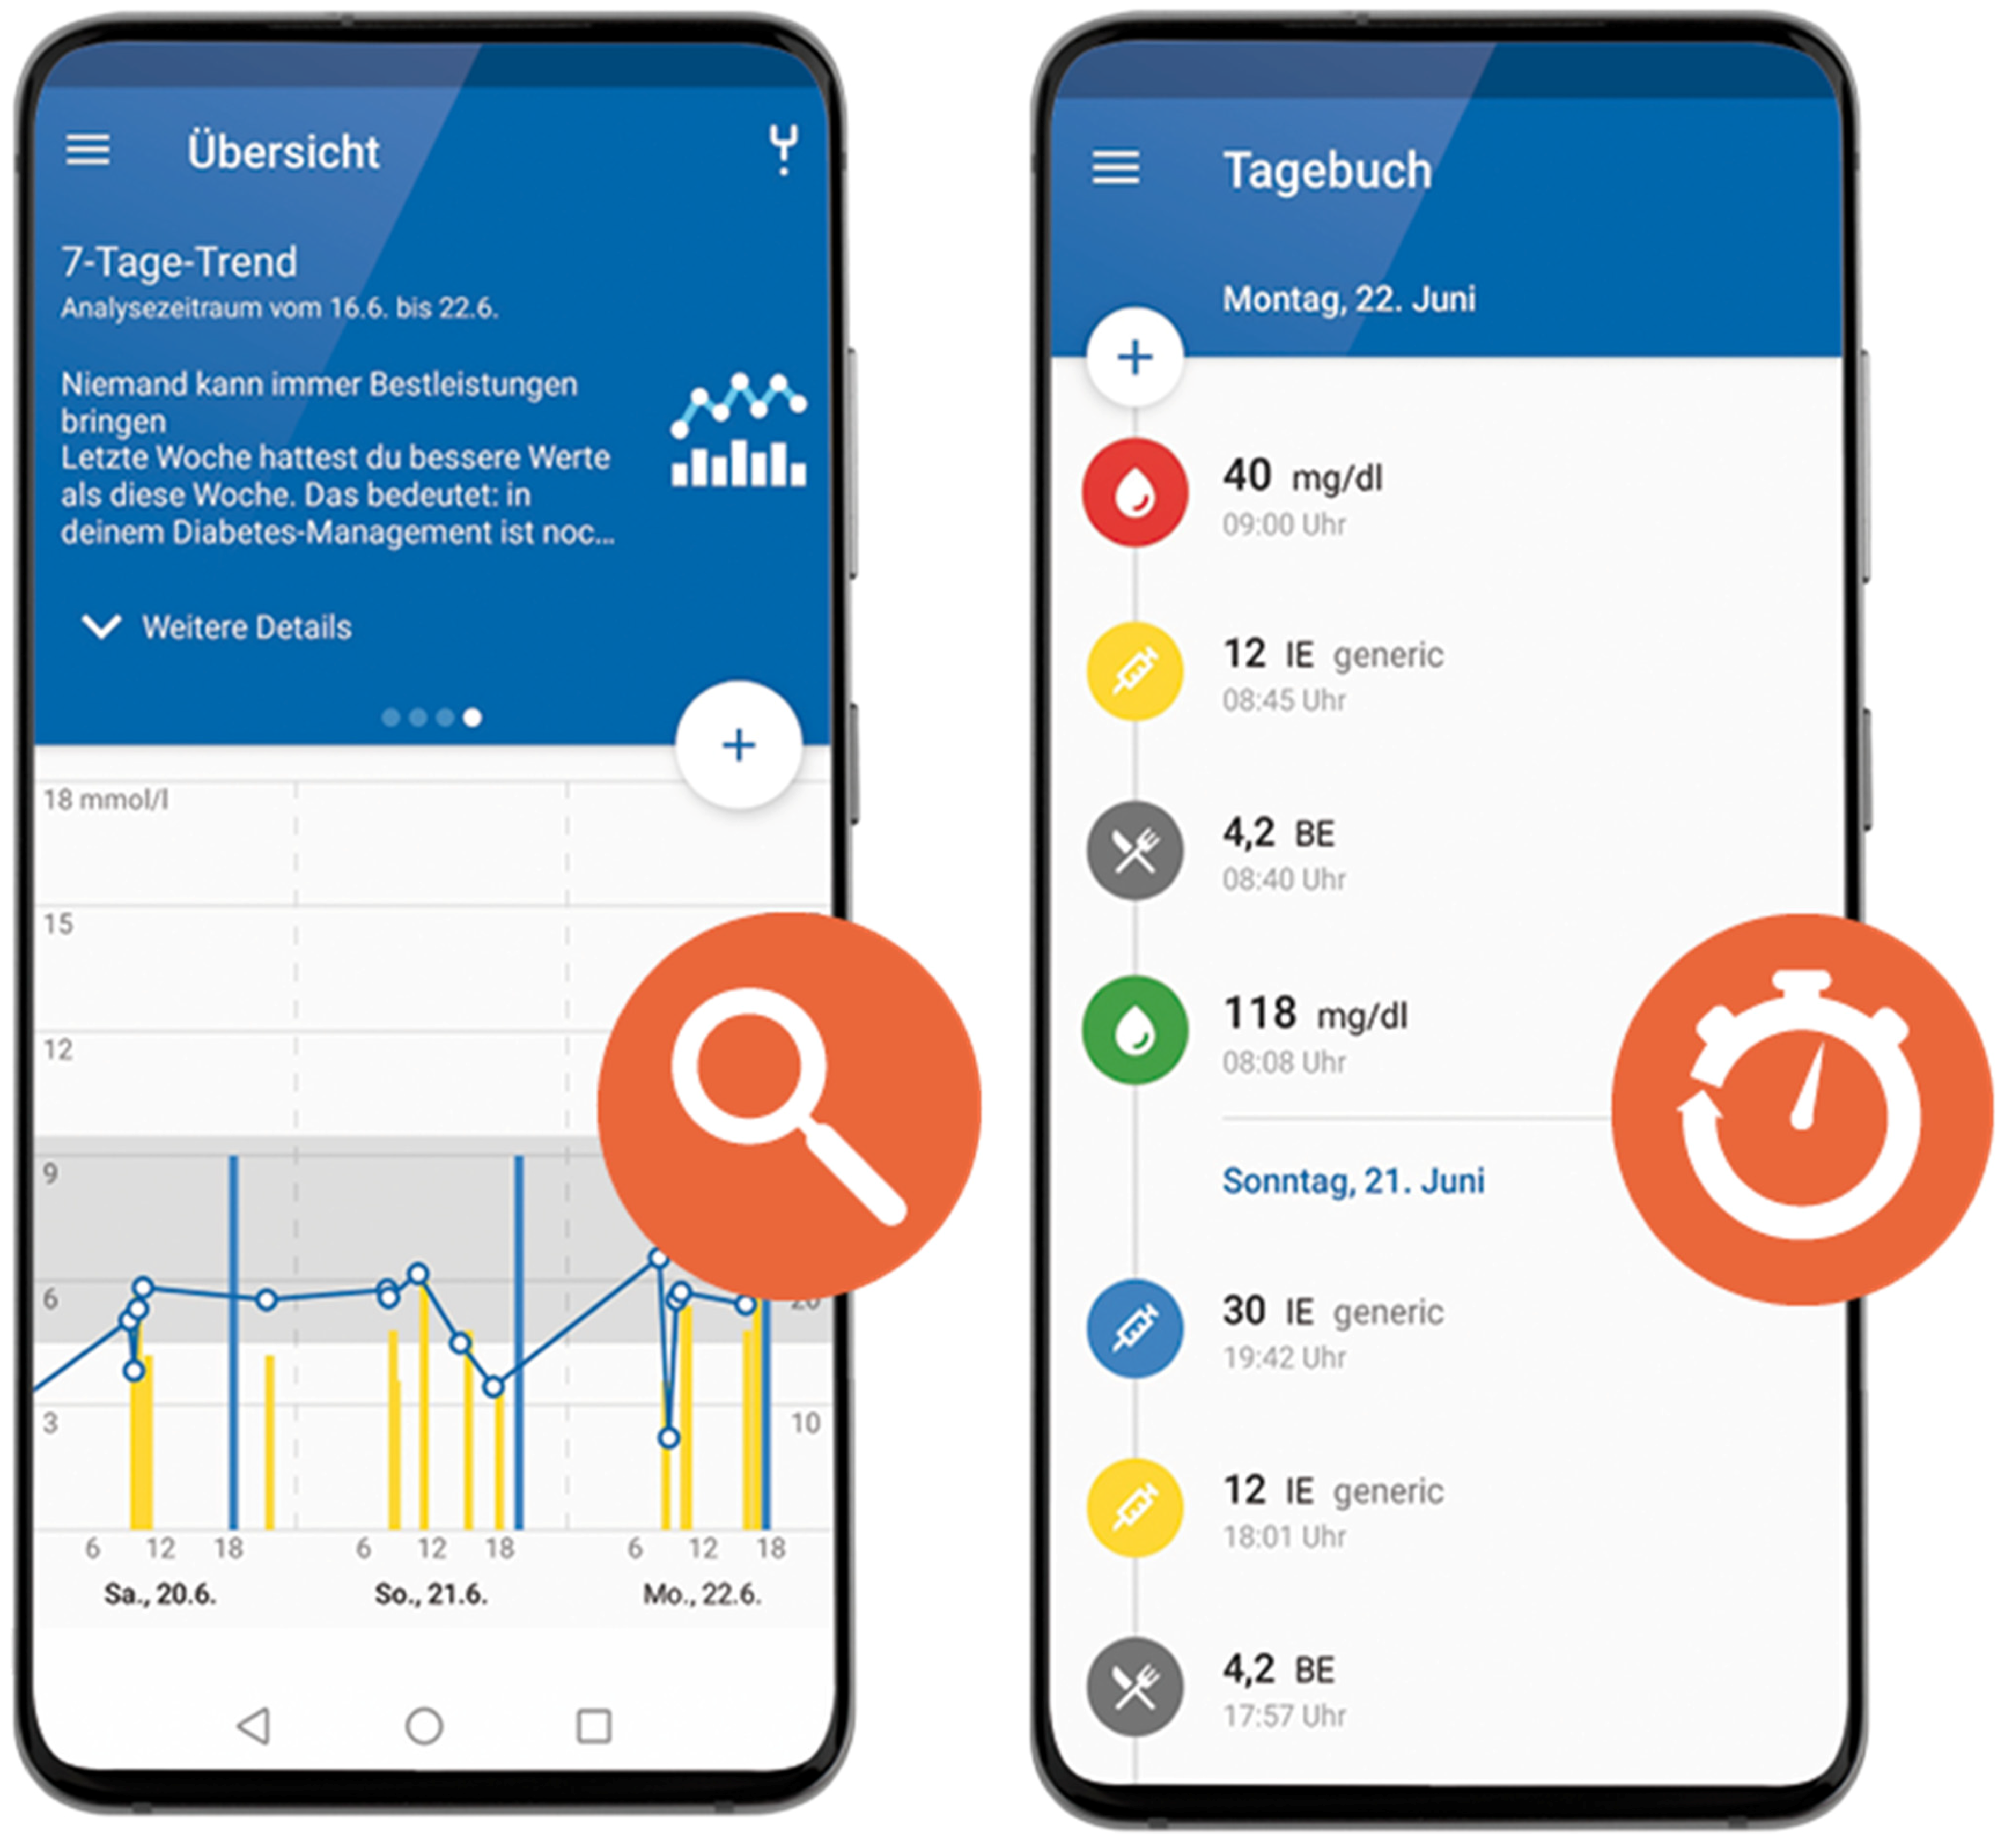
| ESYSTA® APP | ESYSTA® PORTAL |
|---|---|
|
|
| Pre-Defined Matching Procedure | R-Code | Reason It Did Not Work |
|---|---|---|
| First: Exact Matching on All Covariates | matchIt(group (IG/CG) ~ HbA1c (in %) + age (in years) + gender (female/male/diverse) + type of diabetes (type 1/type 2), data = df, method = “nearest”, exact = ~ HbA1c (in %) + age (in years) + gender (w/m/d) + type of diabetes (type 1/type 2), m.order = “random”). | Unmatched IG subjects (n = 57) |
| Second: Nearest Neighbor Matching with Caliper Distances for Baseline HbA1c (±0.1%) and age (±5 years) | matchIt(group (IG/CG) ~ HbA1c (in %) + age (in years) + gender (female/male/diverse) + type of diabetes (type 1/type 2), data = df, method = “nearest”, caliper = c(HbA1c = 0.1, age = 2), std.caliper = c(FALSE, FALSE)). | Unmatched IG subjects (n = 3) |
| Analysis | Factor | df | X2 | p-Value |
|---|---|---|---|---|
| CIR | group | 1 | 10.6531 | <0.0001 *** |
| CIR | time | 4 | 17.1219 | <0.0001 *** |
| CIR | group*time | 4 | 0.4945 | 0.740 |
| CIR | Baseline HbA1c | 1 | 47.312 | <0.0001 *** |
| CIR | Baseline HbA1c*time | 4 | 5.4981 | 0.003 |
| CIR | Age | 1 | 1.4917 | 0.2221 |
| CIR | Gender | 1 | 0.2346 | 0.6282 |
| CIR | Indication | 1 | 1.3509 | 0.2453 |
| PP | group | 1 | 17.1873 | <0.0001 *** |
| PP | time | 4 | 28.6191 | <0.0001 *** |
| PP | group*time | 4 | 1.990 | 0.738 |
| PP | Baseline HbA1c | 1 | 36.4486 | <0.0001 *** |
| PP | Baseline HbA1c*time | 4 | 4.380 | 0.357 |
| PP | Age | 1 | 0.0076 | 0.396 |
| PP | Gender | 1 | 0.9818 | 0.322 |
| PP | Indication | 1 | 0.7212 | 0.396 |
| 2:1 (MAR) | group | 1 | 21.046 | <0.0001 *** |
| 2:1 (MAR) | time | 4 | 30.330 | <0.0001 *** |
| 2:1 (MAR) | group*time | 4 | 1.182 | 0.881 |
| 2:1 (MAR) | Baseline HbA1c | 1 | 232.919 | <0.0001 *** |
| 2:1 (MAR) | Baseline HbA1c*time | 4 | 22.180 | <0.0001 *** |
| 2:1 (MAR) | Age | 1 | 1.9244 | 0.165 |
| 2:1 (MAR) | Gender | 1 | 0.0360 | 0.850 |
| 2:1 (MAR) | Indication | 1 | 0.6760 | 0.411 |
Appendix B. START-II Trial Results Based on the Overall AOK Nordost Sample
Appendix B.1. Background
Appendix B.2. Methods
- H1.1/H1.1: The IG using ESYSTA® shows a clinically relevant reduction in HbA1c (in %) after 6/12 months.
- H2.1/H2.2: The IG using ESYSTA® shows a more pronounced HbA1c (in %) reduction compared to the CG after 6/12 months.
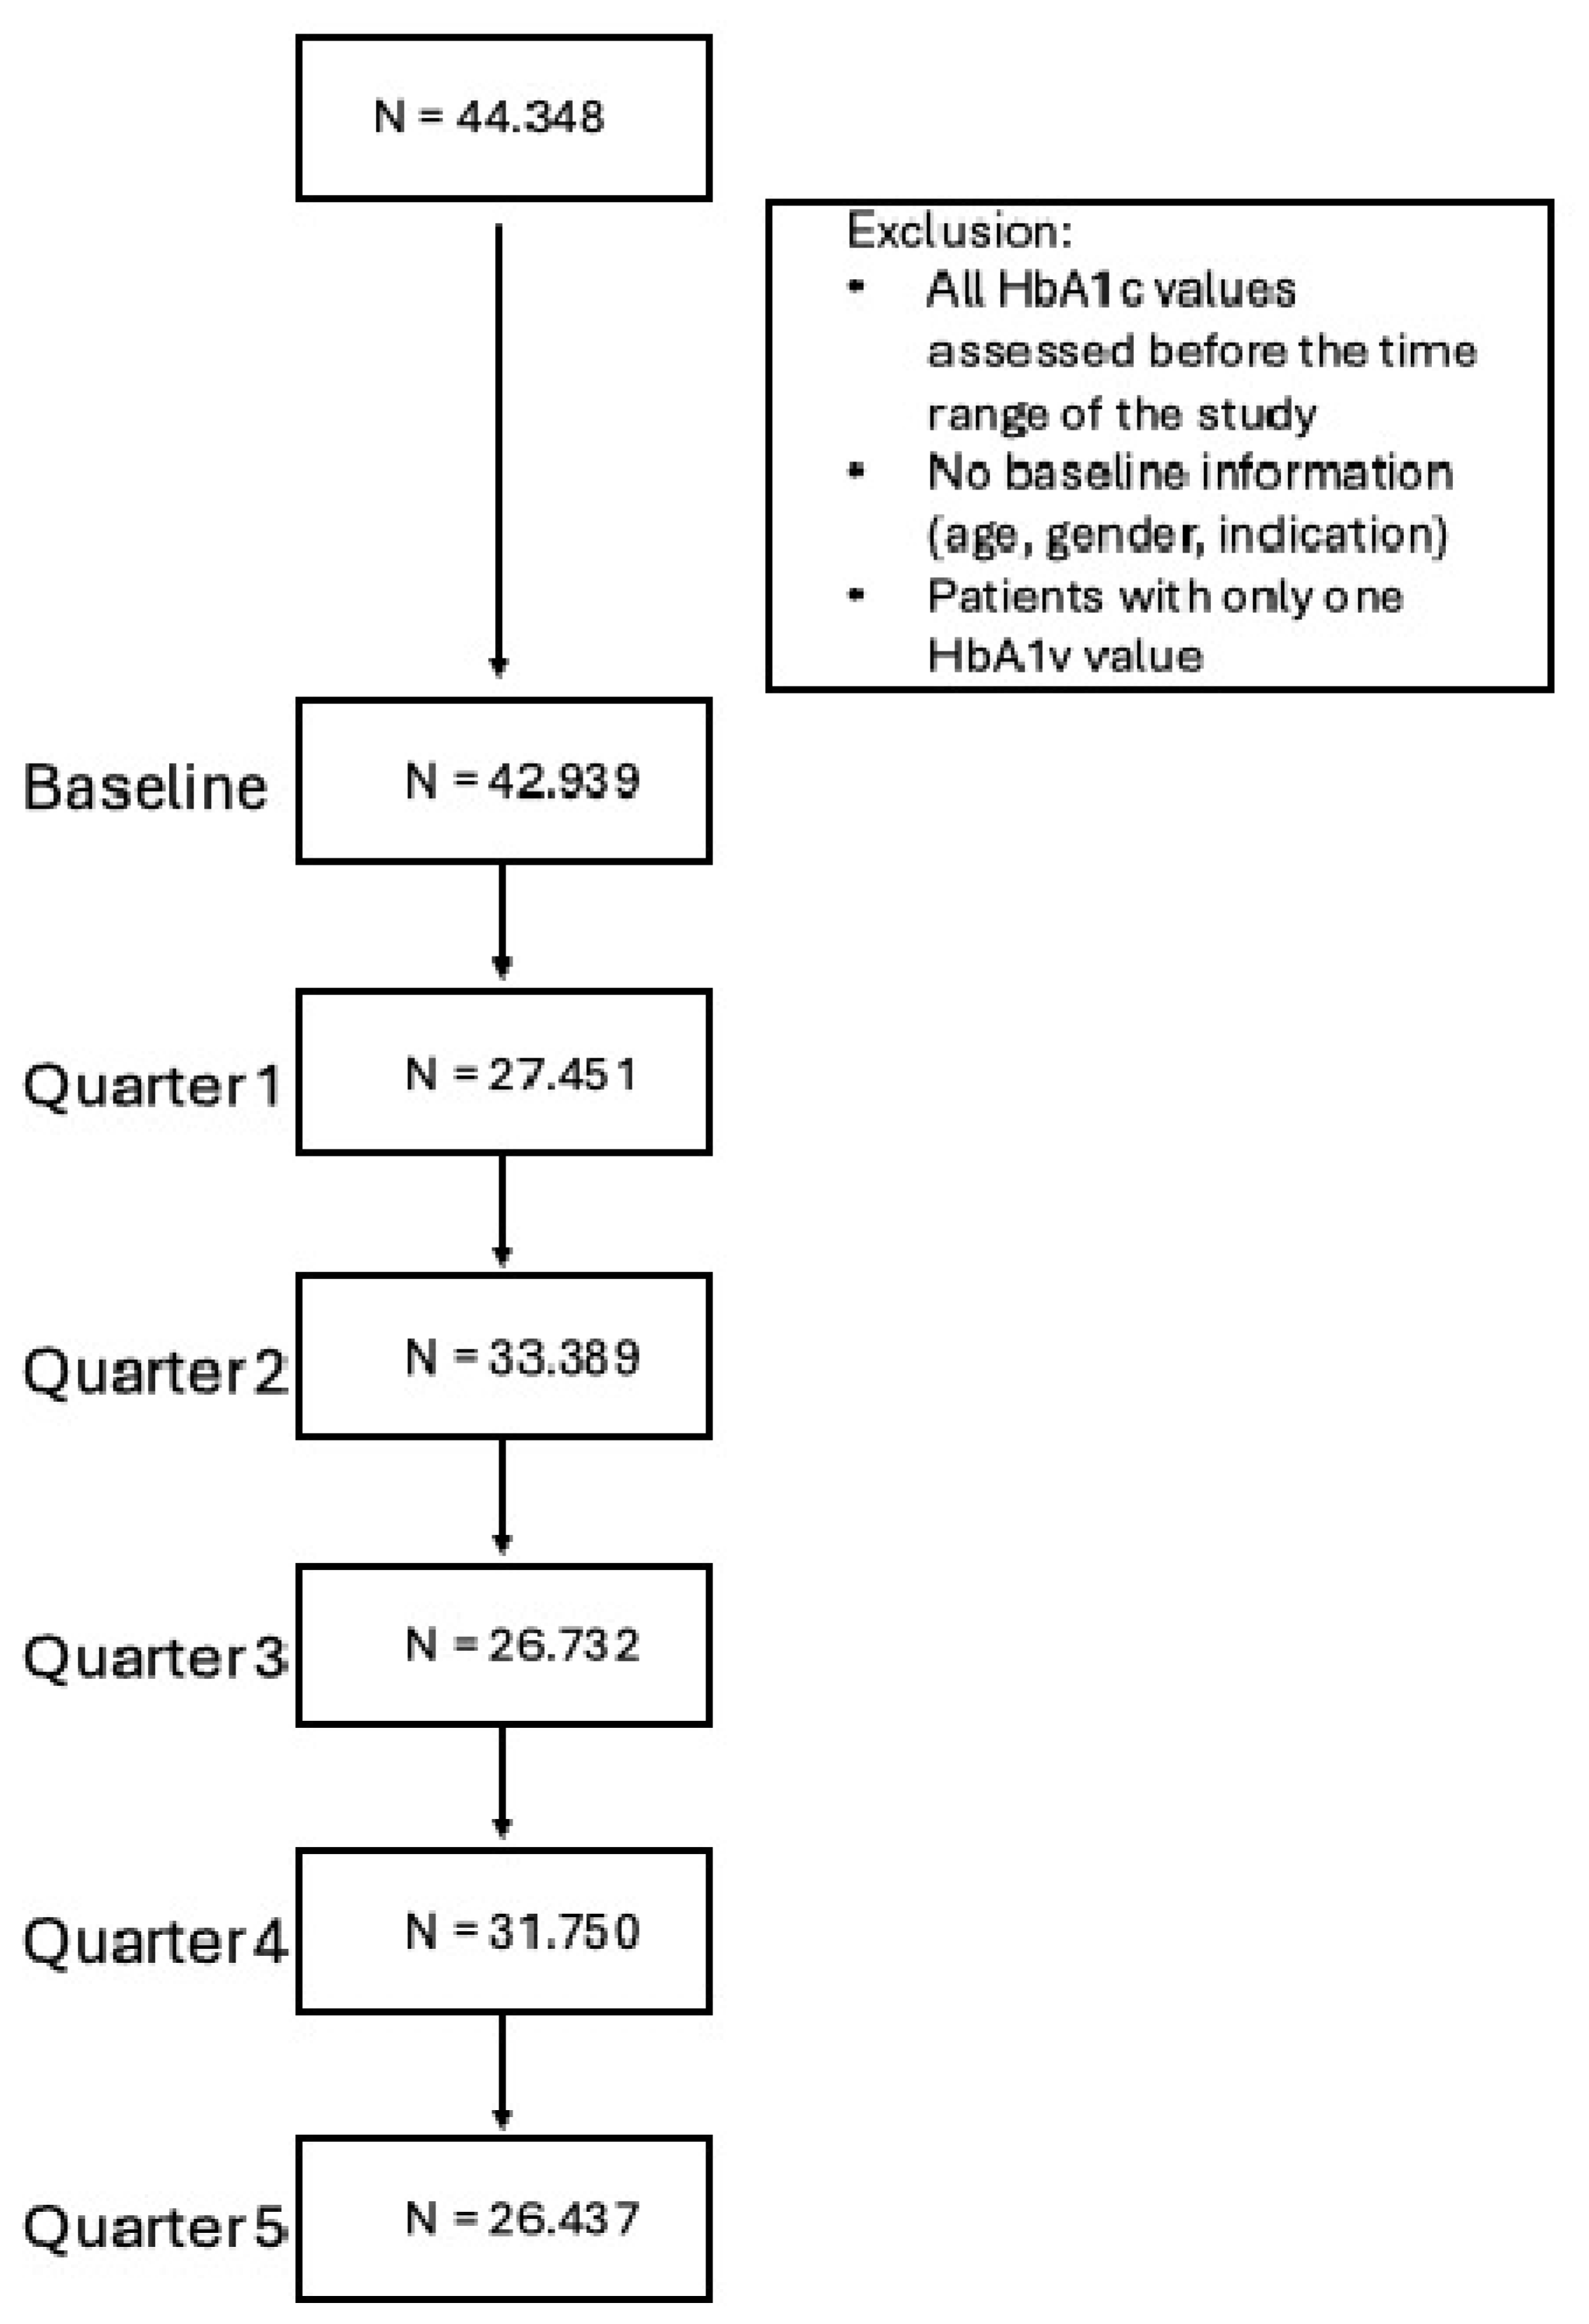
Appendix B.3. Results
| IG Sample | CG Sample | |
|---|---|---|
| (N = 191) | (N = 42.939) | |
| Baseline Hba1c (in %) | ||
| Mean (SD) | 8.66 (1.31) | 7.71 (1.43) |
| Median [Min, Max] | 8.40 [6.60, 14.5] | 7.50 [1.10, 19.1] |
| Type of Diabetes | ||
| TDM1 | 32 (16.8%) | 2415 (5.6%) |
| TDM1 and TDM2 | 0 (0%) | 268 (0.6%) |
| TDM2 | 159 (83.2%) | 40,256 (93.8%) |
| Gender | ||
| Male | 116 (60.7%) | 20,666 (48.1%) |
| Female | 75 (39.3%) | 22,273 (51.9%) |
| Age | ||
| Mean (SD) | 60.9 (13.5) | 71.1 (11.9) |
| Median [Min, Max] | 62.0 [23.0, 86.0] | 74.0 [21.0, 93.0] |
Appendix B.3.1. Matching
| Mean Diff. | Var. Ratio | eCDF Mean | |
|---|---|---|---|
| Distance | 0.008 | 1.264 | 0.004 |
| Baseline Hba1c (in %) | −0.002 | 1.011 | 0.002 |
| Type of Diabetes | |||
| TDM1 | 0.000 | 0.000 | |
| TDM1 and TDM2 | 0.000 | 0.000 | |
| TDM2 | 0.000 | 0.000 | |
| Gender | |||
| Male | 0.011 | 0.005 | |
| Female | −0.011 | 0.005 | |
| Age | −0.001 | 0.981 | 0.002 |
| IG Sample | CG Sample | |
|---|---|---|
| (N = 191) | (N = 191) | |
| Baseline Hba1c (in %) | ||
| Mean (SD) | 8.66 (1.31) | 8.66 (1.31) |
| Median [Min, Max] | 8.40 [6.60, 14.5] | 8.40 [6.60, 14.4] |
| Type of Diabetes | ||
| TDM1 | 32 (16.8%) | 32 (16.8%) |
| TDM2 | 159 (83.2%) | 159 (83.2%) |
| Gender | ||
| Male | 116 (60.7%) | 115 (60.2%) |
| Female | 75 (39.3%) | 76 (39.8%) |
| Age | ||
| Mean (SD) | 60.9 (13.5) | 60.8 (13.6) |
| Median [Min, Max] | 62.0 [23.0, 86.0] | 62.0 [21.0, 86.0] |
Appendix B.3.2. Outcomes
| Quartal | IG | CG |
|---|---|---|
| 1 | −0.42 [−0.63; −0.22] | −0.04 [−0.25; 0.17] |
| 2 | −0.58 [−0.78; −0.38] | −0.13 [−0.33; 0.08] |
| 3 | −0.56 [−0.77; −0.36] | −0.15 [−0.36; 0.07] |
| 4 | −0.61 [−0.81; −0.41] | −0.25 [−0.46; −0.04] |
| 5 | −0.74 [−0.96; −0.53] | −0.14 [−0.35; 0.07] |
| Quarter | Hypothesis | Estimate (95% CI) | t | df | pFDR | Cohen’s d |
|---|---|---|---|---|---|---|
| 2 | IG | −0.61 [−0.81; −0.41] | −2.553 | 708 | 0.005 ** | −0.19 [−0.34, −0.04] |
| 2 | IG vs. CG | −0.36 [−0.67; −0.16] | −2.486 | 819 | 0.013 * | −0.17 [−0.31, −0.04] |
| 4 | IG | −0.58 [−0.78; −0.38] | −2.237 | 680 | 0.013 * | −0.17 [−0.32, −0.02] |
| 4 | IG vs. CG | −0.45 [−0.70; −0.21] | −3.940 | 799 | <0.001 *** | −0.28 [−0.42, −0.14] |
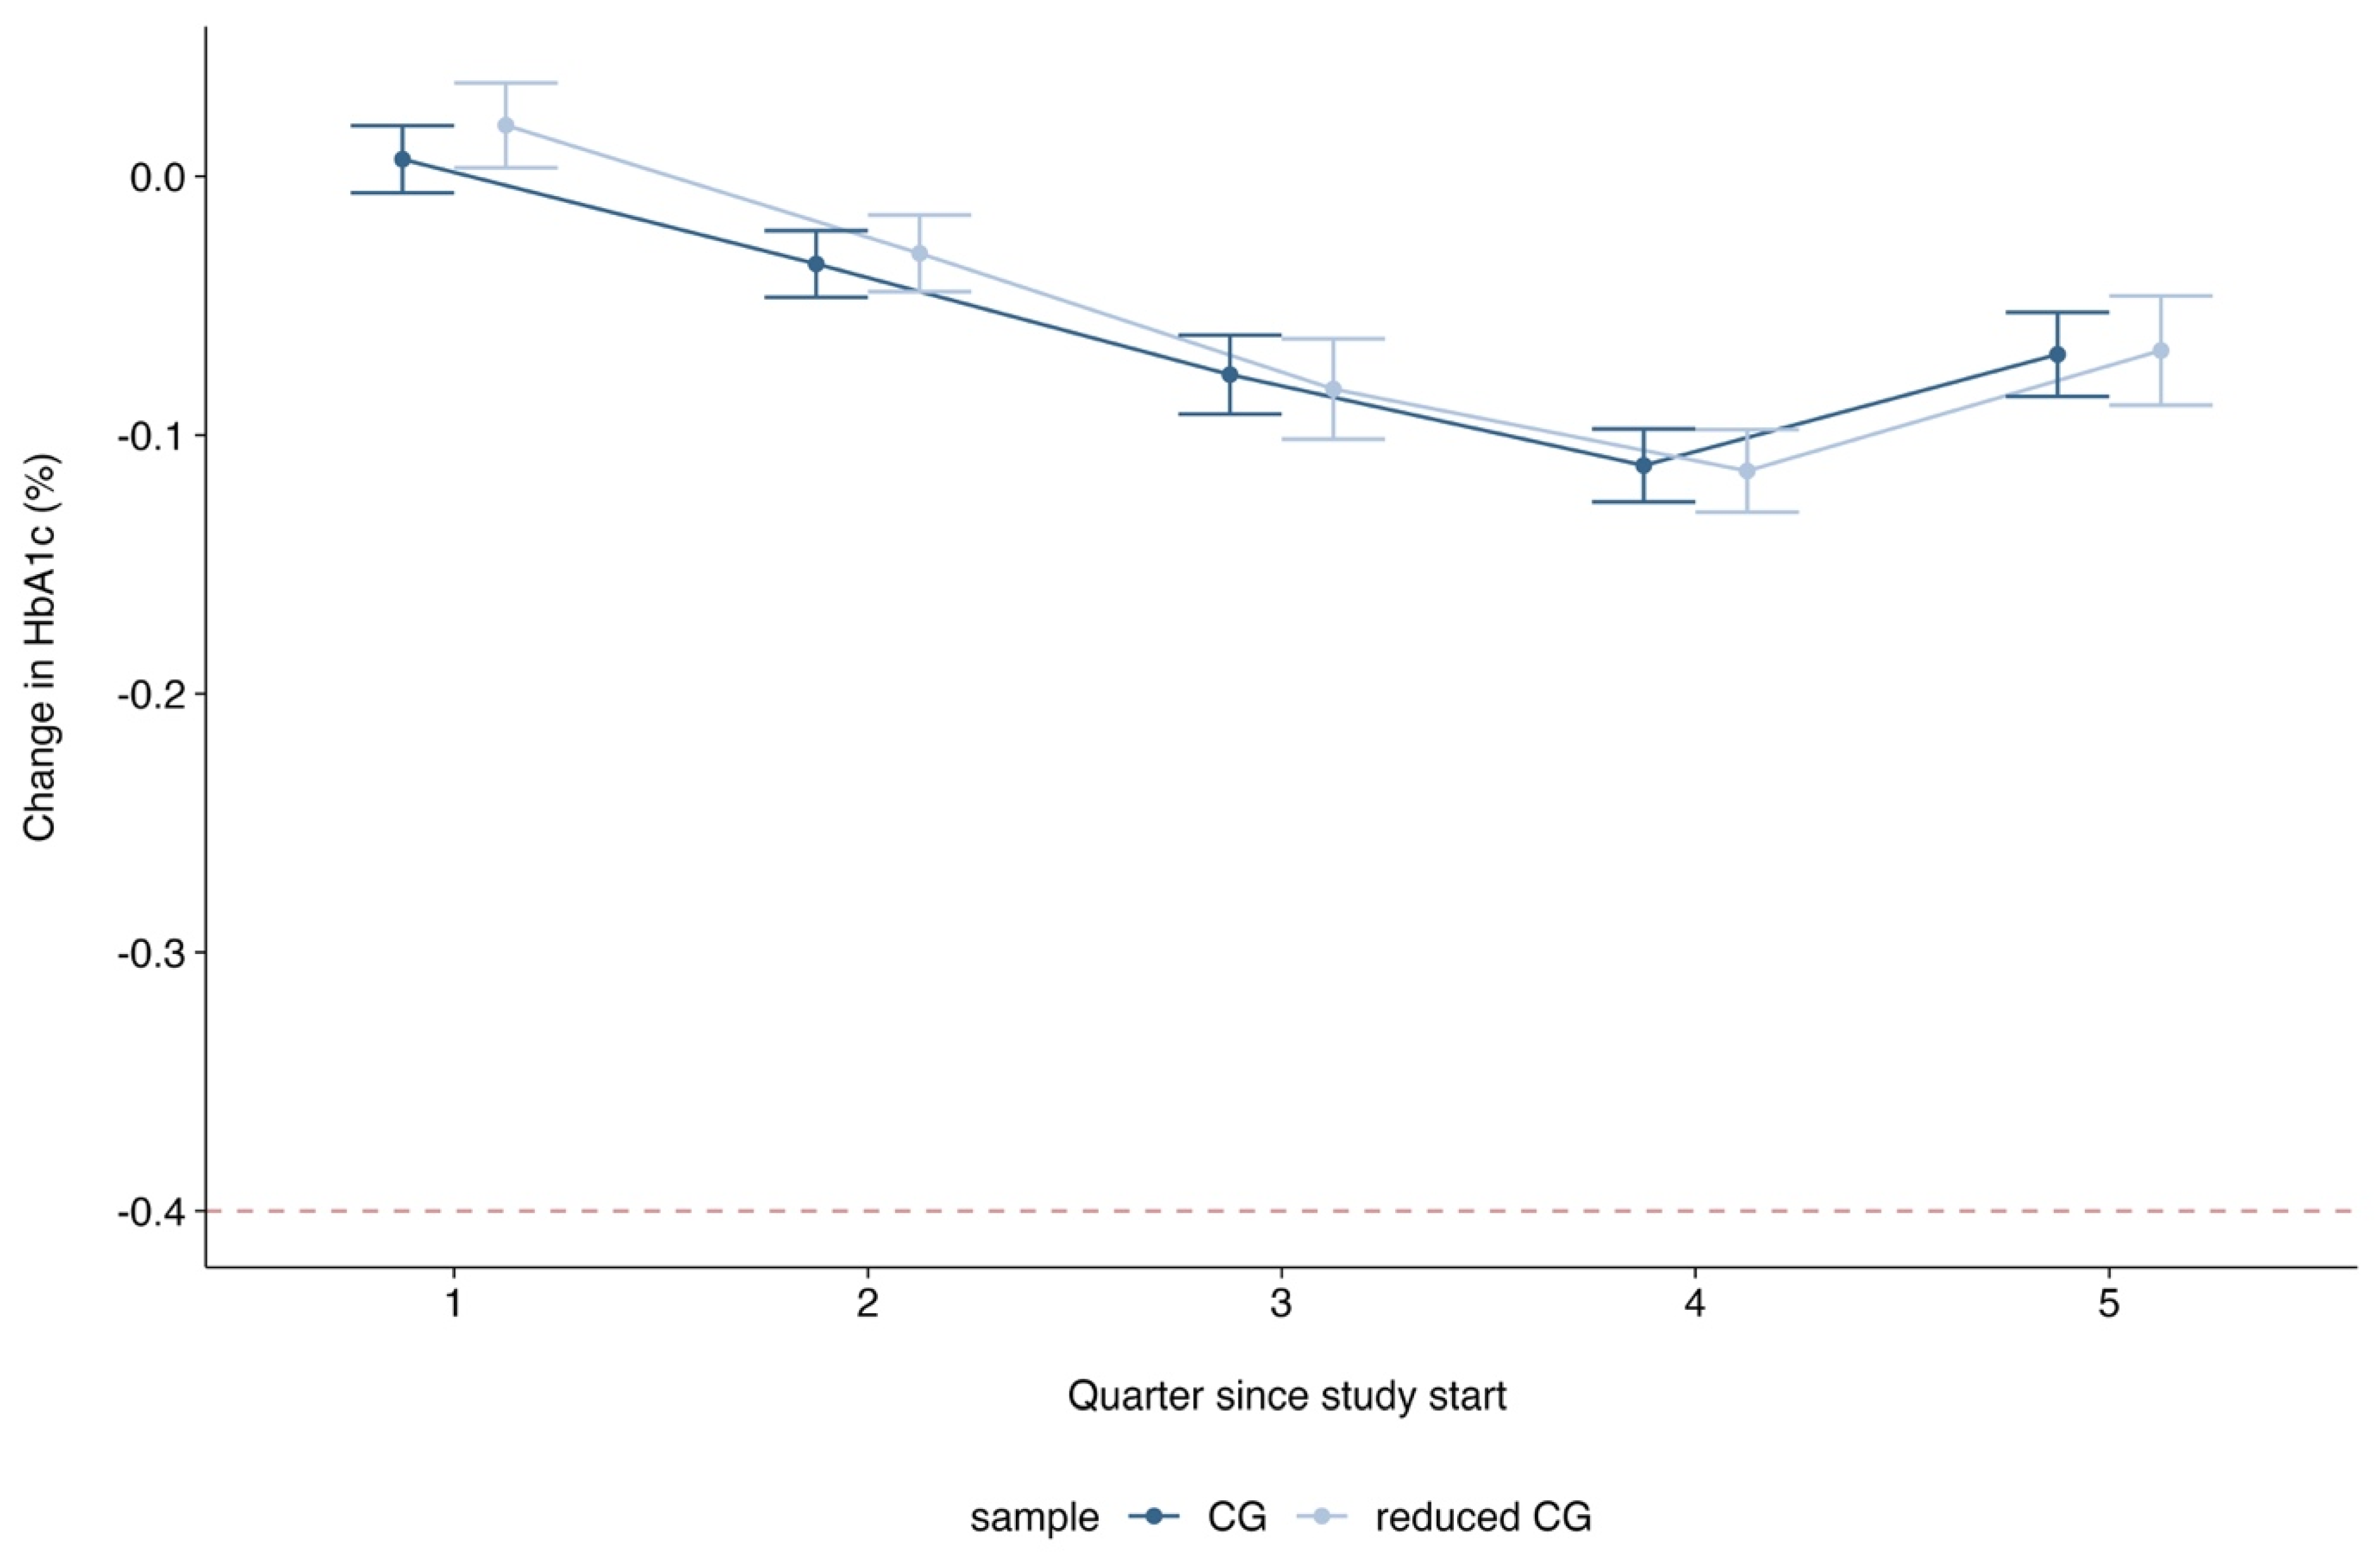
Appendix B.3.3. Exploratory Results
References
- The Emerging Risk Factors Collaboration; Sarwar, N.; Gao, P.; Seshasai, S.R.; Gobin, R.; Kaptoge, S.; Di Angelantonio, E.; Ingelsson, E.; Lawlor, D.A.; Selvin, E.; et al. Diabetes mellitus, fasting blood glucose concentration, and risk of vascular disease: A collaborative meta-analysis of 102 prospective studies. Lancet 2010, 375, 2215–2222. [Google Scholar] [CrossRef] [PubMed]
- International Diabetes Federation (IDF). IDF Diabetes Atlas 2021, 10th ed.; IDF: Brussels, Belgium, 2021. [Google Scholar]
- Cosentino, F.; Grant, P.; Aboyans, V.; Bailey, C.J.; Ceriello, A.; Delgado, V. The Task Force for diabetes, pre-diabetes, and cardiovascular diseases of the European Society of Cardiology (ESC) and the European Association for the Study of Diabetes (EASD). Eur. Heart J. 2020, 41, 255–323. [Google Scholar] [CrossRef]
- Zaharia, O.P.; Lanzinger, S.; Rosenbauer, J.; Karges, W.; Müssig, K.; Meyhöfer, S.M.; Burkart, V.; Hummel, M.; Raddatz, D.; Roden, M.; et al. Comorbidities in Recent-Onset Adult Type 1 Diabetes: A Comparison of German Cohorts. Front. Endocrinol. 2022, 13, 760778. [Google Scholar] [CrossRef]
- Robert-Koch-Institut (RKI). Diabetes in Germany—National Diabetes Surveillance Report 2019; Robert Koch Institute: Berlin, Germany, 2019. [Google Scholar]
- Bundesärztekammer (BÄK); Kassenärztliche Bundesvereinigung (BKV), and Arbeitsgemeinschaft der Wissenschaftlichen Medizinischen Fachgesellschaften (AWMF). Nationale Versorungsleitlinie Typ-2-Diabetes—Teilpublikation der Langfassung, 2. Auflage. Version 1; The Association of the Scientific Medical Societies in Germany (AWMF): Berlin, Germany, 2021. [Google Scholar] [CrossRef]
- Deutsche Diabetes Gesellschaft (DDG). S3-Leitlinie Therapie des Typ-1-Diabetes. Version 2.0. AWMF-Register-Nr. 057-024. 2023. Available online: https://register.awmf.org/assets/guidelines/057-013l_S3-Therapie-Typ-1-Diabetes_2018-08.pdf (accessed on 6 June 2024).
- ElSayed, N.A.; Aleppo, G.; Aroda, V.R.; Bannuru, R.R.; Brown, F.M.; Bruemmer, D.; Collins, B.S.; Hilliard, M.E.; Isaacs, D.; Johnson, E.L. 6. Glycemic Targets: Standards of Care in Diabetes—2023. Diabetes Care 2022, 46 (Suppl. S1), S97–S110. [Google Scholar] [CrossRef]
- Zentralinstitut für die Kassenärztliche Versorgung in der Bundesrepublik Deutschland. DMP-Atlas Nordrhein-Westfalen. Regionalisierte Darstellung der Disease-Management-Programme. 2024. Available online: https://www.zi-dmp.de/dmp-atlas_nrw/dmp_d2_adt.html. (accessed on 7 October 2024).
- Heidemann, C.; Du, Y.; Mauz, E.; Walther, L.; Peitz, D.; Müller, A.; Buchmann, M.; Allen, J.; Scheidt-Nave, C.; Baumert, J. Healthcare and health situation of adults with type 2 diabetes in Germany: The study GEDA 2021/2022-Diabetes. J. Health Monit. 2024, 9, e12128. [Google Scholar] [CrossRef]
- Timpel, P.; Oswald, S.; Schwarz, P.E.H.; Harst, L. Mapping the Evidence on the Effectiveness of Telemedicine Interventions in Diabetes, Dyslipidemia, and Hypertension: An Umbrella Review of Systematic Reviews and Meta-Analyses. J. Med. Internet Res. 2020, 22, e16791. [Google Scholar] [CrossRef]
- Emperra® GmbH E-Health Technologies. Scientific Evaluation of the ESYSTA® S-T-A-R-T Project; 2016. Available online: https://www.emperra.com/wp-content/uploads/2020/06/esysta_start_whitepaper_en_2.0.pdf (accessed on 7 October 2024).
- Ho, D.E.; Imai, K.; King, G.; Stuart, E.A. MatchIt: Nonparametric Preprocessing for Parametric Causal Inference. J. Stat. Softw. 2011, 42, 1–28. [Google Scholar] [CrossRef]
- Austin, P.C. An Introduction to Propensity Score Methods for Reducing the Effects of Confounding in Observational Studies. Multivar. Behav. Res. 2011, 46, 399–424. [Google Scholar] [CrossRef]
- Austin, P.C. A comparison of 12 algorithms for matching on the propensity score. Stat. Med. 2013, 33, 1057–1069. [Google Scholar] [CrossRef]
- Team, R.C. _R: A Language and Environment for Statistical Computing_; R Foundation for Statistical Computing: Vienna, Austria, 2024; Available online: https://www.R-project.org (accessed on 2 October 2024).
- Carpenter, J.R.; Roger, J.H.; Kenward, M.G. Analysis of Longitudinal Trials with Protocol Deviation: A Framework for Relevant, Accessible Assumptions, and Inference via Multiple Imputation. J. Biopharm. Stat. 2013, 23, 1352–1371. [Google Scholar] [CrossRef]
- CGower-Page, C.; Noci, A.; _rbmi: Reference Based Multiple Imputation_. R Package Version 1.2.6. 2023. Available online: https://CRAN.R-project.org/package=rbmi (accessed on 2 October 2024).
- Grund, S.; Lüdtke, O.; Robitzsch, A. Pooling ANOVA Results from Multiply Imputed Datasets: A Simulation Study. Methodology 2016, 12, 75–88. [Google Scholar] [CrossRef]
- van Buuren, S. Flexible Imputation of Missing Data, Second Edition. 2018. Available online: https://stefvanbuuren.name/fimd/ (accessed on 8 April 2022).
- White, I.R.; Royston, P.; Wood, A.M. Multiple imputation using chained equations: Issues and guidance for practice. Stat. Med. 2011, 30, 377–399. [Google Scholar] [CrossRef] [PubMed]
- Stratton, I.M.; Adler, A.I.; Neil, H.A.; Matthews, D.R.; Manley, S.E.; Cull, C.A.; Hadden, D.; Turner, R.C.; Holman, R.R. Association of glycaemia with macrovascular and microvascular complications of type 2 diabetes (UKPDS 35): Prospective observational study. BMJ 2000, 321, 405–412. [Google Scholar] [CrossRef] [PubMed]
- UK Prospective Diabetes Study (UKPDS) Group. Intensive blood-glucose control with sulphonylureas or insulin compared with conventional treatment and risk of complications in patients with type 2 diabetes (UKPDS 33). Lancet 1998, 352, 9131. [Google Scholar] [CrossRef]
- Lachin, J.M.; Genuth, S.; Nathan, D.M.; Zinman, B.; Rutledge, B.N.; DCCT/EDIC Research Group. Effect of Glycemic Exposure on the Risk of Microvascular Complications in the Diabetes Control and Complications Trial—Revisited. Diabetes 2008, 57, 995–1001. [Google Scholar] [CrossRef]
- INFAS (Institut für Angewandte Sozialwissenschaft GmbH). Bericht der Strukturierten Behandlungsprogramme der Gesetzlichen Krankenkassen—Indikation Diabetes Mellitus Typ 1. Erstellt Durch Infas und MNC. Die Qesetzlichen Krankenkassen. 2021. Available online: https://www.barmer.de/resource/blob/1032236/d2577854d3ce4eaf22fe68846219c9f9/evaluationsbericht-dmp-mellitus-typ-2021-data.pdf (accessed on 26 June 2024).
- Holmen, H.; Torbjørnsen, A.; Wahl, A.K.; Jenum, A.K.; Småstuen, M.C.; Årsand, E.; Ribu, L. A Mobile Health Intervention for Self-Management and Lifestyle Change for Persons with Type 2 Diabetes, Part 2: One-Year Results from the Norwegian Randomized Controlled Trial RENEWING HEALTH. JMIR mHealth uHealth 2014, 2, e57. [Google Scholar] [CrossRef]
- Kulzer, B.; Daenschel, W.; Daenschel, I.; Schramm, W.; Messinger, D.; Weissmann, J.; Vesper, I.; Parkin, C.G.; Heinemann, L. Integrated personalized diabetes management improves glycemic control in patients with insulin-treated type 2 diabetes: Results of the PDM-ProValue study program. Diabetes Res. Clin. Pract. 2018, 144, 200–212. [Google Scholar] [CrossRef]
- Ruissen, M.M.; Torres-Peña, J.D.; Uitbeijerse, B.S.; de Larriva, A.P.A.; Huisman, S.D.; Namli, T.; Salzsieder, E.; Vogt, L.; Ploessnig, M.; van der Putte, B.; et al. Clinical impact of an integrated e-health system for diabetes self-management support and shared decision making (POWER2DM): A randomised controlled trial. Diabetologia 2023, 66, 2213–2225. [Google Scholar] [CrossRef]
- Clodi, M.; Abrahamian, H.; Brath, H.; Brix, J.; Drexel, H.; Fasching, P.; Föger, B.; Francesconi, C.; Fröhlich-Reiterer, E.; Harreiter, J.; et al. Antihyperglykämische Therapie bei Diabetes mellitus Typ 2 (Update 2019). Wien. Klin. Wochenschr. 2019, 131, 27–38. [Google Scholar] [CrossRef]
- Mora, P.; Buskirk, A.; Lyden, M.; Parkin, C.G.; Borsa, L.; Petersen, B. Use of a Novel, Remotely Connected Diabetes Management System Is Associated with Increased Treatment Satisfaction, Reduced Diabetes Distress, and Improved Glycemic Control in Individuals with Insulin-Treated Diabetes: First Results from the Personal Diabetes Management Study. Diabetes Technol. Ther. 2017, 19, 715. [Google Scholar] [CrossRef]
- Mayer, H.; Bankosegger, R.P.; Kober, J. 953-P: Sustainable Improvement in Quality of Blood Glucose Control in Users of mySugr’s Integrated Diabetes Management Solution. Diabetes 2019, 68 (Suppl. S1), 953-P. [Google Scholar] [CrossRef]
- Ehrmann, D.; Hermanns, N.; Finke-Gröne, K.; Roos, T.; Kober, J.; Schäfer, V.; Krichbaum, M.; Haak, T.; Ziegler, R.; Heinemann, L.; et al. Efficacy of a Digital Diabetes Logbook for People with Type 1, Type 2, and Gestational Diabetes: Results From a Multicenter, Open-Label, Parallel-Group, Randomized Controlled Trial. J. Diabetes Sci. Technol. 2024. [Google Scholar] [CrossRef] [PubMed]
- Andre, E.B.; Reynolds, R.; Caubel, P.; Azoulay, L.; Dreyer, N.A. Trial designs using real-world data: The changing landscape of the regulatory approval process. Pharmacoepidemiol. Drug Saf. 2020, 29, 1201–1212. [Google Scholar] [CrossRef] [PubMed]
- Cave, A.; Kurz, X.; Arlett, P. Real-World Data for Regulatory Decision Making: Challenges and Possible Solutions for Europe. Clin. Pharmacol. Ther. 2019, 106, 36–39. [Google Scholar] [CrossRef] [PubMed]
- Riedl, R.; Robausch, M.; Berghold, A.; Savarese, G. Disease Management Program in patients with type 2 diabetes mellitus, long-term results of the early and established program cohort: A population-based retrospective cohort study. PLoS ONE 2022, 17, e0279090. [Google Scholar] [CrossRef] [PubMed]
- Li, J.; Sun, L.; Wang, Y.; Guo, L.; Li, D.; Liu, C.; Sun, N.; Xu, Z.; Li, S.; Jiang, Y.; et al. A Mobile-Based Intervention for Glycemic Control in Patients with Type 2 Diabetes: Retrospective, Propensity Score-Matched Cohort Study. JMIR mHealth uHealth 2020, 8, e15390. [Google Scholar] [CrossRef]
- Salunkhe, V.A.; Sinha, N.; Ahlqvist, E.; Prasad, R.B.; Johansson, S.; Abrahamsson, B.; Rosengren, A.H. Digital lifestyle treatment improves long-term metabolic control in type 2 diabetes with different effects in pathophysiological and genetic subgroups. NPJ Digit. Med. 2023, 6, 199. [Google Scholar] [CrossRef]
- King, G.; Nielsen, R. Why Propensity Scores Should Not Be Used for Matching. Political Anal. 2019, 27, 435–454. [Google Scholar] [CrossRef]
- INFAS (Institut für Angewandte Sozialwissenschaft GmbH). Bericht der Strukturierten Behandlungsprogramme der Gesetzlichen Krankenkassen—Indikation Diabetes Mellitus Typ 2 Erstellt Durch Infas und MNC’, Die Gesetzlichen Krankenkassen. 2024. Available online: https://www.barmer.de/resource/blob/1023672/de3e2ccb334e697436e2e226c2e5f144/besser-leben-programm-evaluationsbericht-infas-diabetes-typ2-data.pdf (accessed on 26 June 2024).

| IG Sample | CG Sample | |
|---|---|---|
| (N = 191) | (N = 24.042) | |
| Baseline HbA1c (in %) | ||
| Mean (SD) | 8.66 (1.31) | 7.67 (1.37) |
| Median [Min, Max] | 8.40 [6.60, 14.5] | 7.50 [1.10, 19.1] |
| Type of Diabetes | ||
| T1DM | 32 (16.8%) | 1301 (5.4%) |
| T1DM and T2DM | 0 (0%) | 134 (0.6%) |
| T2DM | 159 (83.2%) | 22,607 (94.0%) |
| Gender | ||
| Male | 116 (60.7%) | 11,574 (48.1%) |
| Female | 75 (39.3%) | 12,468 (51.9%) |
| Age | ||
| Mean (SD) | 60.9 (13.5) | 71.2 (11.5) |
| Median [Min, Max] | 62.0 [23.0, 86.0] | 74.0 [21.0, 92.0] |
| Std. Mean Diff. | Var. Ratio | eCDF Mean | |
|---|---|---|---|
| Before Matching | |||
| Distance | 0.395 | 6.593 | 0.253 |
| Baseline HbA1c (in %) | 0.754 | 0.913 | 0.080 |
| Type of Diabetes | |||
| T1DM | 0.304 | 0.113 | |
| T1DM and T2DM | −0.075 | 0.006 | |
| T2DM | −0.289 | 0.108 | |
| Gender | |||
| Male | 0.258 | 0.126 | |
| Female | −0.258 | 0.126 | |
| Age | −0.764 | 1.383 | 0.143 |
| After Matching (1:1) | |||
| Distance | 0.016 | 1.242 | 0.004 |
| Baseline Hba1c (in %) | −0.002 | 1.006 | 0.002 |
| Type of Diabetes | |||
| T1DM | 0.000 | 0.000 | |
| T1DM and T2DM | 0.000 | 0.000 | |
| T2DM | 0.000 | 0.000 | |
| Gender | |||
| Male | 0.011 | 0.005 | |
| Female | −0.011 | 0.005 | |
| Age | −0.005 | 1.005 | 0.004 |
| After Matching (1:2) | |||
| Distance | 0.031 | 1.625 | 0.021 |
| Baseline Hba1c (in %) | 0.000 | 1.007 | 0.031 |
| Type of Diabetes | |||
| T1DM | 0.000 | 0.000 | |
| T1DM and T2DM | 0.000 | 0.000 | |
| T2DM | 0.000 | 0.000 | |
| Gender | |||
| Male | 0.000 | 0.000 | |
| Female | 0.000 | 0.000 | |
| Age | −0.009 | 1.052 | 0.021 |
| IG Sample | CG Sample | CG Sample 2 | |
|---|---|---|---|
| (N = 191) | (N = 191) | (N = 382) | |
| Baseline HbA1c (in %) | |||
| Mean (SD) | 8.66 (1.31) | 8.66 (1.31) | 8.66 (1.31) |
| Median [Min, Max] | 8.40 [6.60, 14.5] | 8.40 [6.60, 14.4] | 8.40 [6.60, 14.4] |
| Type of Diabetes | |||
| T1DM | 32 (16.8%) | 32 (16.8%) | 64 (16.8%) |
| T2DM | 159 (83.2%) | 159 (83.2%) | 318 (83.2%) |
| Gender | |||
| Male | 116 (60.7%) | 115 (60.2%) | 232 (60.7%) |
| Female | 75 (39.3%) | 76 (39.8%) | 150 (39.3%) |
| Age | |||
| Mean (SD) | 60.9 (13.5) | 61.0 (13.5) | 61.0 (13.1) |
| Median [Min, Max] | 62.0 [23.0, 86.0] | 62.0 [21.0, 86.0] | 61.0 [21.0, 86.0] |
| Analysis | Quarter | IG | CG |
|---|---|---|---|
| CIR | 1 | −0.43 [−0.62; −0.24] | −0.04 [−0.23; 0.16] |
| CIR | 2 | −0.60 [−0.79; −0.42] | −0.16 [−0.34; 0.03] |
| CIR | 3 | −0.59 [−0.78; −0.39] | −0.25 [−0.46; −0.05] |
| CIR | 4 | −0.66 [−0.85; −0.46] | −0.36 [−0.54; −0.17] |
| CIR | 5 | −0.73 [−0.95; −0.52] | −0.41 [−0.61; −0.21] |
| PP | 1 | −0.48 [−0.69; −0.28] | −0.06 [−0.26; 0.15] |
| PP | 2 | −0.68 [−0.88; −0.49] | −0.24 [−0.43; −0.05] |
| PP | 3 | −0.69 [−0.90; −0.48] | −0.25 [−0.46; −0.04] |
| PP | 4 | −0.67 [−0.87; −0.47] | −0.38 [−0.57; −0.19] |
| PP | 5 | −0.87 [−1.08; −0.65] | −0.46 [−0.66; −0.25] |
| 2:1 (MAR) | 1 | −0.49 [−0.68; −0.30] | −0.09 [−0.24; 0.06] |
| 2:1 (MAR) | 2 | −0.65 [−0.83; −0.46] | −0.14 [−0.29; 0.00] |
| 2:1 (MAR) | 3 | −0.63 [−0.83; −0.44] | −0.30 [−0.45; −0.15] |
| 2:1 (MAR) | 4 | −0.68 [−0.86; −0.49] | −0.33 [−0.48; −0.18] |
| 2:1 (MAR) | 5 | −0.81 [−1.01; −0.61] | −0.36 [−0.51; −0.21] |
| Quarter | Hypothesis | Estimate (95% CI) | t-Statistic | df | pFDR | Cohen’s d |
| CIR | ||||||
| 2 | IG | −0.60 [−0.79; −0.42] | −2.133 | 665 | 0.017 * | −0.49 [−0.64, −0.33] |
| 2 | IG vs. CG | −0.45 [−0.67; −0.22] | −3.884 | 829 | <0.0001 *** | −0.27 [−0.41, −0.13] |
| 4 | IG | −0.66 [−0.85; −0.46] | −2.601 | 665 | 0.005 ** | −0.52 [−0.67, −0.36] |
| 4 | IG vs. CG | −0.30 [−0.53; −0.07] | −2.539 | 829 | 0.011 ** | −0.18 [−0.31, −0.04] |
| PP | ||||||
| 2 | IG | −0.68 [−0.88; −0.49] | −2.835 | 603 | 0.002 ** | −0.54 [−0.70, −0.38] |
| 2 | IG vs. CG | −0.44 [−0.68; −0.20] | −3.601 | 707 | <0.0001 *** | −0.27 [−0.42, −0.12] |
| 4 | IG | −0.67 [−0.87; −0.47] | −2.614 | 641 | 0.005 ** | −0.52 [−0.67, −0.36] |
| 4 | IG vs. CG | −0.28 [−0.53; −0.04] | −2.271 | 731 | 0.023 * | −0.17 [−0.31, −0.02] |
| 2:1 (MAR) | ||||||
| 2 | IG | −0.65 [−0.83; −0.46] | −2.647 | 1026 | 0.004 * | −0.43 [−0.56, −0.31] |
| 2 | IG vs. CG | −0.50 [−0.71; −0.30] | −4.845 | 1222 | <0.0001 *** | −0.28 [−0.39, −0.16] |
| 4 | IG | −0.68 [−0.86; −0.49] | −2.955 | 1069 | 0.002 ** | −0.44 [−0.56, −0.32] |
| 4 | IG vs. CG | −0.34 [−0.55; −0.14] | −3.262 | 1292 | 0.001 * | −0.18 [−0.29, −0.07] |
Disclaimer/Publisher’s Note: The statements, opinions and data contained in all publications are solely those of the individual author(s) and contributor(s) and not of MDPI and/or the editor(s). MDPI and/or the editor(s) disclaim responsibility for any injury to people or property resulting from any ideas, methods, instructions or products referred to in the content. |
© 2025 by the authors. Licensee MDPI, Basel, Switzerland. This article is an open access article distributed under the terms and conditions of the Creative Commons Attribution (CC BY) license (https://creativecommons.org/licenses/by/4.0/).
Share and Cite
Roth, L.; Wagner, C.J.; Riesner, P.; Krage, B.; Steckhan, N.; Schwarz, P.E.H. Evaluation of a Digital Health Application for Diabetics Under Real-World Conditions: Superior Outcomes Compared to Standard Care in an Observational Matched Case–Control Study. Diabetology 2025, 6, 85. https://doi.org/10.3390/diabetology6090085
Roth L, Wagner CJ, Riesner P, Krage B, Steckhan N, Schwarz PEH. Evaluation of a Digital Health Application for Diabetics Under Real-World Conditions: Superior Outcomes Compared to Standard Care in an Observational Matched Case–Control Study. Diabetology. 2025; 6(9):85. https://doi.org/10.3390/diabetology6090085
Chicago/Turabian StyleRoth, Lena, Christoph J. Wagner, Petra Riesner, Birgit Krage, Nico Steckhan, and Peter E. H. Schwarz. 2025. "Evaluation of a Digital Health Application for Diabetics Under Real-World Conditions: Superior Outcomes Compared to Standard Care in an Observational Matched Case–Control Study" Diabetology 6, no. 9: 85. https://doi.org/10.3390/diabetology6090085
APA StyleRoth, L., Wagner, C. J., Riesner, P., Krage, B., Steckhan, N., & Schwarz, P. E. H. (2025). Evaluation of a Digital Health Application for Diabetics Under Real-World Conditions: Superior Outcomes Compared to Standard Care in an Observational Matched Case–Control Study. Diabetology, 6(9), 85. https://doi.org/10.3390/diabetology6090085


