Article

Evaluation of a Digital Health Application for Diabetics Under Real-World Conditions: Superior Outcomes Compared to Standard Care in an Observational Matched Case–Control Study

1
Faculty of Medicine, University Hospital Carl Gustav Carus, at the Technical University Dresden, Fetscherstraße 74, 01307 Dresden, Germany
2
AOK Nordost, Department of Healthcare Management, Wilhelmstrasse 1, 10963 Berlin, Germany
*
Author to whom correspondence should be addressed.
Diabetology 2025, 6(9), 85; https://doi.org/10.3390/diabetology6090085
Submission received: 14 April 2025 / Revised: 24 June 2025 / Accepted: 27 June 2025 / Published: 25 August 2025

Abstract

Background: The present study aims to evaluate the effectiveness of ESYSTA® (Emperra GmbH E-Health Technologies, Germany), a CE-certified digital health application made to support insulin-treated diabetes patients to improve their disease management through better self-empowerment. Methods: To evaluate the effectiveness of ESYSTA®, data from patients who used ESYSTA® for at least 12 months and participated in an originally prospective one-arm study were evaluated. This study was conducted in cooperation with the German health insurance company AOK Nordost (2012–2015). From a real-world data pool of insured AOK Nordost patients, a control group was matched to mimic a controlled trial that allows the use of ESYSTA® to be compared with standard care in the context of a disease management program (DMP). Results: The study results show significant and clinically relevant reductions in HbA1c values of at least 0.4% in ESYSTA® users after 6 months. After 12 months, users achieved, on average, an HbA1c reduction of approximately 0.7%. These reductions are more pronounced compared to the matched control group. Conclusions: The present study shows the effectiveness of the digital health application ESYSTA®. Using a matched control group further increased the internal and external validity of the study results.

1. Introduction

Diabetes mellitus is a non-communicable disease characterized by chronic hyperglycemia (i.e., raised levels of blood glucose) due to defects in insulin secretion, insulin action, or both [1,2]. Diabetes and chronic hyperglycemia including comorbidities and associated risks impose a substantial health burden, impacting both the physical and mental well-being of patients and their families [3,4]. The most common type of diabetes mellitus is type 2 (T2DM), accounting for more than 90% of diabetes patients worldwide. It is also one of the leading causes of death and disability-adjusted life years globally [2]. The development of T2DM is strongly linked to lifestyle factors like sedentary behavior, high-caloric diets, and smoking and alcohol consumption, and risk factors include overweight and obesity, as well as high blood pressure and hyperlipidemia [2,5]. Insulin resistance in T2DM patients develops slowly, and the onset of disease usually occurs in the second half of life [6]. In contrast, diabetes mellitus type 1 (T1DM) mostly manifests in childhood or early adulthood. In T1DM the body’s immune system attacks and destroys the insulin-producing beta cells in the pancreas, leading to a severe insulin deficiency [7].
T1DM and T2DM have distinct pathophysiologies and require different clinical management for each condition. While T1DM patients require immediate and lifelong insulin therapy due to absolute insulin deficiency, the focus for patients with T2DM initially is lifestyle modification with the gradual addition of pharmacotherapy including a potential, gradual introduction of insulin treatment [7,8]. In Germany, approximately one third of T2DM patients receive insulin [9,10]. In any case, insulin therapy requires sufficient self-management abilities and the monitoring of blood glucose. Several systematic reviews highlight the efficacy of digital tools in aiding patients with diabetes by improving their self-management [11]. Advanced technologies play a pivotal role in enhancing different aspects of patient care to improve diabetes-related health outcomes, facilitate patient and health care communication, and improve overall quality of care. Therefore, they are increasingly emphasized in diabetes management guidelines [8].
This study aims to evaluate the effectiveness of ESYSTA®, a CE-certified digital health application to support insulin-treated adult patients with diabetes in real-world care conditions to improve their self-management, expressed as a reduction in HbA1c values.

2. Subjects, Materials, and Methods

2.1. Study Design

The present START-II trial is a retrospective re-analysis of data from a previously conducted single-arm trial (START-I trial). To compare the change in HbA1c values of the intervention group (IG) of the START-I trial with a control group (CG), the START-II trial aims at re-analyzing the data of the IG, including data of a matched CG from an AOK Nordost sample to test the effect of ESYSTA® in comparison to SoC. Outcomes for IG and CG were retrospectively extracted from standard quarterly documentation of DMP patients (T1DM/T2DM), mostly performed by general practitioners administering the DMP.
The START-I trial is a one-arm, observational study in cooperation with the AOK Nordost statutory health insurance company. AOK Nordost operates in three northeastern federal states of Germany. The trial was carried out between 2012 and 2015 in the federal states of Brandenburg and Berlin.
Patients with either T1DM or T2DM that were insured at the AOK Nordost and participated in the federally regulated and widespread disease management programs (DMPs) for their respective indication (T1DM or T2DM), which is the standard diabetes care in Germany, could be recruited in this study. Further inclusion criteria were diabetic treatment with insulin and an HbA1c baseline above 7.5%.
Recruited patients were granted access to ESYSTA® for one year within the START-I trial. Previously, the prospective START-I-trial aimed at analyzing HbA1c values reported within the ESYSTA® portal from the IG to test the effect of ESYSTA® application on HbA1c levels in patients with T1DM and T2DM in addition to the standard of care (SoC) (i.e., disease management program—DMP) [12].
For the present START-II-trial, patient characteristics relevant for matching (age, gender, indication) were retrospectively extracted from AOK Nordost claims and master data. Assuming mainly quarterly visits to the doctor as per the DMP, HbA1c is assessed approximately once per quarter or at least bi-quarterly. The observational period in this study compromised 15 months, i.e., up to 6 HbA1c assessments (baseline/quarter 0; 3 months/quarter 1; 6 months/quarter 2; 9 months/quarter 3; 12 months/quarter 4; 12 months/quarter 5). Since the present study was conducted under real-world conditions and patients might not always visit their doctor regularly, missing data are to be expected.

2.2. Intervention

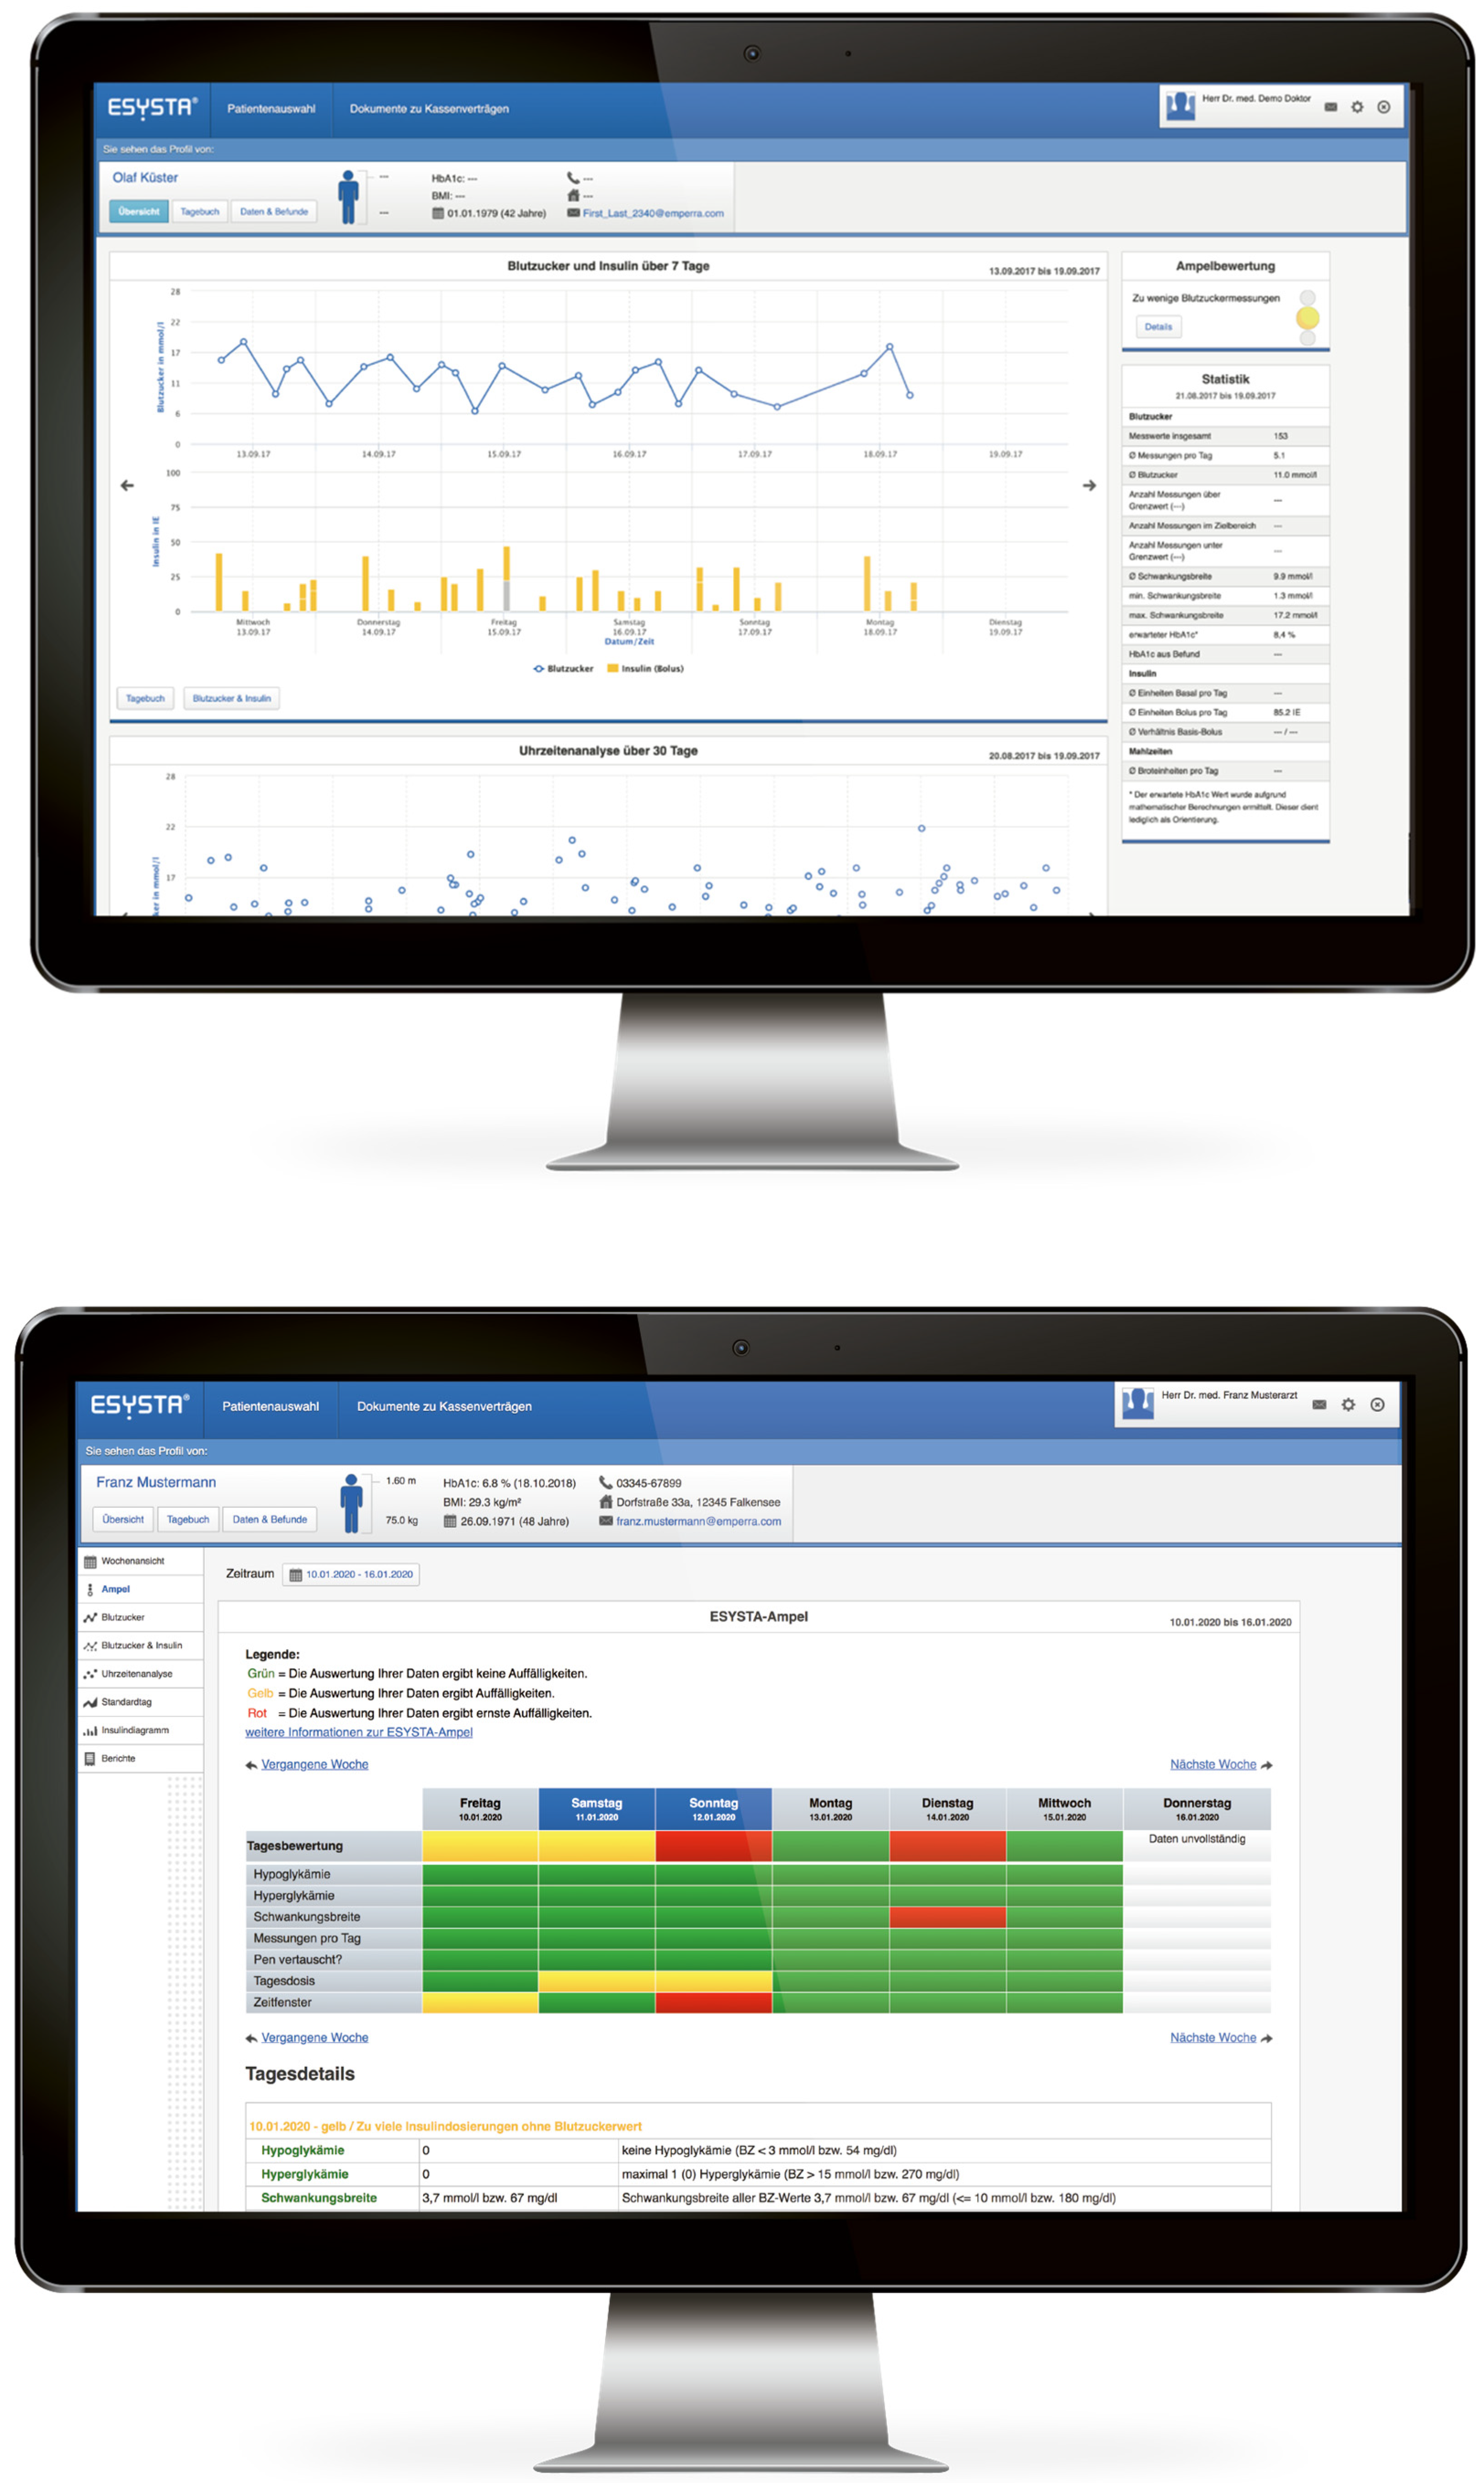
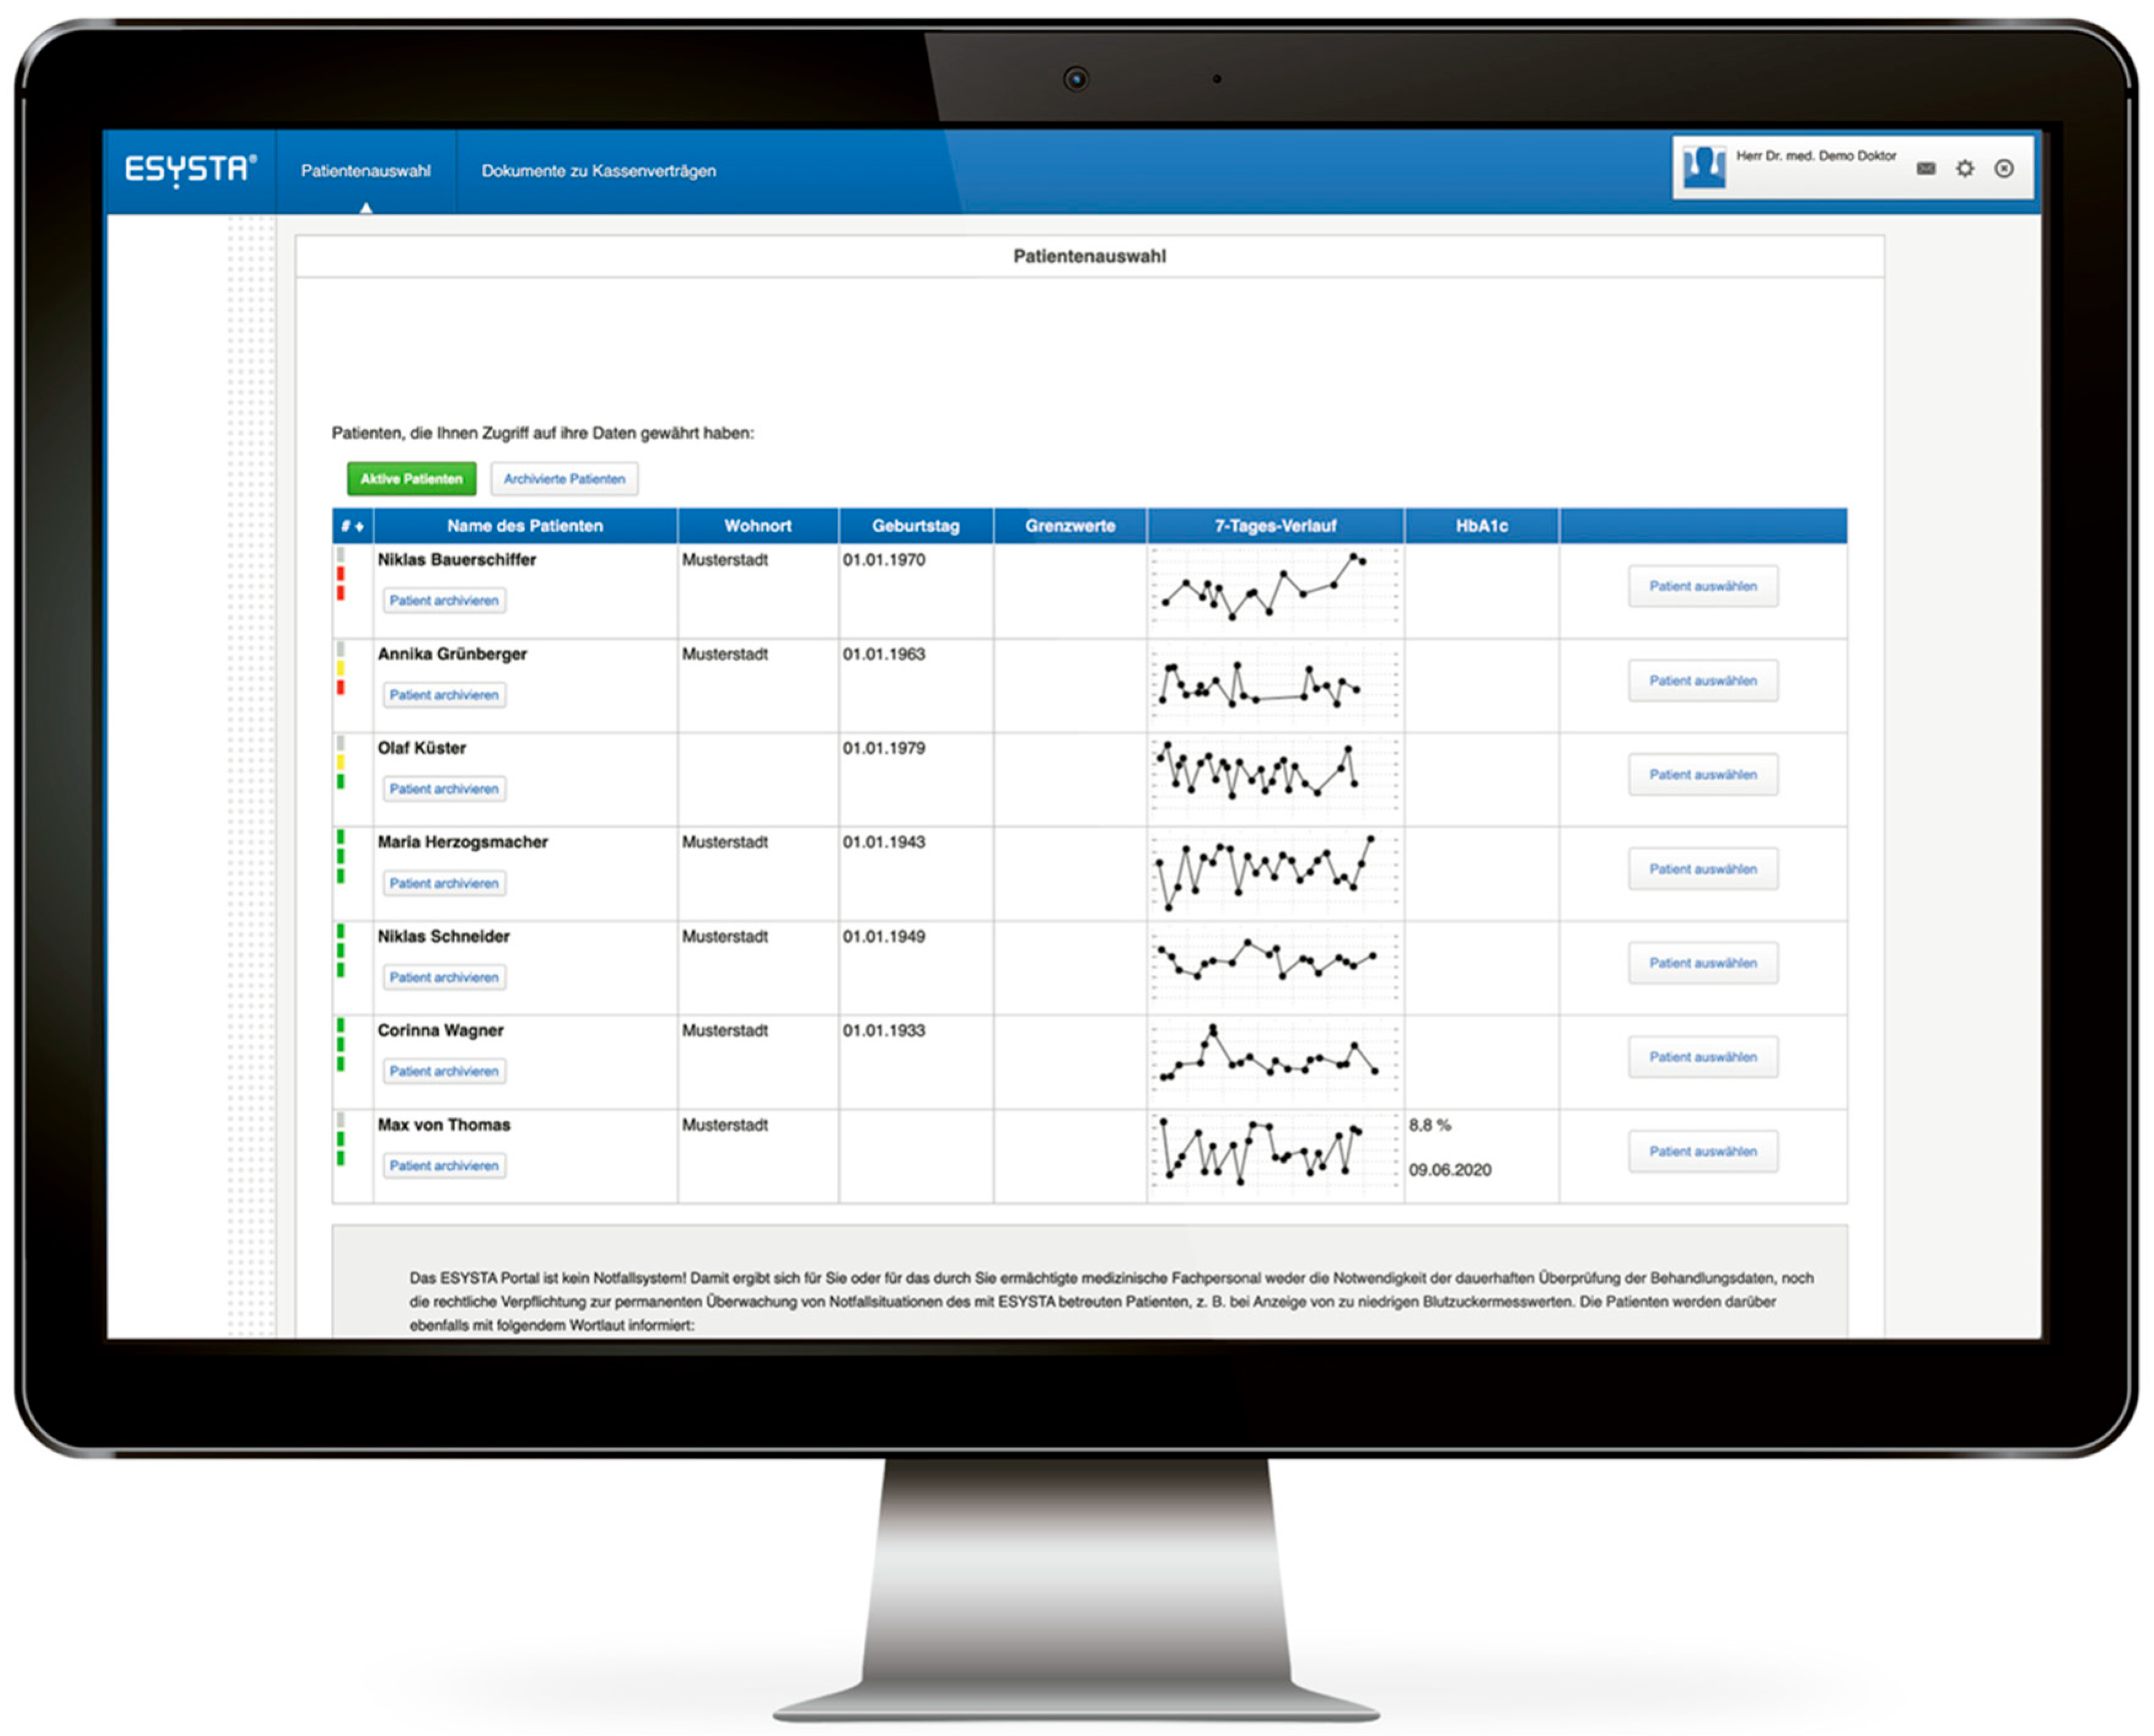
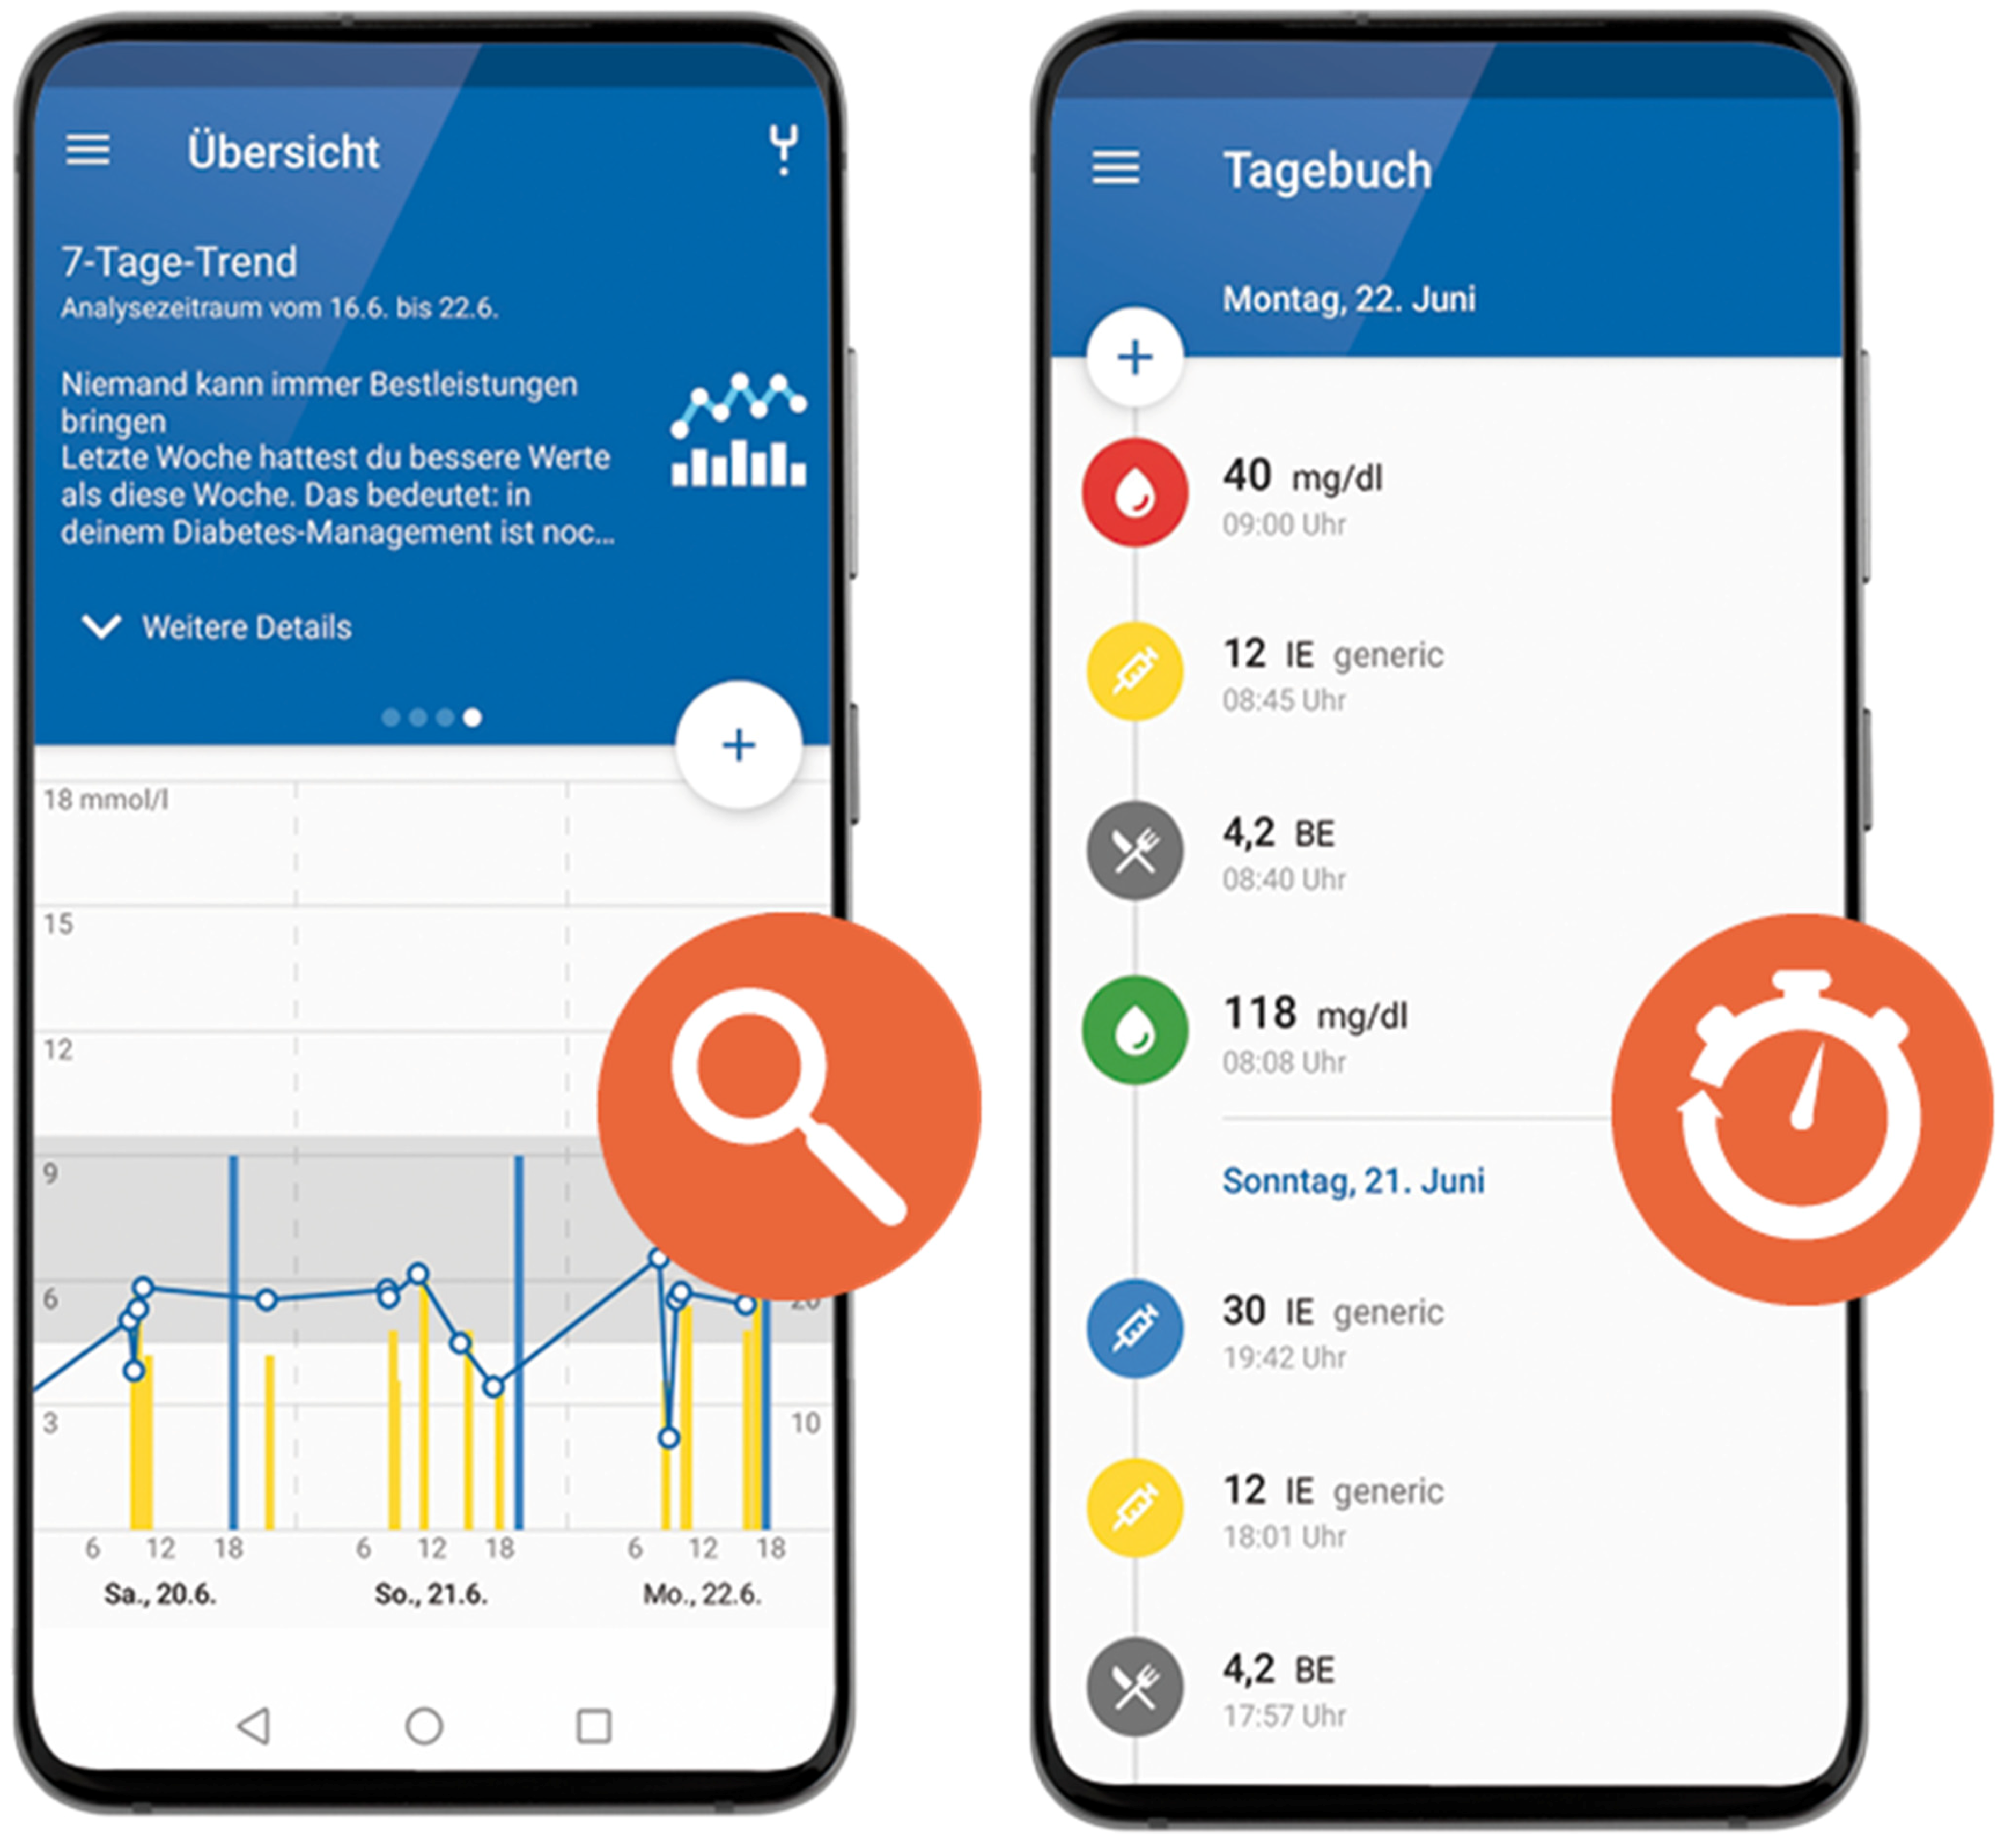
ESYSTA® (V1) is a digital health application developed by Emperra GmbH E-Health Technologies (Potsdam, Germany) to support patients with diabetes to improve their disease management. Relevant health data like glucose readings and insulin dosages can be transferred to the web-based ESYSTA® app and ESYSTA® portal either manually or automatically by using ESYSTA®-compatible devices with wireless communication, like smart pens or blood glucose meters. Special algorithms continuously analyze and evaluate the data, e.g., a profile comparison of threshold values; any insulin used; daily blood glucose curves (3- or 7-day view); insulin doses; and a traffic light system that provides a quick overview of critical values or incorrect doses. Visualized and analyzed health data can be accessed via the ESYSTA® app and ESYSTA® portal to help patients make informed decisions about their diabetes management. The patient may also grant the medical care team access to the ESYSTA® portal to improve communication between health care provider and patient. Finally, the software supports patients with automatically generated empowerment messages and suggests individually tailored prevention offers. A description of the functions of the ESYSTA® app and portal, as well as screenshots, can be found in Table A1 and Figure A1 and Figure A2.

2.3. Participants and Matching

For the matching procedure, the R package MatchIt (Version number 4.5.5) [13] was used, allowing logistic regression to be implemented with group (IG or standard care/CG) as the dependent variable and relevant baseline covariates as independent variables. Considering the main outcome, changes in HbA1c values, one of the most relevant confounders is the baseline HbA1c value (in %) [11]. Therefore, the goal was to match the baseline HbA1c value as accurately as possible (max. 0.1% deviation between matched subjects). Other relevant covariates and confounders that will be included in the model were age (in years), gender (female/male/diverse), and the type of diabetes (T1DM/T2DM) [11]. To match subjects, these baseline covariates had to be available for all patients. The baseline HbA1c value for both groups was defined as the first available data point in the intervention period, e.g., after September 2012. Follow-up HbA1c values were chosen based on the quarters, i.e., the last available HbA1c value in the quarters following the baseline quarter. In order to calculate changes in HbA1C after baseline, patients had to have at least one additional HbA1C value assessed after baseline. Both groups were reduced by this approach, before matching was performed.
Since the goal of the current study design was to mimic a controlled trial, 1:1 matching was performed, i.e., each control unit should be matched to one intervention unit [14]. Additionally, matching without replacement was performed, and the order in which pairs would be matched was random. In this way, selection bias due to incomplete matching of the control units was reduced, and the selection process of the controls was similar to a random selection of a set of untreated units [15]. To assess the success of the matching quality, the standardized mean differences between groups before and after matching were calculated. For balanced covariates, standardized mean differences should be close to zero, and baseline characteristics in the two groups should be comparable. In cases where covariates were not balanced or IG units remained, the matching approach had to be adjusted. The pre-defined matching in the statistical analysis plan (SAP) and the steps to arrive at the final method are reported in Appendix B.

2.4. Outcomes

The primary outcome of the START-II trial is the change in HbA1c after 12 months, and the secondary endpoint is the change in HbA1c levels after 6 months. For both endpoints, the following hypotheses were tested:
  • H1.1/H1.1: The IG using ESYSTA® shows a clinically relevant reduction in HbA1c (in %) after 6/12 months.
  • H2.1/H2.2: The IG using ESYSTA® shows a more pronounced HbA1c (in %) reduction compared to the CG after 6/12 months.
Further exploratory outcomes are the proportion of patients reaching their HbA1c treatment goals of <7.0% and <6.5% [3,8].

2.5. Statistical Analysis

For the data analysis, R software version 4.3 was used [16]. The primary confirmatory analysis was based on an intention-to-treat analysis (ITT), i.e., all patients of the IG as well as the matched patients for the CG were analyzed independent of protocol deviations. Missing HbA1c data were imputed based on the copy increments in reference (CIR) procedure with the R package rbmi as described by [17,18]. Under CIR, monotone missing values of the IG were imputed based on the values of the CG, while still considering the available measures before the missing data occurred. This process fit the assumption that the course of the disease (in the case of the current study, the course of the HbA1c) of a patient, who stopped having available data points, was comparable to the average patient receiving the SoC. Missing values in the CG were imputed based on the CG. For imputation, all relevant covariates that were part of the analysis model (i.e., age in years, gender, type of diabetes, baseline HbA1c in %) were used for imputation, and 100 random datasets were created and pooled for analysis [19,20,21]. Furthermore, a per-protocol analysis (PP) consisting of all subjects that participated in the trial as intended, according to the START-II trial protocol (i.e., with baseline HbA1c values within the range of 7.5% to 11%), was conducted as a sensitivity analysis. To further test the robustness of the results generated by matching, a second matching with 1:2 ratio was carried out. For the 1:2 matching, missing data were assumed to be missing at random. Lastly, sensitivity analysis based on the complete CG sample was performed (see Appendix B).
The statistical model used for the primary analysis was an analysis of variance with repeated measures (ANCOVA). For this, a linear mixed model was fitted with HbA1c change from baseline as a dependent variable. Treatment and time (as the within-subject factor corresponding to quarters 1–5) and their interaction were included as fixed effects. The covariates, already used for matching, age (in years), type of diabetes, gender, and baseline HbA1c (in %) were included to control for confounding. For the latter (baseline HbA1c value), an interaction with time was included because the importance of the baseline will usually decrease over time. Additionally, to account for individual differences, a random intercept for each individual was included. For the analysis with the 2:1 matching, the matching weights were included in the model to account for the higher amount of CG patients. To show the superiority of ESYSTA® compared to the CG receiving SoC, a significant main effect of the factor group based on the described linear model showed general superiority. To look at the general but also superior intervention effect at 6 and 12 months of the IG, planned contrasts were used. For the IG after 6 and 12 months against an expected reduction of 0.4% and for the between-group differences, the HbA1c changes after 6 and 12 months were compared with emmeans::test.

3. Results

A total of 255 patients were included in the START trial between September 2012 and May 2014. Of those, 215 patients used the ESYSTA® system over the specified observational period of 12 months, and 183 used it beyond this period (maximum observational period: 33 months). For the present study, 24 patients were excluded due to missing socio-demographical information (n = 5) and missing baseline HbA1c values (n = 19), leading to a baseline sample of 191 IG patients (IG sample) (Figure 1). The CG base sample initially consisted of 44.348 patients. After reducing the sample to those patients with at least two available HbA1c values for the relevant period, i.e., after September 2012, and complete baseline covariates (age, gender, type of diabetes), 42.939 insured patients remained. Following the SAP, ensuring that CG patients adhered to DMP-SoC, i.e., regularly visiting health care professionals, the CG base sample was further reduced to those patients with available HbA1c values at least in quarters two and four, leaving 24.042 patients (Figure 1). Before matching, the baseline characteristics between the CG sample and the IG sample differed and were imbalanced, i.e., the IG sample had higher baseline HbA1c values, included more T2DM patients and more male patients, and was on average younger (Table 1). This was also reflected in the mean differences, variance ratios, and empirical cumulative distribution function (eCDF) (see Table 2).
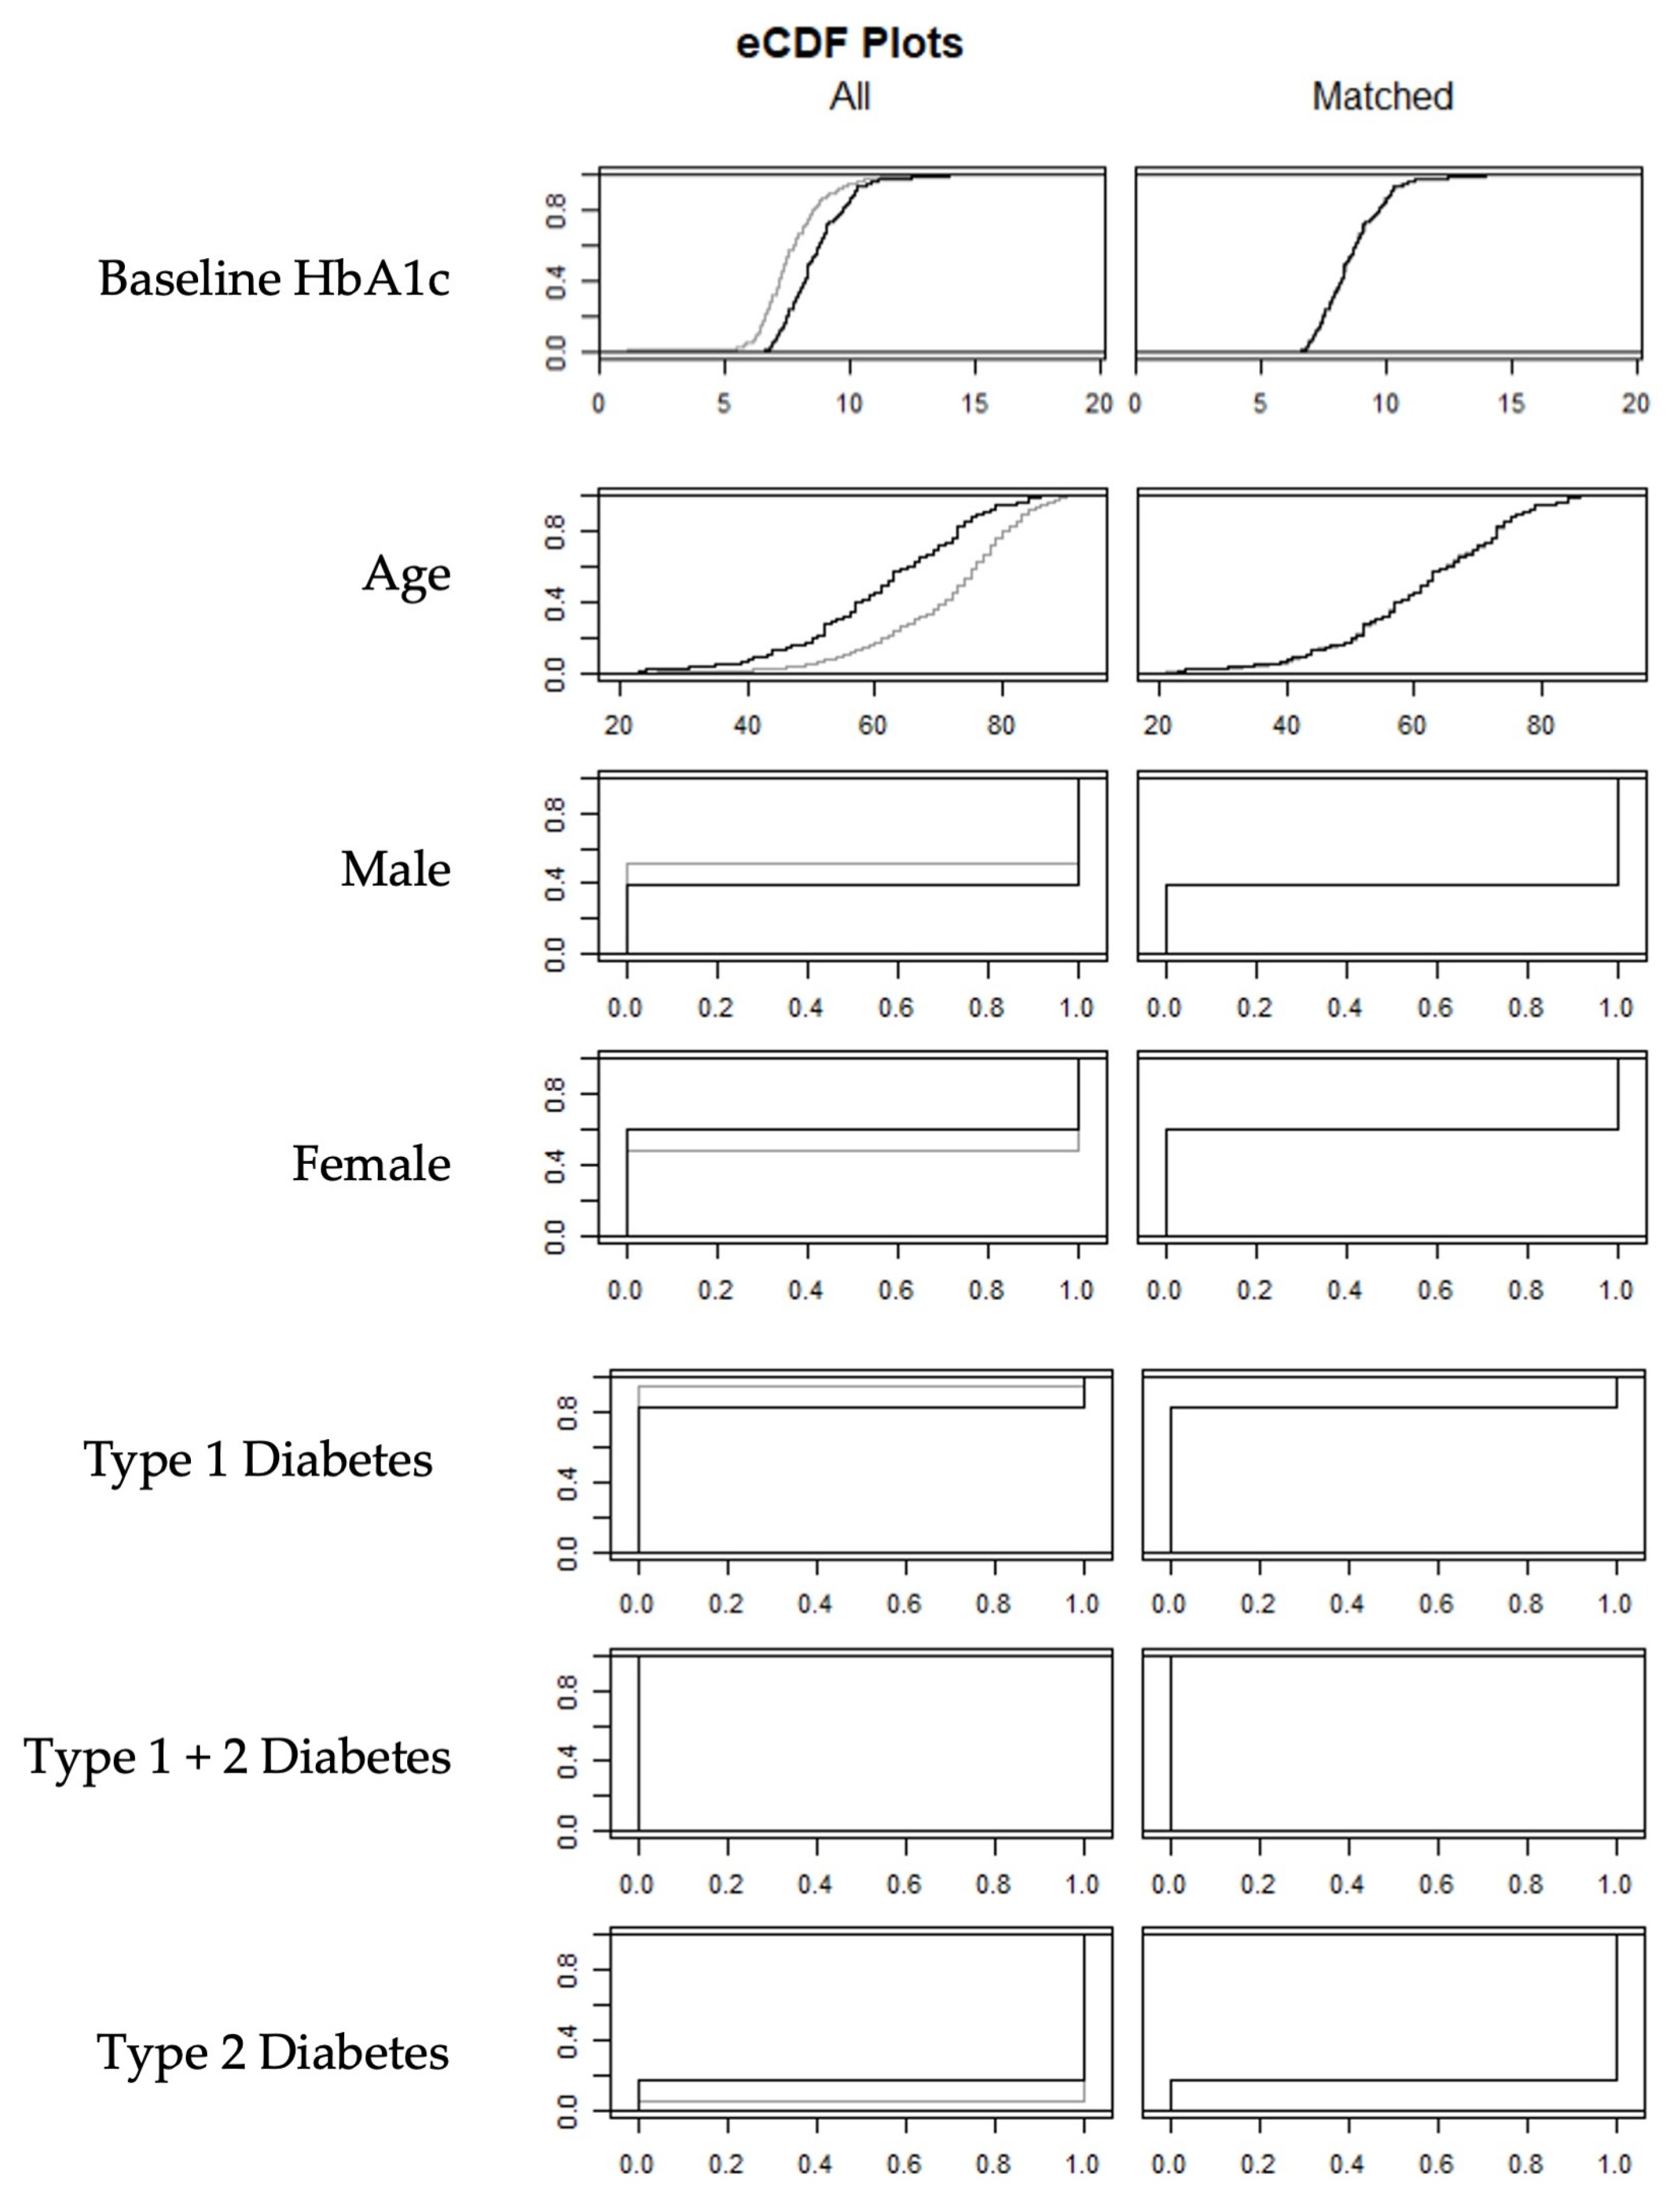
The first specified matching procedure, with exact matching on all covariates, left IG patients without a match (n = 57) (see Table A2), as did the second pre-specified procedure, using caliper distances of 0.1% for HbA1c and 2 years for age, leaving three IG patients without a match (see Table A5). The final matching procedure still allowed the use of a caliper distance of 0.1% for HbA1c and used the Mahalanobis distance to define the nearest neighbor, which was also used for the 1:2 matching. This matching also yields good balance in both cases, i.e., all standardized mean differences and eCDFs for the covariates were very close to zero, while the variance ratios were close to one (see Table 2 and Figure 2).

3.1. Matching

The final matched population consisted of 382 patients with an average baseline HbA1c value of 8.66 ± 1.31% and an average age of 60.9 ± 13.5 years. Overall, 16.8% of patients had T1DM and 60.5% were male. The detailed baseline characteristics of the matched CG samples and the IG sample are summarized in Table 3.
The number of patients with available HbA1c values in the IG sample for each time point are shown in Figure 1. For the matched CG samples, baseline HbA1c values and HbA1c values for quarters 2 and 4 were available for all matched patients (N = 191). For quarters 1, 3, and 5, the number of patients with available HbA1c were as follows: nq1 = 133, nq3 = 125, and nq5 = 140.

3.2. Primary and Secondary Endpoints

The average reductions in HbA1c values based on the linear mixed models, for both the primary confirmatory analysis (i.e., CIR imputation) as well as the sensitivity analysis (i.e., PP and 2:1 matching), are presented in Table 4 and Figure 3.
In the ANCOVAs, the main factors, time, and group, as well as the covariate baseline HbA1c and its interaction with time were significant in all analyses (Table A3). The interaction between time and group, as well as other included potential confounders (age, gender, indication) did not show significant interaction. This indicates a general superiority of the IG compared to the CG. The a priori defined contrasts and one-sided t tests to test the hypotheses for the primary and secondary endpoints are significant in all analyses (Table 5). This indicates that the IG achieves a clinically relevant reduction in HbA1c levels after 12 and 6 months. In addition, this HbA1C reduction is also significantly more pronounced compared to the CG at both time points.

3.3. Exploratory Endpoint

To calculate the proportion of patients reaching their HbA1c treatment goals of <7.0% and <6.5%, only values available for the 12 months assessment were included in the analysis; however, the percentage is based on the whole sample (i.e., 191 patients per group). After 12 months, 7.3% (17.3%) of IG patients achieved their treatment goals of 6.5% (7%), while 6.8% (19.4%) in the CG group achieved them.

4. Discussion

4.1. Principal Findings

The START-II trial allows the treatment effect of ESYSTA® to be analyzed compared to a CG receiving SoC within the respective DMPs. This study shows that the use of ESYSTA® leads to a faster, continued, and long-lasting reduction in HbA1c levels compared to the CG with DMP SoC. The results are also supported by the different sensitivity analyses. This shows that the results are robust over all types of analyses (ITT, PP). This is independent of the matching procedure (1:1 and 1:2). Overall, all hypotheses can be confirmed. Firstly, a clinically relevant reduction of at least 0.4% can be achieved after 6 months, and this reduction is maintained and further increased after that. Secondly, the HbA1c reduction in the IG is more pronounced compared to a matched CG after 6 and 12 months.
No group differences in the exploratory endpoints were apparent, with approximately the same number of patients reaching treatment goals of HbA1c values below 6.5% or 7%. An HbA1c below 7% is a general target goal recommended in guidelines for diabetes to prevent micro- and macrovascular complications. A tighter goal (HbA1c < 6.5) is recommended for younger patients with a recent diagnosis, while less-stringent goals (HbA1c < 8% or even <9%) might be more suitable for older patients with longer disease durations. As the study population on average falls more in the latter category, the applicability of treatment goals <7% is only partly given [3,8]. Landmark studies like the Diabetes Control and Complications Trial (DCCT) or the UK Prospective Diabetes Study (UKPDS) show positive correlations between reductions in HbA1c levels and the long-term risk reduction of microvascular complications without specified thresholds [22,23,24]. As such, guidelines stress the importance of individualized HbA1c treatment goals in line with socio-demographic characteristics and comorbidities. The evaluation of DMPs in Germany also refers to individualized treatment goals to determine the number of patients who reach them [25].
Furthermore, the data show a high level of adherence: the majority of ESYSTA® users (215 out of 255) originally enrolled in the START-I trial used the system for at least 12 months and many even beyond the study period.

4.2. Comparison to Other Studies

Evidence suggests that short-term interventions might demonstrate higher reductions in HbA1C-levels, which are mainly reached within the first three months. However, after the initial decrease, HbA1C-values often return to higher levels again [11,26,27,28]. The START-II trial also shows the highest HbA1c reduction in the first three months, resulting in a clinically significant reduction of 0.4%. However, after this first quarter, patients’ continuation of the ESYSTA® application could demonstrate further HbA1C reductions of almost 0.7 percentage points after one year. This reduction is in the order of magnitude of an HbA1c reduction with some oral antidiabetics [29] and superior to comparable devices for insulin-treated diabetes patients, which report reductions of 0.4% or 0.5% with small to medium effect sizes in the IGs [27,28,30,31]. In terms of group differences, the short-term results in the START-II trial are superior compared to other studies as well (approx. Mdiff: −0.3% and d < 0.3) [27,28,32]. Over time, the group difference in the START-II trial declines since the CG with SoC also continuously decreased their HbA1c levels over the duration of this study, though less pronounced. In the CG that adhered to SoC, a non-significant clinically relevant reduction of 0.4% is only achieved after more than 12 months. Less therapy-adherent CG patients, as well as the unmatched DMP population, do not even achieve a reduction of 0.4% (see Appendix B).

4.3. Strengths and Limitations

When planning a study to generate evidence, RCTs are considered the gold standard, minimizing bias by randomization and in the best case by blinding [33]. Yet they do not reflect real-world circumstances, leaving an information gap regarding real-world performance and safety that is often filled with observational post-market studies [33]. This study aligns with current recommendations for designing and conducting trials using real-world data within the regulatory approval process. It introduces a hybrid study design that combines the strengths of randomized controlled trials (RCTs) with real-world data (RWD), utilizing a single-arm observational trial alongside an external comparator [33,34]. This method is accepted and used for regulatory purposes in medications [33] and has also been applied in evaluation studies for the German DMP [35], as well as mobile-phone-based DMT2 interventions [36,37]. While propensity score matching is a common approach, the Mahalanobis distance, used in the present study, might achieve close matching over all covariates and thus functions better [38].
The main weakness of most observational studies is the lack of a CG and therefore control against the SoC to actually quantify the treatment effect. Also, the comparison to regular, standard care patients (outside of study settings) generates a bias because patients in- and outside a study setting are likely to differ in relevant baseline characteristics that influence treatment outcomes. This was also observed in the overall AOK Nordost SoC group and the IG in the present study. To counteract both problems, a CG from a random sample of SoC patients was generated using a matching method that allows covariate control. As in other retrospective studies that apply a matching procedure, additional observed as well as unobserved covariates, like comorbidities and medication, cannot be taken into account [36], and not all selection biases can be identified [34]. Yet, even in RCTs, not all covariates can be used as strata to randomize participants, and not all potential covariates are observed to later control for them. Pre-specified SAPs and sensitivity analyses can help to minimize and identify potential bias introduced by data selection. The present study accounted for this by conducting additional exploratory analyses. These analyses indicated that pre-selecting data may influence the results, particularly for the control group. However, the overall findings and conclusions remained unchanged.
In the main analysis, the control group was pre-selected prior to matching, based on the intervention group’s prerequisite of regular visits within the standard of care (SoC). This approach ensured that both groups were comparable in terms of therapy adherence. Consequently, the control group in the main analysis showed better outcomes than the control group without pre-selection.
Aspects of data completeness and management of missing data lead to further challenges when working with RWD [34]. In the present study, observed covariates are not available for all patients, only allowing patients with available data to be included in order to perform matching and to analyze results. The problem of missing outcome data occurs both in RCTs as well as in data that are generated under real-world conditions. Yet, adequate methods like imputations can help solve missing outcome data due to loss of follow-up or interim missing data occurrences. A further benefit of the present study is that data collection occurred in patients treated according to SoC.
Although this study focuses on individuals insured by AOK Nordost, data from the DMP indicate that the study population is representative of diabetes patients in Germany [25,39]. Moreover, since health insurance is mandatory in Germany, a selection bias related to insurance status is unlikely. Consequently, the findings are likely to be generalizable.

5. Conclusions

The evidence generated with the present project proves the positive health care effect of ESYSTA® through a significant and clinically relevant improvement in the HbA1c values of diabetes patients treated with insulin. This effect occurs after 3 months and persists or even increases after 12 months. When compared to a CG with SoC in a real-world care setting, the effects shown with ESYSTA® are more pronounced. ESYSTA® is a digital tool that enables diabetes patients that are being treated with insulin and receiving SoC to further improve health care outcomes by enhancing their self-empowerment. The study design allowed evidence with high external and internal validity to be generated. Applied methods, like matching and imputation, helped to reduce potential biases. This study confirmed the effectiveness of ESYSTA®. Future studies, e.g., analyzing the cost-effectiveness of ESYSTA® and including patient-reported outcome measurements to gain further insights into the effects of ESYSTA® on self-management, empowerment, and well-being, should be conducted.

Author Contributions

Conceptualization, P.E.H.S. and L.R.; methodology, P.E.H.S. and L.R.; validation, P.E.H.S.; formal analysis, L.R. and C.J.W.; resources, C.J.W., P.R. and B.K.; data curation, L.R., C.J.W., P.R. and B.K.; writing—original draft preparation, L.R.; writing—review and editing, all authors; visualization, L.R. and C.J.W.; project administration, P.E.H.S., P.R. and B.K.; funding acquisition, P.E.H.S.; supervision, P.E.H.S. All authors have read and agreed to the published version of the manuscript.

Funding

This study was funded by Emperra GmbH E-Health Technologies and AOK Nordost.

Institutional Review Board Statement

The manuscript is a retrospective re-analysis of a clinical trial that was originally conducted between 2012 and 2015. As a result, no ethical approval was necessary for the present re-analysis. The original research was conducted in accordance with §140a ff SGB V as an integrated care contract between the health insurance company EMPERRA GmbH and the principal investigator. All ethical aspects of conducting this study were clarified by the contractual regulations of the doctors and the enrolment conditions for the patients as part of the integrated care contract. In accordance with §140a ff SGB V, there was no need for an ethics vote by an external institution.

Informed Consent Statement

The prospective observational study START-I was conducted as part of an integrated care program initiated by AOK Nordost in collaboration with outpatient diabetologists in Berlin and Brandenburg. Participating patients in the intervention group provided informed consent based on the legal framework of the integrated care agreement, explicitly agreeing to the collection, processing, and use of their data, including use of the ESYSTA system.

Data Availability Statement

The original contributions presented in this study are included in the article. Further inquiries can be directed to the corresponding author.

Conflicts of Interest

The study is a project that was developed in cooperation by the AOK Nordost and the Emperra GmbH E-Health Technologies. The authors declare that this study received funding from Emperra GmbH E-Health Technologies. The funder had the following involvement with the study: funding and development of the intervention device. The funder was not involved in collection, analysis and interpretation of data. Author Christoph Johann Wagner, Petra Riesner and Birgit Krage were employed by the AOK Nordost. The role of the company was in the provision of data and infrastructure. Peter Schwarz scientific advisor for the Emperra GmbH E-Health Technologies. The remaining authors declare that the research was conducted in the absence of any commercial or financial relationships that could be construed as a potential conflict of interest.

Abbreviations

The following abbreviations are used in this manuscript:
CGControl group
CIRCopy increments to reference
dfDegrees of freedom
DMPDisease management program
HbA1cGlycated hemoglobin
IGIntervention group
MARMissing at random
pFDRp-value adjusted with the False Discovery Rate
PPPer-protocol
SDStandard deviation
SoCStandard of care
T1DMDiabetes mellitus type 1
T2DMDiabetes mellitus type 2

Appendix A

Table A1. Description of functions of ESYSTA® APP and portal.
ESYSTA® APPESYSTA® PORTAL
-
Automatic data synchronization with the ESYSTA® PORTAL.
-
Fully automatic synchronization of limit values, insulin type used, and measurement units (mmol/l and mg/dl).
-
Display of diary data when no suitable computer is available to access the ESYSTA® PORTAL, e.g., on vacation or during doctor consultations.
-
Detailed daily display of blood glucose, insulin, and bread units in a clearly arranged timeline diary.
-
Blood glucose history in three- and seven-day views.
-
Integrated diagram with insulin doses and blood glucose values.
-
Clear data evaluation/target range analysis.
-
Simplified display and preparation of selected therapy data for optimization and support of patient self-management.
-
Quick overview of the metabolic setting by the ESYSTA® Assistant with the ESYSTA® traffic light.
-
Manual recording of blood glucose readings, insulin doses, and bread units.
-
Marking of blood glucose readings for assignment to meals (fasting, pre- and postprandial, and other selections).
-
Import of blood glucose and insulin data simply via Bluetooth®.
-
Also usable when offline.
-
Usable worldwide, easy web access to therapy data via web browser.
-
Data preparation in clear tables and graphics—complete and without gaps.
-
Detailed daily display of blood glucose, insulin, and bread units in a clearly arranged diary.
-
Daily blood glucose history in seven-day view.
-
Integrated diagram display of insulin doses and blood glucose values.
-
Clear data evaluation/target range analysis.
-
Marking of blood glucose readings to set them into context with meals (fasting, pre- and postprandial, and further selection options).
-
Daytime analysis of blood glucose values.
-
Simplified display of selected therapy data for optimization and support of patient self-management.
-
Data access for the physician is possible.
-
Quick overview of the metabolic setting by the ESYSTA® APP with specially developed traffic light function supporting the patient in his/her therapy (empowerment) and gives the physician indications of a possible need for intervention.
-
Protected message exchange with the physician.
-
Display of relevant parameters for each patient and medical professional.
-
Entry of further medical or laboratory data in the form of an electronic patient file is possible.
-
Support for automated import of data from suitable blood glucose meters and insulin pens.
Table A2. Pre-defined matching procedures.
Pre-Defined Matching ProcedureR-CodeReason It Did Not Work
First: Exact Matching on All CovariatesmatchIt(group (IG/CG) ~ HbA1c (in %) + age (in years) + gender (female/male/diverse) + type of diabetes (type 1/type 2), data = df, method = “nearest”, exact = ~ HbA1c (in %) + age (in years) + gender (w/m/d) + type of diabetes (type 1/type 2), m.order = “random”).Unmatched IG subjects (n = 57)
Second: Nearest Neighbor Matching with Caliper Distances for Baseline HbA1c (±0.1%) and age (±5 years) matchIt(group (IG/CG) ~ HbA1c (in %) + age (in years) + gender (female/male/diverse) + type of diabetes (type 1/type 2), data = df, method = “nearest”, caliper = c(HbA1c = 0.1, age = 2), std.caliper = c(FALSE, FALSE)).Unmatched IG subjects (n = 3)
Note: CG, control group; HbA1c, glycated hemoglobin; IG, intervention group; SD, standard deviation.
Table A3. Results of the ANCOVA by analysis.
AnalysisFactordfX2p-Value
CIRgroup110.6531<0.0001 ***
CIRtime417.1219<0.0001 ***
CIRgroup*time40.49450.740
CIRBaseline HbA1c 147.312<0.0001 ***
CIRBaseline HbA1c*time45.49810.003
CIRAge11.49170.2221
CIRGender10.23460.6282
CIRIndication11.35090.2453
PPgroup117.1873<0.0001 ***
PPtime428.6191<0.0001 ***
PPgroup*time41.9900.738
PPBaseline HbA1c 136.4486<0.0001 ***
PPBaseline HbA1c*time44.3800.357
PPAge10.00760.396
PPGender10.98180.322
PPIndication10.72120.396
2:1 (MAR)group121.046<0.0001 ***
2:1 (MAR)time430.330<0.0001 ***
2:1 (MAR)group*time41.1820.881
2:1 (MAR)Baseline HbA1c 1232.919<0.0001 ***
2:1 (MAR)Baseline HbA1c*time422.180<0.0001 ***
2:1 (MAR)Age11.92440.165
2:1 (MAR)Gender10.03600.850
2:1 (MAR)Indication10.67600.411
Significance Codes: “***”, 0; “**”, 0.001; “*”, 0.01; Note: CG, control group; CIR, copy increments to Reference; df, degrees of freedom; HbA1c, glycated hemoglobin; IG, intervention group; MAR, missing at random; PP, per-protocol; SD, standard deviation; X2, chi-squared statistic.
Figure A1. ESYSTA® Web-Portal 7-day blood glucose trend (top) and ample system to highlight hypo- and hyperglycemic events (bottom).
Diabetology 06 00085 g0a1
Figure A2. ESYSTA® Web-Portal 7-day blood glucose trend for several patients (health care professional view).
Diabetology 06 00085 g0a2
Figure A3. ESYSTA® App 7-day blood glucose trend (left) and diary including blood glucose, insulin (in IE), and carbs (right).
Diabetology 06 00085 g0a3

Appendix B. START-II Trial Results Based on the Overall AOK Nordost Sample

Appendix B.1. Background

To understand the effect of the prior reduction in the control group (CG) based on data availability, sensitivity analysis was performed in which the whole CG is used to match to the subjects in the intervention group (IG).

Appendix B.2. Methods

For this, the same 1:1 matching procedure was performed that was successful in the previous reduced, pre-selected CG. That is, using the pre-defined covariates (indication (diabetes mellitus type 1 or type 2), baseline HbA1c values (in %), gender (male/female/diverse), and age (in years)), a caliper distance of 0.1% for HbA1c and the Mahalanobis distance were used to define the nearest neighbor.
To answer the following hypotheses related to changes in HbA1c, the same statistical analyses were conducted (using the MAR approach):
  • H1.1/H1.1: The IG using ESYSTA® shows a clinically relevant reduction in HbA1c (in %) after 6/12 months.
  • H2.1/H2.2: The IG using ESYSTA® shows a more pronounced HbA1c (in %) reduction compared to the CG after 6/12 months.
An analysis of variance with repeated measures (ANCOVA) was used. For this, a linear mixed model was fitted with HbA1c change from baseline as a dependent variable. Treatment and time (as the within-subject factors corresponding to quarters 1–5) and their interaction were included as fixed effects. The covariates, already used for matching, age (in years), type of diabetes, gender, and baseline HbA1c (in %), were included to control for confounding. For the latter (baseline HbA1c value), an interaction with time was included because the importance of the baseline will usually decrease over time. Additionally, to account for individual differences, a random intercept for each individual was included. To show the superiority of ESYSTA® compared to the CG receiving SoC, a significant main effect of the factor group based on the described linear model showed general superiority. To look at the general but also superior intervention effect at 6 and 12 months of the IG, planned contrasts were used. For the IG after 6 and 12 months against an expected reduction of 0.4% and for the between-group differences, the HbA1c changes after 6 and 12 months were compared with emmeans::test.

Appendix B.3. Results

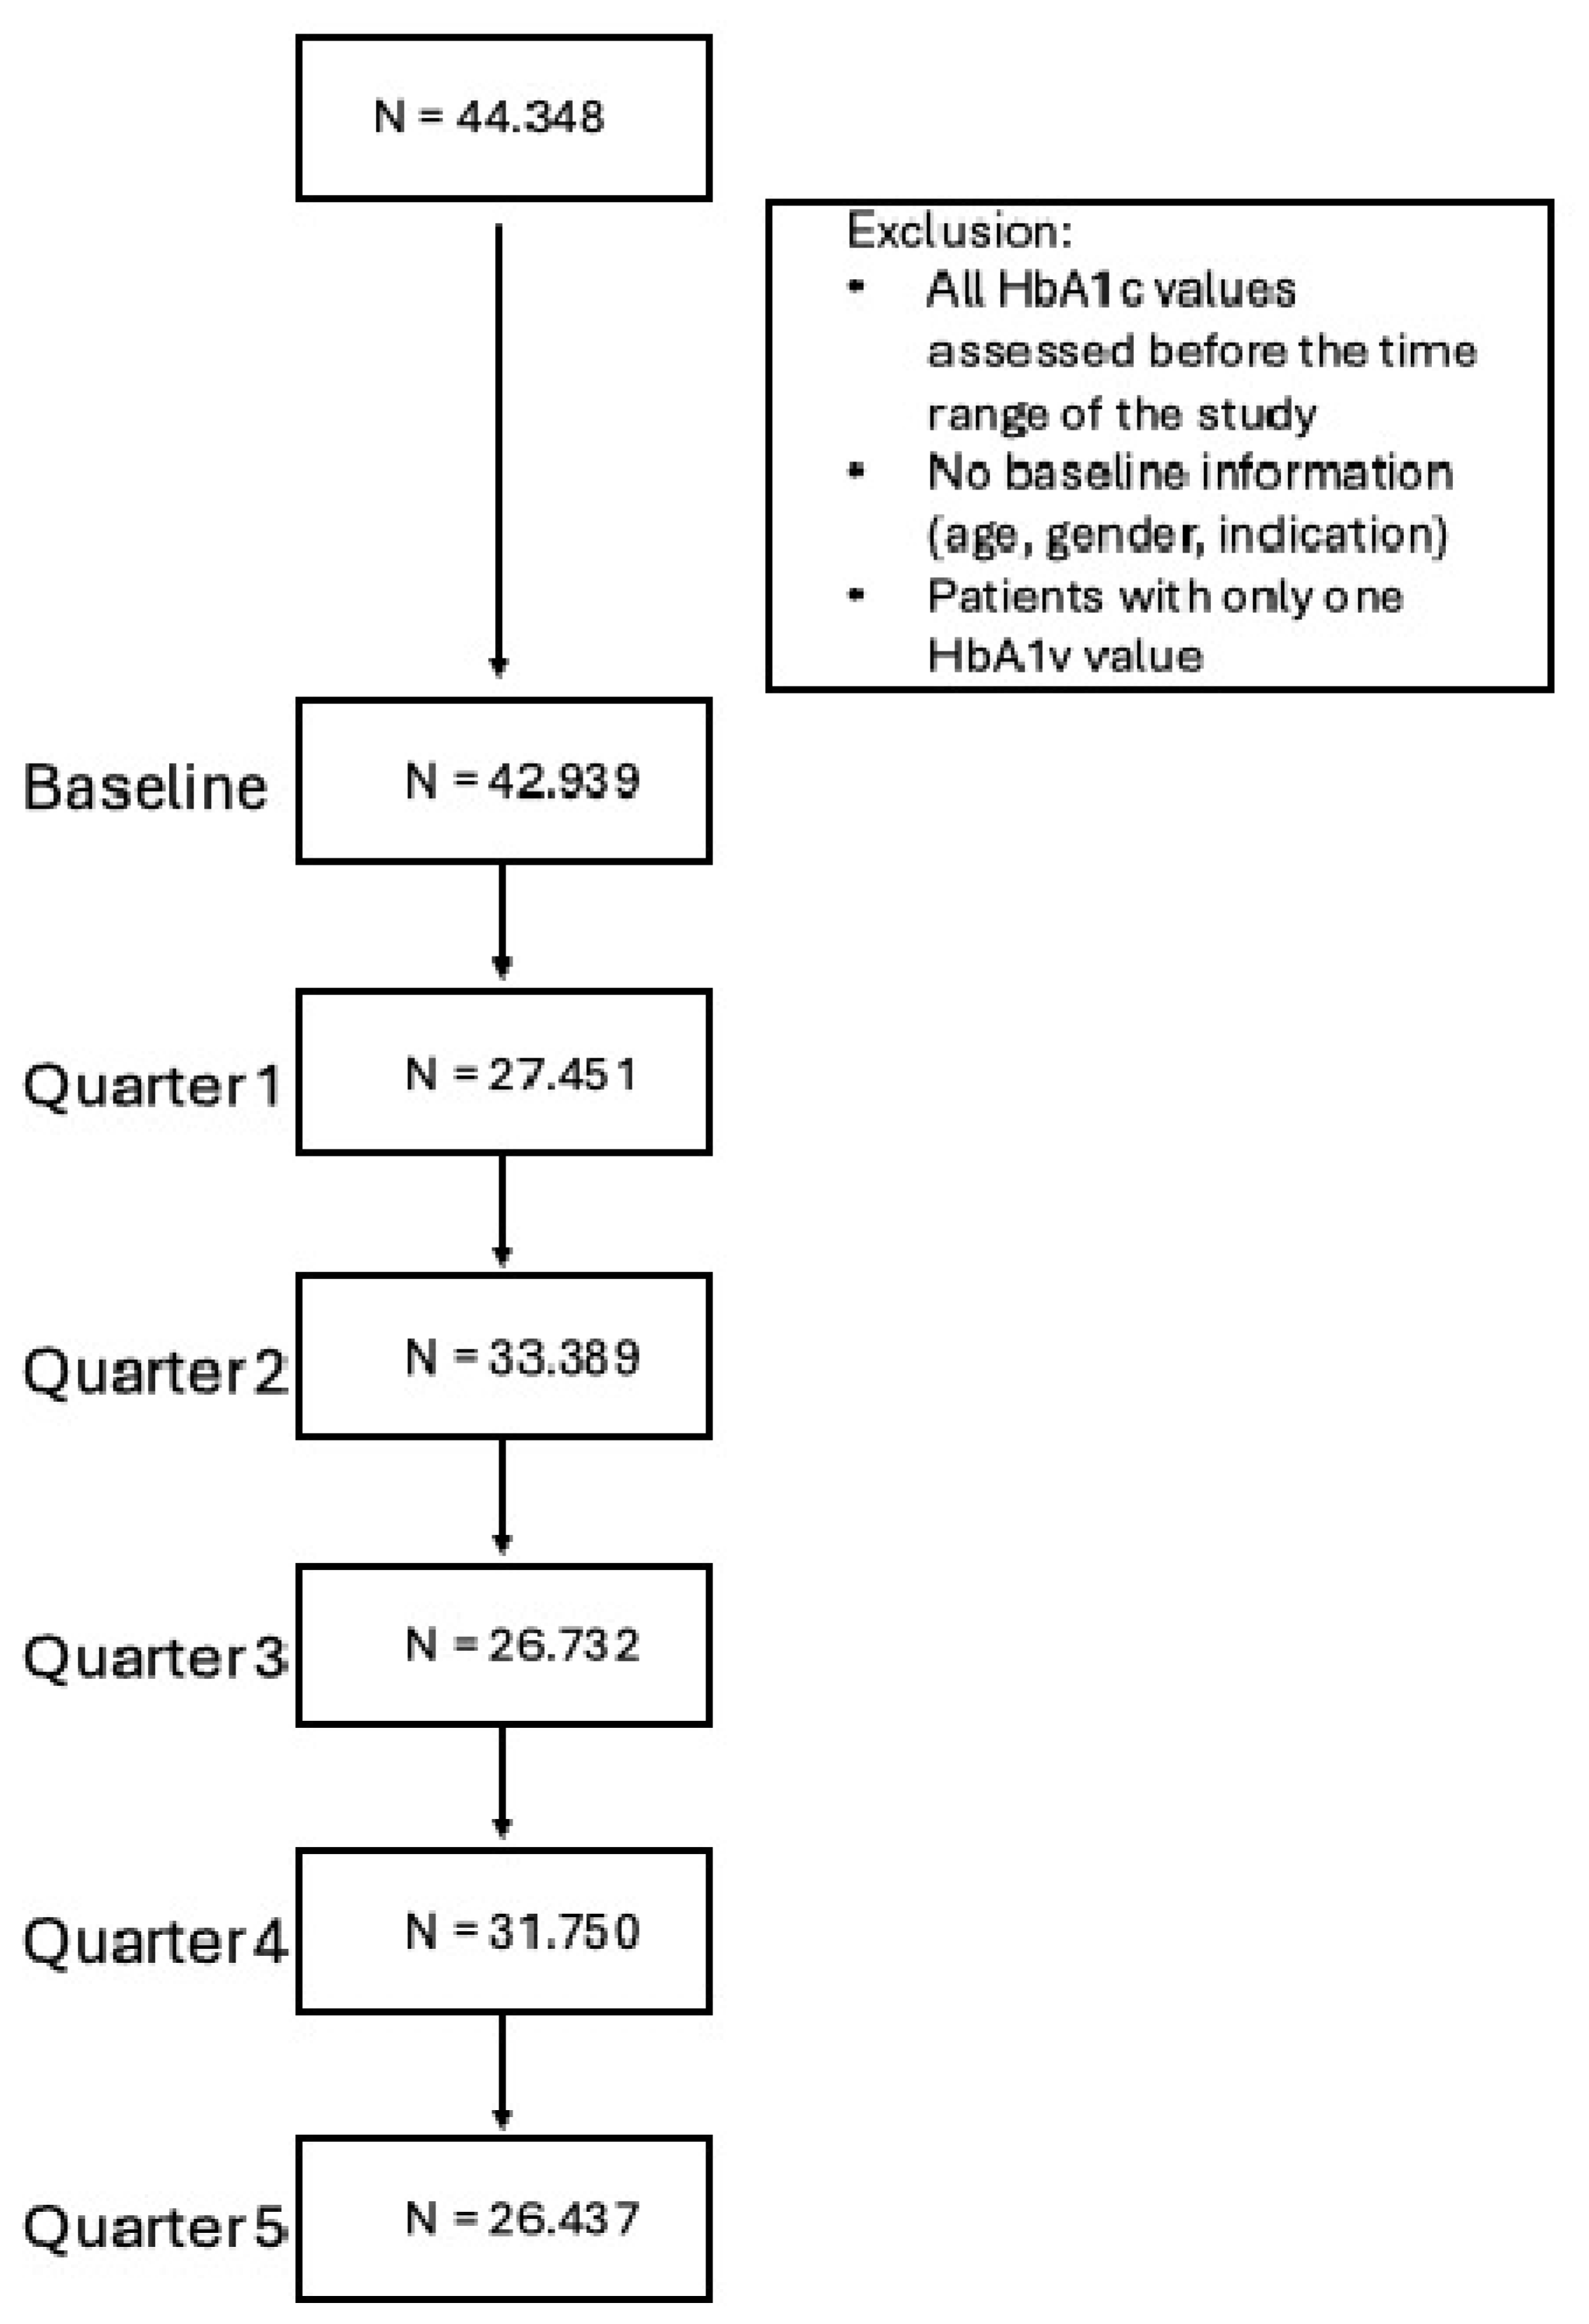
As pre-defined, both the IG and the CG were reduced in order to allow changes in HbA1C to be calculated and to perform matching. This meant that patients’ baseline values (baseline value, i.e., HbA1c values assessed before the time range of the study; age; gender; indication) and one additional HbA1C value were assessed after baseline. To use the full CG, no further reduction was performed (see Figure 1). Before matching, the baseline characteristics between the full CG sample and the IG sample differed and were imbalanced, i.e., the IG sample had higher baseline HbA1c values, included more patients with type 2 diabetes mellitus (T2DM), more male patients, and was on average younger (Table 1). This was also reflected in the mean differences, variance ratios, and empirical cumulative distribution function (eCDF) (see Table A4).
Before matching, the baseline characteristics between the full CG sample and the IG sample differed and were imbalanced, i.e., the IG sample had higher baseline HbA1c values, included more patients with type 2 diabetes mellitus (T2DM), more male patients, and was on average younger (Table 1). This was also reflected in the mean differences, variance ratios, and empirical cumulative distribution function (eCDF) (see Table A4).
Figure A4. Patient flow chart and data availability of the AOK Nordost sample with data available at least every 3 months.
Diabetology 06 00085 g0a4
Table A4. Baseline characteristics of the IG sample and the full CG sample.
IG SampleCG Sample
(N = 191)(N = 42.939)
Baseline Hba1c (in %)
   Mean (SD)8.66 (1.31)7.71 (1.43)
   Median [Min, Max]8.40 [6.60, 14.5]7.50 [1.10, 19.1]
Type of Diabetes
   TDM132 (16.8%)2415 (5.6%)
   TDM1 and TDM20 (0%)268 (0.6%)
   TDM2159 (83.2%)40,256 (93.8%)
Gender
   Male116 (60.7%)20,666 (48.1%)
   Female75 (39.3%)22,273 (51.9%)
Age
   Mean (SD)60.9 (13.5)71.1 (11.9)
   Median [Min, Max]62.0 [23.0, 86.0]74.0 [21.0, 93.0]
Note: CG, control group; HbA1c, glycated hemoglobin; IG, intervention group; Min, minimum; Max, maximum; SD, standard deviation; T1DM/T2DM, diabetes mellitus type 1/2.

Appendix B.3.1. Matching

After matching, a good balance of baseline values was achieved, i.e., all standardized mean differences and eCDFs for the covariates were very close to zero, while the variance ratios were close to one (see Table 2). The detailed baseline characteristics of the matched CG sample and the IG sample are summarized in Table A5 showing, in fact, an equal distribution and balanced baseline characteristics. The number of patients with available HbA1c values in the CG are as follows: nq1 = 116, nq2 = 144, nq3 = 121, nq4 = 129, and nq5 = 126.
Table A5. Summary of balance after matching (based on the overall AOK CG).
Mean Diff. Var. RatioeCDF Mean
Distance0.0081.2640.004
Baseline Hba1c (in %)−0.0021.0110.002
Type of Diabetes
   TDM10.000 0.000
   TDM1 and TDM20.000 0.000
   TDM20.000 0.000
Gender
   Male0.011 0.005
   Female−0.011 0.005
Age−0.0010.9810.002
Note: eCDF, empirical cumulative distribution function statistic; HbA1c, glycated hemoglobin; T1DM/T2DM, diabetes mellitus type 1/2; Std. mean Diff., standardized mean differences; Var. Ratio, variance ratios.
Table A6. Baseline characteristics of the IG sample and the matched CG sample.
IG SampleCG Sample
(N = 191)(N = 191)
Baseline Hba1c (in %)
   Mean (SD)8.66 (1.31)8.66 (1.31)
   Median [Min, Max]8.40 [6.60, 14.5]8.40 [6.60, 14.4]
Type of Diabetes
   TDM132 (16.8%)32 (16.8%)
   TDM2159 (83.2%)159 (83.2%)
Gender
   Male116 (60.7%)115 (60.2%)
   Female75 (39.3%)76 (39.8%)
Age
   Mean (SD)60.9 (13.5)60.8 (13.6)
   Median [Min, Max]62.0 [23.0, 86.0]62.0 [21.0, 86.0]
Note: CG, control group; HbA1c, glycated hemoglobin; IG, intervention group; Min, minimum; Max, maximum; SD, standard deviation; T1DM/T2DM, diabetes mellitus type 1/2.

Appendix B.3.2. Outcomes

In the ANOVA, the main factors, time (X2(4) = 12.823, p = 0.012), and group (X2(1) = 19.067, p < 0.001) are significant. Their interaction, however, was not significant (X2(4) = 3.773, p = 0.438). Further, the covariate baseline HbA1c value (X2(1) = 133.351, p < 0.001) as well as the interaction between baseline HbA1c value and time are significant (X2(4) = 16.143, p = 0.003). The results of the ITT analysis under MAR are summarized in Table A7.
Table A7. Estimated marginal means and 95% confidence intervals for the HbA1c reduction based on the ITT (MAR) analysis.
QuartalIGCG
1−0.42 [−0.63; −0.22]−0.04 [−0.25; 0.17]
2−0.58 [−0.78; −0.38]−0.13 [−0.33; 0.08]
3−0.56 [−0.77; −0.36]−0.15 [−0.36; 0.07]
4−0.61 [−0.81; −0.41]−0.25 [−0.46; −0.04]
5−0.74 [−0.96; −0.53]−0.14 [−0.35; 0.07]
Note: CG, control group; CIR, IG, intervention group; HbA1c, glycated hemoglobin; ITT, intention to treat; MAR, missing at random.
The a priori defined contrasts and one-sided t tests to test the hypotheses for the primary and secondary endpoints are significant (Table 5). This indicates that the intervention group achieves a clinically relevant reduction in HbA1c levels after 12 and 6 months. Also, this reduction is significantly more pronounced compared to the control group at both time points.
Table A8. Results of the hypothesis testing based on the ITT analysis (MAR) for changes in HbA1c levels after 6 and 12 months.
QuarterHypothesisEstimate (95% CI)tdfpFDRCohen’s d
2IG−0.61 [−0.81; −0.41]−2.5537080.005 **−0.19 [−0.34, −0.04]
2IG vs. CG−0.36 [−0.67; −0.16]−2.4868190.013 *−0.17 [−0.31, −0.04]
4IG−0.58 [−0.78; −0.38]−2.2376800.013 *−0.17 [−0.32, −0.02]
4IG vs. CG−0.45 [−0.70; −0.21]−3.940799<0.001 ***−0.28 [−0.42, −0.14]
Significance Codes: “***”, 0; “**”, 0.001; “*”, 0.01; Note: CG, control group; df, degrees of freedom; HbA1c, glycated hemoglobin; IG, intervention group; ITT, intention to treat; MAR, missing at random; pFDR, p-value adjusted with the False Discovery Rate; t, t-statistic.

Appendix B.3.3. Exploratory Results

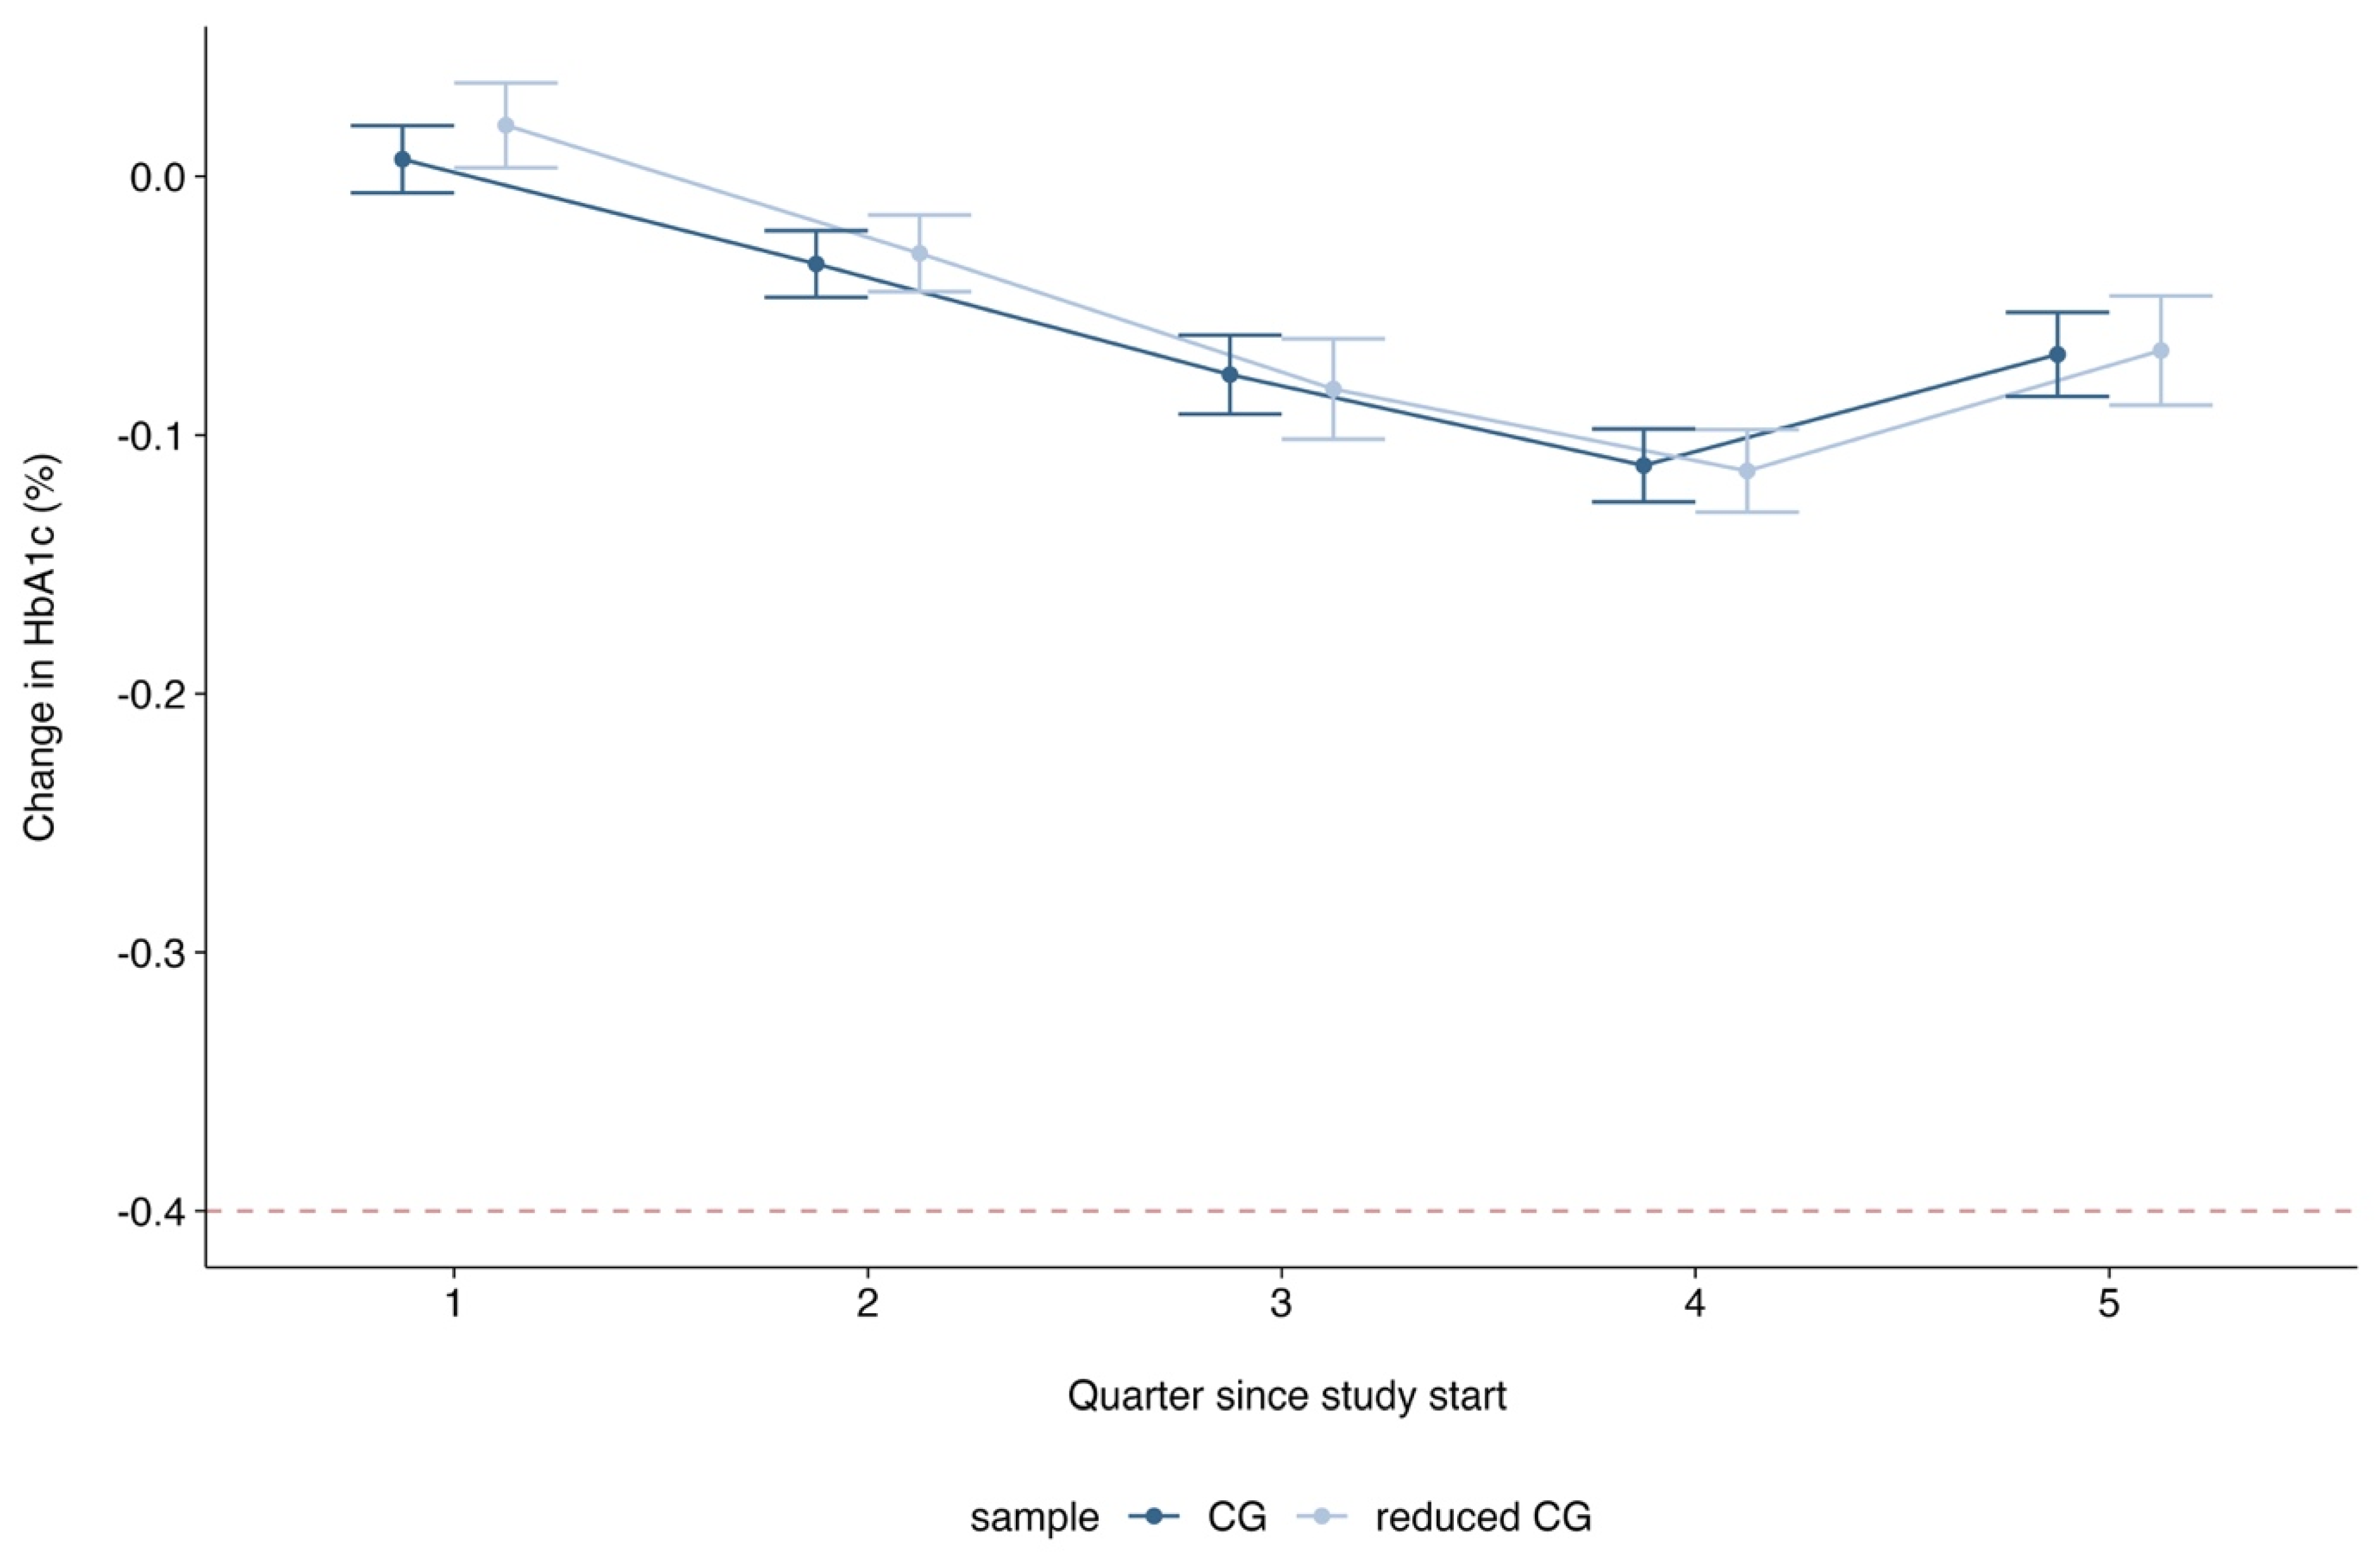
Lastly, when looking at the unmatched control group samples, either the reduced one (used for the main analyses) or the full control group, no apparent change is observed over time (Figure A5).
Figure A5. Unadjusted average HbA1c changes and 95% confidence intervals over time by CG sample. Note: CG, control; HbA1c, glycated hemoglobin.
Diabetology 06 00085 g0a5

References

  1. The Emerging Risk Factors Collaboration; Sarwar, N.; Gao, P.; Seshasai, S.R.; Gobin, R.; Kaptoge, S.; Di Angelantonio, E.; Ingelsson, E.; Lawlor, D.A.; Selvin, E.; et al. Diabetes mellitus, fasting blood glucose concentration, and risk of vascular disease: A collaborative meta-analysis of 102 prospective studies. Lancet 2010, 375, 2215–2222. [Google Scholar] [CrossRef] [PubMed]
  2. International Diabetes Federation (IDF). IDF Diabetes Atlas 2021, 10th ed.; IDF: Brussels, Belgium, 2021. [Google Scholar]
  3. Cosentino, F.; Grant, P.; Aboyans, V.; Bailey, C.J.; Ceriello, A.; Delgado, V. The Task Force for diabetes, pre-diabetes, and cardiovascular diseases of the European Society of Cardiology (ESC) and the European Association for the Study of Diabetes (EASD). Eur. Heart J. 2020, 41, 255–323. [Google Scholar] [CrossRef]
  4. Zaharia, O.P.; Lanzinger, S.; Rosenbauer, J.; Karges, W.; Müssig, K.; Meyhöfer, S.M.; Burkart, V.; Hummel, M.; Raddatz, D.; Roden, M.; et al. Comorbidities in Recent-Onset Adult Type 1 Diabetes: A Comparison of German Cohorts. Front. Endocrinol. 2022, 13, 760778. [Google Scholar] [CrossRef]
  5. Robert-Koch-Institut (RKI). Diabetes in Germany—National Diabetes Surveillance Report 2019; Robert Koch Institute: Berlin, Germany, 2019. [Google Scholar]
  6. Bundesärztekammer (BÄK); Kassenärztliche Bundesvereinigung (BKV), and Arbeitsgemeinschaft der Wissenschaftlichen Medizinischen Fachgesellschaften (AWMF). Nationale Versorungsleitlinie Typ-2-Diabetes—Teilpublikation der Langfassung, 2. Auflage. Version 1; The Association of the Scientific Medical Societies in Germany (AWMF): Berlin, Germany, 2021. [Google Scholar] [CrossRef]
  7. Deutsche Diabetes Gesellschaft (DDG). S3-Leitlinie Therapie des Typ-1-Diabetes. Version 2.0. AWMF-Register-Nr. 057-024. 2023. Available online: https://register.awmf.org/assets/guidelines/057-013l_S3-Therapie-Typ-1-Diabetes_2018-08.pdf (accessed on 6 June 2024).
  8. ElSayed, N.A.; Aleppo, G.; Aroda, V.R.; Bannuru, R.R.; Brown, F.M.; Bruemmer, D.; Collins, B.S.; Hilliard, M.E.; Isaacs, D.; Johnson, E.L. 6. Glycemic Targets: Standards of Care in Diabetes—2023. Diabetes Care 2022, 46 (Suppl. S1), S97–S110. [Google Scholar] [CrossRef]
  9. Zentralinstitut für die Kassenärztliche Versorgung in der Bundesrepublik Deutschland. DMP-Atlas Nordrhein-Westfalen. Regionalisierte Darstellung der Disease-Management-Programme. 2024. Available online: https://www.zi-dmp.de/dmp-atlas_nrw/dmp_d2_adt.html. (accessed on 7 October 2024).
  10. Heidemann, C.; Du, Y.; Mauz, E.; Walther, L.; Peitz, D.; Müller, A.; Buchmann, M.; Allen, J.; Scheidt-Nave, C.; Baumert, J. Healthcare and health situation of adults with type 2 diabetes in Germany: The study GEDA 2021/2022-Diabetes. J. Health Monit. 2024, 9, e12128. [Google Scholar] [CrossRef]
  11. Timpel, P.; Oswald, S.; Schwarz, P.E.H.; Harst, L. Mapping the Evidence on the Effectiveness of Telemedicine Interventions in Diabetes, Dyslipidemia, and Hypertension: An Umbrella Review of Systematic Reviews and Meta-Analyses. J. Med. Internet Res. 2020, 22, e16791. [Google Scholar] [CrossRef]
  12. Emperra® GmbH E-Health Technologies. Scientific Evaluation of the ESYSTA® S-T-A-R-T Project; 2016. Available online: https://www.emperra.com/wp-content/uploads/2020/06/esysta_start_whitepaper_en_2.0.pdf (accessed on 7 October 2024).
  13. Ho, D.E.; Imai, K.; King, G.; Stuart, E.A. MatchIt: Nonparametric Preprocessing for Parametric Causal Inference. J. Stat. Softw. 2011, 42, 1–28. [Google Scholar] [CrossRef]
  14. Austin, P.C. An Introduction to Propensity Score Methods for Reducing the Effects of Confounding in Observational Studies. Multivar. Behav. Res. 2011, 46, 399–424. [Google Scholar] [CrossRef]
  15. Austin, P.C. A comparison of 12 algorithms for matching on the propensity score. Stat. Med. 2013, 33, 1057–1069. [Google Scholar] [CrossRef]
  16. Team, R.C. _R: A Language and Environment for Statistical Computing_; R Foundation for Statistical Computing: Vienna, Austria, 2024; Available online: https://www.R-project.org (accessed on 2 October 2024).
  17. Carpenter, J.R.; Roger, J.H.; Kenward, M.G. Analysis of Longitudinal Trials with Protocol Deviation: A Framework for Relevant, Accessible Assumptions, and Inference via Multiple Imputation. J. Biopharm. Stat. 2013, 23, 1352–1371. [Google Scholar] [CrossRef]
  18. CGower-Page, C.; Noci, A.; _rbmi: Reference Based Multiple Imputation_. R Package Version 1.2.6. 2023. Available online: https://CRAN.R-project.org/package=rbmi (accessed on 2 October 2024).
  19. Grund, S.; Lüdtke, O.; Robitzsch, A. Pooling ANOVA Results from Multiply Imputed Datasets: A Simulation Study. Methodology 2016, 12, 75–88. [Google Scholar] [CrossRef]
  20. van Buuren, S. Flexible Imputation of Missing Data, Second Edition. 2018. Available online: https://stefvanbuuren.name/fimd/ (accessed on 8 April 2022).
  21. White, I.R.; Royston, P.; Wood, A.M. Multiple imputation using chained equations: Issues and guidance for practice. Stat. Med. 2011, 30, 377–399. [Google Scholar] [CrossRef] [PubMed]
  22. Stratton, I.M.; Adler, A.I.; Neil, H.A.; Matthews, D.R.; Manley, S.E.; Cull, C.A.; Hadden, D.; Turner, R.C.; Holman, R.R. Association of glycaemia with macrovascular and microvascular complications of type 2 diabetes (UKPDS 35): Prospective observational study. BMJ 2000, 321, 405–412. [Google Scholar] [CrossRef] [PubMed]
  23. UK Prospective Diabetes Study (UKPDS) Group. Intensive blood-glucose control with sulphonylureas or insulin compared with conventional treatment and risk of complications in patients with type 2 diabetes (UKPDS 33). Lancet 1998, 352, 9131. [Google Scholar] [CrossRef]
  24. Lachin, J.M.; Genuth, S.; Nathan, D.M.; Zinman, B.; Rutledge, B.N.; DCCT/EDIC Research Group. Effect of Glycemic Exposure on the Risk of Microvascular Complications in the Diabetes Control and Complications Trial—Revisited. Diabetes 2008, 57, 995–1001. [Google Scholar] [CrossRef]
  25. INFAS (Institut für Angewandte Sozialwissenschaft GmbH). Bericht der Strukturierten Behandlungsprogramme der Gesetzlichen Krankenkassen—Indikation Diabetes Mellitus Typ 1. Erstellt Durch Infas und MNC. Die Qesetzlichen Krankenkassen. 2021. Available online: https://www.barmer.de/resource/blob/1032236/d2577854d3ce4eaf22fe68846219c9f9/evaluationsbericht-dmp-mellitus-typ-2021-data.pdf (accessed on 26 June 2024).
  26. Holmen, H.; Torbjørnsen, A.; Wahl, A.K.; Jenum, A.K.; Småstuen, M.C.; Årsand, E.; Ribu, L. A Mobile Health Intervention for Self-Management and Lifestyle Change for Persons with Type 2 Diabetes, Part 2: One-Year Results from the Norwegian Randomized Controlled Trial RENEWING HEALTH. JMIR mHealth uHealth 2014, 2, e57. [Google Scholar] [CrossRef]
  27. Kulzer, B.; Daenschel, W.; Daenschel, I.; Schramm, W.; Messinger, D.; Weissmann, J.; Vesper, I.; Parkin, C.G.; Heinemann, L. Integrated personalized diabetes management improves glycemic control in patients with insulin-treated type 2 diabetes: Results of the PDM-ProValue study program. Diabetes Res. Clin. Pract. 2018, 144, 200–212. [Google Scholar] [CrossRef]
  28. Ruissen, M.M.; Torres-Peña, J.D.; Uitbeijerse, B.S.; de Larriva, A.P.A.; Huisman, S.D.; Namli, T.; Salzsieder, E.; Vogt, L.; Ploessnig, M.; van der Putte, B.; et al. Clinical impact of an integrated e-health system for diabetes self-management support and shared decision making (POWER2DM): A randomised controlled trial. Diabetologia 2023, 66, 2213–2225. [Google Scholar] [CrossRef]
  29. Clodi, M.; Abrahamian, H.; Brath, H.; Brix, J.; Drexel, H.; Fasching, P.; Föger, B.; Francesconi, C.; Fröhlich-Reiterer, E.; Harreiter, J.; et al. Antihyperglykämische Therapie bei Diabetes mellitus Typ 2 (Update 2019). Wien. Klin. Wochenschr. 2019, 131, 27–38. [Google Scholar] [CrossRef]
  30. Mora, P.; Buskirk, A.; Lyden, M.; Parkin, C.G.; Borsa, L.; Petersen, B. Use of a Novel, Remotely Connected Diabetes Management System Is Associated with Increased Treatment Satisfaction, Reduced Diabetes Distress, and Improved Glycemic Control in Individuals with Insulin-Treated Diabetes: First Results from the Personal Diabetes Management Study. Diabetes Technol. Ther. 2017, 19, 715. [Google Scholar] [CrossRef]
  31. Mayer, H.; Bankosegger, R.P.; Kober, J. 953-P: Sustainable Improvement in Quality of Blood Glucose Control in Users of mySugr’s Integrated Diabetes Management Solution. Diabetes 2019, 68 (Suppl. S1), 953-P. [Google Scholar] [CrossRef]
  32. Ehrmann, D.; Hermanns, N.; Finke-Gröne, K.; Roos, T.; Kober, J.; Schäfer, V.; Krichbaum, M.; Haak, T.; Ziegler, R.; Heinemann, L.; et al. Efficacy of a Digital Diabetes Logbook for People with Type 1, Type 2, and Gestational Diabetes: Results From a Multicenter, Open-Label, Parallel-Group, Randomized Controlled Trial. J. Diabetes Sci. Technol. 2024. [Google Scholar] [CrossRef] [PubMed]
  33. Andre, E.B.; Reynolds, R.; Caubel, P.; Azoulay, L.; Dreyer, N.A. Trial designs using real-world data: The changing landscape of the regulatory approval process. Pharmacoepidemiol. Drug Saf. 2020, 29, 1201–1212. [Google Scholar] [CrossRef] [PubMed]
  34. Cave, A.; Kurz, X.; Arlett, P. Real-World Data for Regulatory Decision Making: Challenges and Possible Solutions for Europe. Clin. Pharmacol. Ther. 2019, 106, 36–39. [Google Scholar] [CrossRef] [PubMed]
  35. Riedl, R.; Robausch, M.; Berghold, A.; Savarese, G. Disease Management Program in patients with type 2 diabetes mellitus, long-term results of the early and established program cohort: A population-based retrospective cohort study. PLoS ONE 2022, 17, e0279090. [Google Scholar] [CrossRef] [PubMed]
  36. Li, J.; Sun, L.; Wang, Y.; Guo, L.; Li, D.; Liu, C.; Sun, N.; Xu, Z.; Li, S.; Jiang, Y.; et al. A Mobile-Based Intervention for Glycemic Control in Patients with Type 2 Diabetes: Retrospective, Propensity Score-Matched Cohort Study. JMIR mHealth uHealth 2020, 8, e15390. [Google Scholar] [CrossRef]
  37. Salunkhe, V.A.; Sinha, N.; Ahlqvist, E.; Prasad, R.B.; Johansson, S.; Abrahamsson, B.; Rosengren, A.H. Digital lifestyle treatment improves long-term metabolic control in type 2 diabetes with different effects in pathophysiological and genetic subgroups. NPJ Digit. Med. 2023, 6, 199. [Google Scholar] [CrossRef]
  38. King, G.; Nielsen, R. Why Propensity Scores Should Not Be Used for Matching. Political Anal. 2019, 27, 435–454. [Google Scholar] [CrossRef]
  39. INFAS (Institut für Angewandte Sozialwissenschaft GmbH). Bericht der Strukturierten Behandlungsprogramme der Gesetzlichen Krankenkassen—Indikation Diabetes Mellitus Typ 2 Erstellt Durch Infas und MNC’, Die Gesetzlichen Krankenkassen. 2024. Available online: https://www.barmer.de/resource/blob/1023672/de3e2ccb334e697436e2e226c2e5f144/besser-leben-programm-evaluationsbericht-infas-diabetes-typ2-data.pdf (accessed on 26 June 2024).
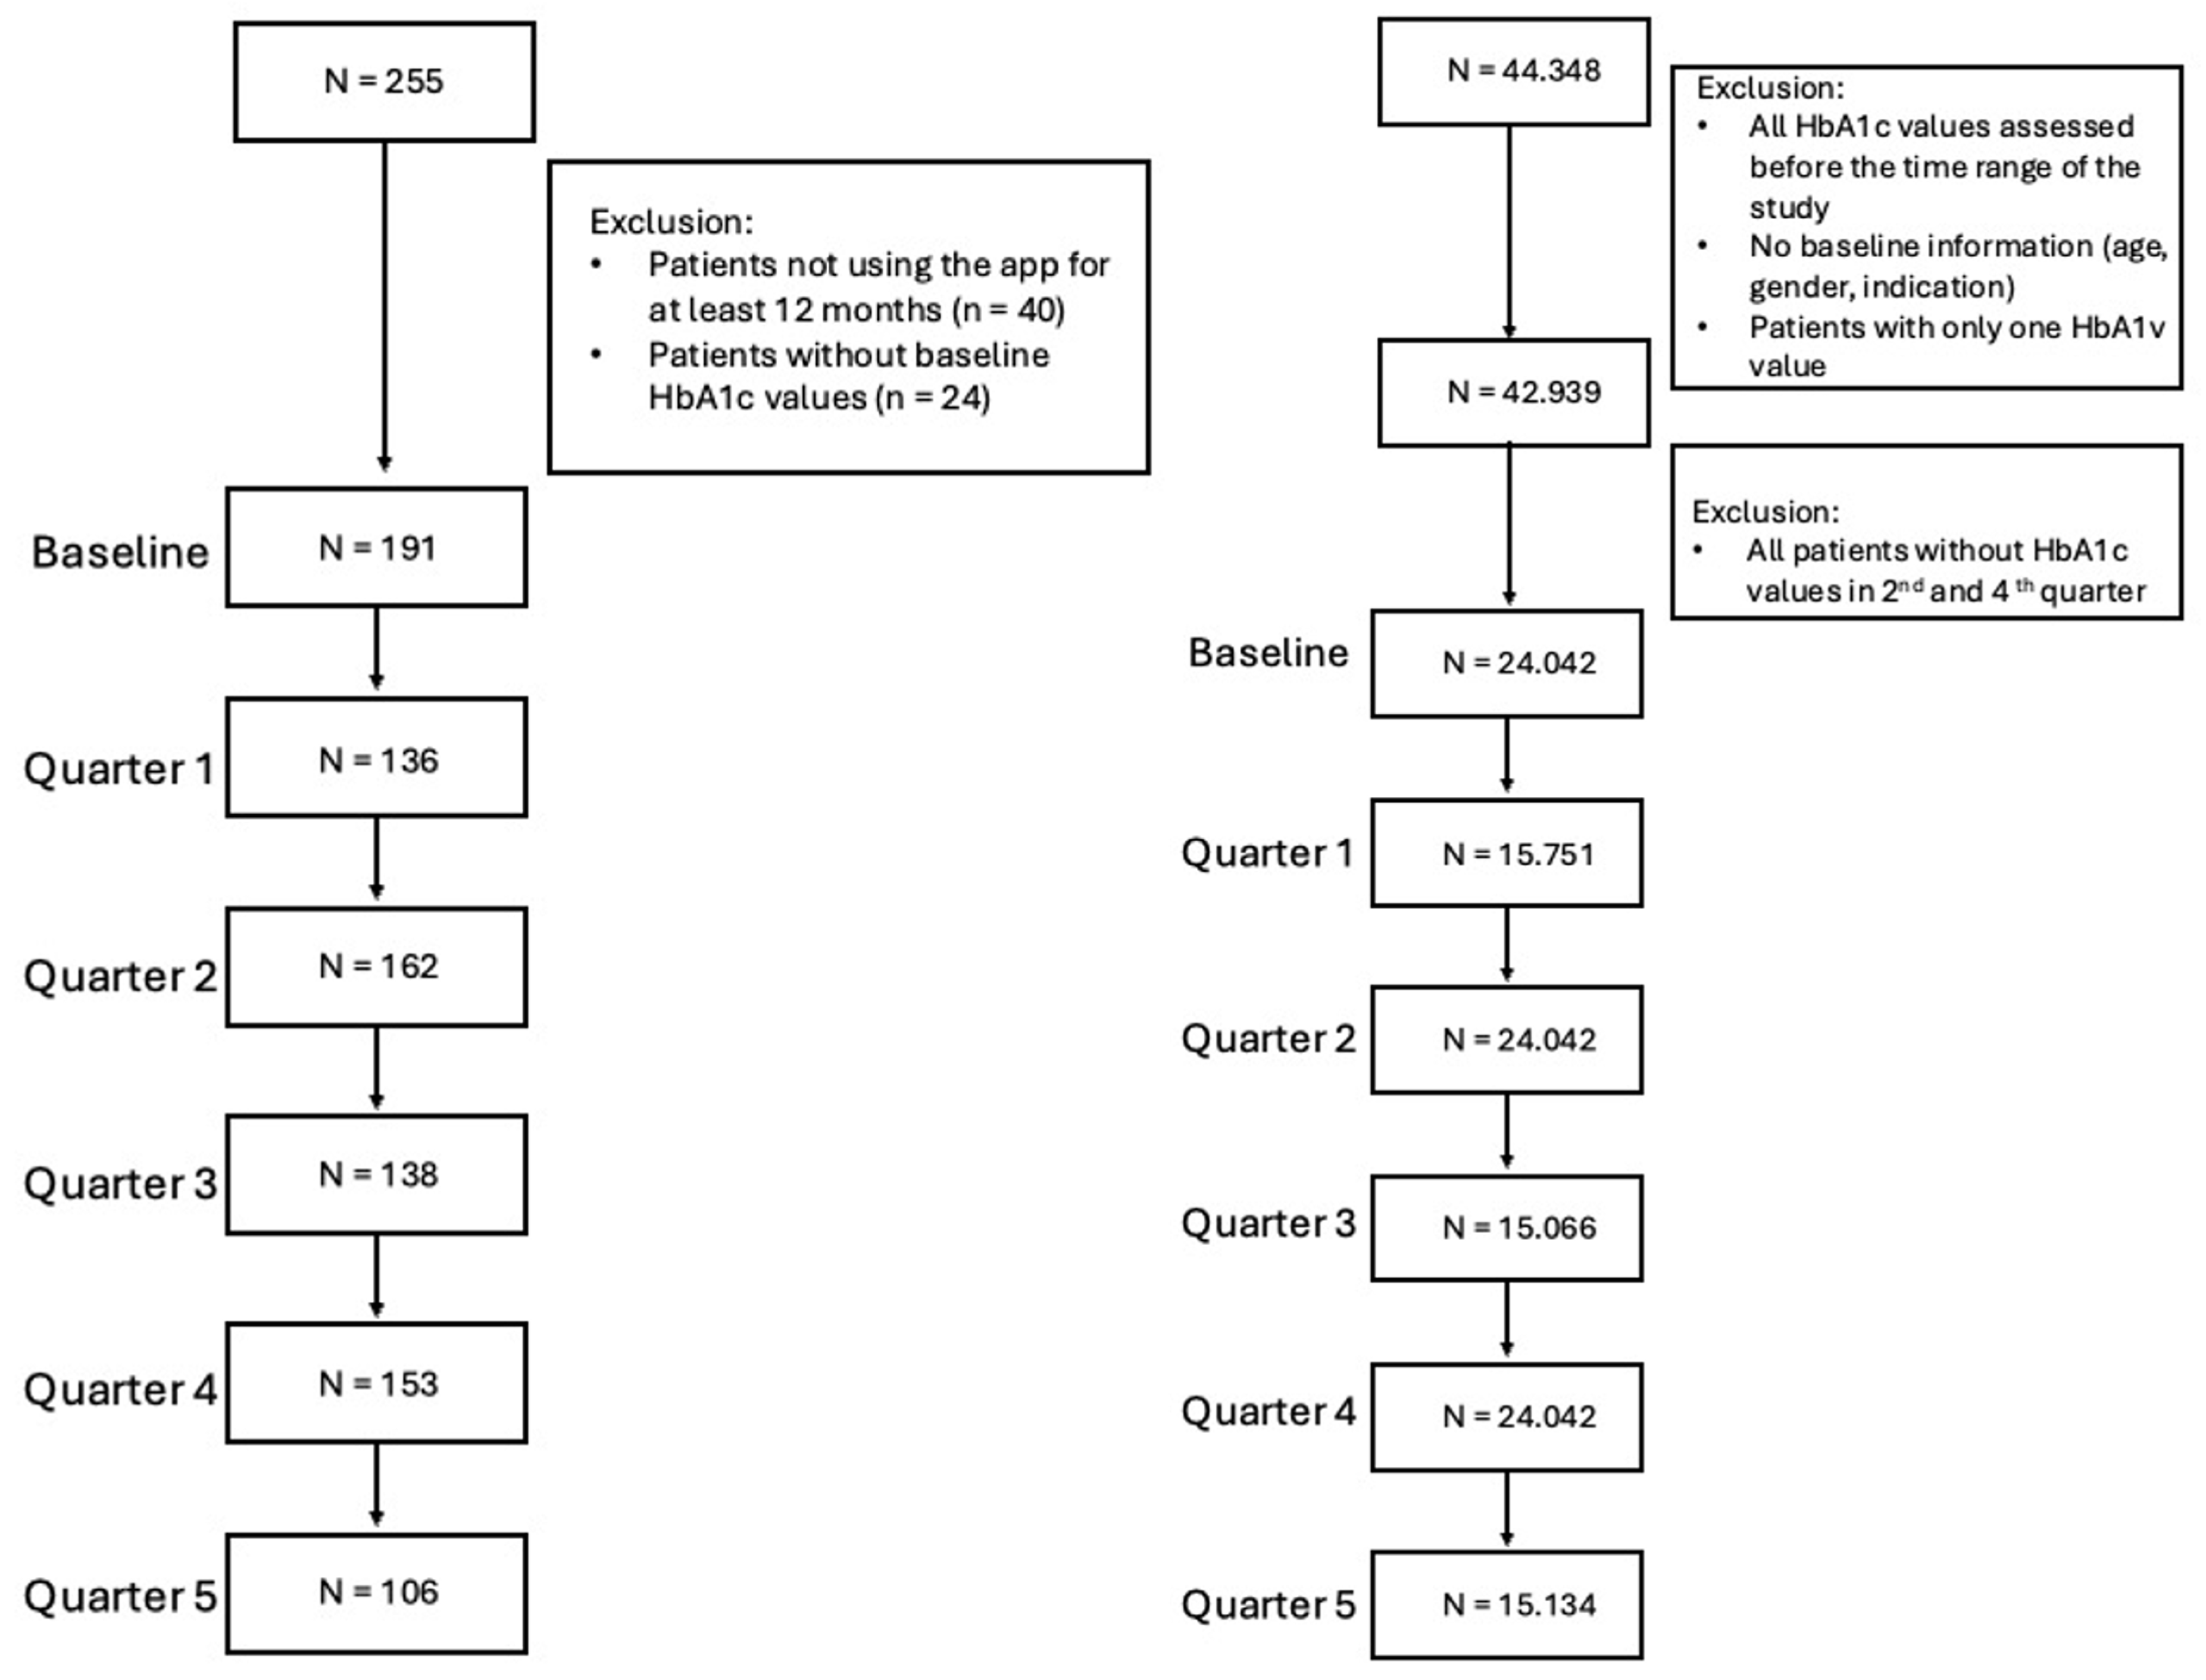
Figure 1. Patient flow chart and data availability of the intervention group (IG) and the AOK Nordost sample (CG).
Diabetology 06 00085 g001
Figure 2. Empirical cumulative distribution function (eCDF) plots for all matching covariates, with the black line showing the intervention sample and the grey line showing the control sample.
Diabetology 06 00085 g002
Figure 3. Estimated marginal means and 95% confidence intervals for the HbA1c reduction by analysis over time. CG, control group; CIR, copy increments to reference; HbA1c, glycated hemoglobin; IG, intervention group; MAR, missing at random; PP, per-protocol. The dashed red line shows the minimally important difference for changes in HbA1c, i.e., at least 0.4% points.
Diabetology 06 00085 g003
Table 1. Baseline characteristics of the intervention group and the control group samples.
IG SampleCG Sample
(N = 191)(N = 24.042)
Baseline HbA1c (in %)
   Mean (SD)8.66 (1.31)7.67 (1.37)
   Median [Min, Max]8.40 [6.60, 14.5]7.50 [1.10, 19.1]
Type of Diabetes
   T1DM32 (16.8%)1301 (5.4%)
   T1DM and T2DM0 (0%)134 (0.6%)
   T2DM159 (83.2%)22,607 (94.0%)
Gender
   Male116 (60.7%)11,574 (48.1%)
   Female75 (39.3%)12,468 (51.9%)
Age
   Mean (SD)60.9 (13.5)71.2 (11.5)
   Median [Min, Max]62.0 [23.0, 86.0]74.0 [21.0, 92.0]
Note: CG, control group; HbA1c, glycated hemoglobin; IG, intervention group; Min, minimum; Max, maximum; SD, standard deviation; T1DM/T2DM, diabetes mellitus type ½.
Table 2. Summary of balance before and after matching.
Std. Mean Diff. Var. RatioeCDF Mean
Before Matching
Distance0.3956.5930.253
Baseline HbA1c (in %)0.7540.9130.080
Type of Diabetes
   T1DM0.304 0.113
   T1DM and T2DM−0.075 0.006
   T2DM−0.289 0.108
Gender
   Male0.258 0.126
   Female−0.258 0.126
Age−0.7641.3830.143
After Matching (1:1)
Distance0.0161.2420.004
Baseline Hba1c (in %)−0.0021.0060.002
Type of Diabetes
   T1DM0.000 0.000
   T1DM and T2DM0.000 0.000
   T2DM0.000 0.000
Gender
   Male0.011 0.005
   Female−0.011 0.005
Age−0.0051.0050.004
After Matching (1:2)
Distance0.0311.6250.021
Baseline Hba1c (in %)0.0001.0070.031
Type of Diabetes
   T1DM0.000 0.000
   T1DM and T2DM0.000 0.000
   T2DM0.000 0.000
Gender
   Male0.000 0.000
   Female0.000 0.000
Age−0.0091.0520.021
Note: eCDF, empirical cumulative distribution function statistic; HbA1c, glycated hemoglobin; T1DM/T2DM, diabetes mellitus type 1/2; Std. mean Diff., standardized mean differences; Var. Ratio, variance ratios.
Table 3. Baseline characteristics of the IG sample and the matched CG samples (1:1 and 1:2 matching).
IG SampleCG SampleCG Sample 2
(N = 191)(N = 191)(N = 382)
Baseline HbA1c (in %)
   Mean (SD)8.66 (1.31)8.66 (1.31)8.66 (1.31)
   Median [Min, Max]8.40 [6.60, 14.5]8.40 [6.60, 14.4]8.40 [6.60, 14.4]
Type of Diabetes
   T1DM32 (16.8%)32 (16.8%)64 (16.8%)
   T2DM159 (83.2%)159 (83.2%)318 (83.2%)
Gender
   Male116 (60.7%)115 (60.2%)232 (60.7%)
   Female75 (39.3%)76 (39.8%)150 (39.3%)
Age
   Mean (SD)60.9 (13.5)61.0 (13.5)61.0 (13.1)
   Median [Min, Max]62.0 [23.0, 86.0]62.0 [21.0, 86.0]61.0 [21.0, 86.0]
Note: CG, control group; HbA1c, glycated hemoglobin; IG, intervention group; Min, minimum; Max, maximum; SD, standard deviation; T1DM/T2DM, diabetes mellitus type 1/2.
Table 4. Estimated marginal means and 95% confidence intervals for the HbA1c reduction by analysis.
AnalysisQuarterIGCG
CIR1−0.43 [−0.62; −0.24]−0.04 [−0.23; 0.16]
CIR2−0.60 [−0.79; −0.42]−0.16 [−0.34; 0.03]
CIR3−0.59 [−0.78; −0.39]−0.25 [−0.46; −0.05]
CIR4−0.66 [−0.85; −0.46]−0.36 [−0.54; −0.17]
CIR5−0.73 [−0.95; −0.52]−0.41 [−0.61; −0.21]
PP1−0.48 [−0.69; −0.28]−0.06 [−0.26; 0.15]
PP2−0.68 [−0.88; −0.49]−0.24 [−0.43; −0.05]
PP3−0.69 [−0.90; −0.48]−0.25 [−0.46; −0.04]
PP4−0.67 [−0.87; −0.47]−0.38 [−0.57; −0.19]
PP5−0.87 [−1.08; −0.65]−0.46 [−0.66; −0.25]
2:1 (MAR)1−0.49 [−0.68; −0.30]−0.09 [−0.24; 0.06]
2:1 (MAR)2−0.65 [−0.83; −0.46]−0.14 [−0.29; 0.00]
2:1 (MAR)3−0.63 [−0.83; −0.44]−0.30 [−0.45; −0.15]
2:1 (MAR)4−0.68 [−0.86; −0.49]−0.33 [−0.48; −0.18]
2:1 (MAR)5−0.81 [−1.01; −0.61]−0.36 [−0.51; −0.21]
Note: CG, control group; CIR, copy increments to reference; HbA1c, glycated hemoglobin; IG, intervention group; MAR, missing at random; PP, per-protocol; SD, standard deviation; T1DM/T2DM, diabetes mellitus type 1/2.
Table 5. Results of the hypothesis testing for the secondary endpoint HbA1c level changes after 6 months.
QuarterHypothesisEstimate (95% CI)t-StatisticdfpFDRCohen’s d
CIR
2IG−0.60 [−0.79; −0.42]−2.1336650.017 *−0.49 [−0.64, −0.33]
2IG vs. CG−0.45 [−0.67; −0.22]−3.884829<0.0001 ***−0.27 [−0.41, −0.13]
4IG−0.66 [−0.85; −0.46]−2.6016650.005 **−0.52 [−0.67, −0.36]
4IG vs. CG−0.30 [−0.53; −0.07]−2.5398290.011 **−0.18 [−0.31, −0.04]
PP
2IG−0.68 [−0.88; −0.49]−2.8356030.002 **−0.54 [−0.70, −0.38]
2IG vs. CG−0.44 [−0.68; −0.20]−3.601707<0.0001 ***−0.27 [−0.42, −0.12]
4IG−0.67 [−0.87; −0.47]−2.6146410.005 **−0.52 [−0.67, −0.36]
4IG vs. CG−0.28 [−0.53; −0.04]−2.2717310.023 *−0.17 [−0.31, −0.02]
2:1 (MAR)
2IG−0.65 [−0.83; −0.46]−2.64710260.004 *−0.43 [−0.56, −0.31]
2IG vs. CG−0.50 [−0.71; −0.30]−4.8451222<0.0001 ***−0.28 [−0.39, −0.16]
4IG−0.68 [−0.86; −0.49]−2.95510690.002 **−0.44 [−0.56, −0.32]
4IG vs. CG−0.34 [−0.55; −0.14]−3.26212920.001 *−0.18 [−0.29, −0.07]
Significance Codes: “***”, 0; “**”, 0.001; “*”, 0.01; Note: CG, control group; CIR, copy increments to reference; df, degrees of freedom; HbA1c, glycated hemoglobin; IG, intervention group; MAR, missing at random; pFDR, p-value adjusted with the False Discovery Rate; PP, per-protocol; SD, standard deviation; T1DM/T2DM, diabetes mellitus type 1/2.
Disclaimer/Publisher’s Note: The statements, opinions and data contained in all publications are solely those of the individual author(s) and contributor(s) and not of MDPI and/or the editor(s). MDPI and/or the editor(s) disclaim responsibility for any injury to people or property resulting from any ideas, methods, instructions or products referred to in the content.