Article

Diabetes Worsens Outcomes After Asphyxial Cardiac Arrest in Rats

1
Anesthesiology, TVHS VA Medical Center, Nashville, TN 37212, USA
2
Department of Anesthesiology, Vanderbilt University Medical Center, Nashville, TN 37232, USA
3
Anesthesiology, Tokushima University, Tokushima 770-8503, Japan
4
Department of Molecular Physiology and Biophysics, Vanderbilt University School of Medicine, Nashville, TN 37232, USA
5
Department of Anesthesiology, University Medicine Greifswald, 17475 Greifswald, Germany
6
School of Medicine, Meharry Medical College, Nashville, TN 37208, USA
7
Department of Pharmacology, Vanderbilt University, Nashville, TN 37232, USA
*
Author to whom correspondence should be addressed.
Diabetology 2025, 6(8), 78; https://doi.org/10.3390/diabetology6080078 (registering DOI)
Submission received: 6 June 2025 / Revised: 5 July 2025 / Accepted: 17 July 2025 / Published: 1 August 2025

Abstract

Background: Diabetes mellitus is associated with worse outcomes after cardiac arrest. Hyperglycemia, diabetes treatments and other long-term sequalae may contribute to this association. We sought to determine the acute effect of diabetes on the return of spontaneous circulation (ROSC) and post-arrest cardiac function in a rat cardiac arrest model. Methods: Eighteen male Wistar rats were utilized, and 12 underwent the induction of type II diabetes for 10 weeks through a high-fat diet and the injection of streptozotocin. The carotid artery flow and femoral arterial pressure were measured. Seven minutes of asphyxial cardiac arrest was induced. An external cardiac compression was performed via an automated piston. Post-ROSC, epinephrine was titrated to a mean arterial pressure (MAP) of 70 mmHg. Data was analyzed using the Mann–Whitney test. The significance was set at p ≤ 0.05. Results: The rate of the ROSC was significantly lower in animals with diabetes, 50% compared to 100% in non-diabetics. Additionally, it took significantly longer to achieve the ROSC in diabetics, p = 0.034. In animals who survived, the cardiac function was reduced, as indicated by an increased epinephrine requirement, p = 0.041, and a decreased cardiac output at the end of the experiment, p = 0.017. The lactate, venous and arterial pressures, heart rate and carotid flow did not differ between groups at 2 h. Conclusions: Diabetes negatively affects the survival from cardiac arrest. Here, the critical difference was the rate of the conversion to a life-sustaining rhythm and the achievement of the ROSC. The post-ROSC cardiac function was depressed in diabetic animals. Interventions targeted at improving defibrillation success may be important in diabetics.

Graphical Abstract

1. Background

There remains a high rate of mortality after a patient suffers an out-of-hospital cardiac arrest (OHCA) [1]. An incremental improvement in outcomes has been demonstrated in recent years, likely due to increased cardiopulmonary resuscitation (CPR) teaching and, thus, increased bystander CPR rates [2]. Despite this, few major advances have been made in the field of OHCA resuscitation, and with increasing rates of comorbid diseases such as diabetes mellitus (DM) among the general population, additional work in this field is mandated. Known associations with poor outcomes after arrest include the age, rhythm on presentation, presence of known heart failure, renal disease and DM [3,4,5]. In fact, in an analysis of comorbidities and their association with outcomes after arrest, DM was a stand-out and was strongly negatively correlated with survival [3]. One meta-analysis found that DM patients had an odds ratio of 0.78 for survival from OHCA and an even worse odds ratio (0.55) for survival with good neurologic function [6].
Many previously promising interventions, such as post-arrest targeted temperature management, demonstrate decreased efficacy in the face of DM [7]. Given the wide-spread multiorgan effects of DM, it is unclear whether these associations stem from DM itself or common associated comorbid diseases. DM is associated with increased coronary and vascular disease and, thus, myocardial infarction. Diabetes is also associated with up to a 4-fold increase in sudden cardiac arrest. However, the risk is not completely captured by the presence of coronary artery disease, because, when that and several other common factors were adjusted for, DM still carried a 2.3-fold risk of cardiac arrest compared to non-DM men [8]. Diabetes also causes changes in the circulating volume, kidney disease, chronic cerebral vascular disease and obesity [9,10].
DM type II is marked by both insulin resistance and relative hypo-insulinemia, as pancreatic beta cells decrease insulin production. Both of these functions may lead to elevated blood glucose levels [11]. Hyperglycemia increases the ischemia–reperfusion injury (IRI) in vitro and is associated with negative outcomes in vivo [12]. For this reason, guidelines on the reperfusion of organs after recanalization, such as in a thrombectomy after an acute stroke, suggest glycemic control as an early priority [13,14]. Hyperglycemia in the setting of IRI worsens calcium handling; increases reactive oxygen species and lactic acid production; decreases nitric oxide, thus decreasing tissue perfusion; and increases edema and inflammation [12].
In the general population, there exists a wide range of DM chronicity with varied comorbidities and varied single- or multi-agent treatment strategies. It is, therefore, difficult to directly assess the effects of DM on cardiac arrest and its resuscitation in a real-world population. DM animal models may be developed using genetic alterations, such as in Zucker diabetic fatty (ZDF) rats, or exogenous induction using agents like streptozotocin [15]. Rats remain resistant to hyperglycemia when directly compared to humans and require relatively high blood glucose levels to see changes associated with DM. While either approach to DM phenotype induction may have its advantages, the exogenous induction approach allows for a titrated phenotype both in terms of chronicity and severity. Here, we tested the hypothesis that DM leads to lower rates of the ROSC and decreased cardiac function after cardiac arrest in our rodent model.

2. Methods

2.1. Diabetes Induction

Animals utilized were housed and cared for according to institutional and ARRIVE guidelines, and all protocols were approved by institutional IACUC. Animals were allowed continuous feed and provided with 12 h light/dark cycles. Eighteen adult male Wistar rats—6 non-diabetic and 12 diabetic, 457 ± 101 g—were utilized. Rats were fed a ‘Western-diet’, specialized high-fat high-sugar chow, to promote insulin resistance throughout DM induction. Non-DM animals were fed standardized institutional chow, approximating 25% protein, 15% fat and 60% carbohydrates. After 2 weeks, animals were given a one-time injection of low-dose intraperitoneal streptozotocin (30 mg kg−1) to reduce pancreatic beta cell function. This resulted in a combination of insulin resistance and deficiency, thus mimicking DM II. This phenotype was allowed to develop for 10–12 weeks, and successful induction was ensured with random glucose levels, >200 mg dL−1, checked via tail prick every two weeks. See supplementary figures for glucose and weights during development, Figures S1 and S2 respectively.

2.2. Surgical Preparation

Setup for the arrest experiment was performed as previously described [16]. Sedation, intubation and mechanical ventilation were performed. Ventilator settings were as follows: FiO2 40% and 8 cc kg−1 tidal volumes. Temperature control of the animal was performed throughout the periprocedural period with goal temperatures of 36.5 to 37.5 °C.
Surgical cutdown was used to gain vascular access in the jugular and femoral regions as previously described [16]. The jugular vein was cannulated for central venous pressure (CVP) transduction. The femoral artery was transduced for blood pressure transduction and arterial blood sampling, and the femoral vein was used for drug delivery. Carotid flow was measured via a non-invasive vascular flow probe (1PRB flowprobe, T402 flowmeter, Transonic Systemic Inc., Ithica, NY, USA).

2.3. Cardiac Arrest

After a short post cannulation stabilization period and the collection of baseline measurements, inspired oxygen was converted to room air, FiO2 21%, for 5 min. Rocuronium (3 mg kg−1, Sagent Pharmaceuticals Inc., Schaumburg, IL, USA) was administered, and isoflurane was titrated down to 0.5%. Induction of asphyxia and arrest was induced 1 min after administration of rocuronium. This was achieved via cessation of mechanical ventilation, while ensuring no residual spontaneous respiratory effort was present. Asphyxia proceeded for 7 min before the start of resuscitation.
An automated chest compressor performed external compressions at a rate of 200 min−1. Compression depth was increased to achieve a diastolic pressure of greater than 23 mmHg during CPR, while allowing for full chest recoil. A 2 microgram (mcg) epinephrine bolus was given after 3 min of CPR and redosed every 5 min. Defibrillation occurred in the antero-posterior direction externally, using human internal paddles (Zoll M series Defibrillator, Zoll Medical Corp., Chelmsford, MA, USA). Defibrillation was attempted at 5 J, then 7 J, then 10 J for all remaining attempts. Total allotted CPR time was limited to 30 min. Once ROSC was achieved, epinephrine drip was used to achieve a mean arterial pressure (MAP) of at least 70 mmHg. After a 15 min stabilization period, isoflurane was resumed at 1%, and FiO2 was down-titrated to 50% for the remaining experimental period. Arterial lactate was measured using a point of care device (Nova Biomedical Corp., Waltham, MA, USA). Transthoracic echocardiography (Philips Affiniti 50, Philips Ultrasound Inc, Reedsville, PA, USA) was performed. Continuous data were recorded using Powerlab Series 16/30 in LabChart (Version 8.1.13, AD Instruments North America, Colorado Springs, CO, USA).

2.4. Statistics

Power analysis was calculated using anticipated change in mean epinephrine dosing requirements. Assuming a 25% difference in means with 15% standard deviation and equal group sizes, a sample size of 7 was expected to meet a power of 80%, and alpha of minimum 0.05 as determined by PS: Power and Sample Size Calculator (v 3.1.2). Notably we stopped this study before the pre-determined N given the 540% difference in means, which was much larger than the 25% anticipated difference. Data normality was analyzed using Shapiro–Wilk test. Data were considered not normally distributed if even one timepoint did not meet normality. Given the small N, each variable had at least one timepoint where one group did not display normal distribution. Data are represented as mean and standard deviation, with individual points demonstrated. Therefore, all variables were analyzed using the Mann–Whitney test. Survival was analyzed using chi-square test. Significance was set at p < 0.05, two-tailed. Statistical analysis was performed using Prism 9.1.2 (GraphPad Software Inc., Solana Beach, CA, USA). Symbols included in figures represent the following: * ≤ 0.05 and ** ≤ 0.01.

3. Results

3.1. Diabetic Markers

Our DM model resulted in an appropriate and significant elevation in blood glucose levels at baseline, 407 mg dL−1 (353–490), as compared to non-diabetic control animals, 159 mg dL−1 (150–222), p = 0.001. This difference remained significant at both the 15 min and 2 hour (h) post-ROSC timepoints, p = 0.015 and p = 0.002, respectively, Figure 1. There was a significant increase in glucose at 2 h, 600 mg dL−1 (539–600), compared to the baseline within the diabetic group, p = 0.005. This may be explained by the beta agonism from the use of epinephrine, as well as the release of endogenous catecholamines from the arrest and compressions [17]. The non-DM animals did not have any significant within-group variation in glucose at any timepoint. Note that 600 mg dL−1 was the upper limit of the point-of-care blood glucose testing apparatus.
The diabetic induction did not significantly alter the animals’ weight of 0.396 kg (0.348–0.552) as compared to non-DM animals, 0.530 kg (0.488–0.560), p = 0.114. A weight reduction could represent dehydration from the glucose osmotic effect, muscle loss, an inadequate oral intake or a combination of these effects.

3.2. Markers of Arrest and Recovery

The rate of the ROSC is dependent upon the severity of the insult and in an appropriate model must be titrated to maintain external validity. There was a significantly higher rate of achieving the ROSC in non-diabetic animals, all of whom survived. Half of the DM animals were unable to achieve the ROSC, p = 0.034. In those that did have a ROSC, the time to achieve the ROSC was significantly longer in DM rats, 311 s (243–560), as compared to non-DM rats 159 s (121–265), p = 0.041, Figure 2A. The time to the ROSC is an additional marker of the IRI severity, and while CPR provides some brain flow, the longer the time to the ROSC, the larger the ischemic insult to major organs including the brain. Additionally, DM subjects required more epinephrine after the ROSC to maintain a MAP of 70 mmHg, 852 mcg (530–1477), compared to non-DM rats, 33 mcg (8–298), p = 0.015, Figure 2B. Epinephrine is used as an inotrope to maintain the cardiac output after myocardial ischemia and to stabilize the animal.
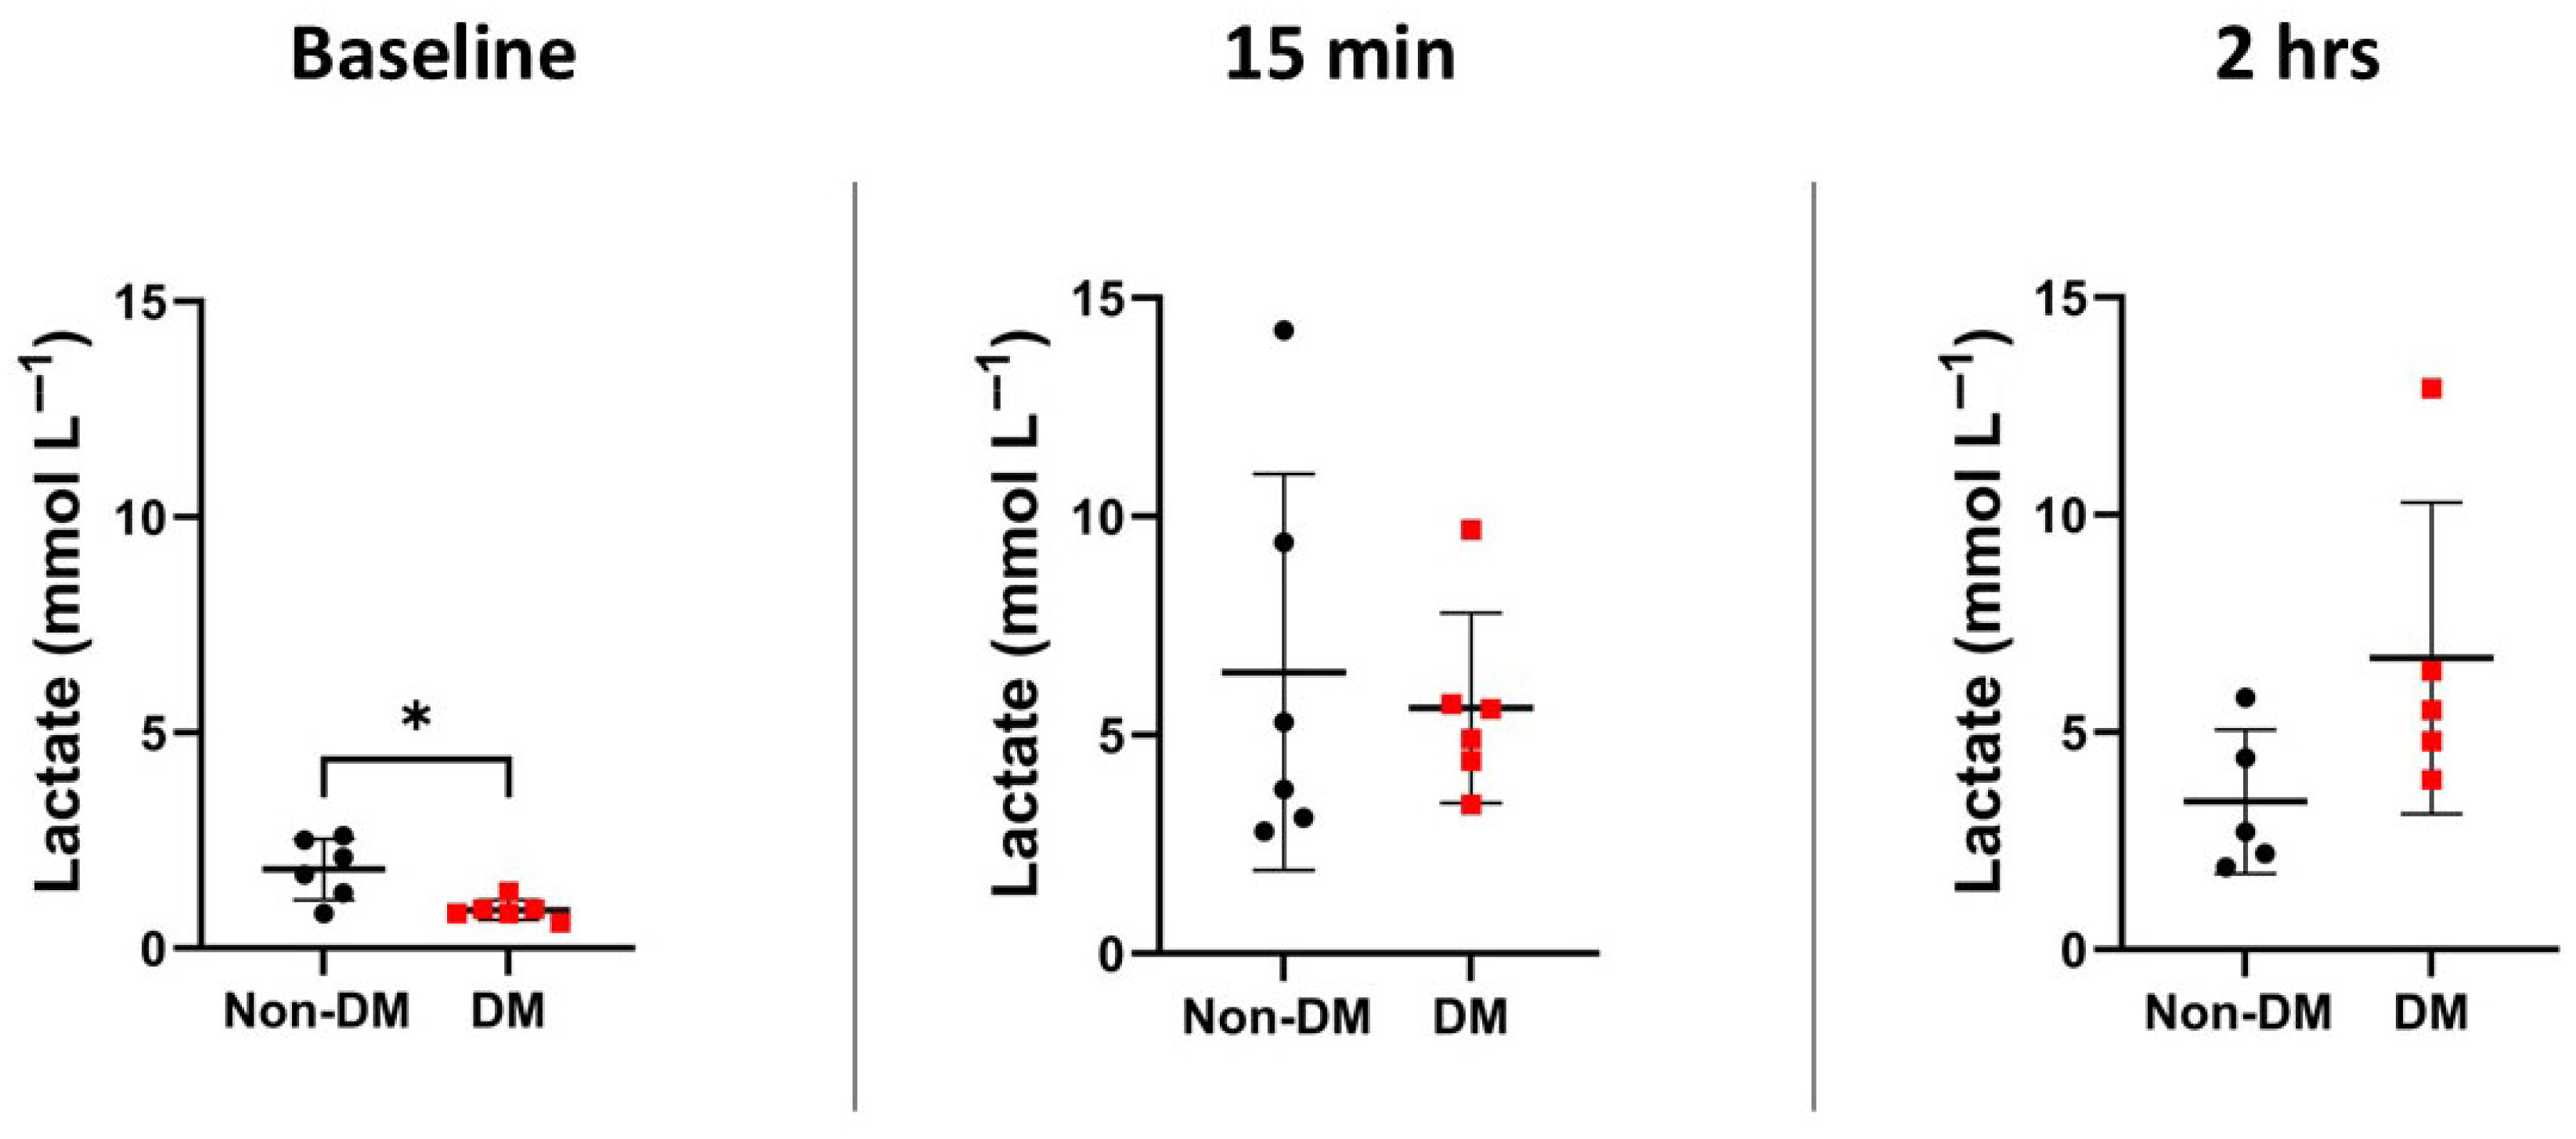
Lactate is a non-specific marker of a generalized ischemic insult and the anerobic metabolism. High post-arrest lactates are to be expected as reperfusion occurs; however, in a model where the animal is recovering well, the clearing of lactate should begin by 2 h. Lactate did significantly differ between groups at the baseline, non-DM 1.9 mmol L−1 (1.2–2.5) vs. DM 0.8 mmol L−1 (0.7–1.0), p = 0.037, Figure 3. Additionally, lactate did not differ between groups at either 15 min or 2 h, p = 0.699 and p = 0.095, respectively. Notably within-group comparisons demonstrated significantly increased lactate at 15 min compared to the baseline in both DM, p = 0.002, and non-DM, p = 0.002, groups. This lactate elevation remained significant in the DM group at 2 h, 5.5 mmol L−1 (4.3–9.6) and p = 0.004, but was no longer significantly elevated from the baseline in the non-DM group, 2.7 mmol L−1 (2.1–5.1) and p = 0.082.

3.3. Hemodynamic Variables

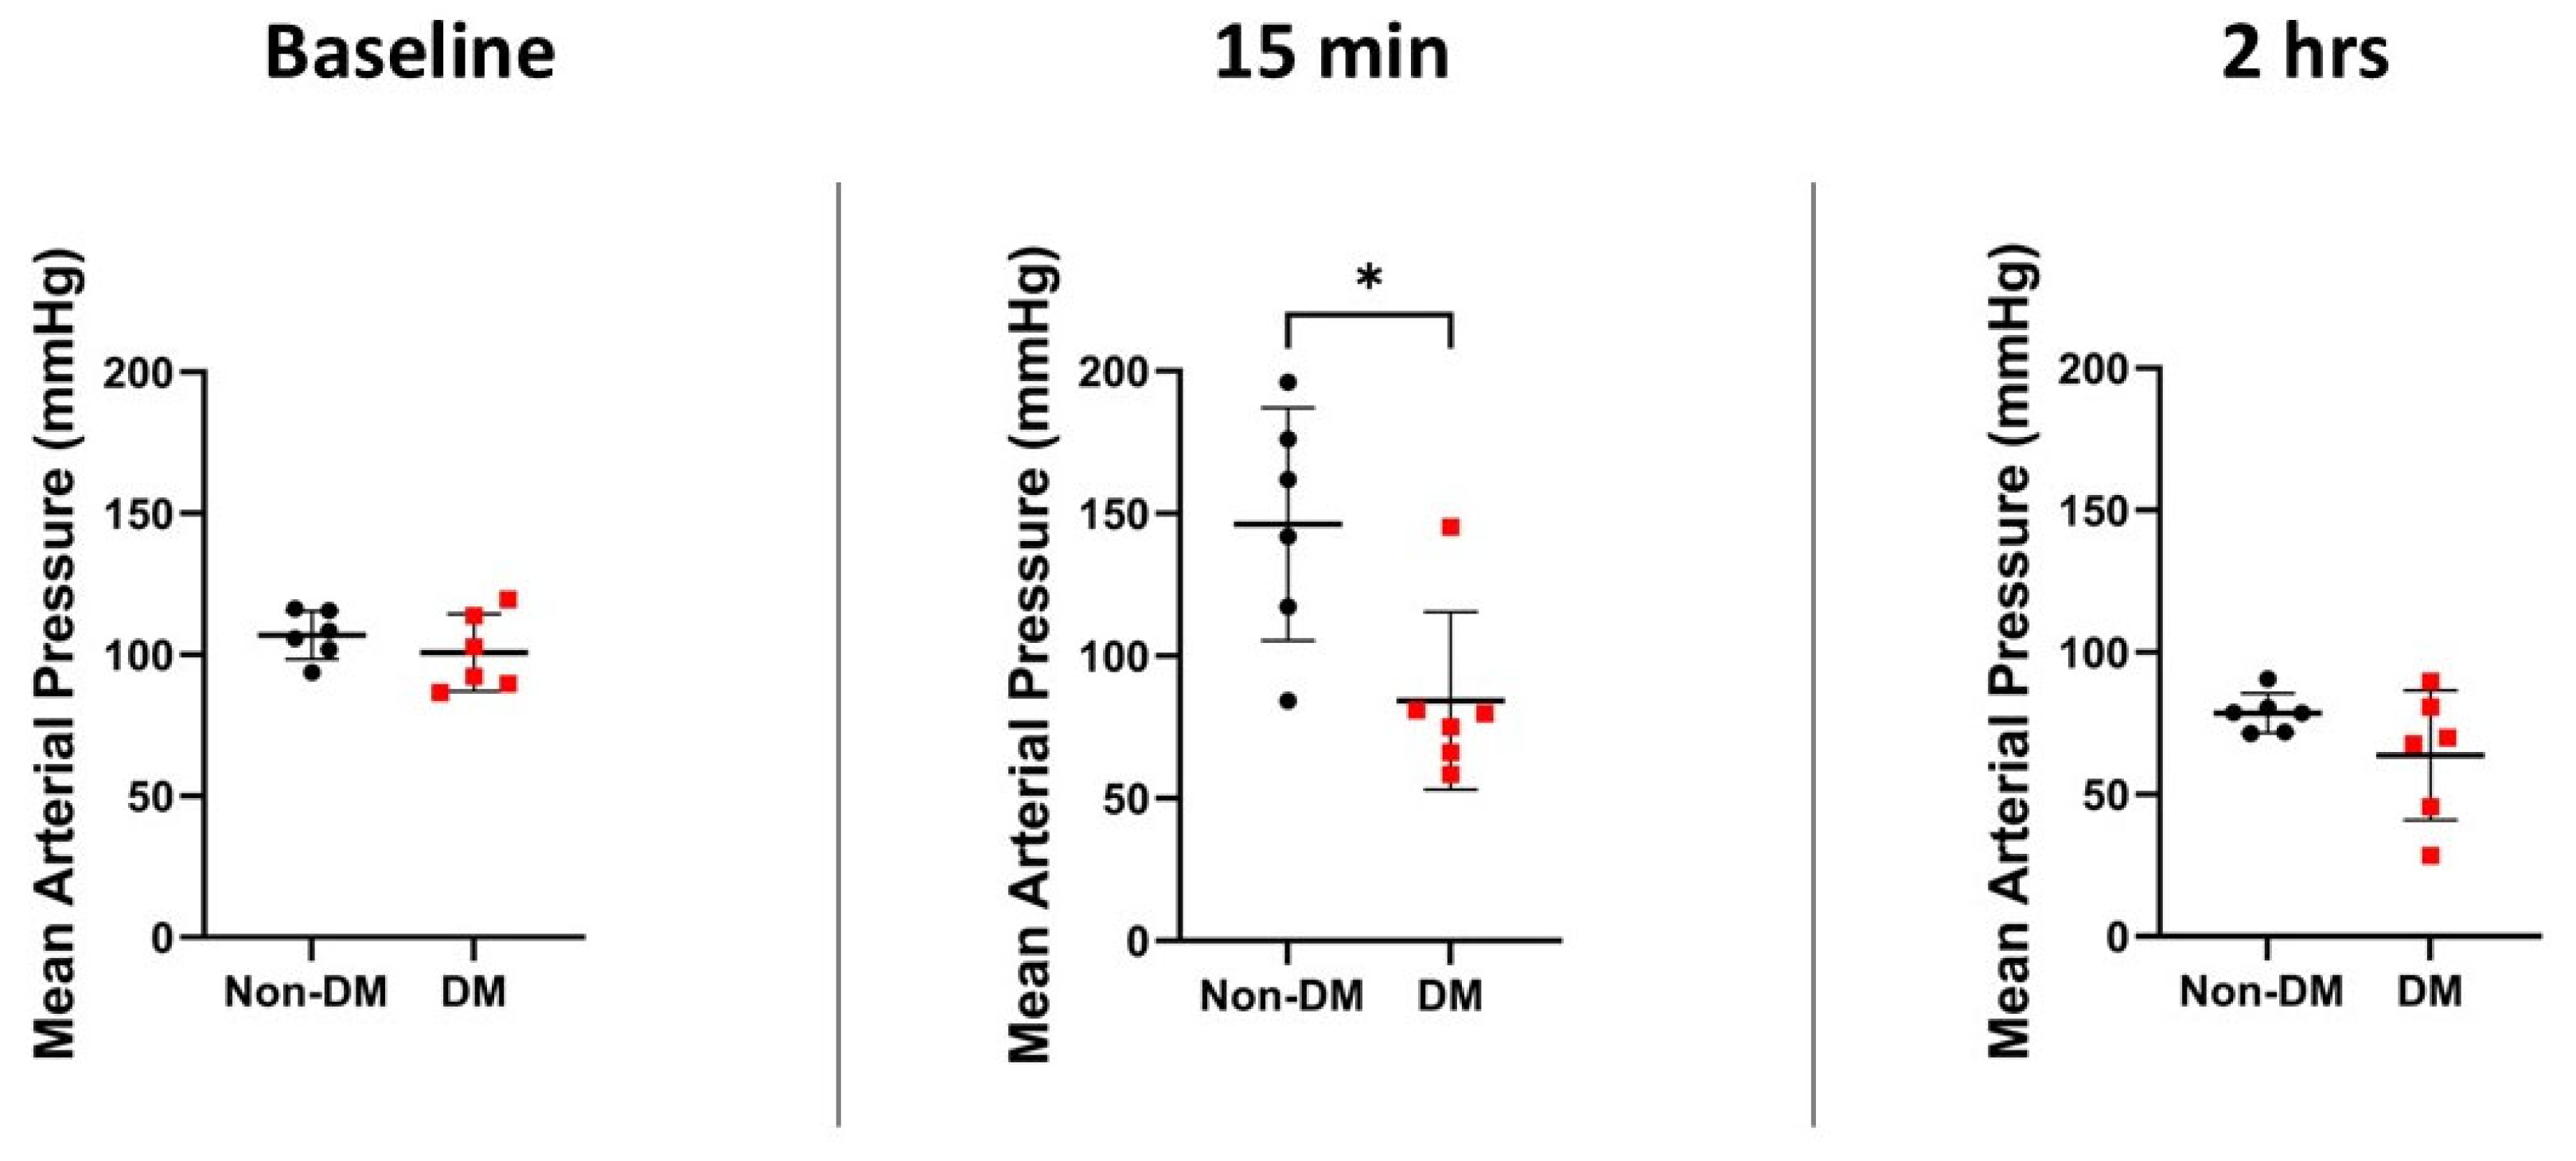
Blood pressure is the most accessible marker of perfusion after cardiac arrest. Targeting a minimal blood pressure after arrest aims to ensure perfusion to the at-risk, stunned or recently injured myocardium. There were no significant differences in the MAP between groups at the baseline, 107 mmHg (100–115) in non-DM and 97 mmHg (89–115) in DM, p = 0.394, Figure 4. There was a significantly elevated MAP in non-DM animals at 15 min, 152 mmHg, compared to DM animals at 15 min, 77 mmHg (64–97), p = 0.015. This elevation in non-DM animals at 15 min was not significantly larger than the non-DM baseline, p = 0.065, but was significantly higher than the 2 hr pressure in non-DM animals, 79 mmHg (71–83), p = 0.004. The MAP within the DM animals was not significantly different at any timepoint.
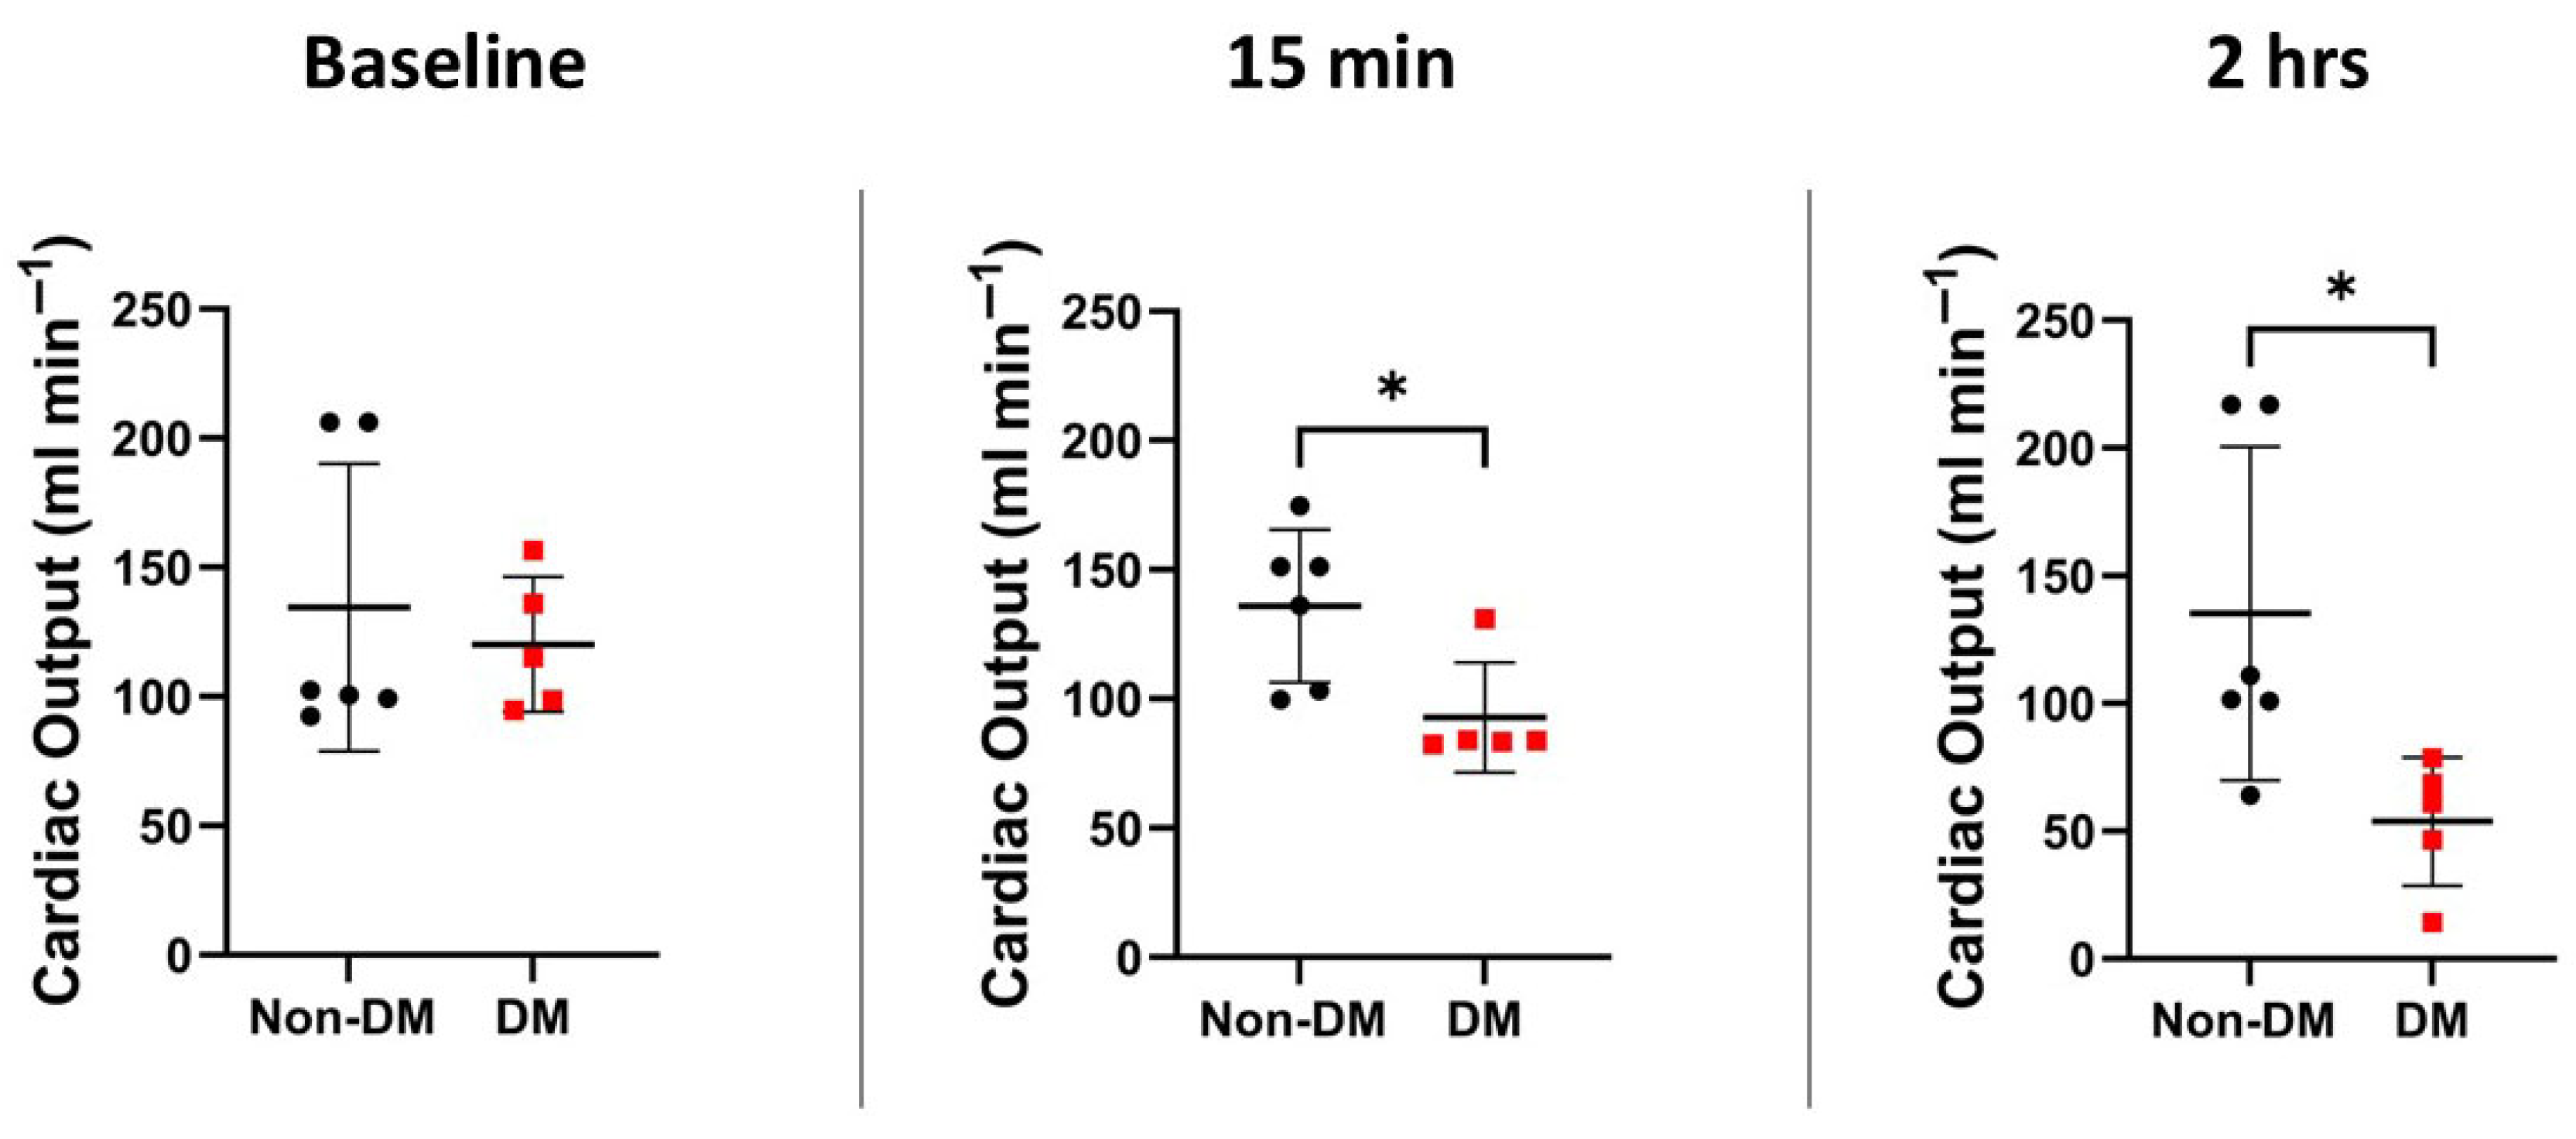
Blood pressure accounts for the cardiac output and systemic vascular resistance; however, both may be altered in the setting of cardiac arrest and epinephrine use. Measuring the cardiac output alone demonstrates the organ-specific injury from the arrest and resuscitation. The cardiac output as measured by transthoracic echocardiography was not significantly different between groups at the baseline, DM 115 mL min−1 (96–146) vs. non-DM 101 min−1 (97–206), p = 0.881, Figure 5. There was no significant change in the non-DM cardiac outputs across the study period. However, the DM cardiac output at 2 h was significantly decreased as compared to both the DM baseline, p = 0.008, and DM 15 min, p = 0.008.
The heart rate is a critical component of the cardiac output and an indicator of heart health and recovery in rats. The beta agonism from epinephrine may affect the heart rate. Heart rate did not significantly differ between non-DM rats, 298 beats min−1 (250–328), and DM rats, 290 beats min−1 (274–339), p = 0.818, Figure 6. The heart rate of non-DM animals was significantly elevated compared to DM animals at 15 min, 348 beats min−1 (322–377) vs. 287 beats min−1 (247–309), p = 0.026. The non-DM heart rate did not change significantly at any timepoint. However, the DM heart rate at 2 h, 213 beats min−1 (206–225), was significantly lower than that of both e the baseline and 15 min, p = 0.002 for both.
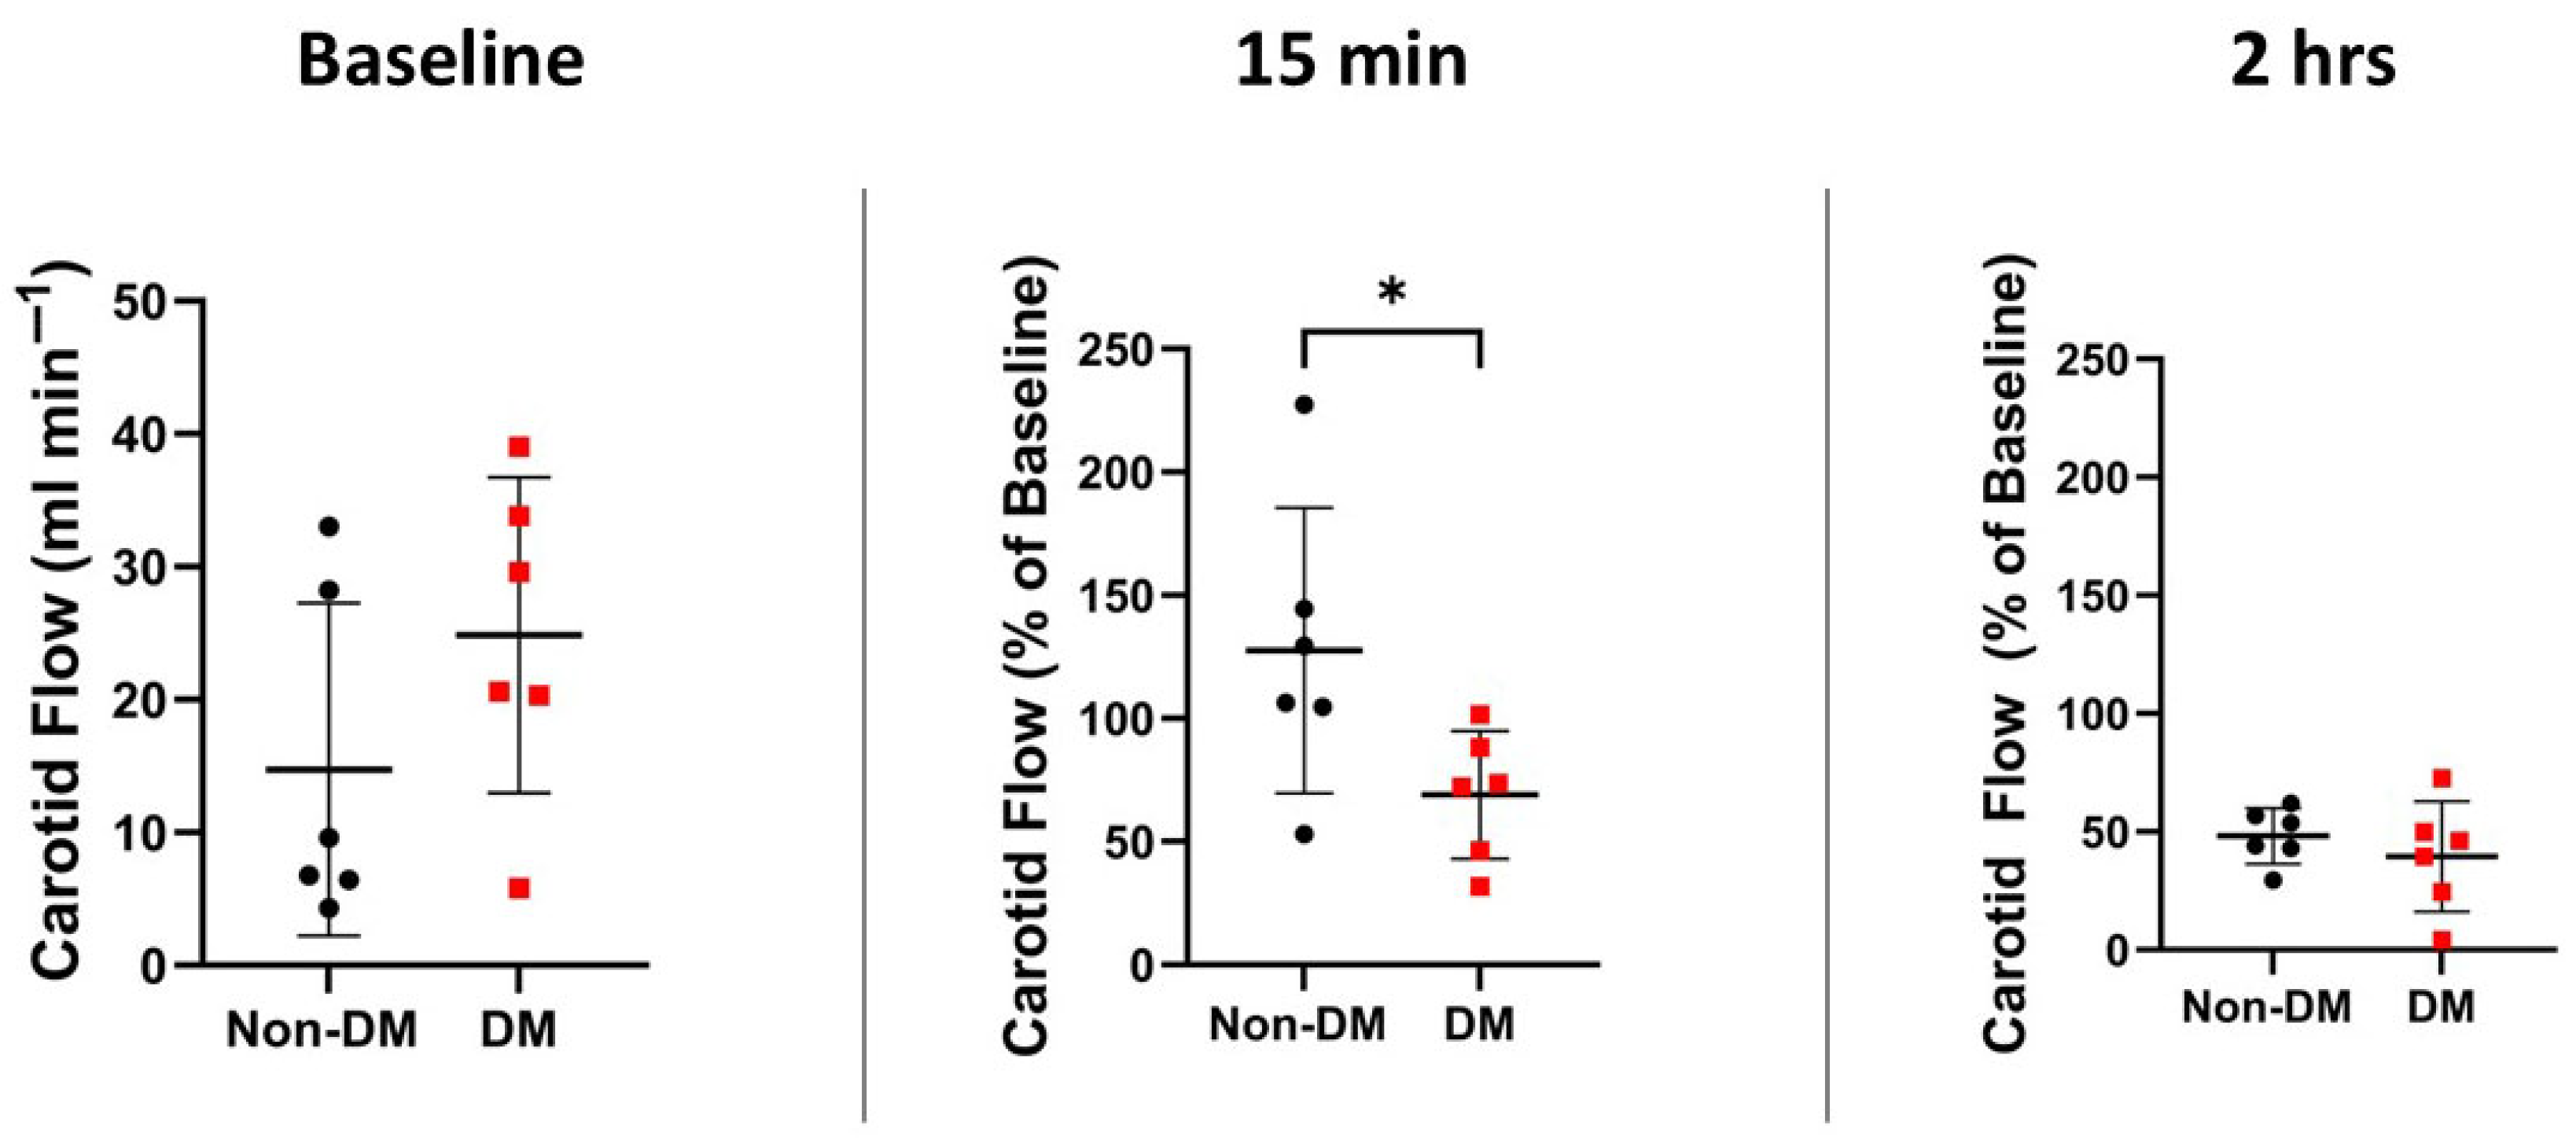
The goal of peri-arrest care is to ensure a neurologically intact recovery. Assessing carotid blood flow aids in evaluating the injury to this at-risk organ. The carotid flow did not differ significantly between groups at the baseline, non-DM 8.2 mL min−1 (5.9–29.4) vs. DM 25.1 mL min−1 (16.7–35.1), p = 0.240, Figure 7. The normalized carotid flow to each animal’s baseline demonstrated a decrease in flow in DM animals, 73% (43–92), compared to non-DM animals at 15 min, 118% (92–165), p = 0.026. There was no statistically significant difference between groups at 2 h, p = 0.485.
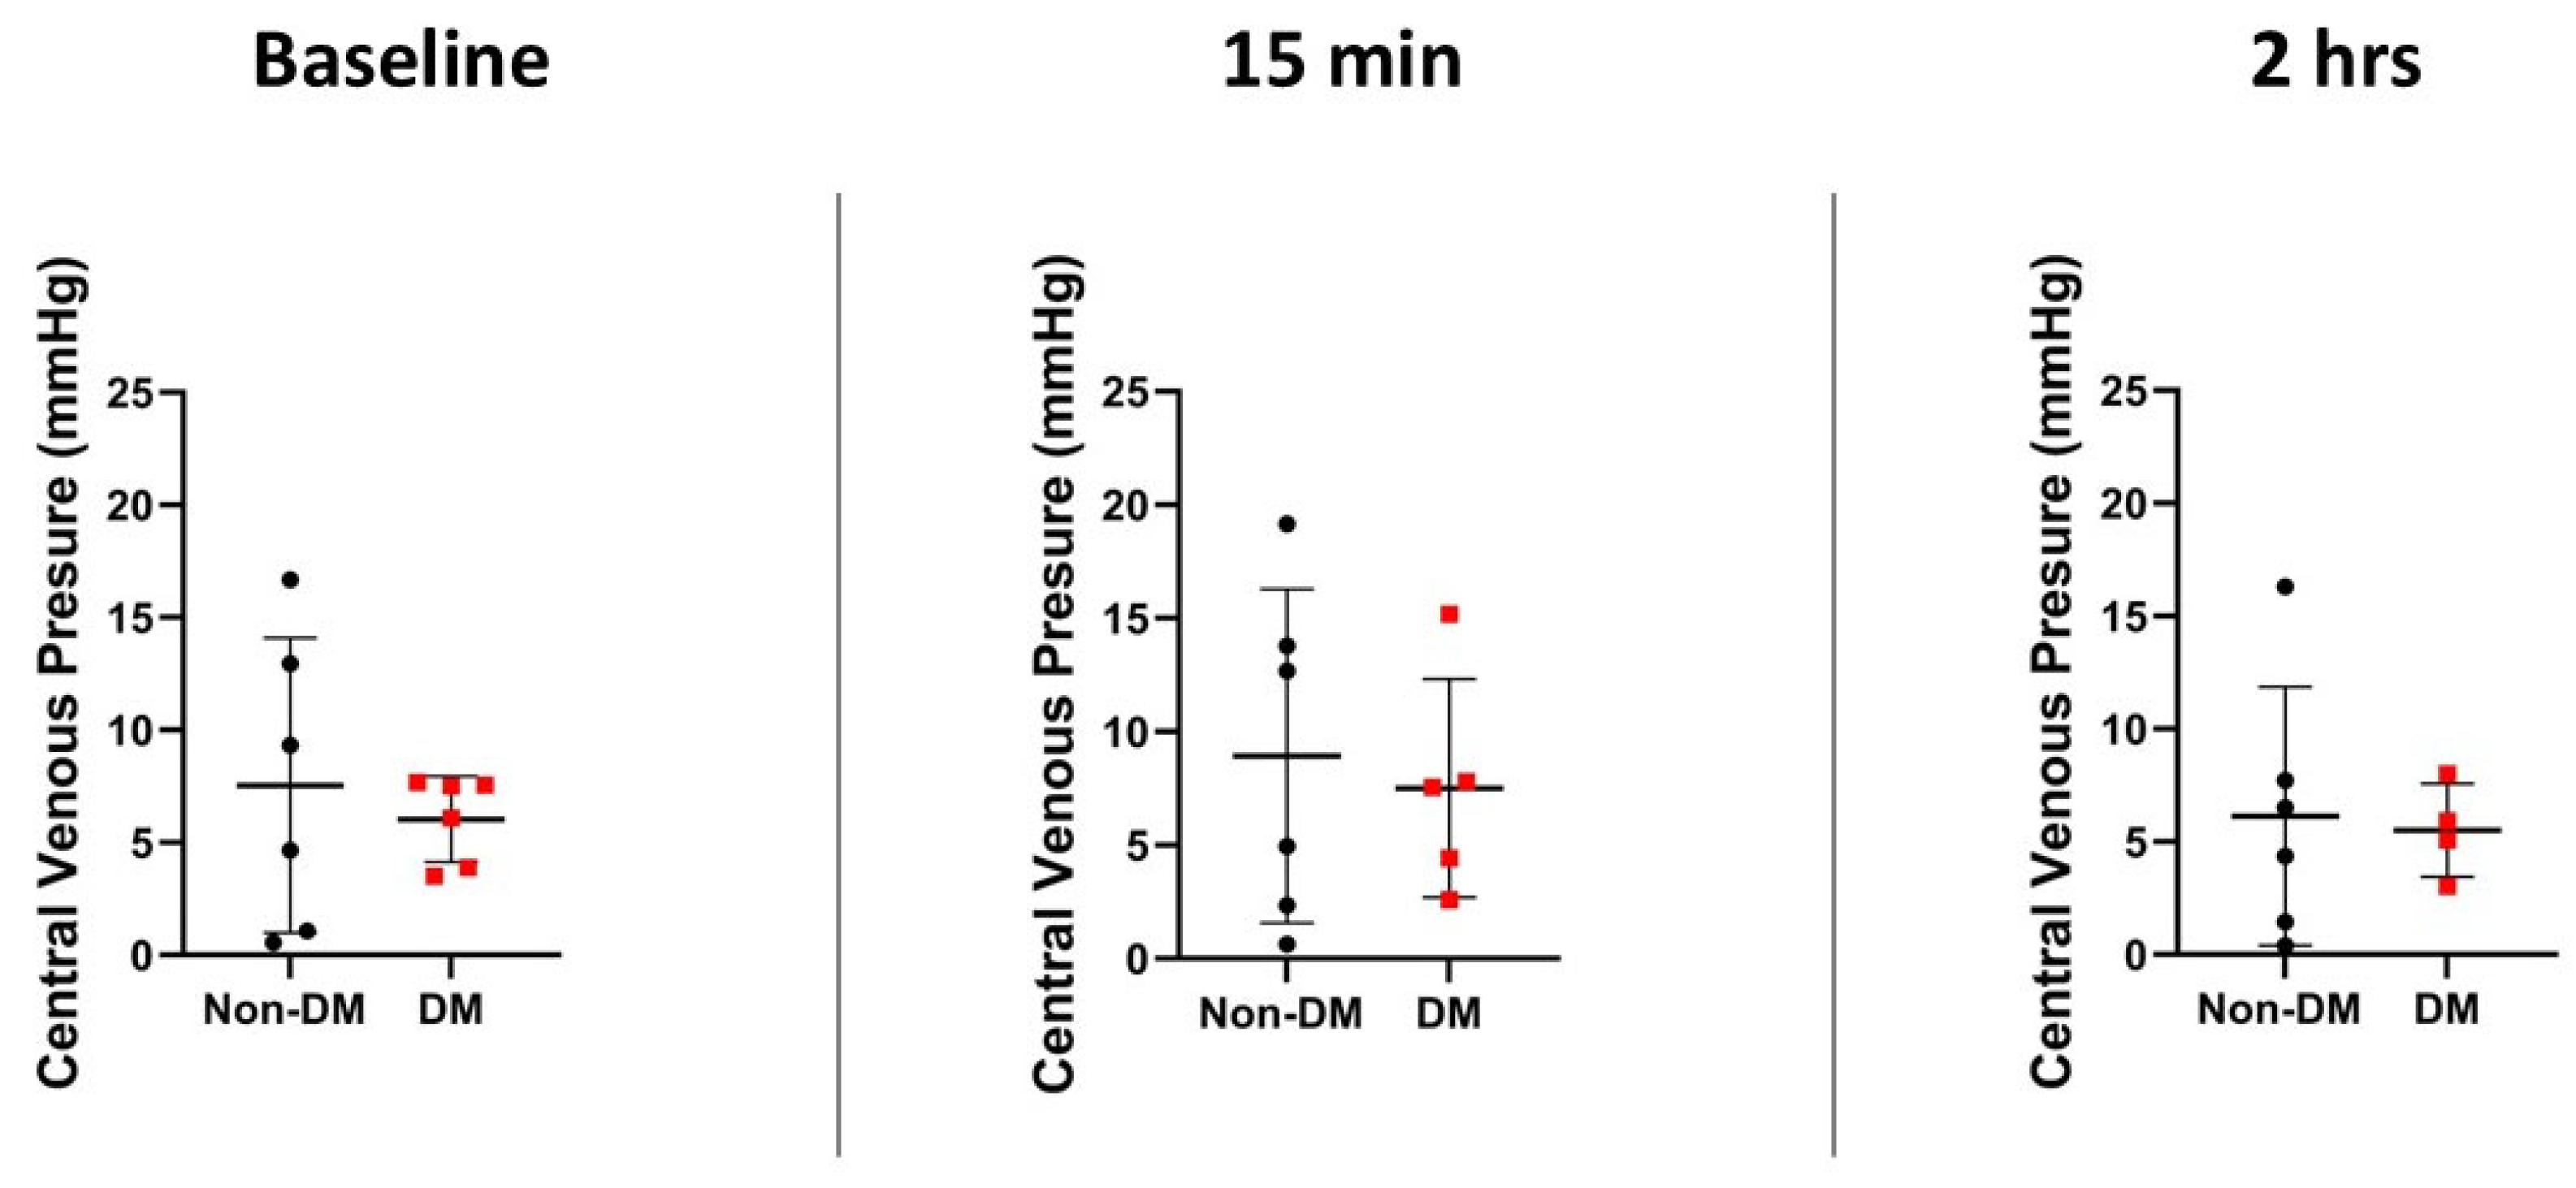
The central venous pressure can be used as a marker of right heart failure, especially after an insult such as asphyxia. The central venous pressure did not significantly differ between groups at the baseline, p = 0.818, at 15 min, p = 0.999, or at 2 h, p = 0.914, Figure 8. Additionally, there was no significant within-group variation at any timepoint in any group.

4. Discussion

The DM model utilized here displayed appropriately elevated blood sugar levels, equivalent to those previously described in type II DM models in rats. The streptozotocin dose utilized is in the low range of described methods; however, with the combination of the long-term ‘Western diet’ feeding, a consistent and prolonged elevation in blood glucose, matching an un- or under-managed DM patient, was achieved [18,19,20]. While we associate type II DM with insulin resistance, there is a large range of resistance and deficiency phenotypes within the population at large. Beta cell function has been shown to statistically decrease several years before overt DM symptoms and diagnosis. Therefore, we believe that this is a true type II model. Several differences between rats and human exist, however. Rats are less sensitive to hyperglycemia than humans. In fact, genetic DM models, e.g., Zucker diabetic fatty rats, have blood glucose values well above 1000 mg/dL. We believe that our 400–600 mg/dL glucose range models an un- or under-treated DM II patient [11]. Notably the immediate pre-arrest blood glucose of 159 mg dL−1 may represent an elevated blood glucose above non-fasted random blood glucose sampling in a non-DM rat population. This is likely due to the beta-sympathetic activity associated with surgical stress and has a minimal effect on the rat, as seen by what would be extreme hyperglycemia in humans to develop an adequate DMII model. However, we must consider the potential effect of this glucose elevation on our findings. In correlation with the clinical context, the arrest may not occur in a fasting state and may be post-prandial in DM or non-DM patients. One potential limitation is the effect of continuous epinephrine on blood glucose, potentially worsening the hyperglycemia and oxygen demand of the heart. Epinephrine can also lead to lactate elevations at high dosing; however, this finding was not seen here. This treatment is nonetheless commonly used in those with post-arrest cardiogenic shock and mimics a real-world clinical scenario. Additionally, without epinephrine, the decreased cardiac output would have led to end-organ ischemia and dysfunction and potentially early death. An alternative to be explored could be to evaluate norepinephrine or vasopressin use instead of epinephrine [21].
While this model mimics a relevant clinical scenario, it does not separate the acute glucose elevation during the IR injury from the chronic sequalae associated with DM. Hyperglycemia on its own has been shown to negatively affect outcomes after cardiac arrest in humans [22]. Hyperglycemia also aggravates the IRI in both rat and human cardiomyocyte studies [23,24]. It is unclear what target glucose settings in the acute setting are optimal [25]. The level of insulin secretion is intimately linked with the glucose level. Insulin has been shown to be cardioprotective in the face of IRI, potentially through the Akt/hexokinase II pathway [26]. In fact, the delivery of glucose, insulin and potassium has been shown to decrease composite cardiac outcomes in those with acute coronary syndrome [27]. As streptozotocin is an anti-beta cell agent, reduced insulin secretion, which was not measured here, may affect outcomes. However, previous work has demonstrated that the dose of streptozotocin used here allowed for 85% of basal insulin secretion levels as compared to controls [28]. Clinical diabetes demonstrates heterogenous disorders of insulin resistance, basal hyperinsulinemia and relative post prandial hypoinsulinemia [29]. Therefore, we believe that the relative levels of glucose and insulin secretion make this a realistic model, adding to the external validity of these findings.
There are very limited investigations into cardiac arrest outcomes in diabetic rats [30,31,32]. One investigation evaluated the effects of a relatively high dose of streptozotocin (60 mg kg−1) and allowed the phenotype development for two weeks [30]. Several studies have evaluated the cardiac function in streptozotocin models and have demonstrated that the diastolic dysfunction of both the left ventricle and right ventricle appears before overt systolic dysfunction [33]. Ten to twelve weeks is regarded as the earliest time diastolic dysfunction begins to appear [34]. Our model displayed no differences in the basal cardiac output present in systolic dysfunction. The diastolic function was not directly measured in this study but was potentially present. By choosing a longer phenotype development period, we may more closely resemble those with chronic diseases. Additionally, the arrest model used in the previous streptozotocin DM arrest utilized KCL for arrest, differing from the etiology used here; the ROSC rate in this study was 80% in their chronic hyperglycemia subjects, which was higher than ours, despite similar down times, potentially due to the arrest etiology. The study by Vammen et al. utilized a ZDF rat model and the asphyxial arrest of a similar duration to this study. They found no significant difference in the ROSC rate or cardiac output at the end of the experiment. There are many possible reasons for this discrepancy; however, two stand out: the ZDFs’ relative lack of diastolic dysfunction and the utilization of 2% sevoflurane immediately after the ROSC, which could have provided a post-conditioning effect, diminishing IRI differences [35,36]. Furthermore, the ZDF strain for the age group used in this study was shown to be more resilient to IRI rather than being more susceptible, like the human phenotype suggests. We add to the strong body of work my Vammen and others, but utilizing lactate to evaluate the overall metabolic insult, by directly measuring the carotid blood flow after the arrest in this ACLS and clinically relevant post-arrest model. Other studies have not utilized titrated pressors to achieve a steady mean arterial pressure as would be performed in an emergency room setting. Other studies have utilized diabetic streptozotocin-based models to evaluate interventions such as Canagliflozin but did not directly compare this to non-DM animals [37].
Here, we chose to utilize an asphyxial arrest model; a fibrillatory model may more accurately represent the majority of arrests in this at-risk population. However, the rate of asphyxial arrests in the population is on the rise and remains relevant [38]. Furthermore, similar cardiac and neurologic insults have been described when these two commonly studied models have been compared in animals [39]. Notably asphyxial models had less cardiac output recovery compared to fibrillatory models [40]. Therefore, despite the etiology, the resultant damage is similar, and the findings are likely relevant to fibrillatory arrests.
The titrated arrest length in this study is consistent with that used in previous studies. The rate of the ROSC in DM subjects must consider both feasibility and practicality. In the field, the DM ROSC rate is much lower than was seen here and must be considered in future work. However, the severity based on the cardiac output and epinephrine requirement places this arrest on the edge of non-survivable without appropriate treatment events. It is unlikely that a greater ischemic insult would be survivable in DM subjects. Non-DM subjects, however, displayed a significant recovery and may tolerate stronger insults in future studies. An alternative approach could be to perform a fibrillatory arrest after a short period of asphyxia to further titrate the insult and ensure an appropriate model in non-DM animals.
There are a wide range of medications used to treat DM in the outpatient setting. Types of DM II medications can be categorized into the following: insulin secretagogues or sensitizers, biguanides, incretin mimetics, amylin antagonists and alpha glucosidase or sodium-glucose cotransporter-2 (SGLT2) inhibitors [41]. Each treatment may in turn affect the outcomes after an OHCA. Two notable examples include those of the sulfonylureas, insulin secretagogues and SGLT2 inhibitors. Sulfonylureas have been associated with a decreased risk of OHCA and improved outcomes after arrest [42,43]. SGLT2 inhibitors may also decrease the risk of OHCA when compared to glucagon-like-peptide-1 receptor agonists [44]. SGLT2 inhibitors reduce the IRI after myocardial infarction in in vivo studies, leading to an improved infarct size and cardiac function and reduced arrhythmias. In observational studies, diabetics with an acute infraction on chronic SGLT2 inhibitor therapy displayed less stress hyperglycemia, less cardiovascular mortality and a less acute kidney injury after emergent percutaneous interventions as compared to similar hemoglobin A1C diabetics not taking SGLT2 inhibitors [45]. These findings are very meaningful for diabetic patients, and the mechanism of protection has been postulated to be multifactorial, including the following: antihypertensive effects; a sympathetic nervous system blockade effecting the heart rate; a loss in body weight; improved diuresis; improved vascular function; alterations in glucose metabolism with increased ketogenesis; alterations in the lipid status; direct effects on cardiac activity via an increased SERCA2a activity; the blunting of the sodium hydrogen exchanger; CAMKII activity; NLRP3 inflammasome activation; oxidative stress; and altered signaling through STAT3, AMPK, TGF-β/Smad and Nrf/ARE [46]. Models such as the one utilized here may be leveraged to evaluate these pathways in vivo in future work. Due to a wide range of prescribing practices, mono-vs. multi-drug therapies, and the variable severity of the chronic disease and glucose elevation, evaluating the precise effect of these medications on arrest outcomes remains challenging and was beyond the scope of this investigation.
DM is associated with a wide range of prevalent conditions beyond hyperglycemia. Vascular damage leading to arterial stiffness and endothelial cell dysfunction are often seen in DM. These may be in part due to the advanced glycation end-product build up within the vessel, leading to arteriosclerosis. Increased oxidative stress in DM may also lead to vascular damage [47]. In the coronary circulation, endothelial damage can lead to increased pressure and perfusion, which will over time be compensated for with the remodeling and narrowing of the vessel lumen. This will in turn limit the vasodilatory reserve [48]. Diabetic cardiomyopathy can be insidious and unrelated to coronary disease. Diastolic dysfunction has been demonstrated in asymptomatic patients with a normal systolic function and has been linked to increased mortality [49]. DM has also been associated with an increased left ventricular mass and concentric hypertrophy [50]. These may all have implications in the frequency and etiology of the cardiac arrest, as well as the hemodynamics during resuscitation, which may lead to alterations in long-term outcomes. Non-cardiac effects of DM are widespread as the vascular injury is not isolated to the heart. Renal disease leading to volume and electrolyte imbalances, microvascular changes in the brain predisposing patients to strokes and even metabolic liver disease from non-alcoholic fatty livers can be seen in diabetics [51,52,53]. This study was unable to directly investigate these secondary effects, although some early-stage changes were likely present in our subjects.

5. Conclusions

Here we demonstrate the effects of chronic DM using a streptozotocin model on outcomes after asphyxial cardiac arrest. DM animals display decreased rates of the ROSC, longer times to achieve a ROSC, a worse cardiac function after the ROSC and an increased need for inotropic support. This work comprehensively establishes a base on which investigations into diabetic treatments and mechanisms of DM IRI susceptibility can build upon.

Supplementary Materials

The following supporting information can be downloaded at: https://www.mdpi.com/article/10.3390/diabetology6080078/s1, Figure S1: Glucose during diabetes induction.; Figure S2. Weight during diabetes induction.

Author Contributions

Conceptualization and Methodology: M.B.B., T.O., M.S., Z.L., M.Z., I.Z. and M.L.R.; Data curation: M.B.B.; Performed experiments: M.B.B., T.O., M.Z. and I.Z.; Formal analysis: M.B.B. and M.L.R.; Interpreted results of experiments: M.B.B., T.O., M.S., Z.L., M.Z., I.Z. and M.L.R.; Prepared figures: M.B.B.; Drafted manuscript: M.B.B. and M.L.R.; Edited and revised manuscript: M.B.B., T.O., M.S., Z.L., M.Z., I.Z. and M.L.R.; Approved final version of manuscript: M.B.B., T.O., M.S., Z.L., M.Z., I.Z. and M.L.R.; Funding acquisition: M.B.B. and M.L.R.; Project administration and resources: M.B.B., Z.L. and M.L.R.; Software: M.B.B. and T.O.; Supervision: M.B.B. and M.L.R.; Validation: M.B.B. and M.L.R.; Visualization: M.B.B. and M.L.R. All authors have read and agreed to the published version of the manuscript.

Funding

This work was supported, in part, by the Merit Review Award [grant number I01 BX003482] from the U.S. Department of Veterans Affairs Biomedical Laboratory R&D Service to Dr. Riess; by a starter grant from the Society of Cardiovascular Anesthesiologists to Dr. Barajas (4-04-300-5652); by the Foundation of Anesthesia Education and Research (1187757); and by institutional funds to Dr. Riess.

Institutional Review Board Statement

Institutional Animal Care and Use Committee approval was obtained for all study procedures (Protocol M1800029-02, 6 January 2022, Vanderbilt University Medical Center, Nashville, TN, USA).

Informed Consent Statement

Not applicable.

Data Availability Statement

Data is available upon reasonable requests and in strict accordance with funding guidelines.

Acknowledgments

The authors wish to acknowledge the contributions of students Miriam Walter and Claudius Balzer.

Conflicts of Interest

All authors certify that they have no conflicts of interest.

Abbreviations

CPRcardiopulmonary resuscitation
CVPcentral venous pressure
DMdiabetes mellitus
hhours
IQRinterquartile range
IRIischemia–reperfusion injury
MAPmean arterial pressure
Mcgmicrogram
Minminutes
OHCAout of hospital cardiac arrest
ROSCreturn of spontaneous circulation
Sseconds
SGLT2Sodium–glucose cotransporter-2
ZDFZucker diabetic fatty

References

  1. Wong, M.K.Y.; Morrison, L.J.; Qiu, F.; Austin, P.C.; Cheskes, S.; Dorian, P.; Scales, D.C.; Tu, J.V.; Verbeek, P.R.; Wijeysundera, H.C.; et al. Trends in Short- and Long-Term Survival Among Out-of-Hospital Cardiac Arrest Patients Alive at Hospital Arrival. Circulation 2014, 130, 1883–1890. [Google Scholar] [CrossRef] [PubMed]
  2. Jensen, T.W.; Ersbøll, A.K.; Folke, F.; Wolthers, S.A.; Andersen, M.P.; Blomberg, S.N.; Andersen, L.B.; Lippert, F.; Torp-Pedersen, C.; Christensen, H.C. Training in Basic Life Support and Bystander-Performed Cardiopulmonary Resuscitation and Survival in Out-of-Hospital Cardiac Arrests in Denmark, 2005 to 2019. JAMA Netw. Open 2023, 6, e233338. [Google Scholar] [CrossRef] [PubMed]
  3. Majewski, D.; Ball, S.; Finn, J. Systematic review of the relationship between comorbidity and out-of-hospital cardiac arrest outcomes. BMJ Open 2019, 9, e031655. [Google Scholar] [CrossRef]
  4. Wiberg, S.; Holmberg, M.J.; Donnino, M.W.; Kjaergaard, J.; Hassager, C.; Witten, L.; Berg, K.M.; Moskowitz, A.; Andersen, L.W.; Grossestreuer, A.; et al. Age-dependent trends in survival after adult in-hospital cardiac arrest. Resuscitation 2020, 151, 189–196. [Google Scholar] [CrossRef]
  5. Rajan, S.; Folke, F.; Hansen, S.M.; Hansen, C.M.; Kragholm, K.; Gerds, T.A.; Lippert, F.K.; Karlsson, L.; Møller, S.; Køber, L.; et al. Incidence and survival outcome according to heart rhythm during resuscitation attempt in out-of-hospital cardiac arrest patients with presumed cardiac etiology. Resuscitation 2017, 114, 157–163. [Google Scholar] [CrossRef]
  6. Voruganti, D.C.; Chennamadhavuni, A.; Garje, R.; Shantha, G.P.S.; Schweizer, M.L.; Girotra, S.; Giudici, M. Association between diabetes mellitus and poor patient outcomes after out-of-hospital cardiac arrest: A systematic review and meta-analysis. Sci. Rep. 2018, 8, 17921. [Google Scholar] [CrossRef]
  7. Ro, Y.S.; Do Shin, S.; Song, K.J.; Lee, E.J.; Lee, Y.J.; Kim, J.Y.; Jang, D.B.; Kim, M.J.; Kong, S.Y. Interaction effects between hypothermia and diabetes mellitus on survival outcomes after out-of-hospital cardiac arrest. Resuscitation 2015, 90, 35–41. [Google Scholar] [CrossRef]
  8. Parry, M.; Danielson, K.; Brennenstuhl, S.; Drennan, I.R.; Morrison, L.J. The association between diabetes status and survival following an out-of-hospital cardiac arrest: A retrospective cohort study. Resuscitation 2017, 113, 21–26. [Google Scholar] [CrossRef]
  9. Patel, K.P. Volume reflex in diabetes. Cardiovasc. Res. 1997, 34, 81–90. [Google Scholar] [CrossRef]
  10. Lukovits, T.G.; Mazzone, T.; Gorelick, P.B. Diabetes mellitus and Cerebrovascular Disease. Neuroepidemiology 1998, 18, 1–14. [Google Scholar] [CrossRef]
  11. Gallwitz, B.; Kazda, C.; Kraus, P.; Nicolay, C.; Schernthaner, G. Contribution of insulin deficiency and insulin resistance to the development of type 2 diabetes: Nature of early stage diabetes. Acta Diabetol. 2013, 50, 39–45. [Google Scholar] [CrossRef]
  12. Li, W.A.; Moore-Langston, S.; Chakraborty, T.; Rafols, J.A.; Conti, A.C.; Ding, Y. Hyperglycemia in stroke and possible treatments. Neurol. Res. 2013, 35, 479–491. [Google Scholar] [CrossRef] [PubMed]
  13. Johnston, K.C.; Hall, C.E.; Kissela, B.M.; Bleck, T.P.; Conaway, M.R. Glucose Regulation in Acute Stroke Patients (GRASP) Trial. Stroke 2009, 40, 3804–3809. [Google Scholar] [CrossRef] [PubMed]
  14. Bruno, A.; Kent, T.A.; Coull, B.M.; Shankar, R.R.; Saha, C.; Becker, K.J.; Kissela, B.M.; Williams, L.S. Treatment of Hyperglycemia In Ischemic Stroke (THIS). Stroke 2008, 39, 384–389. [Google Scholar] [CrossRef] [PubMed]
  15. Srinivasan, K.; Ramarao, P. Animal models in type 2 diabetes research: An overview. Indian J. Med. Res. 2007, 125, 451–472. [Google Scholar] [PubMed]
  16. Barajas, M.B.; Oyama, T.; Shiota, M.; Li, Z.; Zaum, M.; Zecevic, I.; Riess, M.L. Ischemic Post-Conditioning in a Rat Model of Asphyxial Cardiac Arrest. Cells 2024, 13, 1047. [Google Scholar] [CrossRef]
  17. Philipson, L.H. β-Agonists and metabolism. J. Allergy Clin. Immunol. 2002, 110 (Suppl. 6), S313–S317. [Google Scholar] [CrossRef]
  18. Zhang, M.; Lv, X.-Y.; Li, J.; Xu, Z.-G.; Chen, L. The characterization of high-fat diet and multiple low-dose streptozotocin induced type 2 diabetes rat model. Exp. Diabetes Res. 2008, 2008, 704045. [Google Scholar] [CrossRef]
  19. Guo, X.-x.; Wang, Y.; Wang, K.; Ji, B.-p.; Zhou, F. Stability of a type 2 diabetes rat model induced by high-fat diet feeding with low-dose streptozotocin injection. J. Zhejiang Univ. Sci. B 2018, 19, 559–569. [Google Scholar] [CrossRef]
  20. Reed, M.; Meszaros, K.; Entes, L.; Claypool, M.; Pinkett, J.; Gadbois, T.; Reaven, G. A new rat model of type 2 diabetes: The fat-fed, streptozotocin-treated rat. Metab. Clin. Exp. 2000, 49, 1390–1394. [Google Scholar] [CrossRef]
  21. Levy, B.; Clere-Jehl, R.; Legras, A.; Morichau-Beauchant, T.; Leone, M.; Frederique, G.; Quenot, J.-P.; Kimmoun, A.; Cariou, A.; Lassus, J. Epinephrine versus norepinephrine for cardiogenic shock after acute myocardial infarction. J. Am. Coll. Cardiol. 2018, 72, 173–182. [Google Scholar] [CrossRef] [PubMed]
  22. Daviaud, F.; Dumas, F.; Demars, N.; Geri, G.; Bouglé, A.; Morichau-Beauchant, T.; Nguyen, Y.-L.; Bougouin, W.; Pène, F.; Charpentier, J.; et al. Blood glucose level and outcome after cardiac arrest: Insights from a large registry in the hypothermia era. Intensive Care Med. 2014, 40, 855–862. [Google Scholar] [CrossRef] [PubMed]
  23. Verma, S.; Maitland, A.; Weisel, R.D.; Li, S.-H.; Fedak, P.W.M.; Pomroy, N.C.; Mickle, D.A.G.; Li, R.-K.; Ko, L.; Rao, V. Hyperglycemia exaggerates ischemia-reperfusion–induced cardiomyocyte injury: Reversal with endothelin antagonism. J. Thorac. Cardiovasc. Surg. 2002, 123, 1120–1124. [Google Scholar] [CrossRef] [PubMed]
  24. Walter, M.J.; Shiota, M.; Li, Z.; Barajas, M.B.; Oyama, T.; Riess, M.L. Abstract 176: The Pathological Role of Aldose Reductase in Isolated Cardiomyocytes Undergoing Hypoxia/Reoxygenation After Prior Exposure to High Glucose Concentrations. Circulation 2023, 148 (Suppl. 1). [Google Scholar] [CrossRef]
  25. Balzer, C.; Cleveland, W.J.; Li, Z.; Riess, M.L. Buffer glucose adjustment affects myocardial function after ischemia–reperfusion in long-term diabetic rat isolated hearts. Physiol. Rep. 2022, 10, e15387. [Google Scholar] [CrossRef]
  26. Penna, C.; Andreadou, I.; Aragno, M.; Beauloye, C.; Bertrand, L.; Lazou, A.; Falcão-Pires, I.; Bell, R.; Zuurbier, C.J.; Pagliaro, P.; et al. Effect of hyperglycaemia and diabetes on acute myocardial ischaemia–reperfusion injury and cardioprotection by ischaemic conditioning protocols. Br. J. Pharmacol. 2020, 177, 5312–5335. [Google Scholar] [CrossRef]
  27. Selker, H.P.; Beshansky, J.R.; Sheehan, P.R.; Massaro, J.M.; Griffith, J.L.; D’Agostino, R.B.; Ruthazer, R.; Atkins, J.M.; Sayah, A.J.; Levy, M.K.; et al. Out-of-Hospital Administration of Intravenous Glucose-Insulin-Potassium in Patients With Suspected Acute Coronary Syndromes: The IMMEDIATE Randomized Controlled Trial. JAMA 2012, 307, 1925–1933. [Google Scholar] [CrossRef]
  28. Okoduwa, S.I.R.; Umar, I.A.; James, D.B.; Inuwa, H.M. Appropriate insulin level in selecting fortified diet-fed, streptozotocin-treated rat model of type 2 diabetes for anti-diabetic studies. PLoS ONE 2017, 12, e0170971. [Google Scholar] [CrossRef]
  29. Del Prato, S.; Marchetti, P.; Bonadonna, R.C. Phasic Insulin Release and Metabolic Regulation in Type 2 Diabetes. Diabetes 2002, 51 (Suppl. 1), S109–S116. [Google Scholar] [CrossRef]
  30. Hoxworth, J.M.; Xu, K.; Zhou, Y.; Lust, W.D.; LaManna, J.C. Cerebral metabolic profile, selective neuron loss, and survival of acute and chronic hyperglycemic rats following cardiac arrest and resuscitation. Brain Res. 1999, 821, 467–479. [Google Scholar] [CrossRef]
  31. Vammen, L.; Rahbek, S.; Secher, N.; Povlsen, J.A.; Jessen, N.; Løfgren, B.; Granfeldt, A. Type 2 diabetes mellitus worsens neurological injury following cardiac arrest: An animal experimental study. Intensive Care Med. Exp. 2018, 6, 23. [Google Scholar] [CrossRef]
  32. Balzer, C.; Baudenbacher, F.; Salzman, M.M.; Cleveland, W.J.; Eagle, S.; Riess, M.L. Abstract 328: Hemodynamic Comparison of Zucker Diabetic Fatty Rats to Their Lean Littermates After Asphyxial Cardiac Arrest. Circulation 2018, 138 (Suppl. 2). [Google Scholar] [CrossRef]
  33. Miao, Y.; Zhang, W.; Zhong, Y.; Zhong, M.; Ma, X. Diastolic function of the right ventricle is impaired in experimental type 2 diabetic rat models. Turk. J. Med. Sci. 2014, 44, 448–453. [Google Scholar] [CrossRef] [PubMed]
  34. Wei, C.; Zhao, Y.; Wang, L.; Peng, X.; Li, H.; Zhao, Y.; He, Y.; Shao, H.; Zhong, X.; Li, H.; et al. H2S restores the cardioprotection from ischemic post-conditioning in isolated aged rat hearts. Cell Biol. Int. 2015, 39, 1173–1176. [Google Scholar] [CrossRef] [PubMed]
  35. Daniels, A.; Linz, D.; van Bilsen, M.; Rütten, H.; Sadowski, T.; Ruf, S.; Juretschke, H.-P.; Neumann-Haefelin, C.; Munts, C.; van der Vusse, G.J.; et al. Long-term severe diabetes only leads to mild cardiac diastolic dysfunction in Zucker diabetic fatty rats. Eur. J. Heart Fail. 2012, 14, 193–201. [Google Scholar] [CrossRef]
  36. Zhang, J.; Wang, C.; Yu, S.; Luo, Z.; Chen, Y.; Liu, Q.; Hua, F.; Xu, G.; Yu, P. Sevoflurane Postconditioning Protects Rat Hearts against Ischemia-Reperfusion Injury via the Activation of PI3K/AKT/mTOR Signaling. Sci. Rep. 2014, 4, 7317. [Google Scholar] [CrossRef]
  37. Wang, M.; Hua, T.; Zhang, Y.; Huang, Q.; Shi, W.; Chu, Y.; Hu, Y.; Pan, S.; Ling, B.; Tang, W.; et al. Effects of canagliflozin preconditioning on post-resuscitation myocardial function in a diabetic rat model of cardiac arrest and cardiopulmonary resuscitation. Eur. J. Pharmacol. 2025, 988, 177212. [Google Scholar] [CrossRef]
  38. Chen, N.; Callaway, C.W.; Guyette, F.X.; Rittenberger, J.C.; Doshi, A.A.; Dezfulian, C.; Elmer, J. Arrest etiology among patients resuscitated from cardiac arrest. Resuscitation 2018, 130, 33–40. [Google Scholar] [CrossRef]
  39. Uray, T.; Dezfulian, C.; Palmer, A.A.; Miner, K.M.; Leak, R.K.; Stezoski, J.P.; Janesko-Feldman, K.; Kochanek, P.M.; Drabek, T. Cardiac Arrest Induced by Asphyxia Versus Ventricular Fibrillation Elicits Comparable Early Changes in Cytokine Levels in the Rat Brain, Heart, and Serum. J. Am. Heart Assoc. 2021, 10, e018657. [Google Scholar] [CrossRef]
  40. Guo, J. Comparison between two rat models of cardiac arrest: Asphyxiation and ventricular fibrillation. J. Shanghai Jiaotong Univ. (Med. Sci.) 2018, 12, 380–385. [Google Scholar]
  41. Padhi, S.; Nayak, A.K.; Behera, A. Type II diabetes mellitus: A review on recent drug based therapeutics. Biomed. Pharmacother. 2020, 131, 110708. [Google Scholar] [CrossRef] [PubMed]
  42. Huang, K.; Gu, Y.; Hu, Y.; Ji, Z.; Wang, S.; Lin, Z.; Li, X.; Xie, Z.; Pan, S. Glibenclamide improves survival and neurologic outcome after cardiac arrest in rats. Crit. Care Med. 2015, 43, e341–e349. [Google Scholar] [CrossRef] [PubMed]
  43. Eroglu, T.E.; Jia, L.; Blom, M.T.; Verkerk, A.O.; Devalla, H.D.; Boink, G.J.J.; Souverein, P.C.; de Boer, A.; Tan, H.L. Sulfonylurea antidiabetics are associated with lower risk of out-of-hospital cardiac arrest: Real-world data from a population-based study. Br. J. Clin. Pharmacol. 2021, 87, 3588–3598. [Google Scholar] [CrossRef] [PubMed]
  44. Júlíusdóttir, Y.K.; Halili, A.; Coronel, R.; Folke, F.; Torp-Pedersen, C.; Gislason, G.H.; Eroglu, T.E. Sodium-glucose cotransporter-2 inhibitors compared with glucagon-like-peptide-1 receptor agonists and out-of-hospital cardiac arrest in type 2 diabetes: A nationwide nested case-control study. Eur. Heart J. Cardiovasc. Pharmacother. 2023, 9, 437–443. [Google Scholar] [CrossRef]
  45. Paolisso, P.; Bergamaschi, L.; Gragnano, F.; Gallinoro, E.; Cesaro, A.; Sardu, C.; Mileva, N.; Foà, A.; Armillotta, M.; Sansonetti, A.; et al. Outcomes in diabetic patients treated with SGLT2-Inhibitors with acute myocardial infarction undergoing PCI: The SGLT2-I AMI PROTECT Registry. Pharmacol. Res. 2023, 187, 106597. [Google Scholar] [CrossRef]
  46. Nikolic, M.; Zivkovic, V.; Jovic, J.J.; Sretenovic, J.; Davidovic, G.; Simovic, S.; Djokovic, D.; Muric, N.; Bolevich, S.; Jakovljevic, V. SGLT2 inhibitors: A focus on cardiac benefits and potential mechanisms. Heart Fail. Rev. 2022, 27, 935–949. [Google Scholar] [CrossRef]
  47. Strain, W.D.; Paldánius, P.M. Diabetes, cardiovascular disease and the microcirculation. Cardiovasc. Diabetol. 2018, 17, 57. [Google Scholar] [CrossRef]
  48. Oltman, C.L. Complications in the Coronary Circulation Associated with Diabetes. In Studies in Diabetes; Obrosova, I., Stevens, M.J., Yorek, M.A., Eds.; Springer: New York, NY, USA, 2014; pp. 37–47. [Google Scholar]
  49. From, A.M.; Scott, C.G.; Chen, H.H. Changes in Diastolic Dysfunction in Diabetes Mellitus Over Time. Am. J. Cardiol. 2009, 103, 1463–1466. [Google Scholar] [CrossRef]
  50. Galderisi, M. Diastolic Dysfunction and Diabetic Cardiomyopathy. J. Am. Coll. Cardiol. 2006, 48, 1548–1551. [Google Scholar] [CrossRef]
  51. Ahmadieh, H.; Azar, S.T. Liver disease and diabetes: Association, pathophysiology, and management. Diabetes Res. Clin. Pract. 2014, 104, 53–62. [Google Scholar] [CrossRef]
  52. Colhoun, H.M.; Lee, E.T.; Bennett, P.H.; Lu, M.; Keen, H.; Wang, S.L.; Stevens, L.K.; Fuller, J.H.; the WHOMSG. Risk factors for renal failure: The WHO multinational study of vascular disease in diabetes. Diabetologia 2001, 44, S46. [Google Scholar] [CrossRef]
  53. Phipps, M.S.; Jastreboff, A.M.; Furie, K.; Kernan, W.N. The Diagnosis and Management of Cerebrovascular Disease in Diabetes. Curr. Diabetes Rep. 2012, 12, 314–323. [Google Scholar] [CrossRef]
Figure 1. Blood glucose measurements before and after cardiac arrest. Diabetic animals displayed a significantly elevated blood glucose level compared with controls at each timepoint, p = 0.001, 0.015 and 0.002, respectively. Data points are individually represented with the mean and standard deviation displayed in the whisker plot. * represents p < 0.05 and ** represents p < 0.01.
Diabetology 06 00078 g001
Figure 2. Markers of cardiac arrest severity. (A). Diabetics displayed a significantly increased time to achieve the ROSC after arrest, p = 0.034. (B). Diabetics required a significantly higher dose of epinephrine after the ROSC to maintain a MAP of 70 mmHg, p = 0.041. In both figures, data points are individually represented with the mean and standard deviation displayed in the whisker plot. * represents p < 0.05.
Diabetology 06 00078 g002
Figure 3. Lactate before and after cardiac arrest. The starting lactate was significantly lower in the diabetic group as compared to the non-DM animals, p = 0.037. There were no other significant between-group differences; however, lactate was significantly elevated at 15 min in both groups, and DM lactate remained elevated at 2 h. In all figures, data points are individually represented with the mean and standard deviation displayed in the whisker plot. * represents p < 0.05 and ** represents p < 0.01.
Diabetology 06 00078 g003
Figure 4. The mean arterial pressure (MAP) is demonstrated at the baseline, 15 min after ROSC and 2 h after ROSC in non-diabetic and diabetic animals. Shortly after the ROSC non-DM animals displayed a higher MAP than DM animals, p = 0.015. There were no other statistically significant differences. Data points are individually represented with the mean and standard deviation displayed in the whisker plot. * represents p < 0.05 and ** represents p < 0.01.
Diabetology 06 00078 g004
Figure 5. The cardiac output before and after cardiac arrest. The cardiac output was significantly lower in the DM group as compared to the non-DM group immediately after the ROSC and at the end of the experiment, 2 h, p = 0.017 and p = 0.017. The cardiac output within the DM group fell significantly from the baseline at the 2 hr mark, p = 0.008. In all figures, data points are individually represented with the mean and standard deviation displayed in the whisker plot. * represents p < 0.05.
Diabetology 06 00078 g005
Figure 6. Heart rate before and after cardiac arrest. Heart rate did not differ between non-DM and DM animals at baseline, p = 0.818. Post-ROSC 15 min heart rate was lower in DM animals than non-DM animals, p = 0.026, and fell significantly at 2 h when compared to DM baseline, 0.002. In all figures, data points are individually represented with mean and standard deviation displayed in whisker plot. * represents p < 0.05.
Diabetology 06 00078 g006
Figure 7. Carotid flow before and after cardiac arrest. Carotid flow did not differ significantly between DM and non-DM animals at baseline, p = 0.240. Carotid flow in non-DM animals was significantly higher than DM animals only at 15 min mark, p = 0.026. Data points are individually represented with mean and standard deviation displayed in whisker plot. * represents p < 0.05.
Diabetology 06 00078 g007
Figure 8. Central venous pressure before and after cardiac arrest. Central venous pressure did not differ between or within groups at any timepoints. In all figures, data points are individually represented with mean and standard deviation displayed in whisker plot.
Diabetology 06 00078 g008
Disclaimer/Publisher’s Note: The statements, opinions and data contained in all publications are solely those of the individual author(s) and contributor(s) and not of MDPI and/or the editor(s). MDPI and/or the editor(s) disclaim responsibility for any injury to people or property resulting from any ideas, methods, instructions or products referred to in the content.