Article

Adipose Tissue Dysfunction and Hepatic Steatosis in New-Onset Diabetes

1
“Carol Davila” University of Medicine and Pharmacy, 020021 Bucharest, Romania
2
Malaxa Clinical Hospital, 022441 Bucharest, Romania
3
“Dr. Carol Davila” Central Military Emergency University Hospital, 010825 Bucharest, Romania
4
Department of Diabetes, Nutrition and Metabolic Diseases, Bucharest University Emergency Hospital, 050098 Bucharest, Romania
5
“Pompei Samarian” Emergency Hospital, 910071 Calarasi, Romania
6
“Theodor Burghele” Clinical Hospital, 050653 Bucharest, Romania
7
Independent Researcher, 020597 Bucharest, Romania
8
Department of Diabetes, Nutrition and Metabolic Diseases, “Prof. Dr. Nicolae Paulescu” National Institute of Diabetes, 020475 Bucharest, Romania
*
Author to whom correspondence should be addressed.
Diabetology 2025, 6(7), 70; https://doi.org/10.3390/diabetology6070070
Submission received: 18 April 2025 / Revised: 28 June 2025 / Accepted: 2 July 2025 / Published: 10 July 2025

Abstract

Background/Objectives: This study aimed to evaluate adipose tissue dysfunction, assessed through adipocytokines and proinflammatory cytokines, in relation to hepatic steatosis (HS) in patients with newly diagnosed type 2 diabetes (T2D). Methods: An observational study evaluated 155 consecutive patients with new-onset T2D; 118 (76.1%) were found to have HS, while the remaining 37 served as the control group without steatosis. Anthropometric status and body mass index (BMI) were evaluated. The biochemical assessment encompassed the measurements of fasting serum lipids, fasting plasma glucose (FPG), liver function tests, adiponectin, leptin, resistin, tumor necrosis factor (TNF-α), and interleukin 6 (IL-6). Insulin resistance (IR) was determined using the homeostasis model assessment (HOMA). HS was evaluated using ultrasonographic criteria. Quantitative evaluation of HS was performed by calculating the hepatic steatosis index (HSI). Results: There were statistically significant differences between the groups for age, BMI, weight, waist circumference (WC) and hip circumference, HSI, glucose profile (fasting plasma glucose (FPG), HOMA-IR), liver function tests, adiponectin, leptin, resistin, TNF-α, and IL-6. In multivariate logistic regression analysis, age, smoking, BMI, WC, HOMA-IR, and hypoadiponectinemia were the only independent factors associated with HS. Conclusions: The adipose tissue dysfunction assessed through adipocytokines and proinflammatory cytokines is part of the associated disorders in HS and new-onset T2D. In patients with newly diagnosed T2D, age, smoking, and hypoadiponectinemia consistently emerged as independent predictors of hepatic steatosis. More prospective trials are needed to clarify the “the temporal onset” of adipose tissue dysfunction.

1. Introduction

Metabolic dysfunction-associated fatty liver disease (MAFLD), previously referred to as nonalcoholic fatty liver disease (NAFLD), affects approximately a quarter of adults worldwide, representing a major health and economic challenge for societies [1,2,3]. In Europe, the prevalence of metabolic dysfunction-associated steatotic liver diseases (MASLDs) is similarly estimated at 25% [4,5]. MAFLD is linked to metabolic conditions like obesity, impaired glucose tolerance/diabetes, and atherogenic hyperlipidemia (characterized by high triglycerides and low high-density lipoprotein (HDL) cholesterol) [6]. The definition of “metabolic dysfunction-associated steatotic liver disease” (MASLD) includes hepatic steatosis (HS) in the presence of at least one cardiometabolic risk factor [7]. Individuals diagnosed with type 2 diabetes mellitus (T2DM) exhibit a greater likelihood of having MASLD and are at increased risk for the progression of advanced hepatic fibrosis, cirrhosis, and hepatocellular carcinoma [8].
Although MASLD is commonly associated with obesity and insulin resistance, recent evidence highlights the heterogeneity of its pathogenesis, which may include genetic predisposition (e.g., PNPLA3 variants), lipotoxicity, adipose tissue dysfunction, or altered gut–liver axis signaling. These mechanisms contribute variably to the development of hepatic steatosis, insulin resistance, and CVD risk in MASLD subtypes [9,10].
Adipose tissue is now well recognized as an endocrine and immunomodulatory organ that secretes adipocytokines (adiponectin and leptin) and inflammatory mediators (interleukin-6 (IL-6), tumor necrosis factor-alpha (TNF-α)), playing a central role in insulin resistance and metabolic disorders [11]. In several studies, adiponectin concentrations decreased in patients with obesity, T2D, NAFLD, and visceral obesity [12]. Leptin has important implications in obesity and NAFLD [13]. Data about IL-6 involvement in nonalcoholic steatohepatitis are contradictory [14,15]. TNF-α, through tyrosine kinase insulin receptor, plays an important role in inflammation and insulin resistance (IR). Resistin levels may be correlated with IR, obesity, and the severity of NAFLD [16,17].
This study aimed to evaluate the adipose tissue dysfunction, assessed through adipocytokine and proinflammatory cytokine profiles, in relation to hepatic steatosis (HS) in patients with newly diagnosed type 2 diabetes.

2. Materials and Methods

2.1. Trial Design

We conducted a cross-sectional observational study that evaluated 155 consecutive patients with new-onset type 2 diabetes without prior treatment.

2.2. Participants

Patients were consecutively recruited from the outpatient clinics of three participating hospitals in Bucharest, Romania, between September 2007 and December 2008. Eligible individuals were aged over 18 years and had a confirmed diagnosis of T2D. Among the 155 enrolled participants, 118 (76.1%) were found to have HS, while the remaining 37 served as the control group without steatosis. The study was conducted in accordance with the Declaration of Helsinki and approved by the Ethics Committee of Cantacuzino Hospital, Bucharest, Romania (approval no. 291/23.11.2007).
The study excluded individuals with other forms of diabetes and chronic liver conditions (including viral hepatitis (B, C, D) or autoimmune etiology of liver disease), hemochromatosis, a history of using hepatotoxic or steatosis-inducing medications, alcohol consumption above 20 g/day for women or 30 g/day for men, and those diagnosed with pancreatitis.
Anthropometric assessments included measurements of weight, height, and body mass index (BMI), as well as waist (WC) and hip circumferences (HipC). BMI was calculated as weight in kilograms divided by height in meters squared (kg/m2).
Following the World Health Organization (WHO) classification, a BMI of 25–29.9 kg/m2 indicated overweight, while those with a BMI > 30 kg/m2 were classified as obese [18]. WC was measured in centimeters at the midpoint between the 12th rib and the iliac crest, while HipC was measured in centimeters at the level of the greater trochanters, with the legs positioned together.

2.3. Laboratory Assays

Venous blood samples were collected in the morning hours (07:00–11:00 a.m.) following an overnight fast. Biochemical assessments encompassed fasting serum lipid parameters—including total cholesterol (TC), triglycerides (TG), and high-density lipoprotein cholesterol (HDL-C)—as well as glycemic markers, fasting plasma glucose (FPG), fasting plasma insulin (FPI), and glycated hemoglobin (HbA1c). Hepatic function was assessed through the measurement of glutamate–pyruvate transaminase (GPT), glutamic oxaloacetic transaminase (GOT), gamma-glutamyl transpeptidase (GGT), alkaline phosphatase, bilirubin, albumin, total protein, and the international normalized ratio (INR)). Insulin resistance (IR) was estimated using the homeostasis model assessment of insulin resistance (HOMA-IR), calculated as the product of fasting insulin (µIU/mL) and fasting glucose (mg/dL), divided by 405 [19]. A HOMA-IR value exceeding 2.0 was used as the threshold for defining insulin resistance. Cytokine levels—including adiponectin (ng/mL), leptin (ng/mL), resistin (ng/mL), tumor necrosis factor-alpha (TNF-α, pg/mL), and interleukin-6 (IL-6)—were measured using an enzyme-linked immunosorbent assay (ELISA).
The diagnosis of diabetes was established based on the criteria of the American Diabetes Association (ADA) [20]. Hypertension was defined as systolic blood pressure ≥140 mmHg, diastolic blood pressure ≥90 mmHg, or the documented use of antihypertensive pharmacotherapy. Metabolic syndrome was identified based on harmonized criteria of the International Diabetes Federation, with a score of at least 3 out of 5 components meeting the diagnostic threshold [21].

2.4. Imaging Assessment

HS was assessed based on ultrasonographic criteria. Hepatic ultrasonography is a sensitive procedure for detecting hepatic fat accumulation (sensitivity 91–100, specificity 93–100) [22]. Echogenicity was graded as follows: grade 0, normal echogenicity; grade 1, slight, diffuse increase in fine echoes in liver parenchyma with typical visualization of diaphragm but also intrahepatic vessel borders; grade 2, moderate, diffuse increase in fine echoes, accompanied by slightly impaired visualization of intrahepatic vessels and the diaphragm; grade 3, marked increase in fine echoes with poor or non-visualization of the intrahepatic vessel borders, diaphragm, and posterior portion of right lobe of the liver.

2.5. Noninvasive Markers of MAFLD

HS was also quantitatively estimated using an algorithm (hepatic steatosis index, HSI) that includes clinical and biochemical data (aspartate aminotransferase (AST)/alanine aminotransferase (ALT) ratio, BMI, diabetes, and sex) [23]. FIB-4 and Forns fibrosis index (FI)are non-invasive scoring systems for assessing hepatic fibrosis. The FIB-4 score was applied to assess and stratify the risk of advanced hepatic fibrosis. FIB-4 values below 1.3 were considered indicative of a low probability of significant fibrosis, whereas values above 2.67 suggested a high likelihood of advanced fibrosis [24]. FI was also applied, with a cutoff of <4.2 to exclude liver fibrosis and >6.9 being considered a predictor for significant fibrosis [25].

2.6. Statistical Analyses

Normally distributed values are expressed as means ± SD or median for skewed data. Skewed variables were log-transformed prior to analysis. Group comparisons were conducted using analysis of variance (ANOVA) and the chi-squared (χ2) test, as appropriate. Patients with HS and the control group were stratified into tertiles according to HSI: 26.8–35.24, 35.25–40.36, and 40.37–58.64 in the first, second, and third tertiles, respectively. The predictive performance of the evaluated parameters was assessed using the area under the receiver operating characteristic curve (AUROC), accompanied by 95% confidence intervals (CIs). The AUROC quantifies the ability of a parameter to discriminate between cases and controls.
Spearman’s correlation analysis was used to examine the relationships between hepatic steatosis (HS) and circulating levels of adiponectin, leptin, resistin, TNF-α, and IL-6, as well as HOMA-IR, fasting plasma insulin (FPI), fasting plasma glucose (FPG), and age. We used multivariable logistic regression with backward (Wald) selection to identify independent predictors of hepatic steatosis. Because anthropometric indicators such as BMI, waist circumference, and waist-to-hip ratio are strongly correlated, we tested two separate models—one including waist circumference and the other including WHR—to reduce multicollinearity and better capture the effect of fat distribution. Only variables with p < 0.05 were retained in the final models.

3. Results

We included 155 consecutive patients with new-onset T2D, 118 with HS (76.12%), and 37 without steatosis, who constituted the control group. Across the entire cohort, 112 patients were diagnosed with metabolic syndrome (MetS 72.3%). Following gender stratification, metabolic syndrome (MetS) was identified in 55 men (76.4%) and 57 women (68.7%). Out of the patients with HS, 78.8% (n = 93) were diagnosed with MetS (46 men and 47 women), and 72.88% (n = 86) had a HOMA-IR index greater than two.
Table 1 presents the general characteristics of the study population based on the presence or absence of hepatic steatosis (HS), including both anthropometric and laboratory parameters. Statistically significant differences between the groups were observed for age, BMI, and weight, as well as waist and hip circumferences, HSI, AST, ALT, GGT, FIB-4, FPI, HOMA-IR, adiponectin, leptin, resistin, TNF-α, IL-6, triglycerides, or HDL-C (all p < 0.05). MetS components were more prevalent among individuals diagnosed with HS (Table 2).
A stratified analysis based on the presence of obesity—defined as a BMI exceeding 30 kg/m2—was performed. Within the study population, 40.6% of individuals (n = 63) met the criteria for obesity, of whom 38.6% (n = 32) were female and 43.1% (n = 31) were male. The participants with obesity exhibited significantly higher anthropometric parameters, including body weight, waist and hip circumferences, and BMI, clearly indicating increased adiposity compared to their non-obese counterparts. HSI was significantly elevated in the obese group; however, no statistically significant differences were observed in fibrosis markers, such as FIB-4 and the Fornsindex. Despite comparable fasting plasma glucose and HbA1c levels—likely attributable to the recent diagnosis of type 2 diabetes across all participants—individuals with obesity demonstrated higher fasting insulin levels and HOMA-IR scores, reflecting more severe insulin resistance. Moreover, the adipokine profile in the obese subgroup was markedly altered, characterized by significantly lower adiponectin levels and increased concentrations of leptin and resistin, suggesting adipose tissue dysfunction. Elevated circulating levels of TNF-α were also observed in the participants with a BMI over 30 kg/m2, while IL-6 levels showed a non-significant upward trend. Additionally, the obese patients displayed a more atherogenic lipid profile, with significantly higher triglyceride levels and reduced HDL-cholesterol concentrations (Table 3).
  • Cytokines and hepatic steatosis index
The patients with new-onset diabetes and HS, in the highest tertiles of HSI, had the highest levels of inflammatory cytokines (TNF- α, IL-6), leptin, and resistin and the lowest levels of adiponectin (all p < 0.05) (Table 4).
Adiponectin was negatively correlated with BMI, WC, HS, HSI, hepatic fibrosis, and IR only in the HS group (Table 5); in both groups, adiponectin was lower in men (4.2 ± 1.89 vs. 5.7 ± 1.97 ng/mL, p = 0.031 in the diabetic patients without HS, and 3.8 ± 1.88 vs. 4.93 ± 2.36 ng/mL in the patients with HS, respectively).
In the diabetic patients with HS, leptin, TNF-a, IL-6, and resistin positively correlated with IR, HSI, and hepatic fibrosis (Table 5).
  • Cytokines and hepatic fibrosis
Hepatic fibrosis (non-invasively assessed using FIB-4) was observed in 22.6% (n = 35), the majority presenting HS (88.57%, n = 31); the patients with hepatic fibrosis had advanced age (58 vs. 52 years, p < 0.001), greater HOMA-IR index (4.5 vs. 3.38, p = 0.001), higher leptin (19.8 vs. 18.1 ng/mL, p = 0.031), TNF-α (17.4 vs. 14.5 pg/mL, p = 0.003), IL-6 (19.74 vs. 15.72, p = 0.003), and resistin levels (27.6 vs. 18.57 ng/mL, p < 0.001), and lower adiponectin concentrations (2.71 vs. 4.59 ng/mL, p < 0.001).
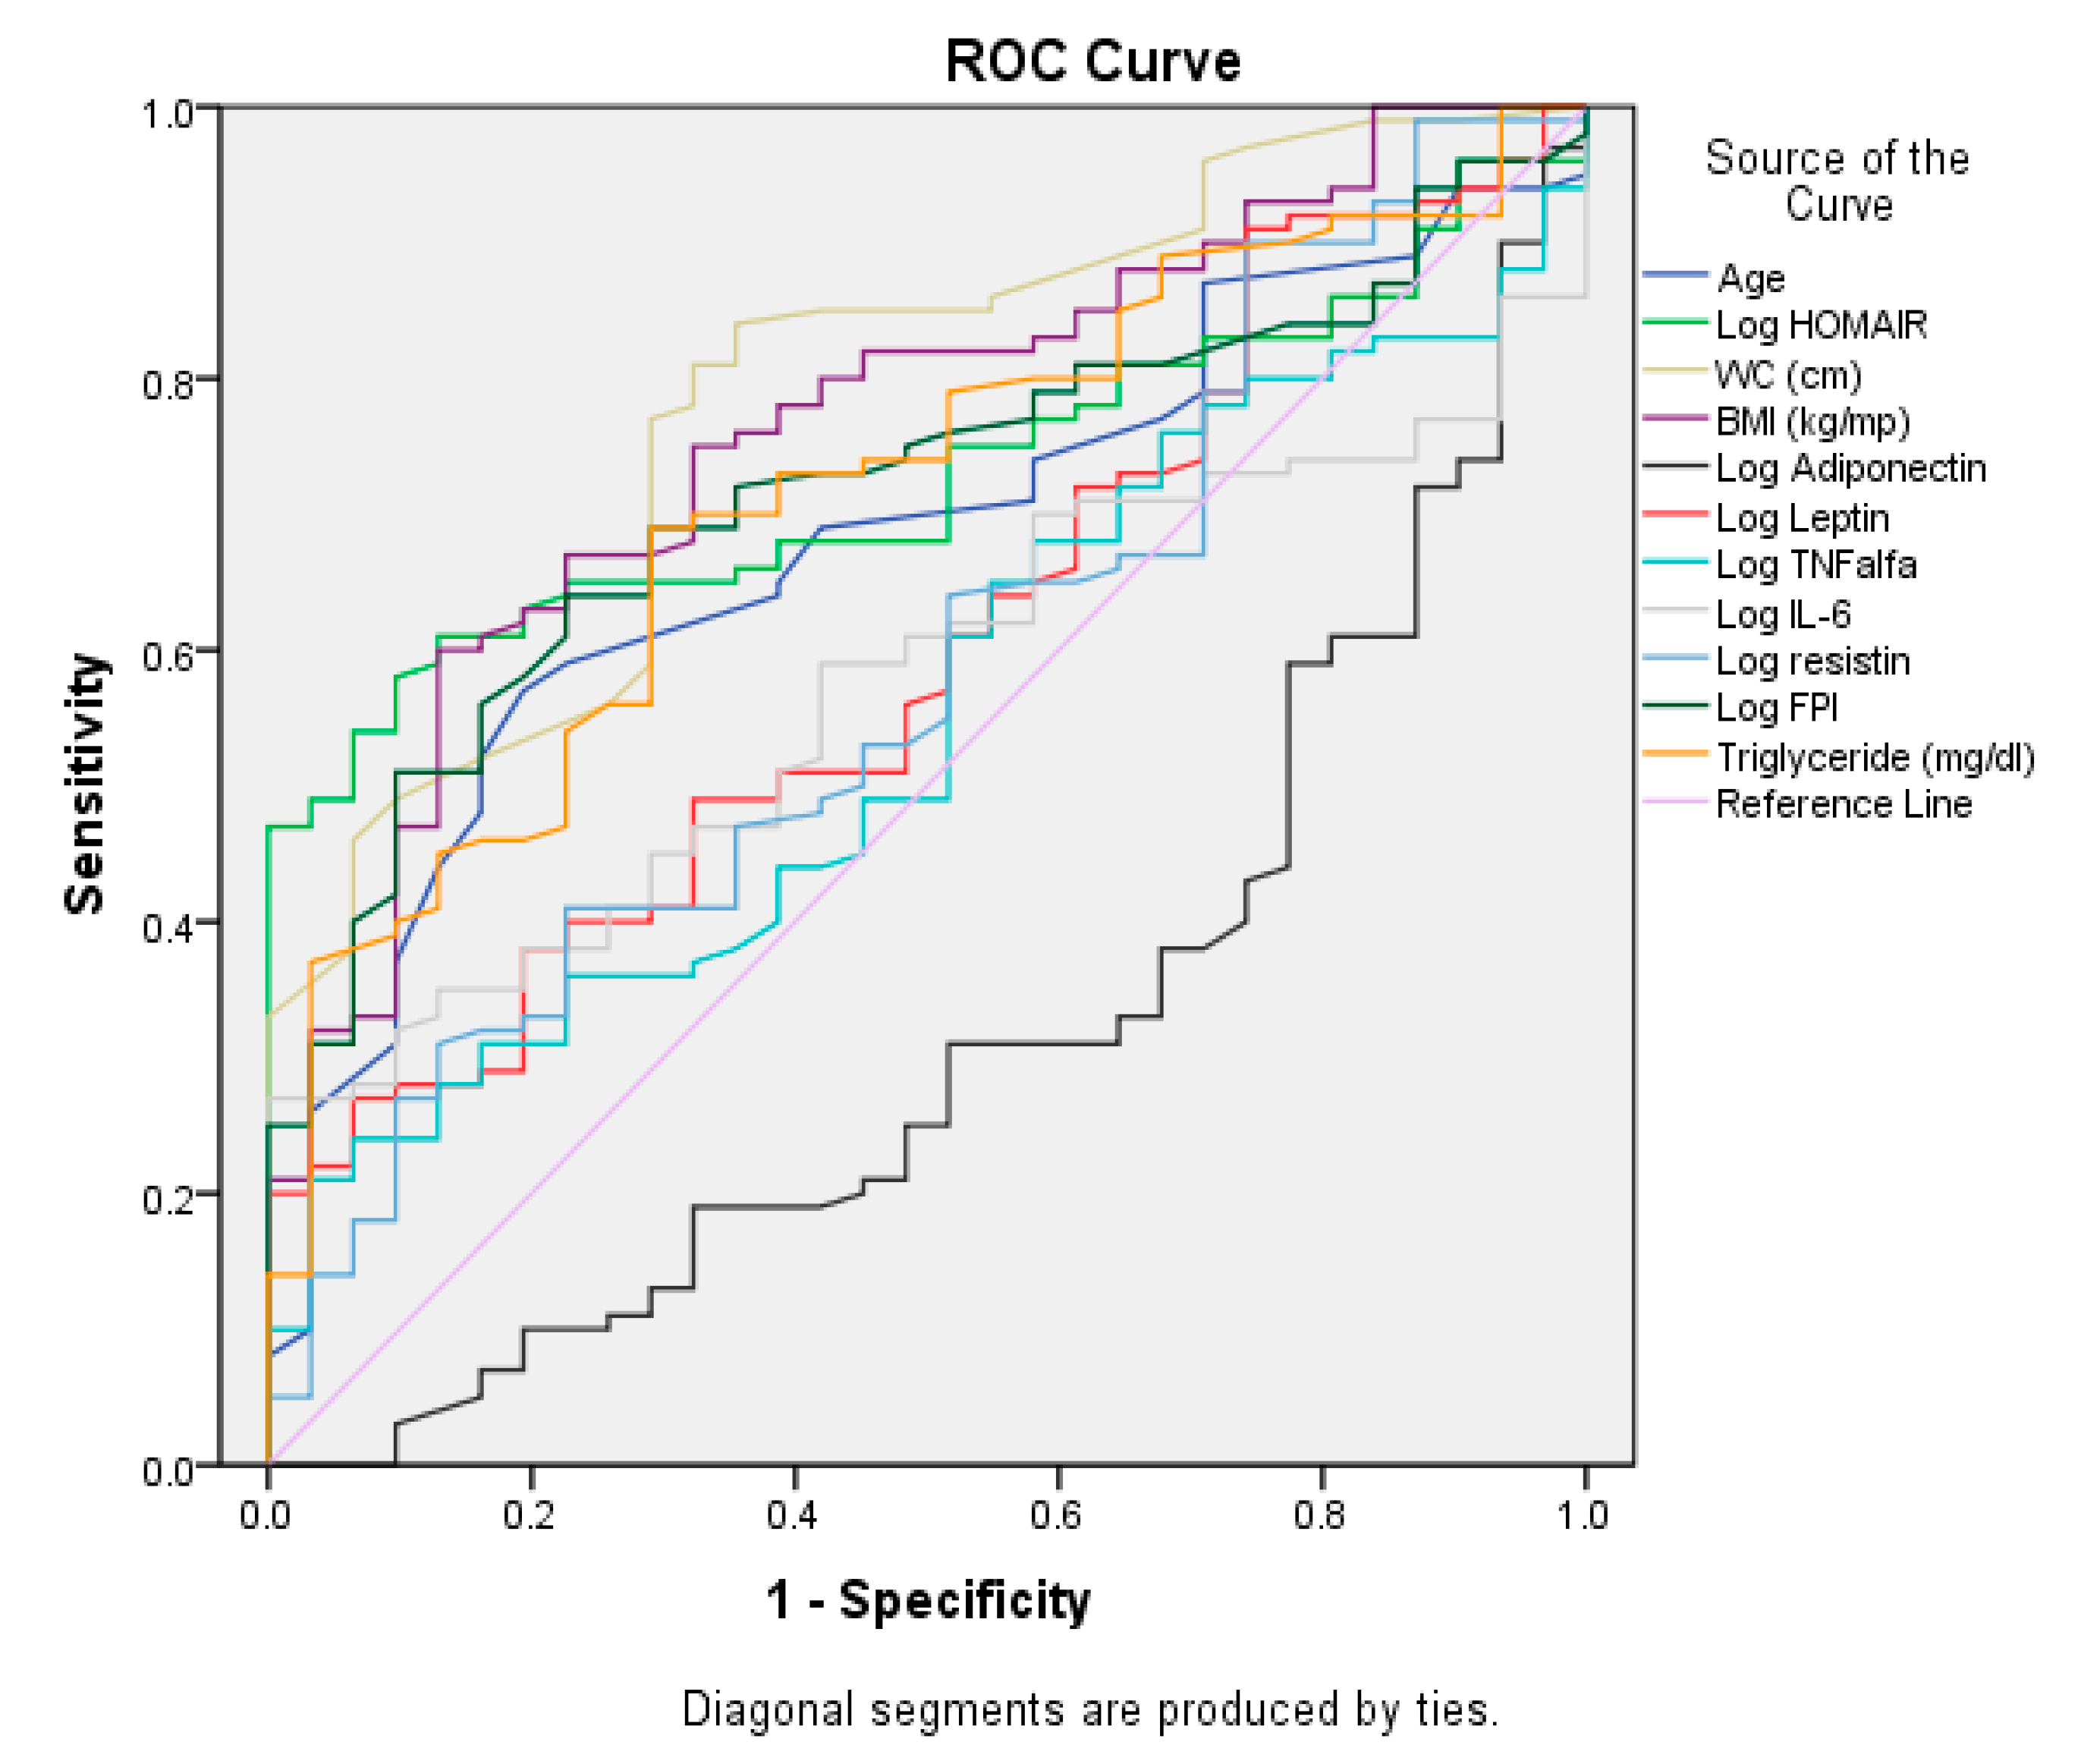
  • Comparison of areas under ROC curves (95% CI) for predictors of HS
Among all the participants, WC exhibited the greatest discriminatory capacity for hepatic steatosis, as indicated by an AUROC of 0.786 (95% CI: 0.699, 0.872), followed by BMI, which showed a comparably high but slightly lower discriminative performance (AUROC = 0.765; 95% CI: 0.675, 0.854). Moreover, both HOMA-IR (AUROC = 0.729; 95% CI: 0.654, 0.812) and TG (AUROC = 0.714; 95% CI: 0.619, 0.809) were significantly associated with HS (overall p < 0.0001) (Figure 1). The levels of leptin, TNF-α, IL-6, and resistin, could not be used to predict HS (Figure 1). The AUROC for adiponectin reached 0.314 (95% CI: 0.207, 0.421), indicating a statistically significant association (p = 0.002).
  • Predictors for hepatic steatosis by multivariate logistic regression
In univariate analysis (Spearman correlation), the following parameters were positively correlated with the presence of steatosis evaluated with HSI: age, WC, BMI, TG levels, AST, ALT, GGT, FPG, FPI, HOMA-IR, leptin, resistin, IL-6, and TNF-α; for adiponectin, a negative correlation was observed (Table 5).
Two multivariable logistic regression models were constructed to assess the association between anthropometric indicators and hepatic steatosis. Both models included the variables that were statistically significant in the unadjusted (crude) odds ratio analysis: age over 52 years, smoking status, low adiponectin levels (<7.2 ng/mL), elevated HOMA-IR (>2.85), fasting insulin (>7.2 uU/mL), triglyceride levels (>153 mg/dL), and either waist-to-hip ratio (WHR) or waist circumference (CA), depending on the model. Sex was also initially included due to its clinical relevance.
In Model 1, WHR was included as the anthropometric variable in a multivariable logistic regression using backward (Wald) selection. Individuals aged over 52.8 had a significantly higher risk (OR = 4.94, p < 0.001). Smoking was also a significant predictor (OR = 3.38, p = 0.013), alongside low adiponectin levels (<7.2 ng/mL) and elevated insulin resistance (HOMA-IR > 2.85) (Table 6). The model demonstrated good fit, with a statistically significant constant (B = −1.66; OR = 0.19; p = 0.002), suggesting a lowbaseline probability of hepatic steatosis in the absence of these factors.
In Model 2, WC was included as the anthropometric predictor in a multivariable logistic regression using backward (Wald) selection. Four variables remained independently associated with HS. The participants with increased waist circumference had 5.15-fold higher odds of HS (p < 0.001). Age over 52.8 years was also a significant predictor, along with smoking and hypoadiponectinemia (Table 6). Although Model 2 retained several significant predictors, the constant was not statistically significant (p = 0.777), which may reflect a lower overall model fit or baseline stability compared to Model 1.

4. Discussion

Mounting evidence indicates the important role of cytokines in the development and progression of MAFLD and diabetes. In the direction of this research, this paper was designed to evaluate the interaction of cytokines, adipocytokines, and HS in patients with new-onset diabetes.
Patients with new-onset diabetes and HS have elevated levels of inflammatory cytokines (TNF-α, IL-6) and decreased adiponectin levels.
On average, patients with T2DM have 80% more liver fat than carefully age- and gender-matched equally obese nondiabetic subjects [26]. These data support an association between hepatic fat accumulation and newly diagnosed T2D, although the direction of causality remains uncertain. As our study is cross-sectional in design, no causal inferences can be drawn. While hepatic steatosis is largely considered a consequence of systemic insulin resistance and hyperglycemia, data from Mendelian randomization studies [27,28] and findings from mechanistic studies [29] suggest that hepatic steatosis may also play a causal role in the development of insulin resistance and type 2 diabetes. In our study, the diabetic patients with HS had a greater prevalence of metabolic waist, hypertension, and hypertriglyceridemia. These findings suggest that HS is a part of multiple disturbances resulting from adipose tissue dysfunction. Nevertheless, the mechanisms linking adipose tissue dysfunction to HS, IR, and impaired glucose tolerance/diabetes are complex and not yet fully understood. An unhealthy lifestyle (high fat, high carbohydrate, physical inactivity) coupled with stress, genetics, or epigenetic factors are important determinants for ectopic fat deposits (muscle, liver, pancreas, heart). Chronic systemic low-grade inflammation reflects dysfunctional ectopic fat accumulation and enhances the development of endothelial dysfunction and IR (liver, muscle, and adipose tissue). Cytokines and adipocytokines released from adipose tissue or hepatic cells interfere with insulin signaling through nuclear factor-kB, c-Jun N-terminal kinase, and ceramides [30,31,32,33]. Impaired liver insulin sensitivity is associated with dysregulation of hepatic oxidation of fatty acids and de novo lipogenesis, which causes MAFLD. The imbalanced production of pro- and anti-inflammatory cytokines plays a crucial role in the development of several facets of MetS, diabetes, and HS/MAFLD. Therefore, fatty liver, the hallmark feature of MAFLD, can be considered a consequence of adipose tissue dysfunction.
In our study, the diabetic patients with HS had a higher HOMA-IR index, an independent factor associated with the presence of HS. Adiponectin was significantly reduced in patients with HS and negatively related to IR, HSI, and anthropometric parameters (BMI, WC).
In multivariate analysis, decreased adiponectin levels were significantly associated with HS. Hypoadiponectinemia may be a helpful marker for identifying people with diabetes and HS. Moreover, an adiponectin gene polymorphism can predict the severity of disease in NASH [34,35]. Moreover, a recent study further reinforced the therapeutic potential of adiponectin in addressing HS associated with type 1 diabetes in rats [36]. These findings underscore the critical role of adiponectin in regulating hepatic metabolism and suggest its potential as a promising intervention for diabetes-related liver dysfunction. By activating AMP-activated protein kinase, which subsequently suppresses Acetyl-CoA carboxylase (ACC) and fatty acid (FA) synthase, adiponectin contributes to the reduction in HS. Furthermore, it limits the transport of FA into the liver, thereby mitigating the development of MAFLD [37].
Leptin plays a dual-action role in NAFLD models; it may protect from HS, at least at the initial stages of the disease, but it may act as an inflammatory and fibrogenic factor when the disease persists or progresses [38]. Data derived from clinical studies evaluating circulating leptin reported higher leptin levels in NAFLD patients with a strong relationship between leptin and the extent of liver involvement in NAFLD [39]. In our patients, circulating leptin was higher in people with diabetes with HS and was positively correlated with BMI, WC, HSI, and HOMA-IR. For all that, in multivariate analysis, hyperleptinemia was not a risk factor for HS.
TNF-α, produced by adipose tissue or activated Kupffer cells, is rising in patients with chronic and acute liver failure [40]. In our study, higher values for TNF-α were found in the patients with diabetes and HS, with a positive correlation with excess weight, IR, and HSI.
IL-6 can contribute to IR by upregulating the expression of suppressor of cytokine signaling 3 (SOCS3) in hepatic tissue [41]. Mahmoud et al. [42] showed that IL-6 was the most inflammatory biomarker for NAFLD. A possible explanation for these results would be that we enrolled patients with diabetes with increased levels of proinflammatory cytokines. In our study, the patients with HS had an increased level of IL-6.
Resistin, through a NF-kB mechanism, plays an important role in inflammation [43] and lipid metabolism, thus influencing the risk of MetS [44]. The link between resistin and NAFLD remains under debate in humans [40]. Our data showed higher serum resistin levels in the HS patients correlated with the HSI; whether the correlation is a coincidence or a causal effect needs further investigation.
In our study, age was correlated with HS in the diabetic patients. Age-related changes in the liver are characterized by considerable structure and function shifts, leading to significant alteration of many hepatic metabolic and detoxification activities, such as increased fibrosis with a reduced percentage of fat on liver biopsy, loss of regenerative capacity, and increased inflammatory changes [45].
Among individuals with newly diagnosed diabetes, age, smoking, low adiponectin levels, and elevated HOMA-IR were independently associated with hepatic steatosis in the model that included WHR. However, when waist circumference was used instead, HOMA-IR no longer remained a significant predictor. WHR appears to be a more consistent measure of visceral fat and a stronger predictor of hepatic steatosis in our study group.
This study has several limitations. The primary limitation is the cross-sectional design. Second, liver steatosis was diagnosed using ultrasound, not biopsy, although the method used is widely accepted in clinical practice. Third, the use of HOMA-IR as a surrogate for insulin resistance, while validated, may not fully capture the complexity of insulin sensitivity. Additionally, the relatively small control group may have limited statistical power for some subgroup analyses. Finally, adipocytokine and cytokine levels may be influenced by acute-phase responses, although all patients were clinically stable at inclusion.

5. Conclusions

Adipose tissue dysfunction assessed through adipocytokines and proinflammatory cytokines is part of associated disorders in hepatic steatosis and new-onset type 2 diabetes.
In patients with newly diagnosed type 2 diabetes, age, smoking, and hypoadiponectinemia consistently emerged as independent predictors of hepatic steatosis, regardless of the anthropometric measure used. More prospective trials are needed to clarify the “start time” of adipose tissue dysfunction and the effects of different cytokines on MAFLD and T2D pathogenesis to prevent their late clinical consequences.

Author Contributions

Conceptualization, E.R., M.J. and G.R.; methodology, E.R., M.J. and G.R.; software, F.R. and A.N.; validation, E.R., A.A., I.V. and A.C.; formal analysis, E.R., A.C. and F.R.; investigation, E.R., M.J., G.E., R.C. and A.N.; resources, R.C., I.V. and F.R.; data curation, A.N., R.C., and A.A.; writing—original draft preparation, E.R., G.R. and F.R.; writing—review and editing, I.V. and G.R.; visualization, I.V. and A.N.; supervision M.J. and G.R.; project administration, E.R., M.J. and G.R. All authors have read and agreed to the published version of the manuscript.

Funding

The Romanian National Authority for Scientific Research supported this study as part of the PNCDI 2 program DIADIPOHEP 41-008/2007. PNCI2-3343/41008/2007. The publication of this article will be supported, if necessary, by the University of Medicine and Pharmacy Carol Davila, through the institutional program “Publish not Perish”.

Institutional Review Board Statement

The Romanian National Authority for Scientific Research approved this study. Approval code: 41-008-P3 and Approval date: 14 September 2007. The study was conducted in accordance with the Declaration of Helsinki and approved by the Institutional Review Board (or Ethics Committee) of CANTACUZINO HOSPITAL (Bucharest, Romania) (291/23.11.2007).

Informed Consent Statement

Informed consent was obtained from all subjects involved in the study.

Data Availability Statement

The original contributions presented in the study are included in the article; further inquiries can be directed to the corresponding author.

Acknowledgments

This study was supported by the Romanian National Authority for Scientific Research as a part of the PNCDI 2 program DIADIPOHEP 41-008/2007. The funders had no role in study design, data collection and analysis, decision to publish, or preparation of the manuscript.

Conflicts of Interest

The authors declare no conflicts of interest.

Abbreviations

MAFLDMetabolic dysfunction-associated fatty liver disease
NAFLDNonalcoholic fatty liver disease
MASLDMetabolic dysfunction-associated steatotic liver diseases
HDLHigh-density lipoprotein
HSHepatic steatosis
T2DMType 2 diabetes mellitus
IL-6Interleukin-6
TNF-αTumor necrosis factor-alpha
IRInsulin resistance
BMIBody mass index
WCWaist circumference
HipCHip circumference
WHOWorld Health Organization
TCTotal cholesterol
TGTriglycerides
FPGFasting plasma glucose
FPIFasting plasma insulin
HbA1cGlycated hemoglobin
GPTGlutamate–pyruvate transaminase
GOTGlutamic oxaloacetic transaminase
GGTGamma-glutamyl transpeptidase
INRInternational Normalized Ratio
HOMA-IRHomeostasis Model Assessment of Insulin Resistance
SBPSystolic blood pressure
DBPDiastolic blood pressure
HISHepatic steatosis index
ASTAspartate aminotransferase
ALTAlanine aminotransferase
FIFornsFibrosis Index
AUROCArea under the Receiver Operating Characteristic Curve
CIsConfidence intervals
OROdds ratios
MetSMetabolic syndrome
ACCAcetyl-CoA carboxylase
FAFatty acid
WHRWaist-to-hip ratio

References

  1. Eslam, M.; Newsome, P.N.; Sarin, S.K.; Anstee, Q.M.; Targher, G.; Romero-Gomez, M.; Zelber-Sagi, S.; Wong, V.W.-S.; Dufour, J.-F.; Schattenberg, J.M.; et al. A new definition for metabolic dysfunction-associated fatty liver disease: An international expert consensus statement. J. Hepatol. 2020, 73, 202–209. [Google Scholar] [CrossRef] [PubMed]
  2. Chan, K.E.; Koh, T.J.L.; Tang, A.S.P.; Quek, J.; Yong, J.N.; Tay, P.; Tan, D.J.H.; Lim, W.H.; Lin, S.Y.; Huang, D.; et al. Global prevalence and clinical characteristics of metabolic-associated fatty liver disease: A meta-analysis and systematic review of 10 739 607 individuals. J. Clin. Endocrinol. Metab. 2022, 107, 2691–2700. [Google Scholar] [CrossRef] [PubMed]
  3. Younossi, Z.M.; Kalligeros, M.; Henry, L. Epidemiology of metabolic dysfunction-associated steatotic liver disease. Clin. Mol. Hepatol. 2024, 31, S32–S50. [Google Scholar] [CrossRef] [PubMed]
  4. Younossi, Z.M.; Golabi, P.; Paik, J.M.; Henry, A.; Van Dongen, C.; Henry, L. The Global Epidemiology of Nonalcoholic Fatty Liver Disease (NAFLD) and Nonalcoholic Steatohepatitis (NASH): A Systematic Review. Hepatology 2023, 77, 1335–1347. [Google Scholar] [CrossRef]
  5. Cholongitas, E.; Pavlopoulou, I.; Papatheodoridi, M.; Markakis, G.E.; Bouras, E.; Haidich, A.B.; Papatheodoridis, G. Epidemiology of Nonalcoholic Fatty Liver Disease in Europe: A Systematic Review and Meta-Analysis. Ann. Gastroenterol. 2021, 34, 404–414. [Google Scholar] [CrossRef]
  6. European Association for the Study of the Liver (EASL); European Association for the Study of Diabetes (EASD); European Association for the Study of Obesity (EASO). EASL-EASD-EASO Clinical Practice Guidelines on the management of metabolic dysfunction-associated steatotic liver disease (MASLD). J. Hepatol. 2024, 81, 492–542. [Google Scholar] [CrossRef] [PubMed]
  7. Portincasa, P.; Baffy, G. Metabolic dysfunction-associated steatotic liver disease: Evolution of the final terminology. Eur. J. Intern. Med. 2024, 124, 35–39. [Google Scholar] [CrossRef] [PubMed]
  8. Younossi, Z.; Golabi, P.; de Avila, L.; Paik, J.M.; Srishord, M.; Fukui, N.; Qiu, Y.; Burns, L.; Afendy, A.; Nader, F. The global epidemiology of NAFLD and NASH in patients with type 2 diabetes: A systematic review and meta-analysis. J. Hepatol. 2019, 71, 793–801. [Google Scholar] [CrossRef] [PubMed]
  9. Stefan, N.; Yki-Järvinen, H.; Neuschwander-Tetri, B.A. Metabolic dysfunction-associated steatotic liver disease: Heterogeneous pathomechanisms and effectiveness of metabolism-based treatment. Lancet Diabetes Endocrinol. 2025, 13, 134–148. [Google Scholar] [CrossRef] [PubMed]
  10. Stefan, N.; Targher, G. Clusters of metabolic dysfunction-associated steatotic liver disease for precision medicine. Nat. Rev. Gastroenterol. Hepatol. 2025, 22, 226–227. [Google Scholar] [CrossRef] [PubMed]
  11. Caldas, C.A.M.; Freire de Carvalho, J. Antiphospholipid syndrome and polyarteritis nodosa: A diagnostic and therapeutic challenge. Rheumatol. Int. 2013, 33, 2697–2698. [Google Scholar] [CrossRef] [PubMed]
  12. Rusu, E.; Enache, G.; Jinga, M.; Dragut, R.; Raluca, N.; Parpala, C.; Popescu, H.; Homentcovschi, C.; Ateia, S.; Posea, M.; et al. Adiponectin in patients with non-alcoholic steatohepatitis. Med. Surg. J. 2015, 119, 664–669. Available online: https://www.revmedchir.ro/index.php/revmedchir/issue/view/14 (accessed on 14 March 2025).
  13. Jiménez-Cortegana, C.; García-Galey, A.; Tami, M.; Del Pino, P.; Carmona, I.; López, S.; Alba, G.; Sánchez-Margalet, V. Role of Leptin in Non-Alcoholic Fatty Liver Disease. Biomedicines 2021, 9, 762. [Google Scholar] [CrossRef] [PubMed] [PubMed Central]
  14. Braunersreuther, V.; Viviani, G.L.; Mach, F.; Montecucco, F. Role of cytokines and chemokines in nonalcoholic fatty liver disease. World J. Gastroenterol. 2012, 18, 727–735. [Google Scholar] [CrossRef]
  15. Pearce, S.G.; Thosani, N.C.; Pan, J.J. Noninvasive biomarkers for the diagnosis of steatohepatitis and advanced fibrosis in NAFLD. Biomark. Res. 2013, 1, 7. [Google Scholar] [CrossRef]
  16. Polyzos, S.A.; Kountouras, J.; Mantzoros, C.S. Adipokines in nonalcoholic fatty liver disease. Metabolism 2016, 65, 1062–1079. [Google Scholar] [CrossRef]
  17. Mirzaei, A.; Asal, A.; Seidkhani-Nahal, A.; Noori-Zadeh, A. A systematic review and meta-analysis of serum resistin level and its relation to HOMA-IR score using meta-regression in nonalcoholic fatty liver disease patients. Mediterr. J. Nutr. Metab. 2021, 14, 219–231. [Google Scholar] [CrossRef]
  18. World Health Organization. Obesity: Preventing and Managing the Global Epidemic: Report of a World Health Organization Consultation; World Health Organization: Geneva, Switzerland, 1997. [Google Scholar]
  19. Matthews, D.R.; Hosker, J.P.; Rudenski, A.S.; Naylor, B.A.; Treacher, D.F.; Turner, R.C. Homeostasis model assessment: Insulin resistance and beta-cell function from fasting plasma glucose and insulin concentrations in man. Diabetologia 1985, 28, 412–419. [Google Scholar] [CrossRef]
  20. American Diabetes Association. Diagnosis and classification of diabetes mellitus. Diabetes Care 2010, 33, S62–S69. [Google Scholar] [CrossRef]
  21. Alberti, K.G.; Eckel, R.H.; Grundy, S.M.; Zimmet, P.Z.; Cleeman, J.I.; Donato, K.A.; Fruchart, J.C.; James, W.P.; Loria, C.M.; Smith, S.C., Jr.; et al. Harmonizing the metabolic syndrome: A joint interim statement of the International Diabetes Federation Task Force on Epidemiology and Prevention; National Heart, Lung, and Blood Institute; American Heart Association; World Heart Federation; International Atherosclerosis Society; and International Association for the Study of Obesity. Circulation 2009, 120, 1640–1645. [Google Scholar]
  22. Lewis, J.R.; Mohanty, S.R. Nonalcoholic fatty liver disease: A review and update. Dig. Dis. Sci. 2010, 55, 560–578. [Google Scholar] [CrossRef] [PubMed]
  23. Jeong-Hoon, L.; Donghee, K.; Hwa Jung, K.; Chang-Hoon, L.; Jong In, Y.; Won, K.; Yoon Jun, K.; Jung-Hwan, Y.; Sang-Heon, C.; Myung-Whun, S.; et al. Hepatic steatosis index: A simple screening tool reflecting nonalcoholic fatty liver disease. Dig. Liver Dis. 2010, 42, 503–508. [Google Scholar]
  24. McPherson, S.; Stewart, S.F.; Henderson, E.; Burt, A.D.; Day, C.P. Simple non-invasive fibrosis scoring systems can reliably exclude advanced fibrosis in patients with non-alcoholic fatty liver disease. Gut 2010, 59, 1265–1269. [Google Scholar] [CrossRef] [PubMed]
  25. Forns, X.; Ampurdanès, S.; Llovet, J.M.; Aponte, J.; Quintó, L.; Martínez-Bauer, E.; Bruguera, M.; Sánchez-Tapias, J.M.; Rodés, J. Identification of chronic hepatitis C patients without hepatic fibrosis by a simple predictive model. Hepatology 2002, 36, 986–992. [Google Scholar] [CrossRef]
  26. Kotronen, A.; Juurinen, L.; Hakkarainen, A.; Westerbacka, J.; Cornér, A.; Bergholm, R.; Yki-Järvinen, H. Liver fat is increased in type 2 diabetic patients and underestimated by serum alanine aminotransferase compared with equally obese nondiabetic subjects. Diabetes Care 2008, 31, 165–169. [Google Scholar] [CrossRef]
  27. Martin, S.; Sorokin, E.P.; Thomas, E.L.; Sattar, N.; Cule, M.; Bell, J.D.; Yaghootkar, H. Estimating the Effect of Liver and Pancreas Volume and Fat Content on Risk of Diabetes: A Mendelian Randomization Study. Diabetes Care 2022, 45, 460–468. [Google Scholar] [CrossRef]
  28. Ahmed, A.; Cule, M.; Bell, D.; Sattar, N.; Yaghootkar, H. Differing genetic variants associated with liver fat and their contrasting relationships with cardiovascular diseases and cancer. J. Hepatol. 2024, 81, 921–929. [Google Scholar] [CrossRef]
  29. Stefan, N.; Schick, F.; Birkenfeld, A.L.; Häring, H.-U.; White, M.F. The role of hepatokines in NAFLD. Cell Metab. 2023, 35, 236–252. [Google Scholar] [CrossRef] [PubMed]
  30. Abdullah, M.; AlQwaidi, S.; Alshehri, A.; Alamry, F.; Alamri, R.; Alsolbi, Z.; Alqurashi, B.; Aldandan, Y.; Alrashidi, A.; Aljumaie, M. Obesity-Induced Inflammation and Its Role in the Development of Insulin Resistance. J. Healthc. Sci. 2024, 4, 448–454. [Google Scholar] [CrossRef]
  31. Li, Y.; Talbot, C.; Chaurasia, B. Ceramides in Adipose Tissue. Front. Endocrinol. 2020, 11, 407. [Google Scholar] [CrossRef]
  32. Saponaro, C.; Sabatini, S.; Gaggini, M.; Carli, F.; Rosso, C.; Positano, V.; Armandi, A.; Caviglia, G.P.; Faletti, R.; Bugianesi, E.; et al. Adipose tissue dysfunction and visceral fat are associated with hepatic insulin resistance and severity of NASH even in lean individuals. Liver Int. 2022, 42, 2418–2427. [Google Scholar] [CrossRef] [PubMed]
  33. Vesković, M.; Šutulović, N.; Hrnčić, D.; Stanojlović, O.; Macut, D.; Mladenović, D. The Interconnection between Hepatic Insulin Resistance and Metabolic Dysfunction-Associated Steatotic Liver Disease—The Transition from an Adipocentric to Liver-Centric Approach. Curr. Issues Mol. Biol. 2023, 45, 9084–9102. [Google Scholar] [CrossRef] [PubMed]
  34. Hasan, E.M.; Abd Al Aziz, R.A.; Sabry, D.; Badary, H.A.; Gaber, Y.; Yosry, A.; Zakaria, Z. The association of adiponectin gene polymorphisms with susceptibility and progression of NAFLD in a cohort of Egyptian patients. Egypt. Liver J. 2021, 11, 1–11. [Google Scholar] [CrossRef]
  35. Martinou, E.; Pericleous, M.; Stefanova, I.; Kaur, V.; Angelidi, A.M. Diagnostic Modalities of Non-Alcoholic Fatty Liver Disease: From Biochemical Biomarkers to Multi-Omics Non-Invasive Approaches. Diagnostics 2022, 12, 407. [Google Scholar] [CrossRef]
  36. Franczyk, M.P.; He, M.; Yoshino, J. Removal of Epididymal Visceral Adipose Tissue Prevents Obesity-Induced Multi-organ Insulin Resistance in Male Mice. J. Endocr. Soc. 2021, 5, bvab024. [Google Scholar] [CrossRef]
  37. Wang, Y.; Zhou, M.; Lam, K.S.; Xu, A. Protective roles of adiponectin in obesity-related fatty liver diseases: Mechanisms and therapeutic implications. Arq. Bras. Endocrinol. Metab. 2009, 53, 201–212. [Google Scholar] [CrossRef]
  38. Polyzos, S.A.; Kountouras, J.; Mantzoros, C.S. Leptin in nonalcoholic fatty liver disease: A narrative review. Metabolism 2015, 64, 60–78. [Google Scholar] [CrossRef]
  39. Rotundo, L.; Persaud, A.; Feurdean, M.; Ahlawat, S.; Kim, H.-S. The Association of leptin with severity of non-alcoholic fatty liver disease: A population-based study. Clin. Mol. Hepatol. 2018, 24, 392–401. [Google Scholar] [CrossRef]
  40. Petrescu, M.; Vlaicu, S.I.; Ciumărnean, L.; Milaciu, M.V.; Mărginean, C.; Florea, M.; Vesa, Ș.C.; Popa, M. Chronic Inflammation—A Link between Nonalcoholic Fatty Liver Disease (NAFLD) and Dysfunctional Adipose Tissue. Medicina 2022, 58, 641. [Google Scholar] [CrossRef]
  41. Gramignoli, R.; Ranade, A.R.; Venkataramanan, R.; Strom, S.C. Effects of Pro-Inflammatory Cytokines on Hepatic Metabolism in Primary Human Hepatocytes. Int. J. Mol. Sci. 2022, 23, 14880. [Google Scholar] [CrossRef]
  42. Mahmoud, A.A.; Bakir, A.S.; Shabana, S.S. Serum TGF-β, Serum MMP-1, and HOMA-IR as noninvasive predictors of fibrosis in Egyptian patients with NAFLD. Saudi J. Gastroenterol. 2012, 18, 327–333. [Google Scholar] [CrossRef] [PubMed]
  43. Yokota, T.; Oritani, K.; Takahashi, I.; Ishikawa, J.; Matsuyama, A.; Ouchi, N.; Kihara, S.; Funahashi, T.; Tenner, A.J.; Tomiyama, Y.; et al. Adiponectin, a new member of the family of soluble defense collagens, negatively regulates the growth of myelomonocytic progenitors and the functions of macrophages. Blood 2000, 96, 1723–1732. [Google Scholar] [CrossRef] [PubMed]
  44. Steppan, C.M.; Wang, J.; Whiteman, E.L.; Birnbaum, M.J.; Lazar, M.A. Activation of SOCS-3 by resistin. Mol. Cell. Biol. 2005, 25, 1569–1575. [Google Scholar] [CrossRef] [PubMed]
  45. Radonjić, T.; Dukić, M.; Jovanović, I.; Zdravković, M.; Mandić, O.; Popadić, V.; Popović, M.; Nikolić, N.; Klašnja, S.; Divac, A.; et al. Aging of Liver in Its Different Diseases. Int. J. Mol. Sci. 2022, 23, 13085. [Google Scholar] [CrossRef]
Figure 1. Discriminative performance of predictive markers: ROC curves in all patients.
Diabetology 06 00070 g001
Table 1. Assessment of clinical and laboratory variables based on hepatic steatosis presence.
HS- (n = 37)HS+ (n = 118)Total (n = 155)
MeanSDMedianMeanSDMedianMeanSDMedianp 1
Age (years)49.226.4149.0054.078.1255.5052.918.0054.00<0.0001
Weight (kg)72.0115.0970.0086.5816.5588.0083.1017.3285.70<0.0001
WC (cm)82.5112.4382.0099.1414.0899.5095.1715.4097.00<0.0001
BMI (kg/mp)24.993.7924.5730.335.2730.2129.055.4528.81<0.0001
HipC (cm)89.977.0889.0099.979.73103.0097.5810.0997.00<0.0001
HSI33.383.5433.4039.595.9439.1938.116.0737.94<0.0001
Forns Index5.251.075.075.891.345.975.741.315.70.007
FIB-40.330.470.20.891.230.430.761.230.340.016
AST (UI/L)41.5122.3138.0062.5135.3357.5057.4933.8453.000.010
ALT (UI/L)56.0531.0153.0074.2947.3664.0069.9344.6058.000.030
GGT (UI/L)64.9254.9352.0079.2453.8875.0075.8254.3071.000.016
FPG (mg/dL)102.5029.3094.00112.1333.5699.00109.8332.7697.000.119
FPI (uUI/mL)9.763.6010.1514.277.9713.0013.197.4111.900.001
HOMA-IR2.560.822.734.333.023.993.912.773.180.002
HbA1c (%)6.71.126.16.91.366.56.941.36.50.362
Adiponectin (ng/mL)5.232.065.174.392.204.114.592.194.300.041
Leptin (ng/mL)17.566.5516.8820.4111.1118.5819.7310.2618.400.041
Resistin (ng/mL)19.7011.2017.8023.4714.6819.7522.5713.9819.700.045
TNF-α (pg/mL)14.894.1415.4116.226.7215.2215.906.2115.240.026
IL-6 (pg/mL)15.503.7615.6018.619.6416.8617.878.7016.200.037
Cholesterol (mg/dL)216.2752.97203.00208.6047.35197.00210.4348.69199.000.405
Triglyceride (mg/dL)140.8654.36136.00177.5476.76170.00168.7973.58163.000.008
HDL-C (mg/dL)43.3110.2640.3038.879.4436.9539.939.7937.700.015
Abbreviations: 1 between groups; p-p value; SD—standard deviation, ALT, alanine aminotransferase; AST, aspartate aminotransferase; BMI, body mass index; FPG, fasting plasma glucose; FPI, fasting plasma insulin; GGT, gamma-glutamyl transpeptidase; HipC, hip circumference; HDL-C, high-densitylipoproteincholesterol; HSI, hepatic steatosis index; HOMA-IR, homeostasis model assessment of insulinresistance; IL-6, interleukin 6;TNF-α, tumor necrosis factor-alpha; WC, waist circumference.
Table 2. Distribution of metabolic syndrome components in relation to hepatic steatosis.
HS-HS+Totalp
Metabolic WC37.8% (n = 14)81.4% (n = 96)71% (n =110)<0.0001
HypoHDL-C67.6% (n = 25)73.7% (n = 87)73.2% (n = 112)0.465
Hypertension48.6% (n = 18)63.6% (n = 75)60% (n = 93)0.0106
TG > 150 mg/dL35.1% (n = 13)58.5% (n = 69)52.9% (n = 82)0.013
Abbreviations: WC, waist circumference; HDL-C, high-density lipoproteincholesterol; TG, triglycerides.
Table 3. Assessment of clinical and laboratory variables according to the presence of obesity.
Without Obesity (n = 92)With Obesity (n = 63)Total (n = 155)
MeanSDMedianMeanSDMedianMeanSDMedianp 1
Age (years)52.208.0952.0053.957.81756.0052.918.0054.000.113
Weight (kg)73.8513.1271.5096.6013.4394.8083.1017.3285.70<0.001
WC (cm)86.5712.2787.50107.739.88106.0095.1715.4097.00<0.001
BMI (kg/mp)25.563.1525.8634.143.8333.2629.055.4528.81<0.001
HipC (cm)91.427.3090.40106.586.01106.0097.5810.0997.00<0.001
HSI34.543.8234.5543.314.85742.1138.116.0737.94<0.001
Forns Index5.551.395.585.971.105.975.741.315.70.118
FIB-40.761.50.290.760.70.50.761.230.340.517
AST (UI/L)53.4437.9146.5063.4225.9562.0057.4933.8453.000.035
ALT (UI/L)65.6148.0553.5076.2538.5373.0069.9344.6058.000.074
GGT (UI/L)74.4562.7760.0077.8339.1676.0075.8254.3071.000.252
FPG (mg/dL)111.4638.0196.00107.4423.1398.00109.8332.7697.000.913
FPI (uUI/mL)12.6167.6411.10014.0367.0313.20013.197.4111.900.05
HOMA-IR3.692.892.974.212.573.733.912.773.180.023
HbA1c (%)7.001.376.506.841.216.506.941.36.50.609
Adiponectin (ng/mL)5.332.005.343.512.003.304.592.194.30<0.001
Leptin (ng/mL)17.636.8816.8822.7913.2521.3019.7310.2618.400.001
Resistin (ng/mL)21.2012.7819.1024.5515.4621.6022.5713.9819.700.047
TNF-α (pg/mL)15.195.7415.0216.936.7515.2715.906.2115.240.041
IL-6 (pg/mL)17.349.3715.8418.647.6017.5017.878.7016.200.197
Cholesterol (mg/dL)205.0247.37196.50218.3249.87208.00210.4348.69199.000.189
Triglyceride (mg/dL)148.9457.78154.00197.7784.30182.00168.7973.58163.00<0.001
HDL-C (mg/dL)41.98010.9138.00036.936.9236.00039.939.7937.700.001
Abbreviations: 1 between groups; p-p value; SD—standard deviation, ALT, alanine aminotransferase; AST, aspartate aminotransferase; BMI, body mass index; FPG, fasting plasma glucose; FPI, fasting plasma insulin; GGT, gamma-glutamyl transpeptidase; HipC, hipcircumference; HDL-C, high-densitylipoproteincholesterol; HSI, hepatic steatosis index; HOMA-IR, homeostasis model assessment of insulinresistance; IL-6, interleukin 6;TNF-α, tumor necrosis factor-alpha; WC, waist circumference.
Table 4. Receiver operating characteristic (ROC) curve metrics forpotential markers of HS.
Test Result VariablesAUROCStd. Errorp95%CI
Lower BoundUpper Bound
Age (years)0.6800.0500.0030.5830.777
Log HOMA-IR0.7290.043<0.0010.6450.812
WC (cm)0.7860.044<0.0010.6990.872
BMI (kg/mp)0.7650.046<0.0010.6750.854
Log Adiponectin0.3140.0550.0020.2070.421
Log Leptin0.6000.0550.0950.4920.707
Log TNFalfa0.5490.0550.4140.4420.656
Log IL-60.5720.0500.2290.4740.670
Log resistin0.5830.0570.1630.4710.695
Log FPI0.7190.046<0.0010.6290.808
Triglyceride (mg/dL)0.7140.049<0.0010.6190.809
Abbreviations: AUROC, areas under the receiver operating characteristic; BMI, body mass index; FPI, fasting plasma insulin; HOMA-IR, homeostasis model assessment of insulinresistance; IL-6, interleukin 6; TNF-α, tumor necrosis factor-alpha; WC, waist circumference.
Table 5. Spearman correlations between HS, HSI, and anthropometric and metabolic variables.
HSHIS
HSI0.473 **1
Gender0.1270.016
Age0.278 **0.237 **
WC0.453 **0.800 **
BMI0.432 **0.913 **
WHR0.31 **0.513 **
HOMA-IR #0.337 **0.464 **
FPI #0.284 **0.278 **
FPG #0.177 *0.336 **
HbA1c0.0920.276 **
Adiponectin #−0.181 *−0.438 **
Leptin #0.1050.243 **
TNF-α #0.040.187 *
IL-6 #0.1130.265 **
Resistin #0.0990.211 **
Triglyceride0.233 **0.379 **
HDL-C−0.215 **−0.355 **
AST0.301 **0.412 **
ALT0.176 *0.255 **
GGT0.175 *0.330 **
* Correlation is significant at the 0.05 level (2-tailed). ** Correlation is significant at the 0.01 level (2-tailed). # logarithmic transformation was performed before analysis. Abbreviations: AST, aspartate aminotransferase; ALT, alanine aminotransferase; BMI, body mass index; FPI, fasting plasma insulin; FPG, fasting plasma glucose; GGT, gamma-glutamyltranspeptidase; HS, hepatic steatosis; HSI, hepatic steatosis index; HDL-C, high-density lipoproteincholesterol; HOMA-IR, homeostasis model assessment of insulinresistance; IL-6, interleukin 6; TNF-α, tumor necrosis factor-alpha; WC, waist circumference; WHR, waist-to-hip ratio.
Table 6. Comparison of multivariable logistic regression models, including WHR (Model 1) and waist circumference (Model 2) as anthropometric predictors of hepatic steatosis.
Model 1
(Adjusted for WHR)
Model 2
(Adjusted for WC)
VariablesOR (95% CI)p *OR (95% CI)p **
Age > 52.8 years4.941 (1.94–12.54)<0.0013.93 (1.51–10.27)0.005
Smoking3.379 (1.28–8.85)0.0132.76 (1–7.58)0.049
Adiponectin < 7.2 ng/mL †3.258 (1.21–8.73)0.0193.10 (1.15–8.36)0.026
HOMA-IR > 2.85 †3.482 (1.38–8.74)0.008-
WC (cm)--5.15 (2–13.33)<0.001
p *, p-value for model 1; p **, p-value for model 2; † these variables were log-transformed before analysis. Abbreviations: HOMA-IR, homeostasis model assessment of insulinresistance; WHR, WC, waist circumference.
Disclaimer/Publisher’s Note: The statements, opinions and data contained in all publications are solely those of the individual author(s) and contributor(s) and not of MDPI and/or the editor(s). MDPI and/or the editor(s) disclaim responsibility for any injury to people or property resulting from any ideas, methods, instructions or products referred to in the content.

