1. Introduction
Recent advances in optics using adaptive optics, interference and tomography have significantly enhanced our ability to produce high-resolution images of the retina. These technological innovations have revolutionized retinal imaging, allowing us to visualize multiple layers of the retina in remarkable detail. This noninvasive imaging technique can be repeated with precise alignment using key anatomical landmarks, enabling consistent monitoring of specific retinal features over time. The ability to generate a series of images over a period of time is particularly beneficial for ongoing observation and analysis of retinal conditions [
1,
2].
Recent estimates from the International Diabetes Federation (IDF, 2025) indicate that approximately 589 million adults aged 20–79 years, representing 11.1% of this age group, are currently living with diabetes [
3]. This number is projected to increase to 852.5 million by 2050, driven largely by population aging and urbanization, particularly in low- and middle-income countries, which are expected to account for 95% of this increase. These projections underline the need for improved screening and management of diabetic complications, including diabetic retinopathy (DR), a complication affecting one-third of individuals with diabetes. It is the leading cause of vision loss among the working-age population in developed nations and continues to be a major cause of preventable blindness [
4].
The retina requires significant metabolic and oxygen resources, making it susceptible to sight-threatening microvascular complications associated with diabetes. The most significant damage in background diabetic retinopathy is the gradual loss of retinal microvessels, resulting in ischemia and the uncontrolled growth of new blood vessels, which can threaten the vision. The central macular area is particularly vulnerable. This region, which contains the highest density of cone photoreceptor cells and enables high-resolution visual acuity, lacks retinal capillaries entirely. It is encircled by a network of interconnected capillaries, making it visually distinguishable due to the contrast between areas with and without blood vessels [
5,
6,
7,
8].
C-reactive protein (CRP) is implicated in endothelial dysfunction and angiogenesis. These processes have been suggested as significant contributors to the development of DR. It is widely recognized that CRP serves as a reliable predictor of future cardiovascular issues. However, its connection with diabetes-related microvascular complications is less clear. Some studies, particularly prospective ones, have indicated an association between circulating CRP levels and diabetic nephropathy, as well as DR over the past decade. This raises the possibility that elevated CRP levels may represent an early occurrence or even a driving factor in the emergence of microvascular complications in diabetes, although further research is needed to fully understand this relationship [
9,
10].
The objective of this study was to explore the potential interconnections between serum CRP levels and foveal avascular zone (FAZ) parameters in diabetic patients compared to age-matched healthy controls. Utilizing the Angiography software (version 7.0.7) of the Swept Source-Optical Coherence Tomography (SS-OCT) we compared retinal characteristics among these groups. Our study aims to explore the link between systemic inflammation and early diabetic retinopathy, focusing on its effect on retinal vascular health.
2. Materials and Methods
This cross-sectional study involved patients with Type 2 diabetes mellitus and age-matched controls from the Diabetes and Ophthalmology Department of the Emergency Military Clinical Hospital “Dr. Constantin Papilian” Cluj-Napoca between October 2023 and October 2024. These patients were assessed for inclusion and exclusion criteria and then categorized into two groups: the diabetes group and control group. Furthermore, the diabetic group was stratified into two subgroups based on the presence or absence of diabetic retinopathy, to assess potential differences in FAZ and CRP values.
Each participant underwent a comprehensive ophthalmological examination and retinal evaluation using SS-OCT (Spectralis Heidelberg Engineering, Heidelberg, Germany). A quantitative serum CRP measurement was obtained from each patient. CRP measurement was performed using the turbidimetric method, with the unit of measurement expressed in mg/L, and a reference range of below 5 mg/L. The parameters measured included superficial and deep FAZ. Data on non-diabetic factors, such as body mass index (BMI) and blood pressure, were collected for all patients.
Each patient was informed about the procedure. Refractive errors were corrected and for cases with dry eye syndrome we utilized ocular lubricants to ensure optimal image quality. OCT-A acquisition protocol consisted in using the high-resolution protocol, with a 10 × 10 pattern size, a total of 512 B-scans and a distance between B-scans of 6 µm; 4 images were averaged using the ART (Automatic Real-Time). For each patient, the superficial and deep FAZ areas were measured in only one eye, selected based on image quality. Although the study was not blinded, eye selection was based on predefined objective image quality criteria (signal strength and clarity of vascular borders) and FAZ measurements were performed only after the eye was selected, in order to minimize potential selection bias. A manual assessment of both the deep and superficial FAZ area was performed by two examiners and the mean value was selected.
Inclusion criteria for the diabetes group consisted of adult patients diagnosed with type 2 diabetes mellitus based on at least two consecutive fasting plasma glucose values ≥ 126 mg/dL, normal intraocular pressure, absence of any retinal pathology other than diabetic retinopathy and the ability to undergo a comprehensive OCT examination. Control subjects were age-matched individuals without a history of diabetes, systemic inflammatory diseases or other significant chronic illnesses. Systemic comorbidities (such as hypertension, dyslipidemia and cardiovascular disease) were documented but not used as exclusion criteria unless they were uncontrolled or associated with retinal or neurological complications. Exclusion criteria for both groups included a history of glaucoma or intraocular pressure >21 mmHg, high refractive errors (spherical equivalent > ±6D), ocular inflammation, significant media opacities (e.g., dense cataract) or poor OCT image quality. Additionally, patients with neurodegenerative disorders (e.g., Alzheimer’s disease, Parkinson’s), a history of stroke or ambiguous diagnoses were excluded to eliminate confounding factors.
The study protocol received approval from the local ethics committee, informed consent was obtained from all participants, and all procedures were conducted in compliance with the revised Declaration of Helsinki (2008).
Statistical analysis was conducted using IBM SPSS Statistics 20 for Windows, IBM Corp., Armonk, NY, USA. Normality tests for the variables CRP, superficial and deep FAZ were conducted using the Shapiro–Wilk test. All p-values for the measured variables were greater than 0.05 (CRP: p = 0.058, superficial FAZ: p = 0.709, deep FAZ: p = 0.213), indicating that the data follows a normal distribution. Therefore, subsequent statistical analyses were performed using parametric tests. Group comparisons between controls, diabetic patients without retinopathy and diabetic patients with retinopathy were performed using independent samples t-tests for FAZ (superficial and deep) and CRP values. Pearson correlation analysis was performed to assess the relationships between CRP levels and the superficial and deep FAZ. A conventional significance level of p < 0.05 was adopted to determine the statistical significance of our results. The statistical power of the study was assessed using Cohen’s d effect size and a post hoc power analysis.
3. Results
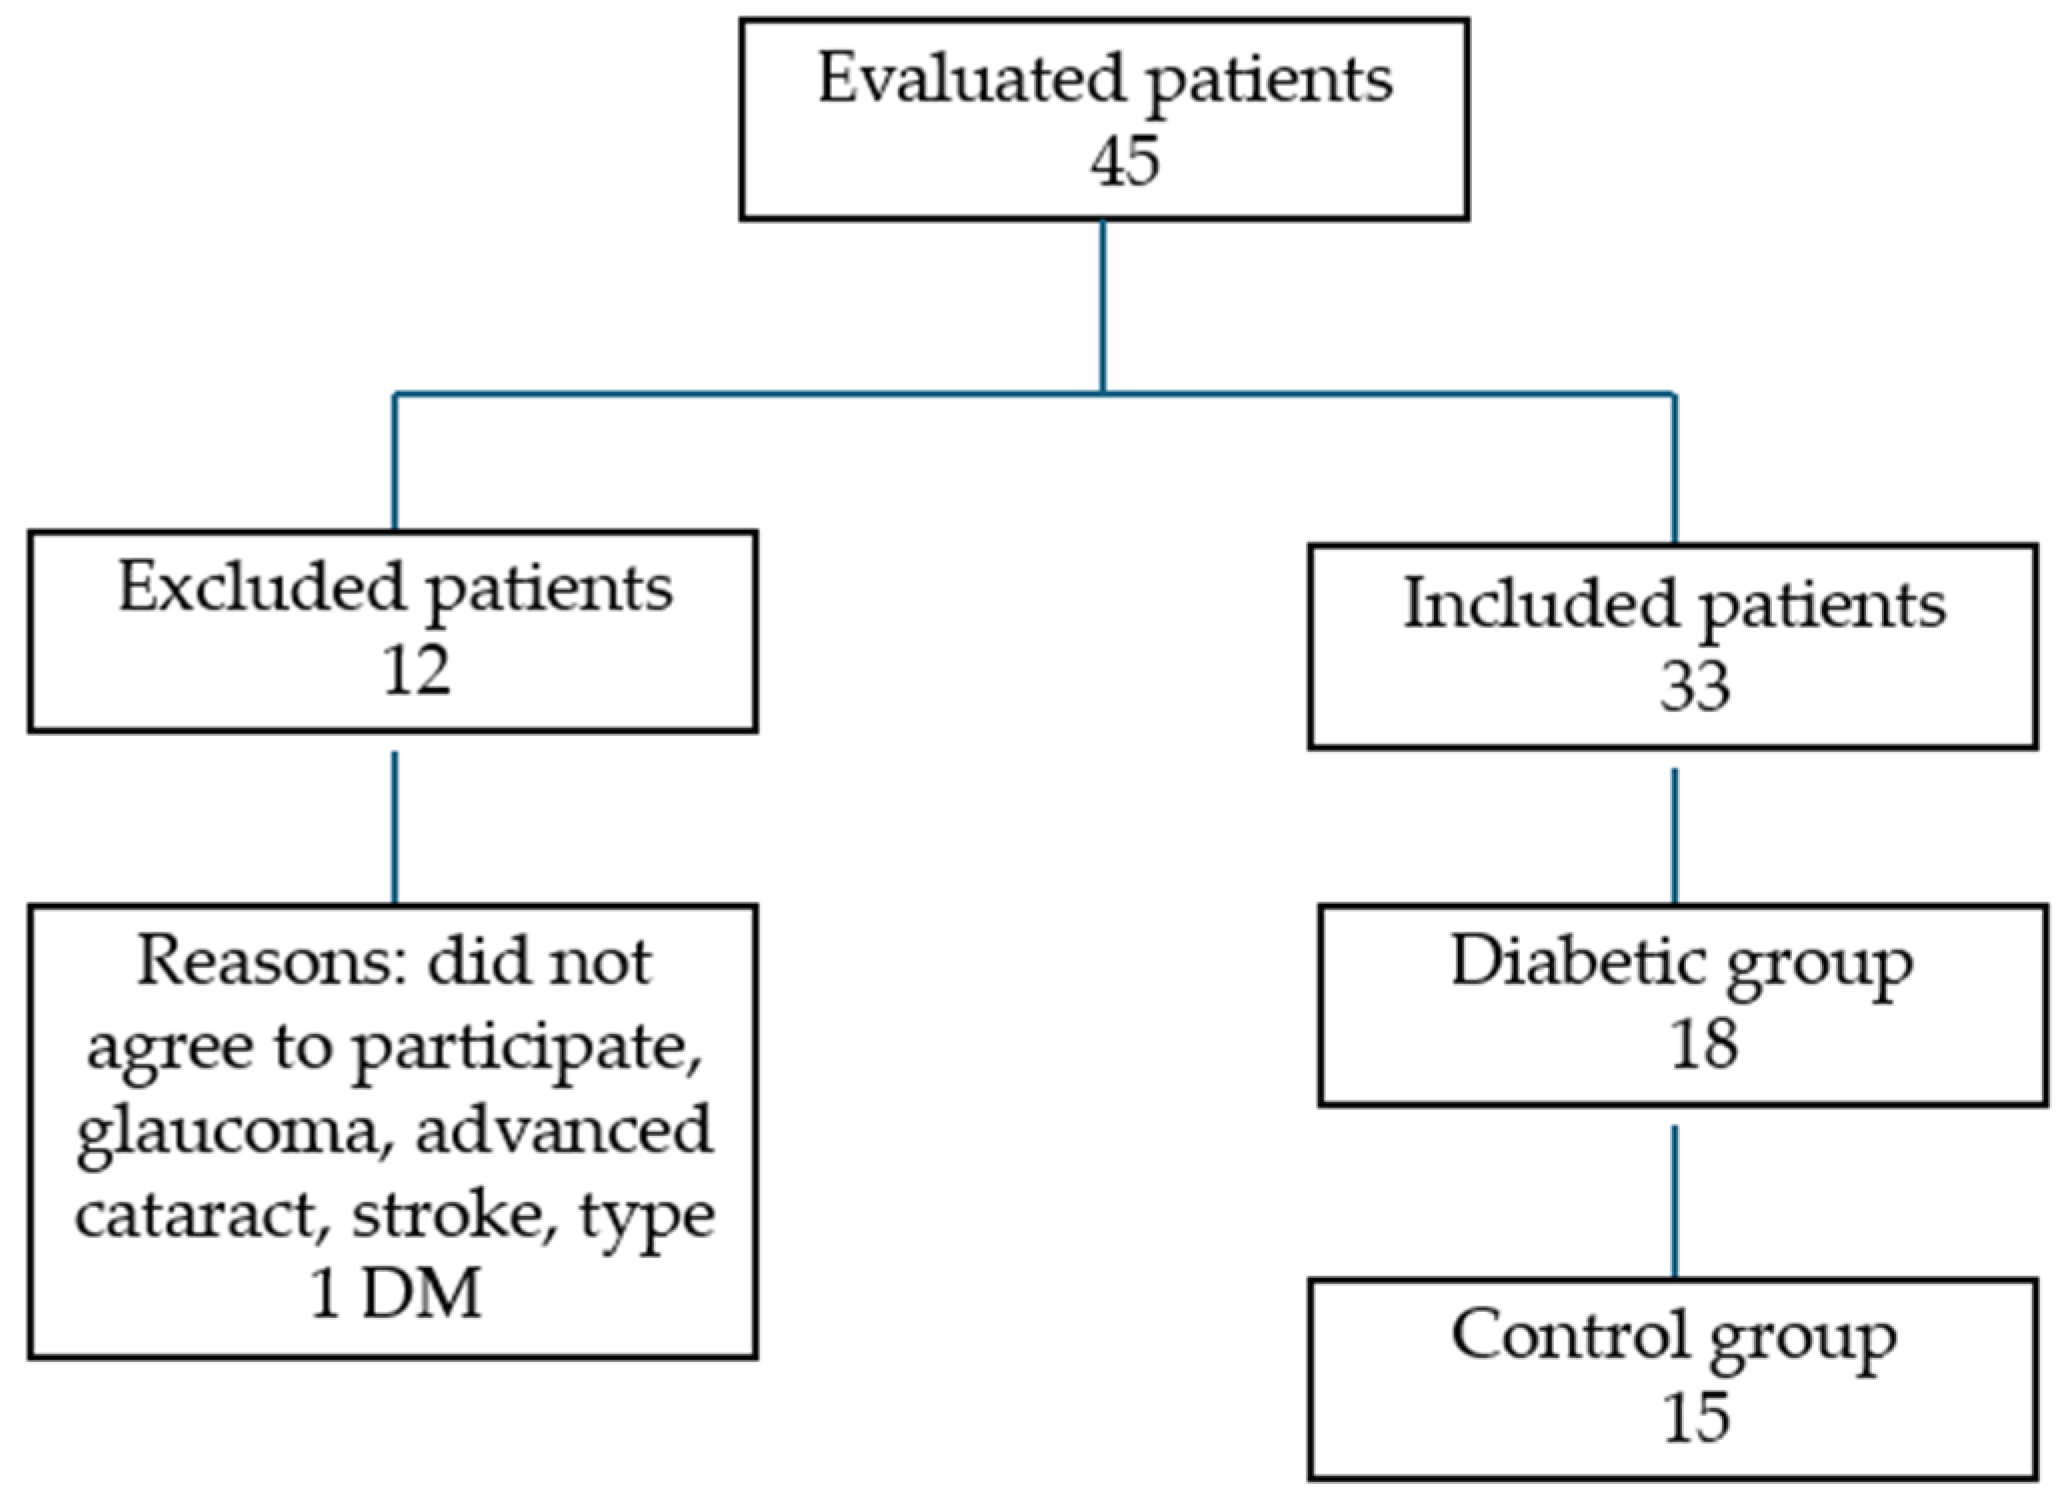
The study included 33 patients (33 eyes): 13 men and 20 women (
Figure 1). The diabetes mellitus (DM) group comprised 18 patients (18 eyes), 8 men and 10 women, with a mean age of 69.6 years. The age range varied from 61 to 79 years and the standard deviation was 5.16 years. Regarding the stage of the DR, four had mild non-proliferative DR, one had moderate non-proliferative DR, one had severe non-proliferative DR, one had proliferative DR and 11 had diabetes without DR. The mean HbA1c value was 7.05% (SD ± 0.85). The duration of diabetes ranged from 2 to 19 years, with a mean duration of 9 years. Regarding treatment, four patients were receiving a combination of insulin and oral antidiabetic drugs (OADs), while the remaining 14 were treated with OADs alone. Seven participants had associated microvascular complications, such as diabetic nephropathy or neuropathy.
In the healthy control group, we included 15 patients (15 eyes), 5 men and 10 women with a mean age of 67.5 years. The age range varied from 60 to 79 years and the standard deviation was 5.72 years.
Regarding non-diabetic factors, the average BMI for the diabetic group was 29.5 (SD = 4.3) and 45% of these patients presented with hypertension (≥140/90 mmHg). In contrast, the non-diabetic group had a lower average BMI of 24.6 (SD = 3.2) and all participants had normal blood pressure (≤120/80 mmHg).
The DM group showed statistically significant higher results for CRP value compared to healthy subjects (p < 0.001). The mean CRP for the DM group was 4.99 mg/L (SD = 6.5 mg/L, range = 0.22–17.58 mg/L) and 0.91 mg/L (SD = 1.13 mg/L, range = 0.22–2.71 mg/L) for the control group. The 95% confidence interval (CI) for the CRP value in the DM group was 0.22–12.25 mg/L, while for the control group, it was −0.50 to 2.32 mg/L.
Both superficial and deep FAZ areas were significantly larger in diabetic patients compared to controls (
p < 0.05), indicating vascular alterations associated with diabetes. The mean superficial FAZ value for the diabetes group was 0.37 mm
2 (SD = 0.17 mm
2, range = 0.20–0.53 mm
2) and 0.26 mm
2 (SD = 0.08 mm
2, range = 0.19–0.35 mm
2) for the deep FAZ. For the control group, the superficial FAZ was 0.21 mm
2 (SD = 0.07 mm
2, range = 0.20–0.32 mm
2) and deep FAZ was 0.18 mm
2 (SD = 0.06 mm
2, range = 0.14–0.16 mm
2). The 95% confidence interval (CI) for the superficial FAZ value in the DM group was 0.21–0.53 mm
2 and 0.12–0.32 mm
2 for the control group. For deep FAZ, the 95% CI in the DM group was 0.20–0.31 mm
2, while for the control group, it was 0.12–0.28 mm
2.
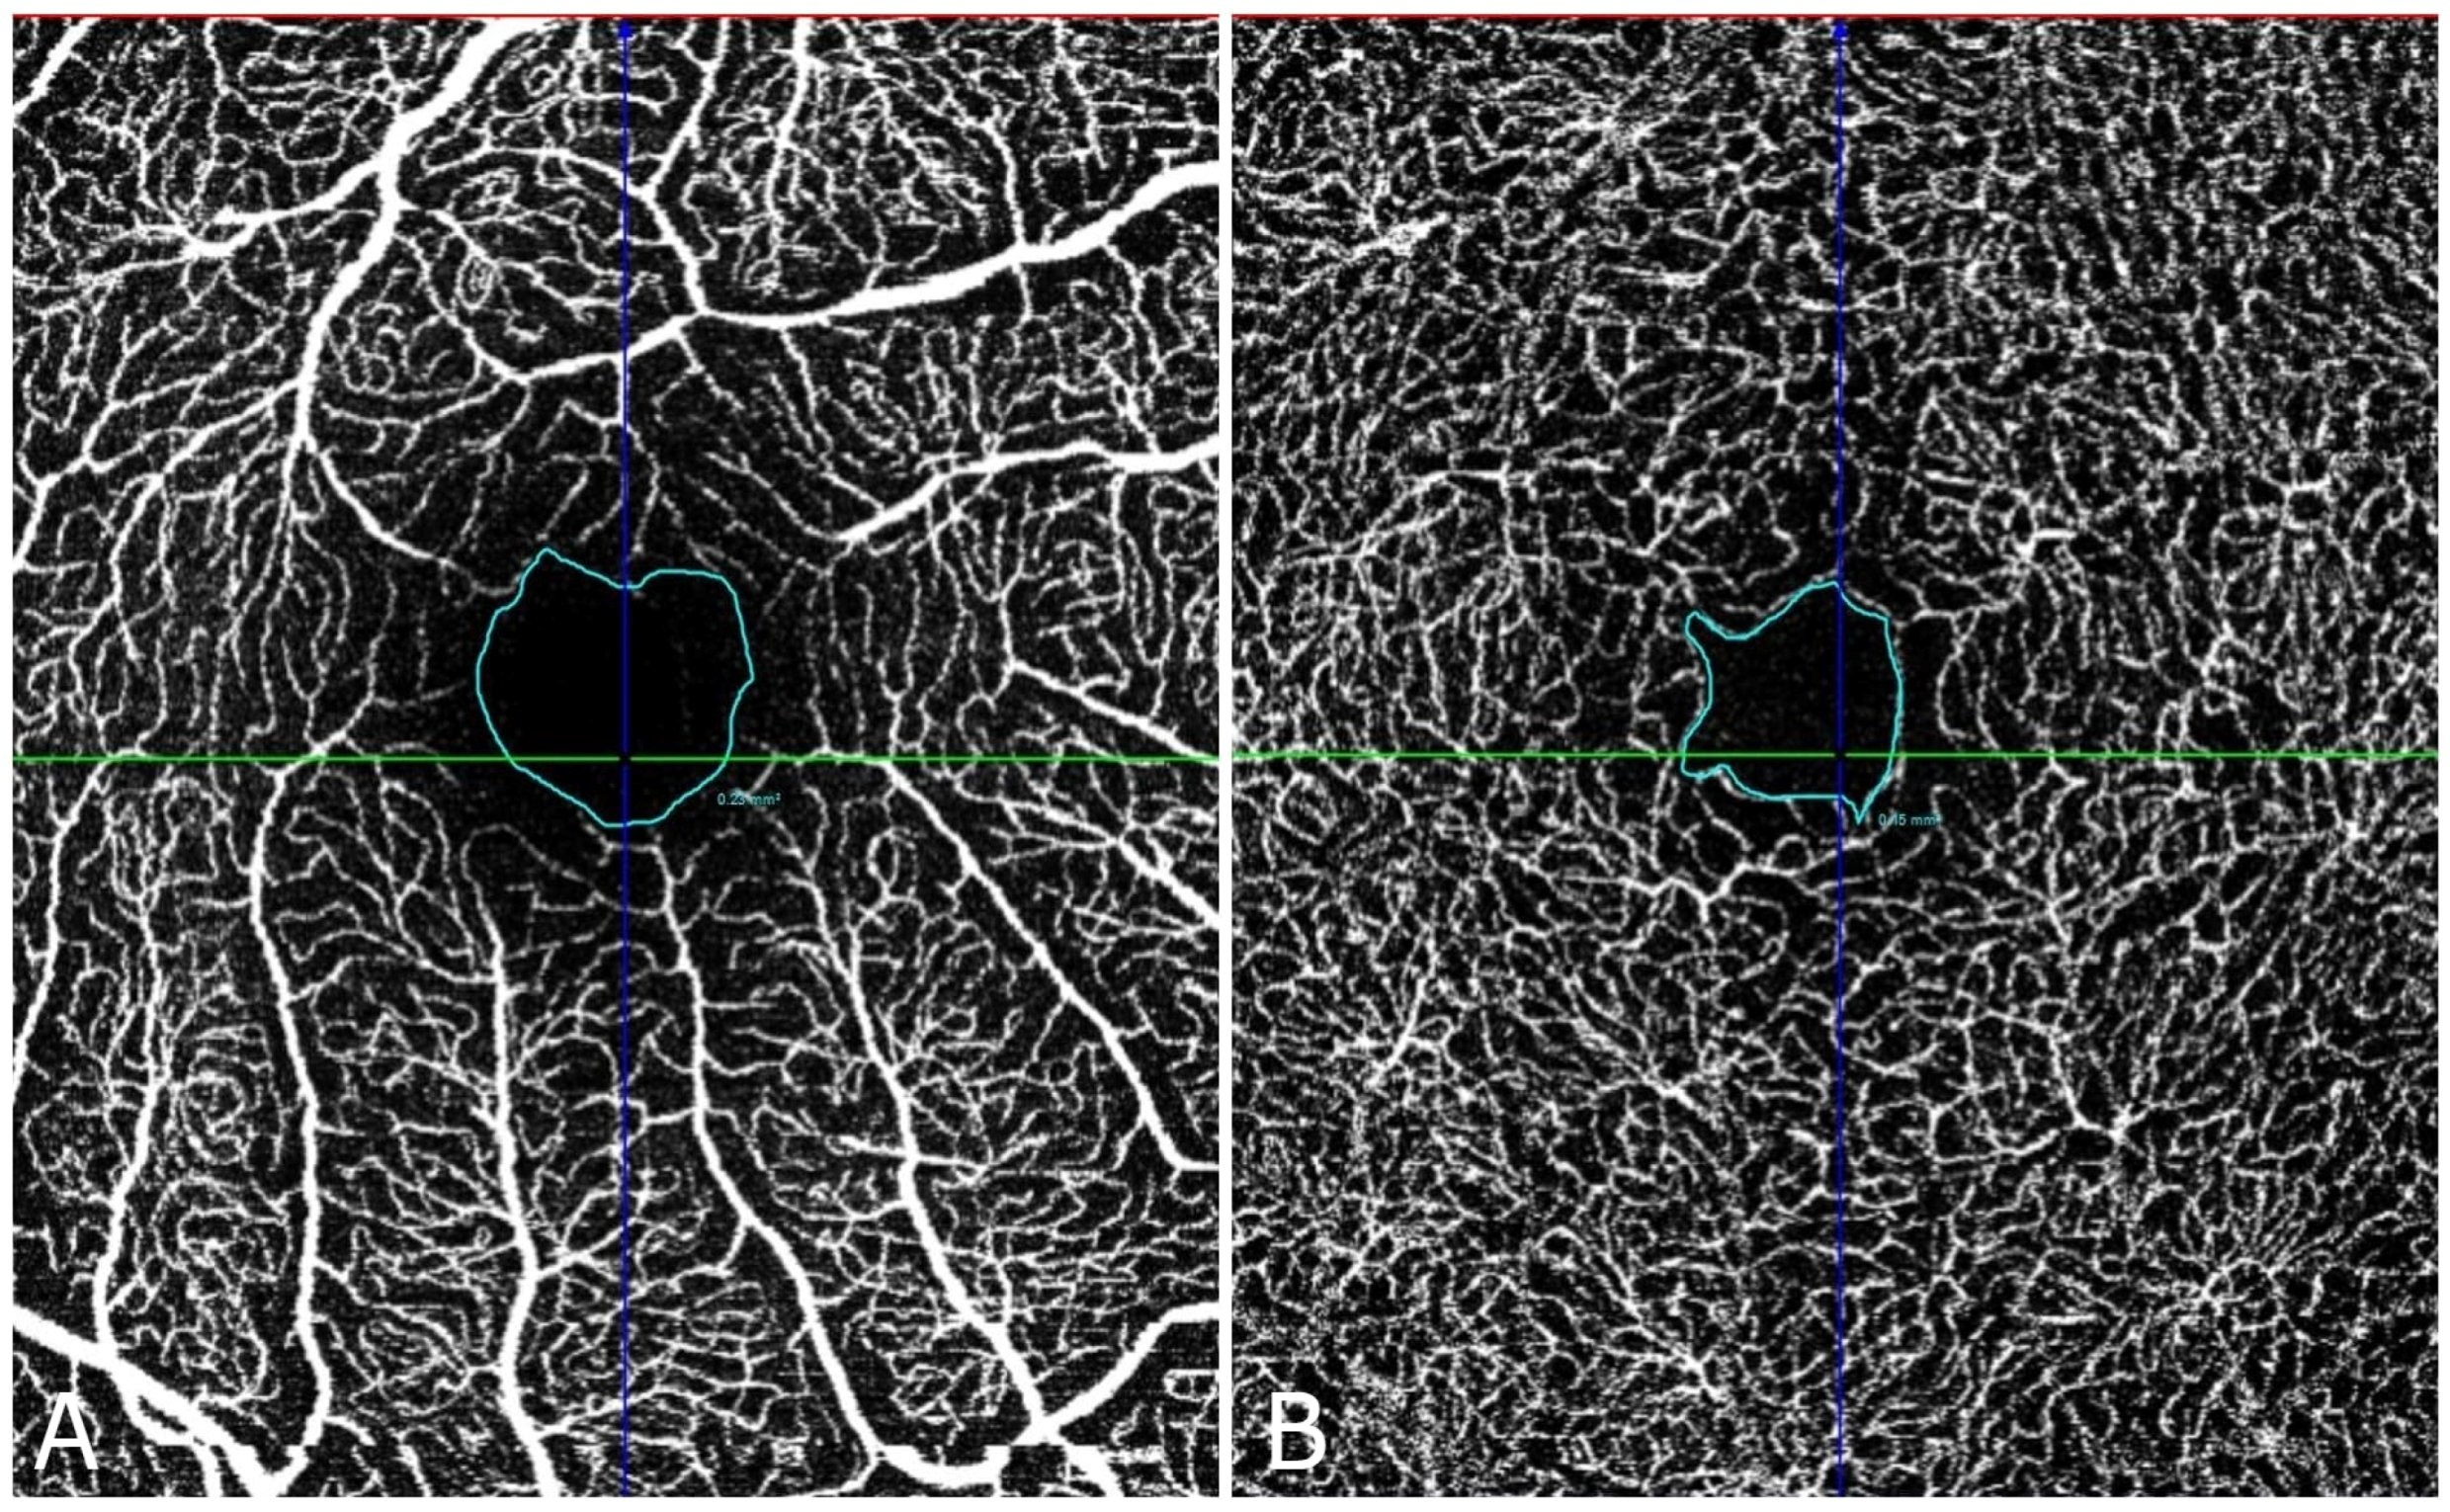
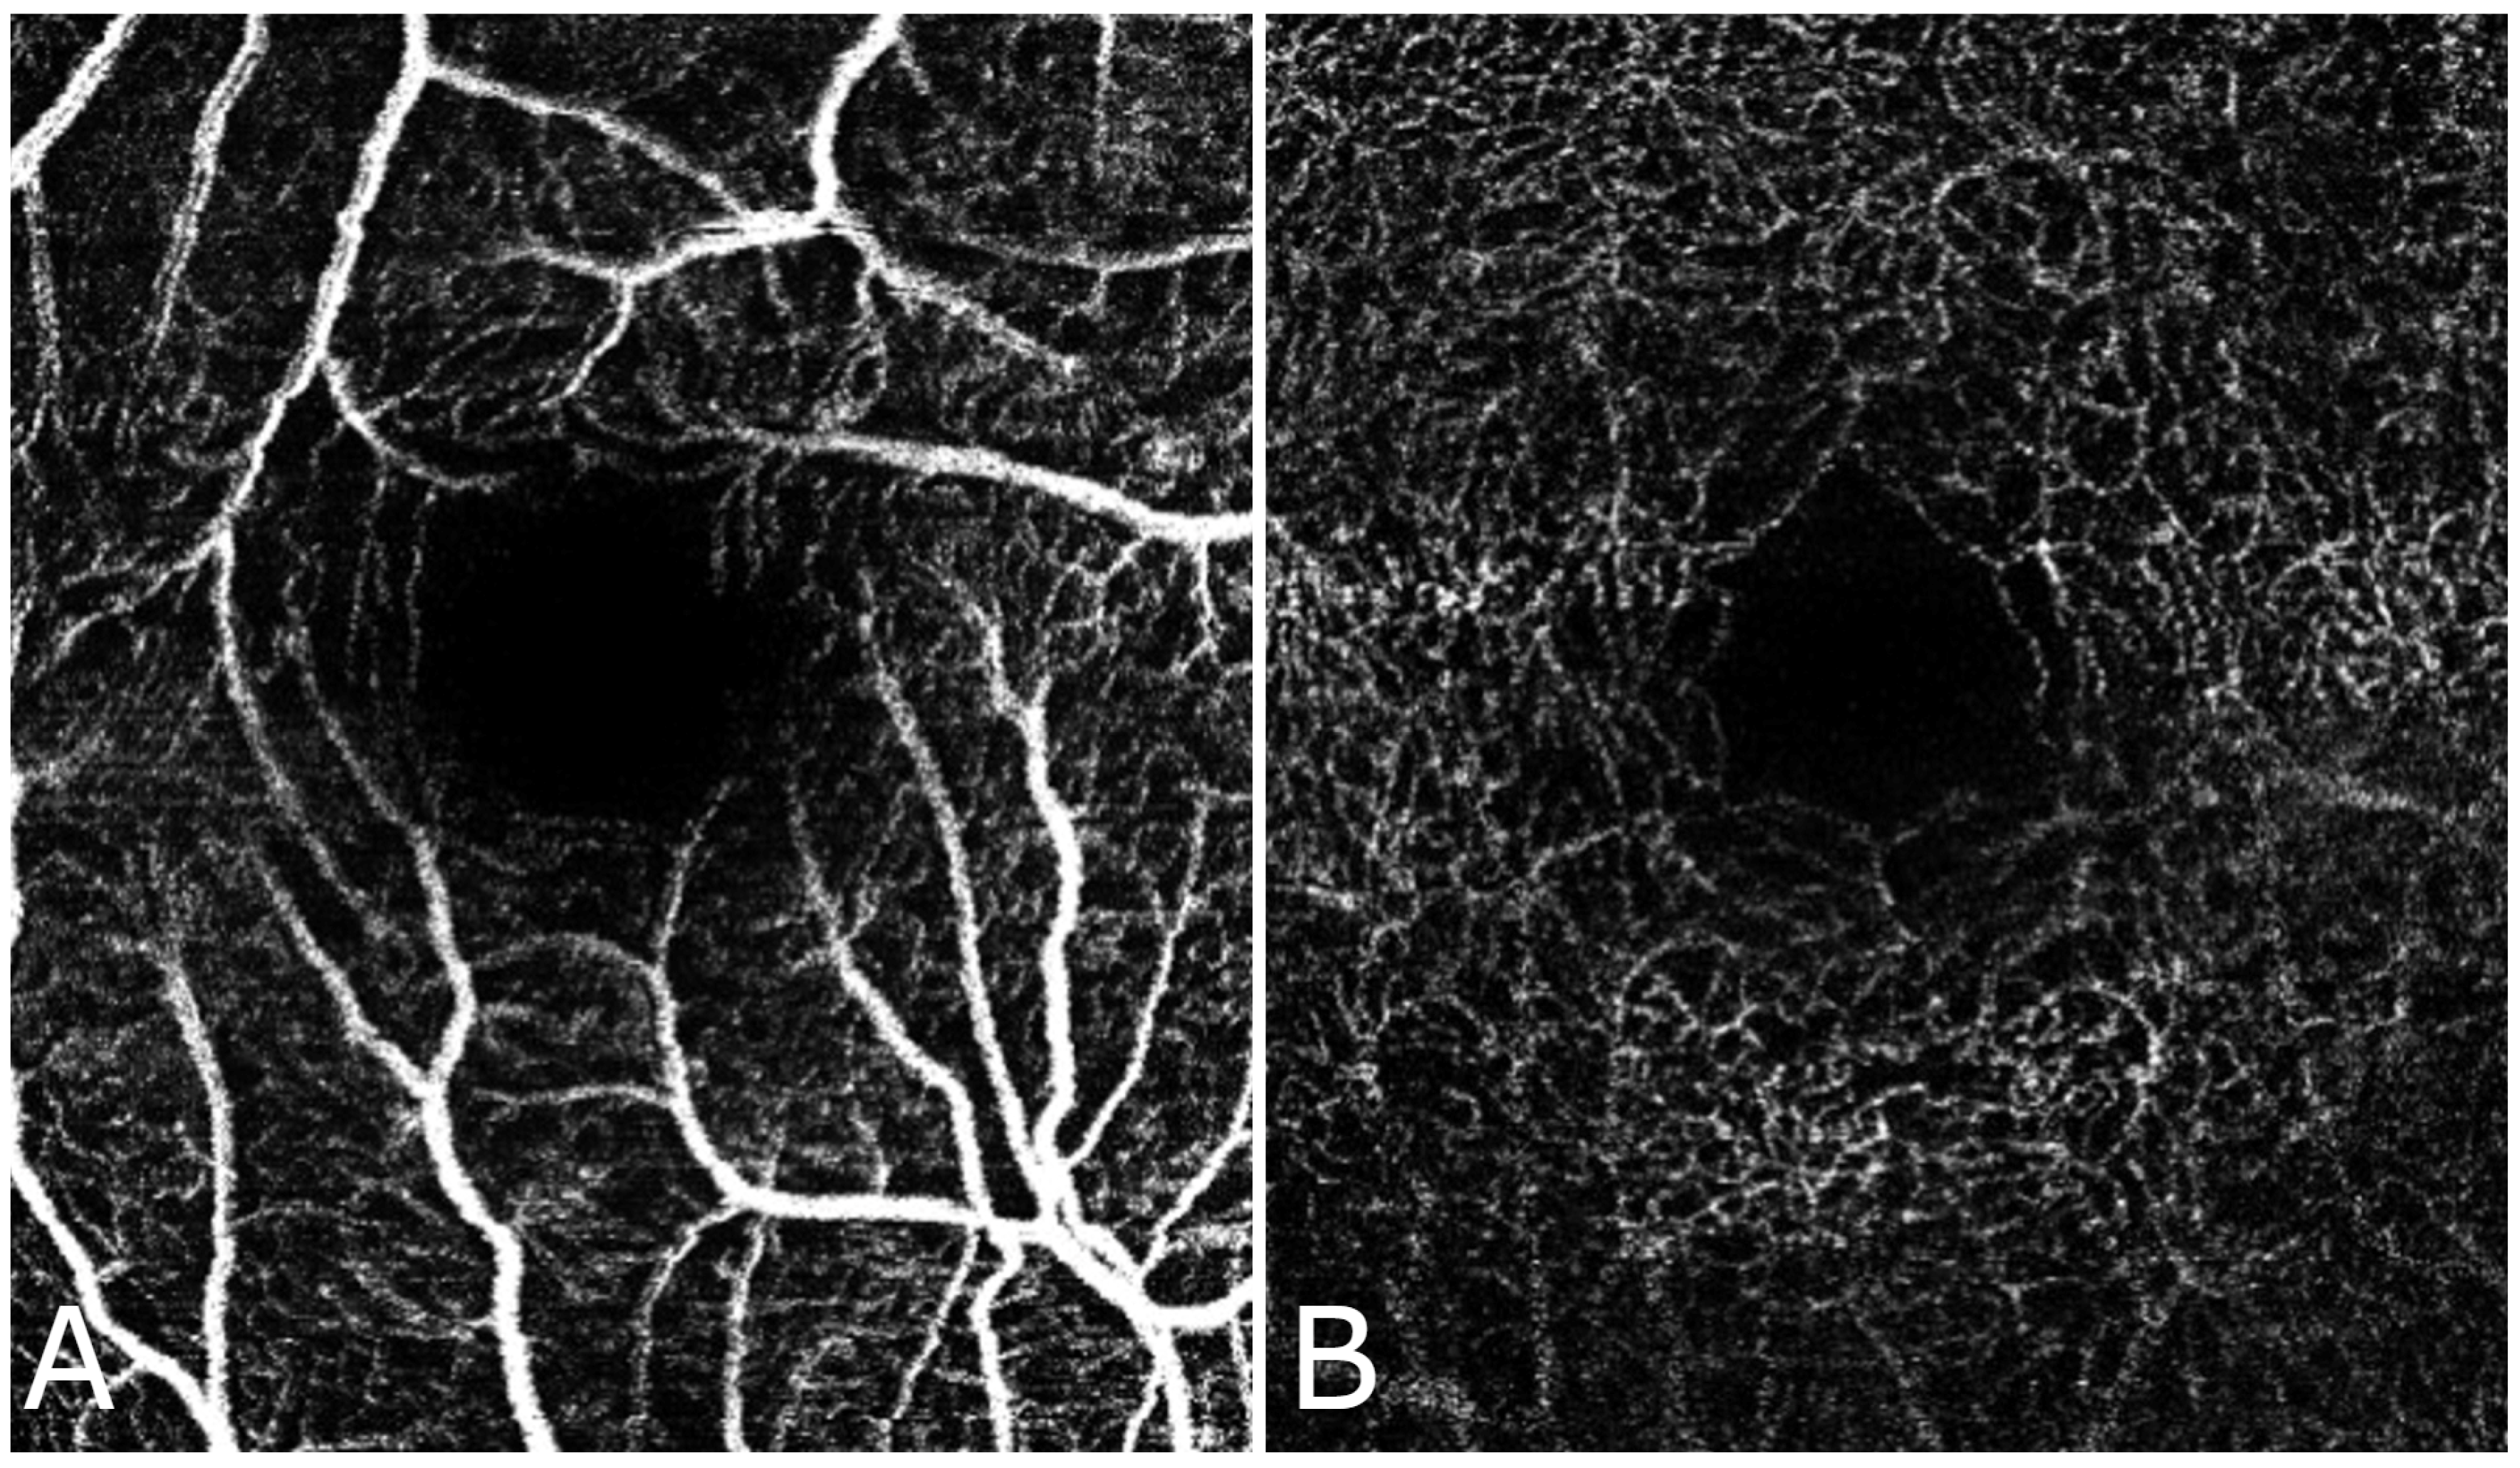
Figure 2 and
Figure 3 shows the FAZ in the control group (A) is smaller and well-defined, while in the diabetic group (B), the FAZ is larger and irregular, reflecting the vascular changes associated with diabetic retinopathy.
Table 1 presents the FAZ area measurements (in mm
2) for both superficial and deep capillaries in both groups.
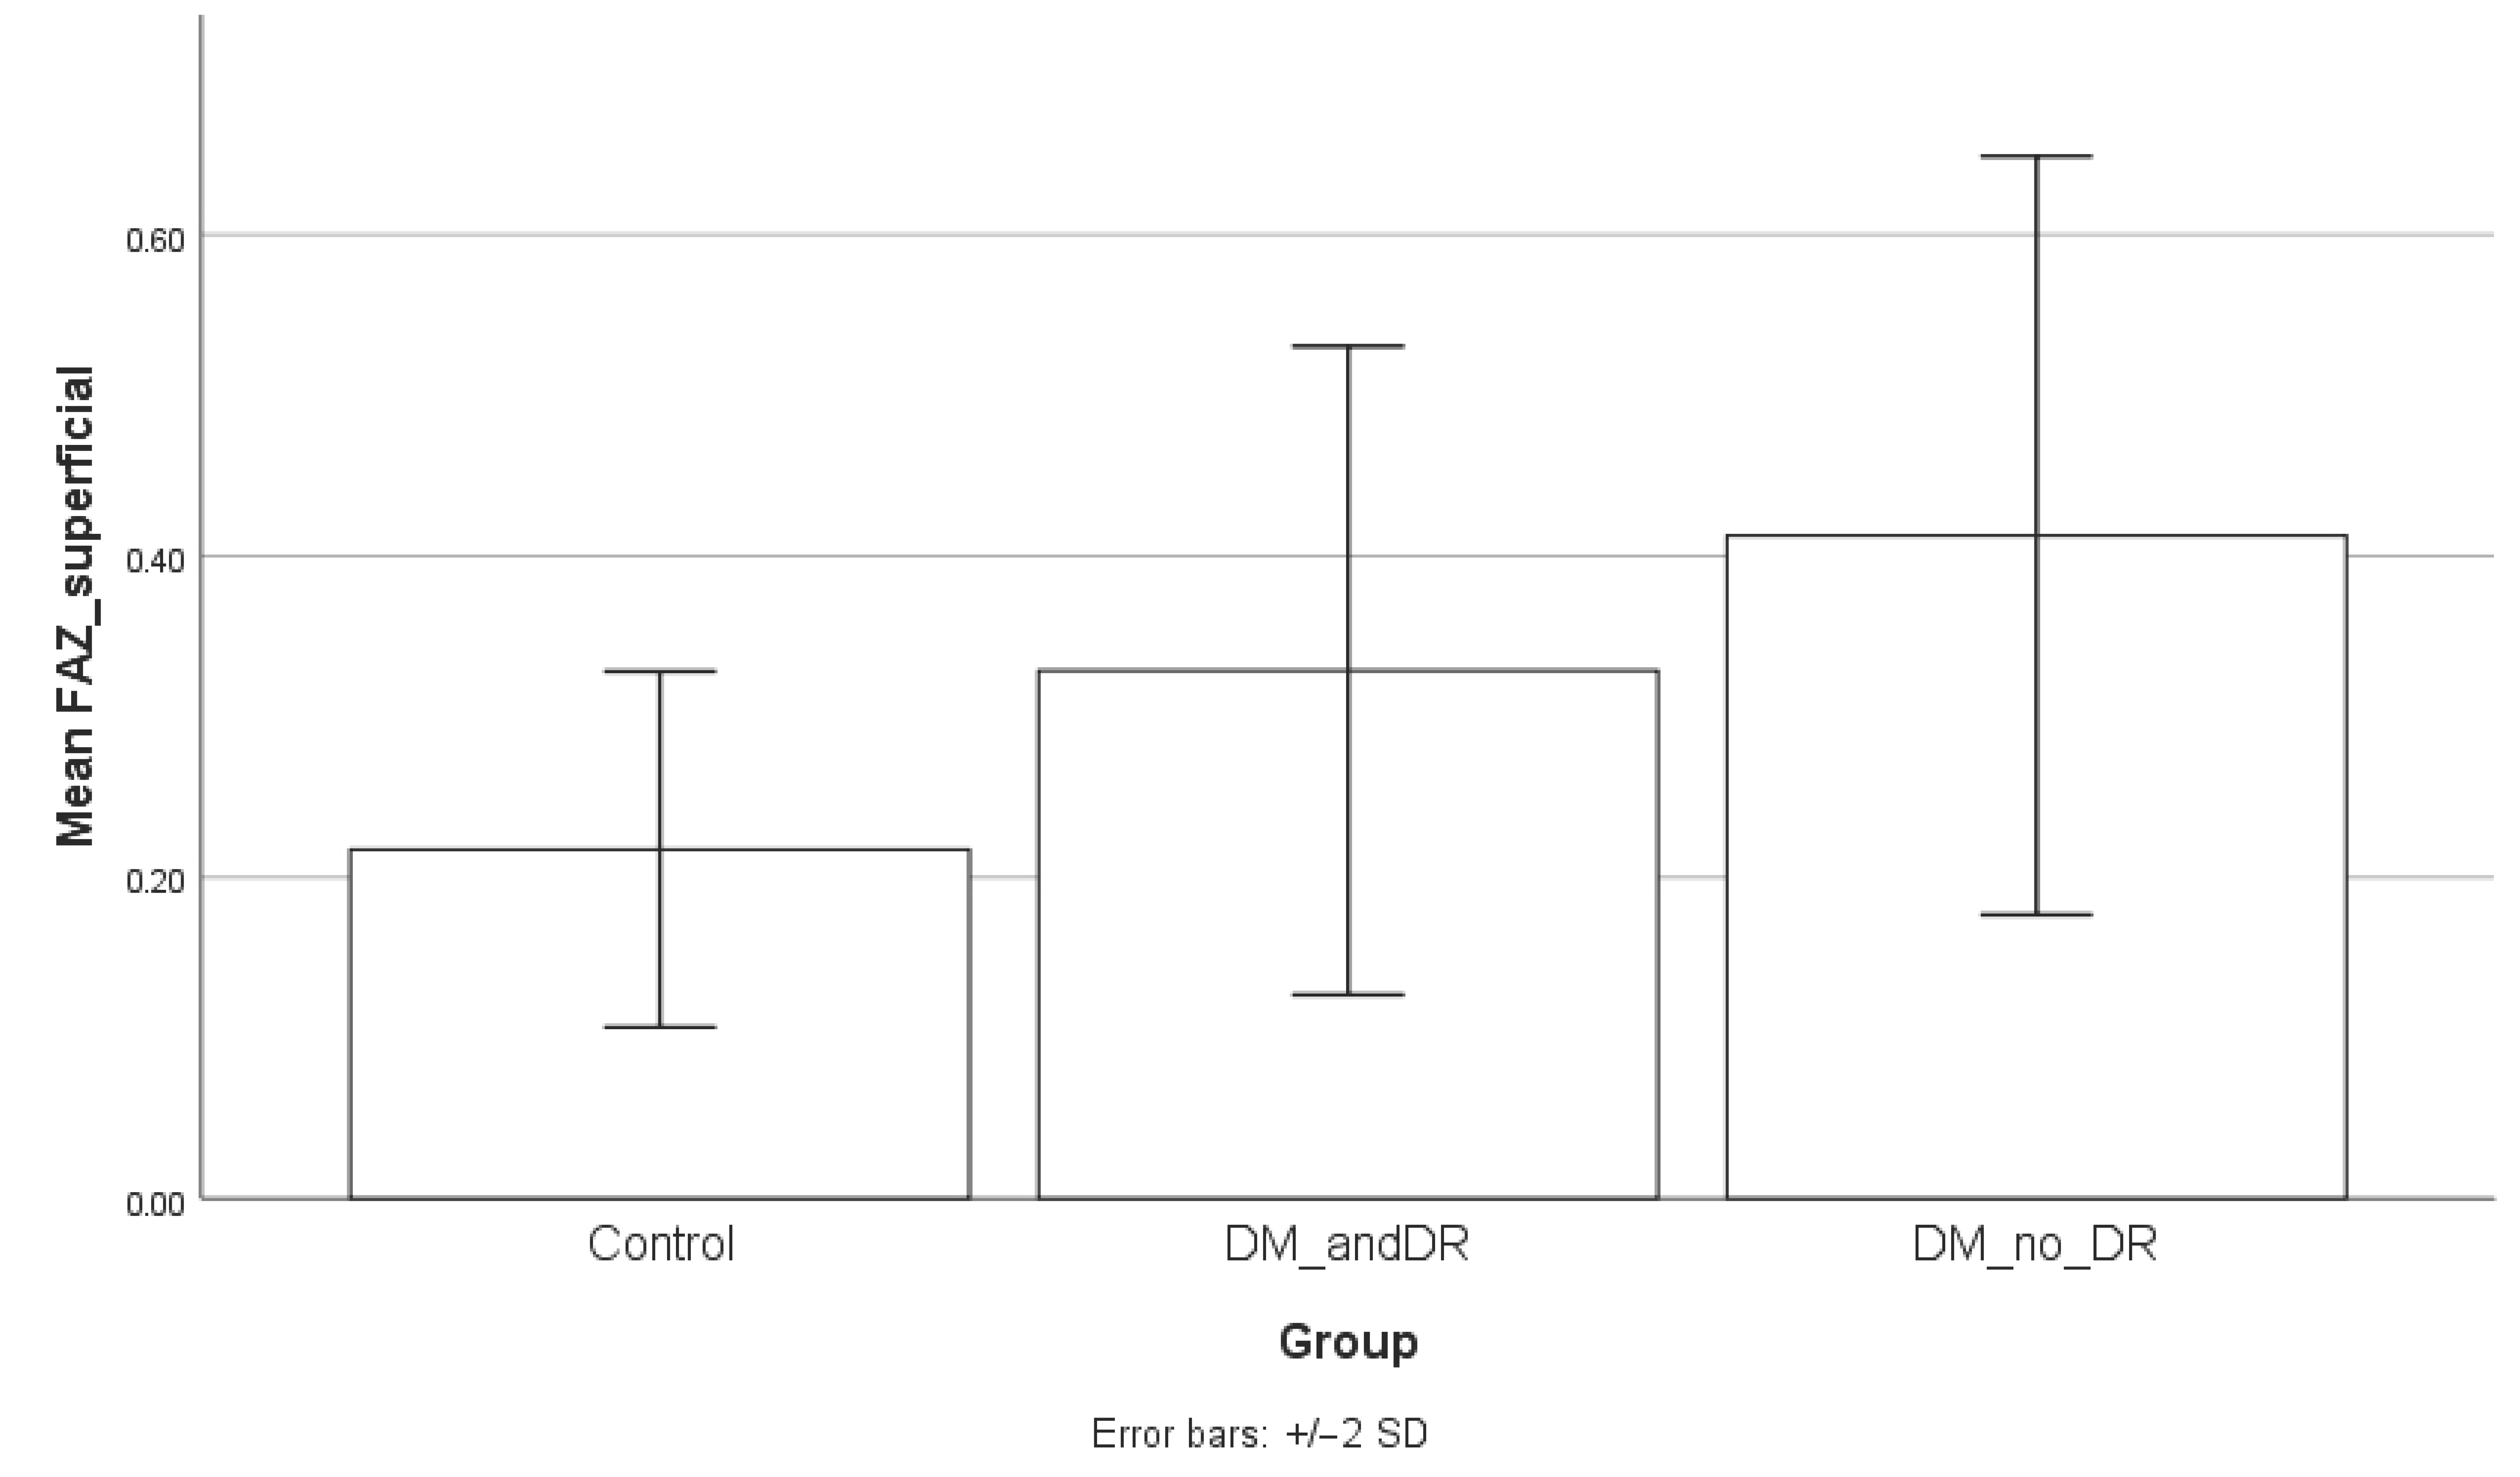
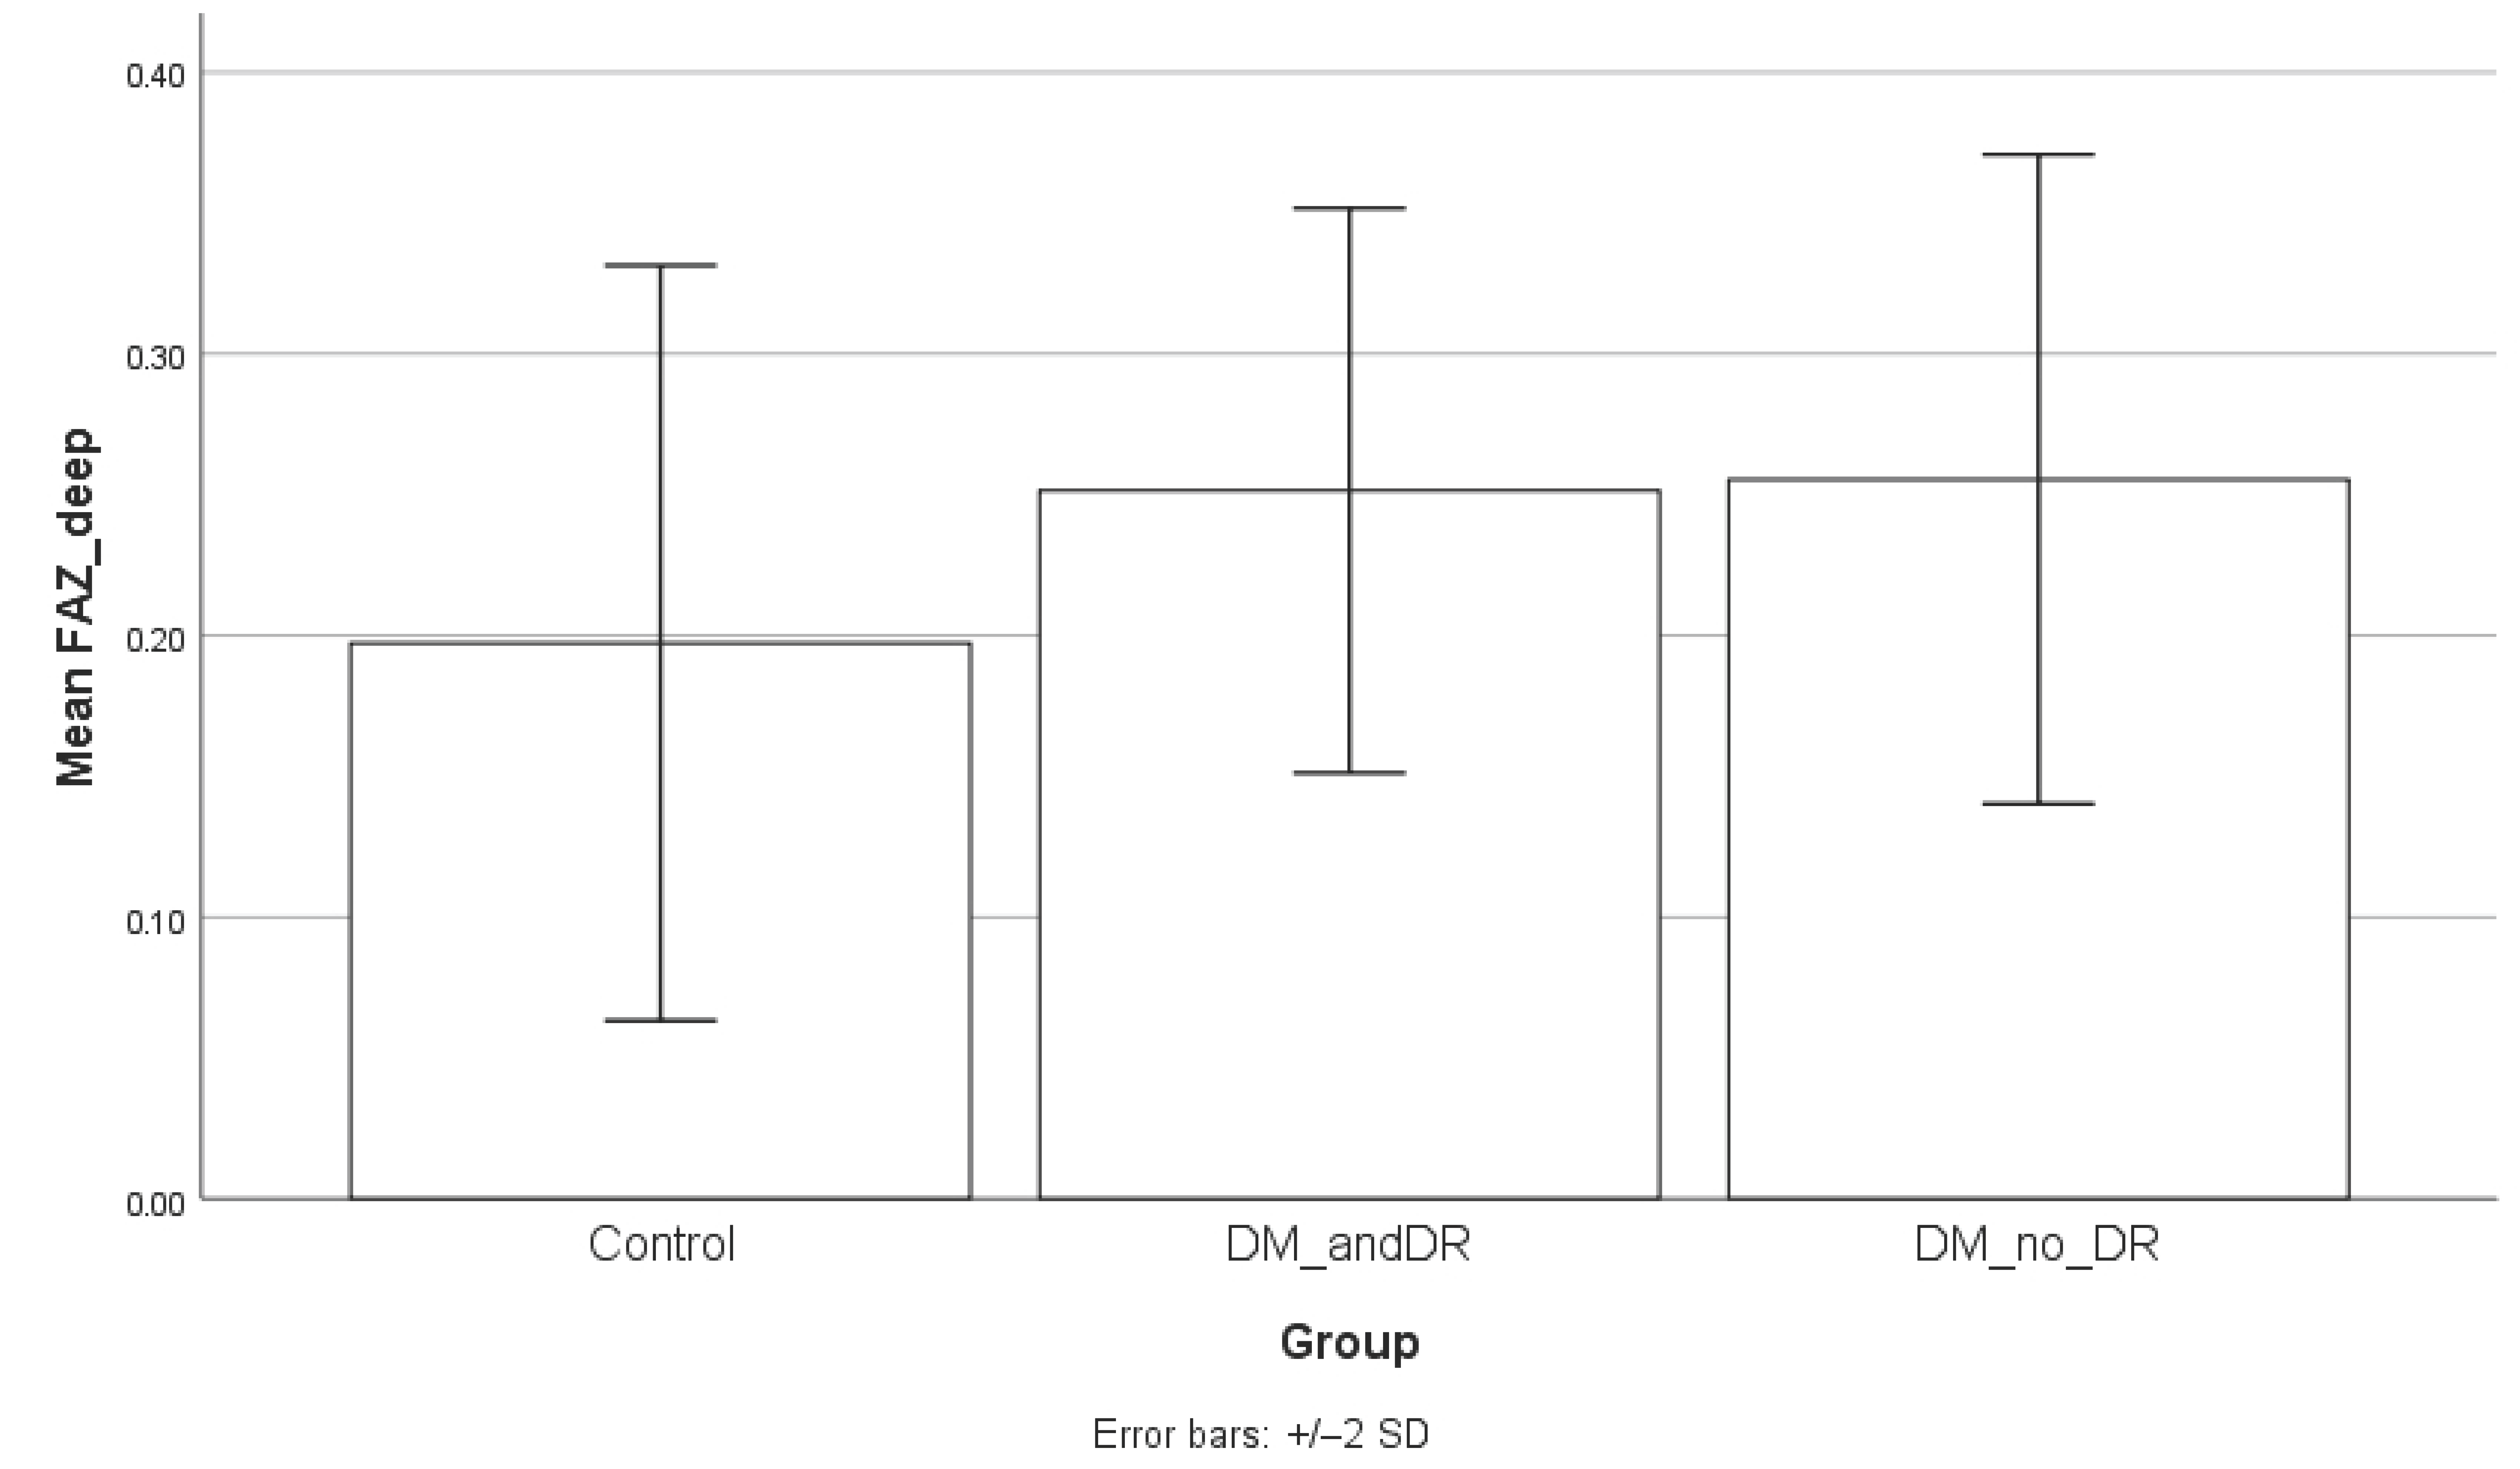
When comparing the FAZ area between groups, the superficial FAZ was significantly enlarged in diabetic patients without retinopathy compared to controls (mean ± SD: 0.39 ± 0.11 mm
2 vs. 0.22 ± 0.06 mm
2;
p = 0.0001). A statistically significant difference was also observed between controls and diabetic patients with retinopathy (
p = 0.0214). However, the comparison between diabetic patients with and without retinopathy did not reach statistical significance (
p = 0.1338). Regarding the deep FAZ, patients without diabetic retinopathy also demonstrated significantly larger values compared to controls (0.25 ± 0.05 mm
2 vs. 0.21 ± 0.06 mm
2;
p = 0.0213), while the difference between controls and patients with retinopathy approached but did not reach statistical significance (
p = 0.0851). No significant differences were observed between diabetic patients with and without retinopathy (
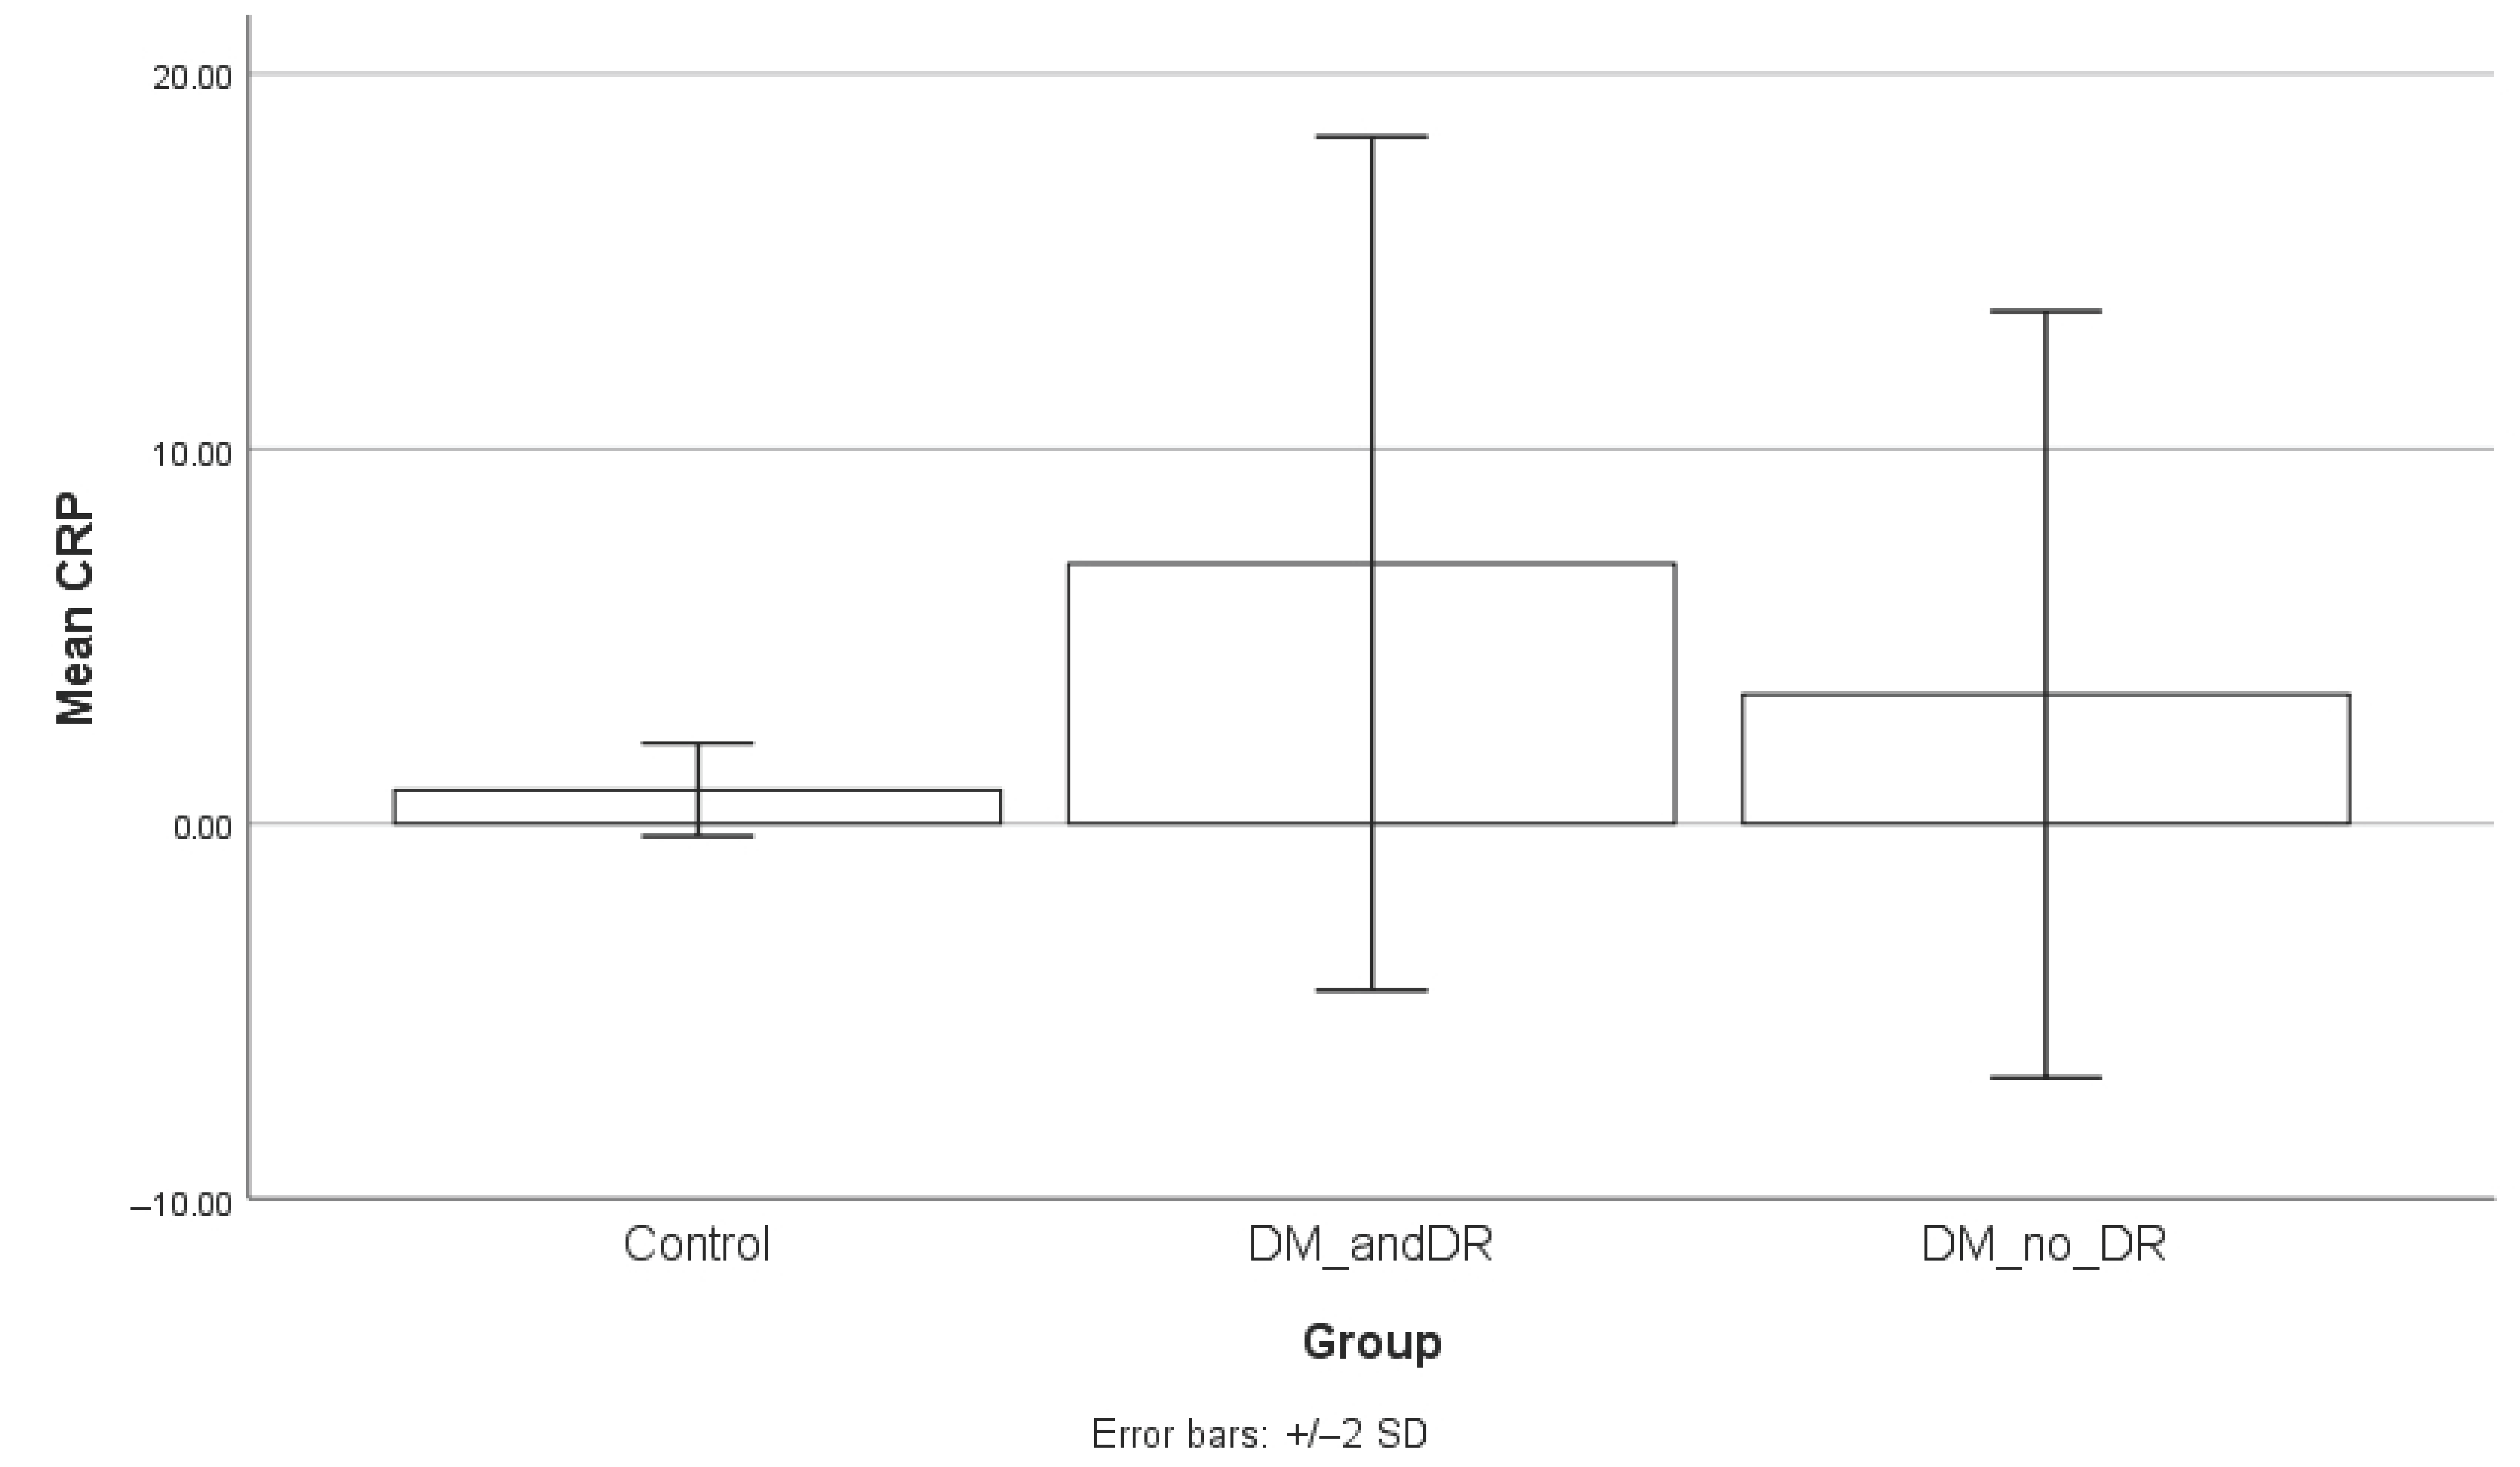
p = 0.7778). Serum CRP levels were significantly higher in the diabetic group compared to controls, both in patients without retinopathy (
p = 0.004) and those with retinopathy (
p = 0.0001). The difference between the diabetic subgroups, while numerically higher in those with retinopathy, did not reach statistical significance (
p = 0.1221). To facilitate interpretation, the results of the subgroup analysis are graphically presented in
Figure 4,
Figure 5 and
Figure 6.
The correlation analysis revealed that there was no significant correlation between CRP and either superficial FAZ (p = 0.809) or deep FAZ (p = 0.659). However, a significant positive moderate correlation was found between superficial FAZ and deep FAZ (r = 0.577, p = 0.015).
For CRP levels, the effect size was 0.87, yielding a statistical power of 0.71. For the superficial FAZ area, the effect size was 1.23, with a power of 0.999, while for the deep FAZ area, the effect size was 1.13, with a power of 0.995.
4. Discussion
Our study highlighted the connection between serum CRP levels and the FAZ in diabetic patients. CRP levels were significantly higher in diabetic patients compared to healthy controls (
p < 0.001), supporting the evidence that systemic inflammation plays an important role in diabetes and its vascular complications [
11,
12].
Subgroup analysis showed no significant differences in FAZ areas or CRP levels between diabetic patients with and without retinopathy. Both diabetic subgroups had significantly higher CRP levels and larger FAZ areas compared to controls. These findings highlight the presence of early microvascular alterations in diabetic patients, even in the absence of clinically detectable retinopathy. The significant enlargement of both superficial and deep FAZ areas in patients without retinopathy can serve as early biomarkers for subclinical microvascular damage. Interestingly, the lack of a statistically significant difference between diabetic patients with and without retinopathy may suggest that FAZ enlargement occurs early in the disease process. Elevated CRP across diabetic patients regardless of retinopathy status reflects a persistent systemic inflammatory state associated with diabetes. The small sample size may have limited detection of subtle differences between diabetic subgroups. Future studies with larger cohorts need to clarify these relationships and their clinical implications.
Although our findings revealed no significant correlation between CRP levels and FAZ area, we did observe that diabetic patients had significantly larger FAZ areas compared to healthy controls. This suggests that diabetes may lead to early changes in the retinal microvasculature, as evidenced by the enlarged FAZ, even in the absence of clinically detectable diabetic retinopathy. However, the lack of a significant correlation between CRP and FAZ may indicate that other factors, such as glycemic control, genetic predisposition and other inflammatory biomarkers, play a more important role in the development of retinal microvascular changes in diabetes. CRP is a systemic inflammatory marker and may not directly reflect localized microvascular changes in the retina. Second, the relatively small sample size might have limited the statistical power to detect subtle associations. Third, FAZ alterations could be influenced by multiple factors beyond systemic inflammation, such as local retinal metabolic changes or other microvascular mechanisms. A strong association has been observed between elevated HbA1c levels and the onset of microvascular damage. Within the retina, sustained high blood sugar and related processes like oxidative stress, inflammation and advanced glycation can lead to the degeneration of pericytes, which are critical for capillary function. Oxidative stress plays a key role by generating reactive oxygen species capable of damaging essential molecules including proteins and DNA. Additionally, metabolic disturbances like abnormal lipid profiles and systemic inflammation are recognized as contributing factors to microvascular alteration. The widely accepted view is that high blood glucose levels initiate the activation of cytokines such as Tumor Necrosis Factor-α (TNF-α) and vascular endothelial growth factor (VEGF), leading to the development of diabetic retinopathy. TNF-α, a proinflammatory cytokine produced by macrophages, endothelial cells and fibroblasts, is thought to contribute to insulin resistance by affecting adhesion molecule expression and promoting multiple inflammatory pathways. Although the individual contribution of each pathway remains uncertain, it is well established that maintaining optimal glycaemic levels can substantially lower the incidence of these vascular issues [
13,
14,
15,
16].
The identification of FAZ alterations as an early biomarker of microvascular changes in diabetes could have clinical implications. FAZ measurement via OCT-A could be integrated into routine diabetic eye screenings to detect microvascular damage before clinically apparent diabetic retinopathy develops. Early detection of FAZ enlargement may prompt closer monitoring, lifestyle interventions or earlier treatment to prevent progression. However, standardized clinical thresholds for significant FAZ changes have not yet been established and further longitudinal studies are needed to define these cut-offs and their prognostic value. Incorporating FAZ metrics into screening protocols could enhance personalized risk stratification in diabetic patients.
These results align with previous studies that have shown that diabetic patients, with or without retinopathy, are associated with microvascular damage in the retina, particularly in the central macula.
Table 2 summarizes recent studies on retinal changes in diabetes, focusing on the FAZ using OCTA. Oliverio et al., suggest that these differences are even more important in type 1 DM patients [
17,
18,
19,
20].
Despite its findings, this study presents several limitations. The relatively small sample size may have limited the power of our analysis and a larger cohort would be needed to confirm these results. Additionally, we were unable to quantitatively assess vascular density or flow index, as performed in other OCTA studies, due to the software limitations. Another limitation is the presence of hypertension in 45% of the diabetic patients, compared to normotensive controls, introduces a potential confounding factor, as hypertension itself can independently affect retinal microvasculature. Additionally, other systemic comorbidities relevant to elevated CRP levels, such as obesity, were more prevalent in the diabetic group, with a relatively higher BMI, which is known to influence CRP concentrations. The lack of adjustment for these covariates, including hypertension, BMI and gender differences—considering that women generally have higher CRP levels—may have affected the observed associations. Furthermore, important clinical variables such as concomitant medications, duration of diabetes and baseline HbA1c levels were not fully accounted for, which could impact systemic inflammation and retinal changes. Future studies with larger sample sizes should perform multivariate analyses to control these confounders to better isolate the specific relationships between diabetes, CRP and FAZ alterations. Also, future research should concentrate on exploring multimodal approaches that combine inflammatory biomarkers, OCT-A vascular index and density index along with FAZ.
In evaluating microvascular damage associated with diabetes, future studies could benefit from exploring additional retinal vascular parameters to complement the current findings from OCT-A. There are now several advanced techniques available that offer a more comprehensive view of retinal microcirculation, which could improve the overall assessment of vascular changes. These include adaptive optics retinal imaging, which improves the resolution of retinal imaging to visualize even the smallest capillaries and scanning laser Doppler flowmetry, which uses Doppler technology to measure retinal blood flow, offering valuable information about vascular dynamics. Furthermore, methods such as sequential and diameter response analysis help assess the response of blood vessels to stimuli, providing additional data on vascular reactions under various conditions. These techniques, when used alongside OCT-A, could provide a more complete picture of the microvascular pathology in diabetes and more personalized diagnostic strategies [
21,
22,
23].
5. Conclusions
We found that the FAZ was significantly larger in diabetic patients compared to healthy controls, suggesting its potential role as an early biomarker for microvascular changes in diabetes. Although CRP levels were significantly higher in the diabetic group, no correlation was observed between CRP and FAZ parameters, indicating that FAZ alterations may develop independently of systemic inflammation. These results highlight the importance of additional research to better understand the mechanisms behind FAZ enlargement in diabetes and its potential clinical implications.
Author Contributions
Conceptualization, M.S. and P.-G.B.; methodology, P.-G.B., I.M.G. and M.M.G.; validation, M.S., M.M.G. and I.M.G.; formal analysis, P.-G.B.; investigation, P.-G.B.; resources, M.M.G. and I.M.G. data curation, P.-G.B.; writing—original draft preparation, P.-G.B.; writing—review and editing, M.S., M.M.G. and I.M.G.; visualization, I.M.G.; supervision, M.S. and M.M.G. All authors have read and agreed to the published version of the manuscript.
Funding
No funding was received for this study.
Institutional Review Board Statement
The research related to human use complies with all the relevant national regulations and institutional policies, as per the tenets of the Helsinki Declaration, and has been approved by the review board of “Dr. Constantin Papilian” Military Emergency Hospital Cluj-Napoca, Romania (A11884/20.10.2023).
Informed Consent Statement
Written informed consent was obtained from all subjects involved in the study.
Data Availability Statement
All data generated or analyzed during this study are included in this article. Further enquiries can be directed to the corresponding author.
Conflicts of Interest
The authors declare no conflicts of interest.
References
- Grossniklaus, H.E.; Geisert, E.E.; Nickerson, J.M. Introduction to the Retina. Prog. Mol. Biol. Transl. Sci. 2015, 134, 383–396. [Google Scholar] [PubMed]
- Burns, S.A.; Elsner, A.E.; Sapoznik, K.A.; Warner, R.L.; Gast, T.J. Adaptive optics imaging of the human retina. Prog. Retin. Eye Res. 2019, 68, 1–30. [Google Scholar] [CrossRef] [PubMed]
- International Diabetes Federation. IDF Diabetes Atlas, 11th ed.; IDF: Brussels, Belgium, 2025. [Google Scholar]
- Goh, J.K.H.; Cheung, C.Y.; Sim, S.S.; Tan, P.C.; Tan, G.S.W.; Wong, T.Y. Retinal imaging techniques for diabetic retinopathy screening. J. Diabetes Sci. Technol. 2016, 10, 282–294. [Google Scholar] [CrossRef] [PubMed]
- Aiello, L.P.; Gardner, T.W.; King, G.L.; Blankenship, G.; Cavallerano, J.D.; Ferris, F.L.; Klein, R. Diabetic retinopathy. Diabetes Care 1998, 21, 143–156. [Google Scholar] [CrossRef]
- Weale, R.A. Why does the human retina possess a fovea? Nature 1966, 212, 255–256. [Google Scholar] [CrossRef]
- Mizutani, M.; Kern, T.S.; Lorenzi, M. Accelerated death of retinal microvascular cells in human and experimental diabetic retinopathy. J. Clin. Investig. 1996, 97, 2883–2890. [Google Scholar] [CrossRef]
- Bates, N.M.; Tian, J.; Smiddy, W.E.; Lee, W.-H.; Somfai, G.M.; Feuer, W.J.; Shiffman, J.C.; Kuriyan, A.E.; Gregori, N.Z.; Kostic, M.; et al. Relationship between the morphology of the foveal avascular zone, retinal structure, and macular circulation in patients with diabetes mellitus. Sci. Rep. 2018, 8, 5355. [Google Scholar] [CrossRef]
- Koenig, W.; Sund, M.; Frohlich, M.; Fischer, H.; Löwel, H.; Döring, A.; Hutchinson, W.L.; Pepys, M.B. C-Reactive protein, a sensitive marker of inflammation, predicts future risk of coronary heart disease in initially healthy middle-aged men: Results from the MONICA (Monitoring Trends and Determinants in Cardiovascular Disease) Augsburg Cohort Study, 1984 to 1992. Circulation 1999, 99, 237–242. [Google Scholar]
- Nowak, M.; Wielkoszyński, T.; Marek, B.; Kos-Kudła, B.; Świętochowska, E.; Siemińska, L.; Karpe, J.; Kajdaniuk, D.; Głogowska-Szeląg, J.; Nowak, K. Antioxidant potential, paraoxonase 1, ceruloplasmin activity and C-reactive protein concentration in diabetic retinopathy. Clin. Exp. Med. 2010, 10, 185–192. [Google Scholar] [CrossRef]
- Stanimirovic, J.; Radovanovic, J.; Banjac, K.; Obradovic, M.; Essack, M.; Zafirovic, S.; Gluvic, Z.; Gojobori, T.; Isenovic, E.R.; Martins, J.O. Role of C-Reactive Protein in Diabetic Inflammation. Mediat. Inflamm. 2022, 2022, 3706508. [Google Scholar] [CrossRef]
- Nesto, R. C-reactive protein, its role in inflammation, Type 2 diabetes and cardiovascular disease, and the effects of insulin-sensitizing treatment with thiazolidinediones. Diabet. Med. 2004, 21, 810–817. [Google Scholar] [CrossRef]
- Orasanu, G.; Plutzky, J. The pathologic continuum of diabetic vascular disease. J. Am. Coll. Cardiol. 2009, 53, S35–S42. [Google Scholar] [CrossRef] [PubMed]
- Cheung, C.Y.; Ikram, M.K.; Klein, R.; Wong, T.Y. The clinical implications of recent studies on the structure and function of the retinal microvasculature in diabetes. Diabetologia 2015, 58, 871–885. [Google Scholar] [CrossRef] [PubMed]
- Murata, T.; Nagai, R.; Ishibashi, T.; Inomuta, H.; Ikeda, K.; Horiuchi, S. The relationship between accumulation of advanced glycation end products and expression of vascular endothelial growth factor in human diabetic retinas. Diabetologia 1997, 40, 764–769. [Google Scholar] [CrossRef] [PubMed]
- Borodi, P.-G.; Slevin, M. Exploring the role of inflammation in age-related macular degeneration: New insights and implications for future therapies. Rom. J. Morphol. Embryol. 2025, 66, 51–59. [Google Scholar] [CrossRef]
- Takase, N.; Nozaki, M.; Kato, A.; Ozeki, H.; Yoshida, M.; Ogura, Y. Enlargement of foveal avascular zone in diabetic eyes evaluated by en face optical coherence tomography angiography. Retina 2015, 35, 2377–2383. [Google Scholar] [CrossRef]
- Cilogu, E.; Unal, F.; Sukgen, E.A.; Koçluk, Y. Evaluation of foveal avascular zone and capillary plexuses in diabetic patients by optical coherence tomography angiography. Korean J. Ophthalmol. 2019, 33, 359–365. [Google Scholar] [CrossRef]
- Aitchison, R.T.; Kennedy, G.J.; Shu, X.; Mansfield, D.C.; Kir, R.; Hui, J.; Shahani, U. Measuring the foveal avascular zone in diabetes: A study using optical coherence tomography angiography. J. Diabetes Investig. 2022, 13, 668–676. [Google Scholar] [CrossRef]
- Oliverio, G.W.; Ceravolo, I.; Bhatti, A.; Trombetta, C.J. Foveal avascular zone analysis by optical coherence tomography angiography in patients with type 1 and 2 diabetes and without clinical signs of diabetic retinopathy. Int. Ophthalmol. 2020, 41, 649–658. [Google Scholar] [CrossRef]
- Koch, E.; Rosenbaum, D.; Brolly, A.; Sahel, J.A.; Chaumet-Riffaud, P.; Girerd, X.; Rossant, F.; Paques, M. Morphometric Analysis of Small Arteries in the Human Retina Using Adaptive Optics Imaging: Relationship with Blood Pressure and Focal Vascular Changes. J. Hypertens. 2014, 32, 890–898. [Google Scholar] [CrossRef]
- Harazny, J.M.; Raff, U.; Welzenbach, J.; Ott, C.; Ritt, M.; Lehmann, M.; Michelson, G.; E Schmieder, R. New Software Analyses Increase the Reliability of Measurements of Retinal Arterioles Morphology by Scanning Laser Doppler Flowmetry in Humans. J. Hypertens. 2011, 29, 777–782. [Google Scholar] [CrossRef] [PubMed]
- Heitmar, R.; Blann, A.D.; Cubbidge, R.P.; Lip, G.Y.; Gherghel, D. Continuous Retinal Vessel Diameter Measurements: The Future in Retinal Vessel Assessment? Investig. Ophthalmol. Vis. Sci. 2010, 51, 5833–5839. [Google Scholar] [CrossRef] [PubMed]
| Disclaimer/Publisher’s Note: The statements, opinions and data contained in all publications are solely those of the individual author(s) and contributor(s) and not of MDPI and/or the editor(s). MDPI and/or the editor(s) disclaim responsibility for any injury to people or property resulting from any ideas, methods, instructions or products referred to in the content. |
© 2025 by the authors. Licensee MDPI, Basel, Switzerland. This article is an open access article distributed under the terms and conditions of the Creative Commons Attribution (CC BY) license (https://creativecommons.org/licenses/by/4.0/).


