
Is Measuring BMI and Waist Circumference as Good in Assessing Insulin Resistance as Using Bioelectrical Impedance to Measure Total Body Fat and Visceral Fat?
 , , and
Abstract

1. Introduction
2. Materials and Methods
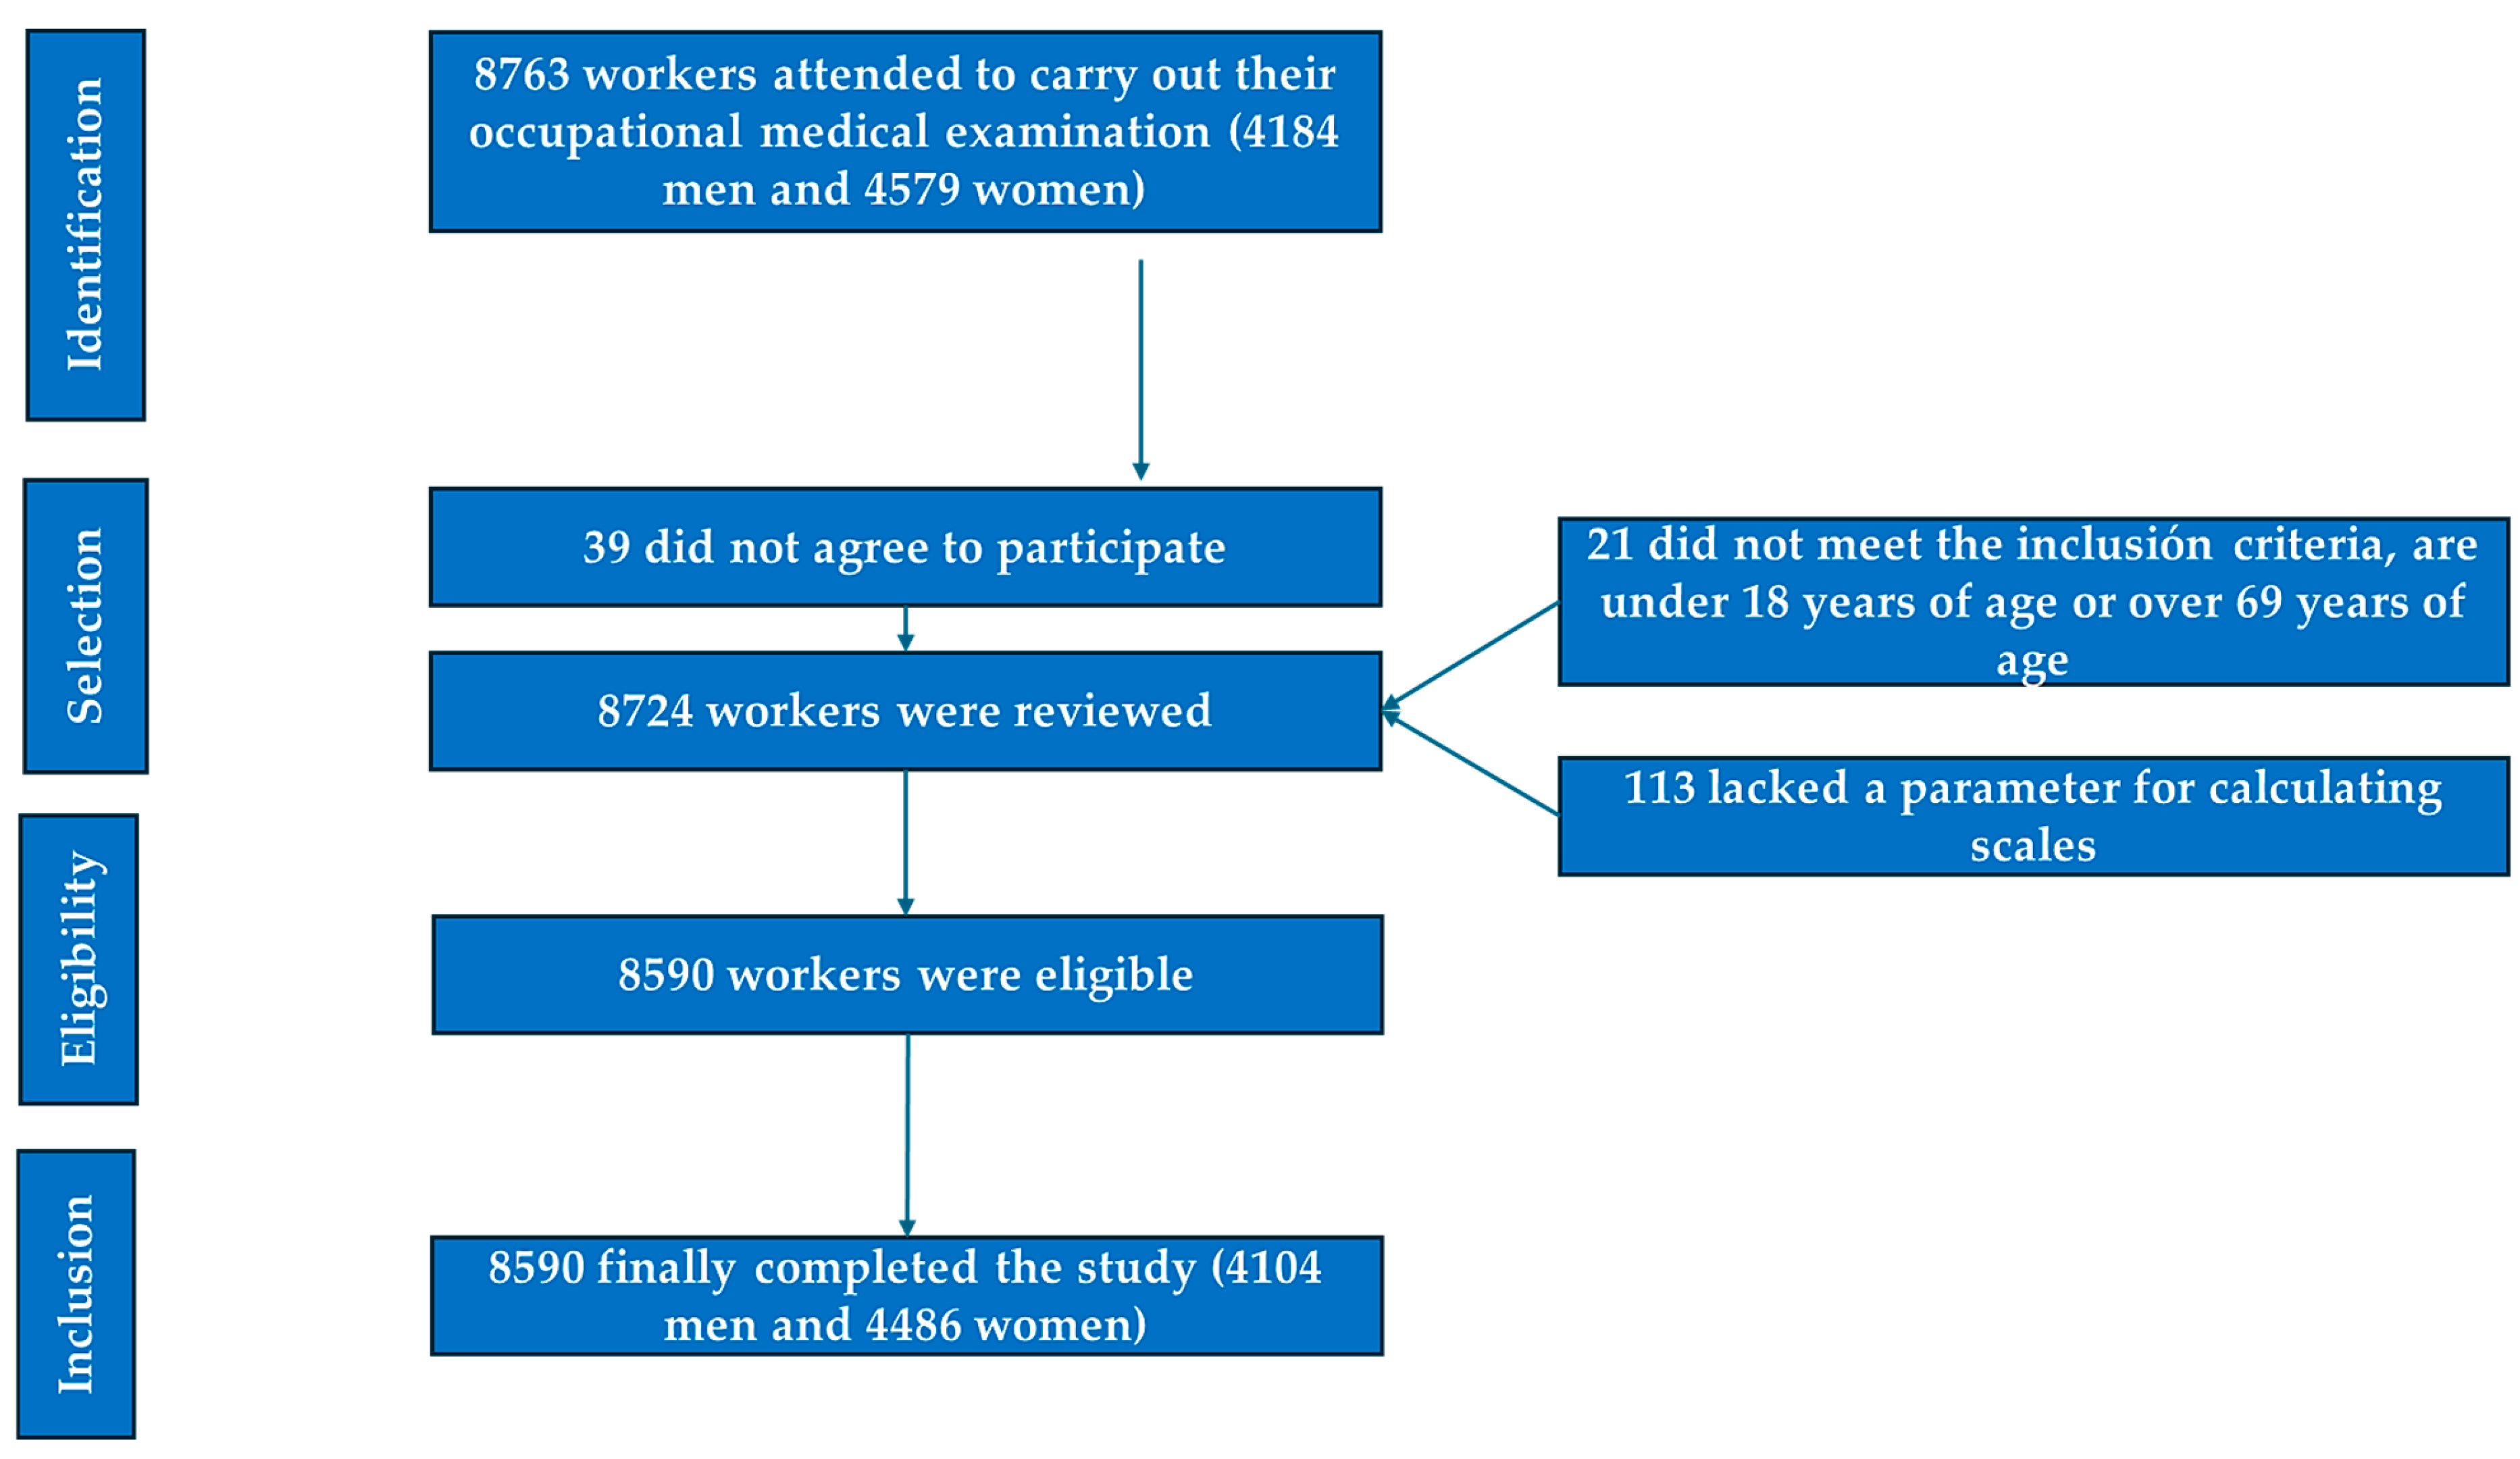
2.1. Participants
- Individuals aged between 18 and 69 years;
- Voluntary agreement to participate in the study;
- Provision of informed consent for the use of their data in epidemiological research;
- Active employment in one of the participating companies, without temporary work disability at the time of data collection.
- Age below 18 or above 69 years;
- Lack of employment in any of the companies involved in the research;
- Declining to participate or withholding consent for the use of personal data in the study;
- Did not provide consent for the use of their data in epidemiological analyses;
- Lacked essential variables required for the computation of clinical or diagnostic indices.
- The selection process for study participants is illustrated in the corresponding flowchart (Figure 1).
2.2. Variable Assessment
- Sociodemographic and lifestyle data: age, sex, engagement in regular physical activity, weekly exercise frequency, and smoking habits.
- Anthropometric and clinical parameters: body weight, height, and waist and hip circumferences, as well as systolic and diastolic blood pressure.
- Laboratory markers: fasting plasma glucose, lipid profile, and liver enzyme levels.
2.2.1. Anthropometric Measurements
- Height (in centimeters) and body weight (in kilograms) were recorded using a SECA 700 mechanical scale and SECA 220 stadiometer, in accordance with International Society for the Advancement of Kinanthropometry (ISAK) guidelines [36].
- Waist circumference was assessed with the participant standing upright, with their feet together and abdomen relaxed. A SECA flexible measuring tape was used, positioned horizontally at the midpoint between the lowest palpable rib and the iliac crest. Hip circumference was measured at the point of greatest gluteal protrusion, also with the tape held parallel to the ground [37].
- Body composition, including total and visceral fat, was evaluated via bioelectrical impedance analysis (BIA), using a Tanita DC-430MA device. Elevated visceral fat was defined as values ≥10 on the bioimpedance scale, while thresholds for high total body fat were adjusted based on the participant’s age.
- The Tanita features an integrated auto-calibration system; however, certain steps can be followed to ensure that it functions optimally: Place the Tanita on a hard, flat, and level surface. If necessary, perform a reset. Periodic calibration should be conducted by technical service providers at least twice a year.
- User Preparation: Measurements should be performed under consistent conditions each time (e.g., at the same time of day, with the same hydration level, and preferably on an empty stomach or at least two hours after eating). The individual must be barefoot, must be wearing light clothing, and should not have engaged in intense physical activity beforehand.
- Comparison with Reference Standards: Repeated measurements should be performed on the same day to verify consistency. Additionally, body fat measurements should be compared with those obtained from a calibrated body composition device or validated reference methods (e.g., DEXA analysis or skinfold assessments performed by an expert).
- General Maintenance: The platform should be regularly cleaned with a soft, dry cloth. The use of harsh chemicals should be avoided. The device should be stored in a dry, stable environment to prevent damage to the sensors.
2.2.2. Clinical Determinations
- Blood Pressure Assessment: Arterial blood pressure was recorded using an OMRON M3 automated sphygmomanometer. Participants remained seated with their legs uncrossed and at rest for at least 10 min prior to measurement. Three consecutive readings were taken at one-minute intervals, and the mean value was used for analysis.
2.2.3. Biochemical Analyses
- Venous blood samples were drawn following a fasting period of no less than 12 h. The samples were processed as follows: “The tube used was the 8.5 mL BD SST II Vacutainer serum tube with separating gel, reference BD 366468. The samples were transported to the laboratory in a refrigerator (between 5 and 10 degrees Celsius). The samples were centrifuged in the laboratory within two hours of collection and immediately analyzed on an autoanalyzer” [38,39].
- LDL cholesterol concentrations were estimated using the Friedewald equation, applicable only when triglyceride levels were below 400 mg/dL. All biochemical variables are reported in milligrams per deciliter (mg/dL).
2.2.4. Insulin Resistance Risk Scales Applied
- Metabolic score for insulin resistance (METS-IR). METS-IR = Ln(2 × glucose) + triglycerides × BMI)/(Ln(HDL-c). High values are defined as 50 and above [40].
- SPISE = 600 × HDL0.185/triglycerides0.2 × BMI1.338. SPISE-IR = 10/SPISE. High risk is considered at 1.51 [41].
- The triglyceride–glucose (TyG) index is calculated using the following formula: Ln(triglycerides [mg/dL] × glucose [mg/dL]2). Values exceeding 8.81 are classified as high [42].
2.2.5. Sociodemographic Variables and Healthy Habits
2.3. Statistical Analysis
3. Results
4. Discussion
5. Strengths and Limitations
6. Conclusions
Author Contributions
Funding
Institutional Review Board Statement
Informed Consent Statement
Data Availability Statement
Conflicts of Interest
References
- Kosmas, C.E.; Bousvarou, M.D.; Kostara, C.E.; Papakonstantinou, E.J.; Salamou, E.; Guzman, E. Insulin resistance and cardiovascular disease. J. Int. Med. Res. 2023, 51, 3000605231164548. [Google Scholar] [CrossRef] [PubMed] [PubMed Central]
- Gołacki, J.; Matuszek, M.; Matyjaszek-Matuszek, B. Link between Insulin Resistance and Obesity—From Diagnosis to Treatment. Diagnostics 2022, 12, 1681. [Google Scholar] [CrossRef] [PubMed] [PubMed Central]
- Lee, S.H.; Park, S.Y.; Choi, C.S. Insulin Resistance: From Mechanisms to Therapeutic Strategies. Diabetes Metab. J. 2022, 46, 15–37. [Google Scholar] [CrossRef] [PubMed] [PubMed Central]
- Lee, J. The emerging era of multidisciplinary metabolism research. Mol. Cells 2024, 47, 100032. [Google Scholar] [CrossRef] [PubMed] [PubMed Central]
- Nathalie, G.; Bonamichi, B.D.S.F.; Kim, J.; Jeong, J.; Kang, H.; Hartland, E.R.; Eveline, E.; Lee, J. NK cell-activating receptor NKp46 does not participate in the development of obesity-induced inflammation and insulin resistance. Mol. Cells 2024, 47, 100007. [Google Scholar] [CrossRef] [PubMed] [PubMed Central]
- Hoddy, K.K.; Axelrod, C.L.; Mey, J.T.; Hari, A.; Beyl, R.A.; Blair, J.B.; Dantas, W.S.; Kirwan, J.P. Insulin resistance persists despite a metabolically healthy obesity phenotype. Obesity 2022, 30, 39–44. [Google Scholar] [CrossRef] [PubMed] [PubMed Central]
- Pasanta, D.; Htun, K.T.; Pan, J.; Tungjai, M.; Kaewjaeng, S.; Chancharunee, S.; Tima, S.; Kim, H.J.; Kæwkhao, J.; Kothan, S. Waist Circumference and BMI Are Strongly Correlated with MRI-Derived Fat Compartments in Young Adults. Life 2021, 11, 643. [Google Scholar] [CrossRef] [PubMed] [PubMed Central]
- Calcaterra, V.; Biganzoli, G.; Ferraro, S.; Verduci, E.; Rossi, V.; Vizzuso, S.; Bosetti, A.; Borsani, B.; Biganzoli, E.; Zuccotti, G. A Multivariate Analysis of “Metabolic Phenotype” Patterns in Children and Adolescents with Obesity for the Early Stratification of Patients at Risk of Metabolic Syndrome. J. Clin. Med. 2022, 11, 1856. [Google Scholar] [CrossRef] [PubMed] [PubMed Central]
- Witczak-Sawczuk, K.; Ostrowska, L.; Cwalina, U.; Leszczyńska, J.; Jastrzębska-Mierzyńska, M.; Hładuński, M.K. Estimation of the Impact of Abdominal Adipose Tissue (Subcutaneous and Visceral) on the Occurrence of Carbohydrate and Lipid Metabolism Disorders in Patients with Obesity-A Pilot Study. Nutrients 2024, 16, 1301. [Google Scholar] [CrossRef] [PubMed] [PubMed Central]
- Kurniawan, L.B.; Bahrun, U.; Hatta, M.; Arif, M. Body Mass, Total Body Fat Percentage, and Visceral Fat Level Predict Insulin Resistance Better Than Waist Circumference and Body Mass Index in Healthy Young Male Adults in Indonesia. J. Clin. Med. 2018, 7, 96. [Google Scholar] [CrossRef] [PubMed] [PubMed Central]
- Després, J.P.; Arsenault, B.J.; Côté, M.; Cartier, A.; Lemieux, I. Abdominal obesity: The cholesterol of the 21st century? Can. J. Cardiol. 2008, 24 (Suppl. D), 7D–12D. [Google Scholar] [CrossRef] [PubMed] [PubMed Central]
- Clarke, S.L.; Reaven, G.M.; Leonard, D.; Barlow, C.E.; Haskell, W.L.; Willis, B.L.; DeFina, L.; Knowles, J.W.; Maron, D.J. Cardiorespiratory Fitness, Body Mass Index, and Markers of Insulin Resistance in Apparently Healthy Women and Men. Am. J. Med. 2020, 133, 825–830.e2. [Google Scholar] [CrossRef] [PubMed] [PubMed Central]
- Cavaliere, G.; Cimmino, F.; Trinchese, G.; Catapano, A.; Petrella, L.; D’Angelo, M.; Lucchin, L.; Mollica, M.P. From Obesity-Induced Low-Grade Inflammation to Lipotoxicity and Mitochondrial Dysfunction: Altered Multi-Crosstalk between Adipose Tissue and Metabolically Active Organs. Antioxidants 2023, 12, 1172. [Google Scholar] [CrossRef] [PubMed] [PubMed Central]
- Ahmed, B.; Sultana, R.; Greene, M.W. Adipose tissue and insulin resistance in obese. Biomed. Pharmacother. 2021, 137, 111315. [Google Scholar] [CrossRef] [PubMed]
- Mentxaka, A.; Gómez-Ambrosi, J.; Ramírez, B.; Rodríguez, A.; Becerril, S.; Neira, G.; Valentí, V.; Moncada, R.; Silva, C.; Unamuno, X.; et al. Netrin-1 Promotes Visceral Adipose Tissue Inflammation in Obesity and Is Associated with Insulin Resistance. Nutrients 2022, 14, 4372. [Google Scholar] [CrossRef] [PubMed] [PubMed Central]
- Ghemiș, L.; Goriuc, A.; Minea, B.; Botnariu, G.E.; Mârțu, M.A.; Ențuc, M.; Cioloca, D.; Foia, L.G. Myeloid-Derived Suppressor Cells (MDSCs) and Obesity-Induced Inflammation in Type 2 Diabetes. Diagnostics 2024, 14, 2453. [Google Scholar] [CrossRef] [PubMed] [PubMed Central]
- Wu, Y.; Li, D.; Vermund, S.H. Advantages and Limitations of the Body Mass Index (BMI) to Assess Adult Obesity. Int. J. Environ. Res. Public Health 2024, 21, 757. [Google Scholar] [CrossRef] [PubMed] [PubMed Central]
- Ramírez-Manent, J.I.; Jover, A.M.; Martinez, C.S.; Tomás-Gil, P.; Martí-Lliteras, P.; López-González, Á.A. Waist Circumference Is an Essential Factor in Predicting Insulin Resistance and Early Detection of Metabolic Syndrome in Adults. Nutrients 2023, 15, 257. [Google Scholar] [CrossRef] [PubMed] [PubMed Central]
- Radu, F.; Potcovaru, C.G.; Salmen, T.; Filip, P.V.; Pop, C.; Fierbințeanu-Braticievici, C. The Link between NAFLD and Metabolic Syndrome. Diagnostics 2023, 13, 614. [Google Scholar] [CrossRef] [PubMed] [PubMed Central]
- Jurczewska, J.; Ostrowska, J.; Chełchowska, M.; Panczyk, M.; Rudnicka, E.; Kucharski, M.; Smolarczyk, R.; Szostak-Węgierek, D. Abdominal Obesity in Women with Polycystic Ovary Syndrome and Its Relationship with Diet, Physical Activity and Insulin Resistance: A Pilot Study. Nutrients 2023, 15, 3652. [Google Scholar] [CrossRef] [PubMed] [PubMed Central]
- Espada, M.C.; Ferreira, C.C.; Gamonales, J.M.; Hernández-Beltrán, V.; Massini, D.A.; Macedo, A.G.; Almeida, T.A.F.; Castro, E.A.; Pessôa Filho, D.M. Body Composition Relationship to Performance, Cardiorespiratory Profile, and Tether Force in Youth Trained Swimmers. Life 2023, 13, 1806. [Google Scholar] [CrossRef] [PubMed] [PubMed Central]
- Muntean, P.; Popa, A.; Miclos-Balica, M.; Schick, F.; Munteanu, O.; Pupazan, V.; Neagu, A.; Neagu, M. Learning Effects in Air Displacement Plethysmography. Life 2023, 13, 1315. [Google Scholar] [CrossRef] [PubMed] [PubMed Central]
- Gordito Soler, M.; López-González, Á.A.; Vallejos, D.; Martínez-Almoyna Rifá, E.; Vicente-Herrero, M.T.; Ramírez-Manent, J.I. Usefulness of Body Fat and Visceral Fat Determined by Bioimpedanciometry versus Body Mass Index and Waist Circumference in Predicting Elevated Values of Different Risk Scales for Non-Alcoholic Fatty Liver Disease. Nutrients 2024, 16, 2160. [Google Scholar] [CrossRef] [PubMed] [PubMed Central]
- Khan, S.H.; Sobia, F.; Niazi, N.K.; Manzoor, S.M.; Fazal, N.; Ahmad, F. Metabolic clustering of risk factors: Evaluation of Triglyceride-glucose index (TyG index) for evaluation of insulin resistance. Diabetol. Metab. Syndr. 2018, 10, 74. [Google Scholar] [CrossRef] [PubMed] [PubMed Central]
- Duan, M.; Zhao, X.; Li, S.; Miao, G.; Bai, L.; Zhang, Q.; Yang, W.; Zhao, X. Metabolic score for insulin resistance (METS-IR) predicts all-cause and cardiovascular mortality in the general population: Evidence from NHANES 2001–2018. Cardiovasc. Diabetol. 2024, 23, 243. [Google Scholar] [CrossRef] [PubMed] [PubMed Central]
- Widjaja, N.A.; Irawan, R.; Hanindita, M.H.; Ugrasena, I.; Handajani, R. METS-IR vs. HOMA-AD and Metabolic Syndrome in Obese Adolescents. J. Med. Investig. 2023, 70, 7–16. [Google Scholar] [CrossRef] [PubMed]
- Tunç Karaman, S. Insulin resistance in non-diabetic hypothyroid patients: A critical examination of METS-IR as a diagnostic marker. Curr. Med. Res. Opin. 2023, 39, 1431–1437. [Google Scholar] [CrossRef] [PubMed]
- Mestre-Font, M.; Busquets-Cortés, C.; Ramírez-Manent, J.I.; Tomás-Gil, P.; Paublini, H.; López-González, A.A. Influence of sociodemographic variables and healthy habits on the values of overweight and obesity scales in 386,924 Spanish workers. Acad. J. Health Sci. 2024, 39, 27–35. [Google Scholar] [CrossRef]
- Bazyar, H.; Zare Javid, A.; Masoudi, M.R.; Haidari, F.; Heidari, Z.; Hajializadeh, S.; Aghamohammadi, V.; Vajdi, M. Assessing the predictive value of insulin resistance indices for metabolic syndrome risk in type 2 diabetes mellitus patients. Sci. Rep. 2024, 14, 8917. [Google Scholar] [CrossRef] [PubMed] [PubMed Central]
- Pereyra González, I.; Lopez-Arana, S. Usefulness of SPISE Index for Screening and Detection of Early Stages of Insulin Resistance among Chilean Young Adults. Ann. Nutr. Metab. 2023, 79, 372–378. [Google Scholar] [CrossRef] [PubMed]
- Correa-Burrows, P.; Matamoros, M.; de Toro, V.; Zepeda, D.; Arriaza, M.; Burrows, R. A Single-Point Insulin Sensitivity Estimator (SPISE) of 5.4 is a good predictor of both metabolic syndrome and insulin resistance in adolescents with obesity. Front. Endocrinol. 2023, 14, 1078949. [Google Scholar] [CrossRef] [PubMed] [PubMed Central]
- Barchetta, I.; Dule, S.; Bertoccini, L.; Cimini, F.A.; Sentinelli, F.; Bailetti, D.; Marini, G.; Barbonetti, A.; Loche, S.; Cossu, E.; et al. The single-point insulin sensitivity estimator (SPISE) index is a strong predictor of abnormal glucose metabolism in overweight/obese children: A long-term follow-up study. J. Endocrinol. Investig. 2022, 45, 43–51. [Google Scholar] [CrossRef] [PubMed] [PubMed Central]
- Manzanero, R.Z.; López-González, A.A.; Tomás-Gil, P.; Paublini, H.; Martínez-Jover, A.; Ramírez-Manent, J.I. Estimation of cardiometabolic risk in 25.030 Spanish kitchen workers. Acad. J. Health Sci. 2023, 38, 101–110. [Google Scholar] [CrossRef]
- Gholami, F.; Karimi, Z.; Samadi, M.; Sovied, N.; Yekaninejad, M.S.; Keshavarz, S.A.; Javdan, G.; Bahrampour, N.; Wong, A.; Clark, C.C.T.; et al. The association between dietary pattern and visceral adiposity index, triglyceride-glucose index, inflammation, and body composition among Iranian overweight and obese women. Sci. Rep. 2023, 13, 13162. [Google Scholar] [CrossRef] [PubMed] [PubMed Central]
- Manzanero, R.Z.; López-González, A.A.; Tomás-Gil, P.; Paublini, H.; Martínez-Jover, A.; Ramírez-Manent, J.I. Cardiometabolic risk assessment in 28300 spanish waiters. Acad. J. Health Sci. 2023, 39, 16–24. [Google Scholar] [CrossRef]
- Stewart, A.; Marfell-Jones, M.; Olds, T.; Ridder, H. International Standards for Anthropometric Assessment; International Society for the Advancement of Kinanthropometry–ISAK: Lower Hutt, New Zealand, 2011. [Google Scholar]
- Fang, H.; Berg, E.; Cheng, X.; Shen, W. How to best assess abdominal obesity. Curr. Opin. Clin. Nutr. Metab. Care 2018, 21, 360–365. [Google Scholar] [CrossRef] [PubMed] [PubMed Central]
- Allain, C.C.; Poon, L.S.; Chan, C.S.; Richmond, W.; Fu, P.C. Enzymatic determination of total serum cholesterol. Clin. Chem. 1974, 20, 470–475. [Google Scholar] [CrossRef] [PubMed]
- Roeschlau, P.; Bernt, E.; Gruber, W. Enzymatic determination of total cholesterol in serum. Z. Klin. Chem. Klin. Biochem. 1974, 12, 226. [Google Scholar] [PubMed]
- Han, Y.; Zhou, Z.; Zhang, Y.; Zhao, G.; Xu, B. The Association of Surrogates of Insulin Resistance with Hyperuricemia among Middle-Aged and Older Individuals: A Population-Based Nationwide Cohort Study. Nutrients 2023, 15, 3139. [Google Scholar] [CrossRef] [PubMed] [PubMed Central]
- Seo, M.W.; Cho, W.; Kim, J.Y. The single point insulin sensitivity estimator (SPISE) index as a predictor of metabolic syndrome in Korean adults. Obes. Res. Clin. Pract. 2023, 17, 198–202. [Google Scholar] [CrossRef] [PubMed]
- Mestre Font, M.; Busquets-Cortés, C.; Ramírez-Manent, J.I.; Tomás-Gil, P.; Paublini, H.; López-González, Á.A. Influence of Sociodemographic Variables and Healthy Habits on the Values of Insulin Resistance Indicators in 386,924 Spanish Workers. Nutrients 2023, 15, 5122. [Google Scholar] [CrossRef] [PubMed] [PubMed Central]
- Águilo Juanola, M.C. Should the financing criteria for medicines for the treatment of smoking in Spain be modified? Acad. J. Health Sci. 2023, 38, 157–162. [Google Scholar] [CrossRef]
- Aguiló Juanola, M.C.; López-González, A.A.; Tomás-Gil, P.; Paublini, H.; Tárraga-López, P.J.; Ramírez-Manent, J.I. Influence of tobacco consumption on the values of different insulin resistance risk scales and non-alcoholic fatty liver disease and hepatic fibrosis scales in 418,343 spanish people. Acad. J. Health Sci. 2024, 39, 9–15. [Google Scholar] [CrossRef]
- Mestre-Font, M.; Busquets-Cortés, C.; Ramírez-Manent, J.I.; Tomás-Gil, P.; Paublini, H.; López-González, A.A. Influence of sociodemographic variables and healthy habits on the values of type 2 diabetes risk scales. Acad. J. Health Sci. 2024, 39, 99–106. [Google Scholar] [CrossRef]
- Lee, H.J.; Lim, Y.H.; Hong, Y.C.; Shin, C.H.; Lee, Y.A. Body Mass Index Changes and Insulin Resistance at Age 4: A Prospective Cohort Study. Front. Endocrinol. 2022, 13, 872591. [Google Scholar] [CrossRef] [PubMed] [PubMed Central]
- Tucker, L.A. Insulin Resistance and Biological Aging: The Role of Body Mass, Waist Circumference, and Inflammation. Biomed. Res. Int. 2022, 2022, 2146596. [Google Scholar] [CrossRef] [PubMed] [PubMed Central]
- Song, K.; Lee, E.; Lee, H.S.; Lee, H.; Lee, J.W.; Chae, H.W.; Kwon, Y.J. Comparison of SPISE and METS-IR and Other Markers to Predict Insulin Resistance and Elevated Liver Transaminases in Children and Adolescents. Diabetes Metab. J. 2024, 49, 264–274. [Google Scholar] [CrossRef] [PubMed]
- INEbase/Indicadores de Calidad de Vida. Available online: https://www.ine.es/jaxi/Datos.htm?path=/t00/ICV/dim3/l0/&file=33201.px (accessed on 10 December 2024).
- INEbase/Indicadores de Calidad de Vida. Available online: https://www.ine.es/jaxi/Datos.htm?path=/t00/ICV/dim3/&file=33303.px (accessed on 10 December 2024).
- Stefan, N.; Häring, H.U.; Schulze, M.B. Metabolically healthy obesity: The low-hanging fruit in obesity treatment? Lancet Diabetes Endocrinol. 2018, 6, 249–258. [Google Scholar] [CrossRef] [PubMed]
- Blüher, M. Metabolically Healthy Obesity. Endocr. Rev. 2020, 41, bnaa004. [Google Scholar] [CrossRef] [PubMed] [PubMed Central]
- Stefan, N. Metabolically Healthy and Unhealthy Normal Weight and Obesity. Endocrinol. Metab. 2020, 35, 487–493. [Google Scholar] [CrossRef] [PubMed] [PubMed Central]
- Stefan, N. Causes, consequences, and treatment of metabolically unhealthy fat distribution. Lancet Diabetes Endocrinol. 2020, 8, 616–627. [Google Scholar] [CrossRef] [PubMed]
- Koceva, A.; Herman, R.; Janez, A.; Rakusa, M.; Jensterle, M. Sex- and Gender-Related Differences in Obesity: From Pathophysiological Mechanisms to Clinical Implications. Int. J. Mol. Sci. 2024, 25, 7342. [Google Scholar] [CrossRef] [PubMed] [PubMed Central]
- Shao, Y.; Li, L.; Zhong, H.; Wang, X.; Hua, Y.; Zhou, X. Anticipated correlation between lean body mass to visceral fat mass ratio and insulin resistance: NHANES 2011–2018. Front. Endocrinol. 2023, 14, 1232896. [Google Scholar] [CrossRef] [PubMed] [PubMed Central]
- Freeman, A.M.; Acevedo, L.A.; Pennings, N. Insulin Resistance. In StatPearls [Internet]; StatPearls Publishing: Treasure Island, FL, USA, 17 August 2023. [Google Scholar] [PubMed]
- Vicente-Herrero, M.T.; Egea Sancho, M.; Ramírez Iñiguez de la Torre, M.V.; López-González, A.A. Visceral Adiposity Index (VAI) and Dysfunctional Adiposity Index (DAI). Relationship with insulin resistance and prediabetes risk. Acad. J. Health Sci. 2024, 39, 25–31. [Google Scholar] [CrossRef]
- Weir, C.B.; Jan, A. BMI Classification Percentile And Cut Off Points. In StatPearls [Internet]; StatPearls Publishing: Treasure Island, FL, USA, 26 June 2023. [Google Scholar] [PubMed]
- Salmón-Gómez, L.; Catalán, V.; Frühbeck, G.; Gómez-Ambrosi, J. Relevance of body composition in phenotyping the obesities. Rev. Endocr. Metab. Disord. 2023, 24, 809–823. [Google Scholar] [CrossRef] [PubMed] [PubMed Central]
- Chevalier, B.; Lion, G.; Semah, F.; Huglo, D. When and how to evaluate adipose tissue in clinical practice? DEXA, impedancemetry. Ann. Endocrinol. 2024, 85, 173–174. [Google Scholar] [CrossRef] [PubMed]
- Saini, S.; Kaur Walia, G.; Pal Sachdeva, M.; Gupta, V. Genomics of body fat distribution. J. Genet. 2021, 100, 32. [Google Scholar] [CrossRef] [PubMed]

| Men n = 4104 | Women n = 4486 | ||
|---|---|---|---|
| Mean (SD) | Mean (SD) | p-Value | |
| Age (years) | 41.6 (10.6) | 41.5 (10.5) | 0.492 |
| Height (cm) | 175.8 (7.2) | 162.5 (6.1) | <0.001 |
| Weight (kg) | 81.2 (14.8) | 63.9 (13.6) | <0.001 |
| Waist circumference (cm) | 89.8 (12.5) | 77.0 (12.0) | <0.001 |
| Hip circumference (cm) | 101.8 (8.7) | 99.6 (10.9) | <0.001 |
| Systolic blood pressure (mmHg) | 128.6 (13.3) | 117.2 (14.1) | <0.001 |
| Diastolic blood pressure (mmHg) | 79.9 (10.2) | 74.9 (9.9) | <0.001 |
| Glycemia (mg/dL) | 93.4 (17.8) | 88.9 (12.6) | <0.001 |
| Total cholesterol (mg/dL) | 191.8 (36.0) | 189.0 (34.8) | <0.001 |
| HDL cholesterol (mg/dL) | 49.2 (11.3) | 59.5 (12.8) | <0.001 |
| LDL cholesterol (mg/dL) | 124.0 (54.6) | 113.8 (30.7) | <0.001 |
| Triglycerides (mg/dL) | 107.8 (69.4) | 81.5 (46.3) | <0.001 |
| GGT (UI) | 31.5 (30.0) | 18.5 (15.9) | <0.001 |
| AST (UI) | 24.4 (17.3) | 18.2 (7.7) | <0.001 |
| ALT (UI) | 29.3 (34.9) | 17.3 (13.4) | <0.001 |
| % | % | p-value | |
| 18–29 years | 15.5 | 16.8 | 0.005 |
| 30–39 years | 27.8 | 25.1 | |
| 40–49 years | 32.7 | 34.4 | |
| 50–59 years | 19.0 | 19.7 | |
| 60–69 years | 5.0 | 4.0 | |
| Social class I | 57.1 | 50.8 | <0.001 |
| Social class II | 20.2 | 23.8 | |
| Social class III | 22.7 | 25.4 | |
| Non-smokers | 84.5 | 84.2 | 0.348 |
| Smokers | 15.5 | 15.8 | |
| No physical activity | 25.9 | 35.1 | <0.001 |
| Physical activity 1–3 days/week | 27.0 | 26.5 | |
| Physical activity more 3 days/week | 47.1 | 38.4 |
| Men | Women | |||||
|---|---|---|---|---|---|---|
| Body fat | n | Mean (SD) | p-value | n | Mean (SD) | p-value |
| METS-IR normal | 3650 | 18.5 (6.9) | <0.001 | 4250 | 28.4 (7.1) | <0.001 |
| METS-IR high | 454 | 31.4 (6.1) | 236 | 44.8 (4.9) | ||
| TyG normal | 3318 | 18.8 (7.6) | <0.001 | 4140 | 28.6 (7.6) | <0.001 |
| TyG high | 786 | 24.9 (7.4) | 346 | 37.2 (7.2) | ||
| SPISE-IR normal | 3540 | 18.3 (6.8) | <0.001 | 4202 | 28.2 (6.9) | <0.001 |
| SPISE-IR high | 564 | 30.4 (6.2) | 284 | 44.2 (5.1) | ||
| Visceral fat | n | Mean (SD) | p-value | n | Mean (SD) | p-value |
| METS-IR normal | 3650 | 6.9 (3.8) | <0.001 | 4250 | 4.3 (2.7) | <0.001 |
| METS-IR high | 454 | 15.7 (4.5) | 236 | 12.3 (3.1) | ||
| TyG normal | 3318 | 7.1 (4.4) | <0.001 | 4140 | 4.4 (3.0) | <0.001 |
| TyG high | 786 | 11.1 (4.7) | 346 | 8.4 (3.7) | ||
| SPISE-IR normal | 3540 | 6.8 (3.7) | <0.001 | 4202 | 4.2 (2.6) | <0.001 |
| SPISE-IR high | 564 | 15.0 (4.5) | 284 | 11.8 (3.2) | ||
| Men | Women | |||||
| Body fat very high | n | % | p-value | n | % | p-value |
| METS-IR normal | 3650 | 5.9 | <0.001 | 4250 | 5.5 | <0.001 |
| METS-IR high | 454 | 74.4 | 236 | 87.3 | ||
| TyG normal | 3318 | 10.1 | <0.001 | 4140 | 7.6 | <0.001 |
| TyG high | 786 | 27.5 | 346 | 35.8 | ||
| SPISE-IR normal | 3540 | 4.9 | <0.001 | 4202 | 4.9 | <0.001 |
| SPISE-IR high | 564 | 67.0 | 284 | 82.4 | ||
| Visceral fat high | ||||||
| METS-IR normal | 3650 | 9.0 | <0.001 | 4250 | 0.3 | <0.001 |
| METS-IR high | 454 | 76.4 | 236 | 46.6 | ||
| TyG normal | 3318 | 11.8 | 4140 | 1.6 | ||
| TyG high | 786 | 33.6 | 346 | 15.6 | ||
| SPISE-IR normal | 3540 | 10.3 | <0.001 | 4202 | 4.3 | <0.001 |
| SPISE-IR high | 564 | 69.1 | 284 | 40.8 |
| Body Fat | Visceral Fat | BMI | Waist | |
|---|---|---|---|---|
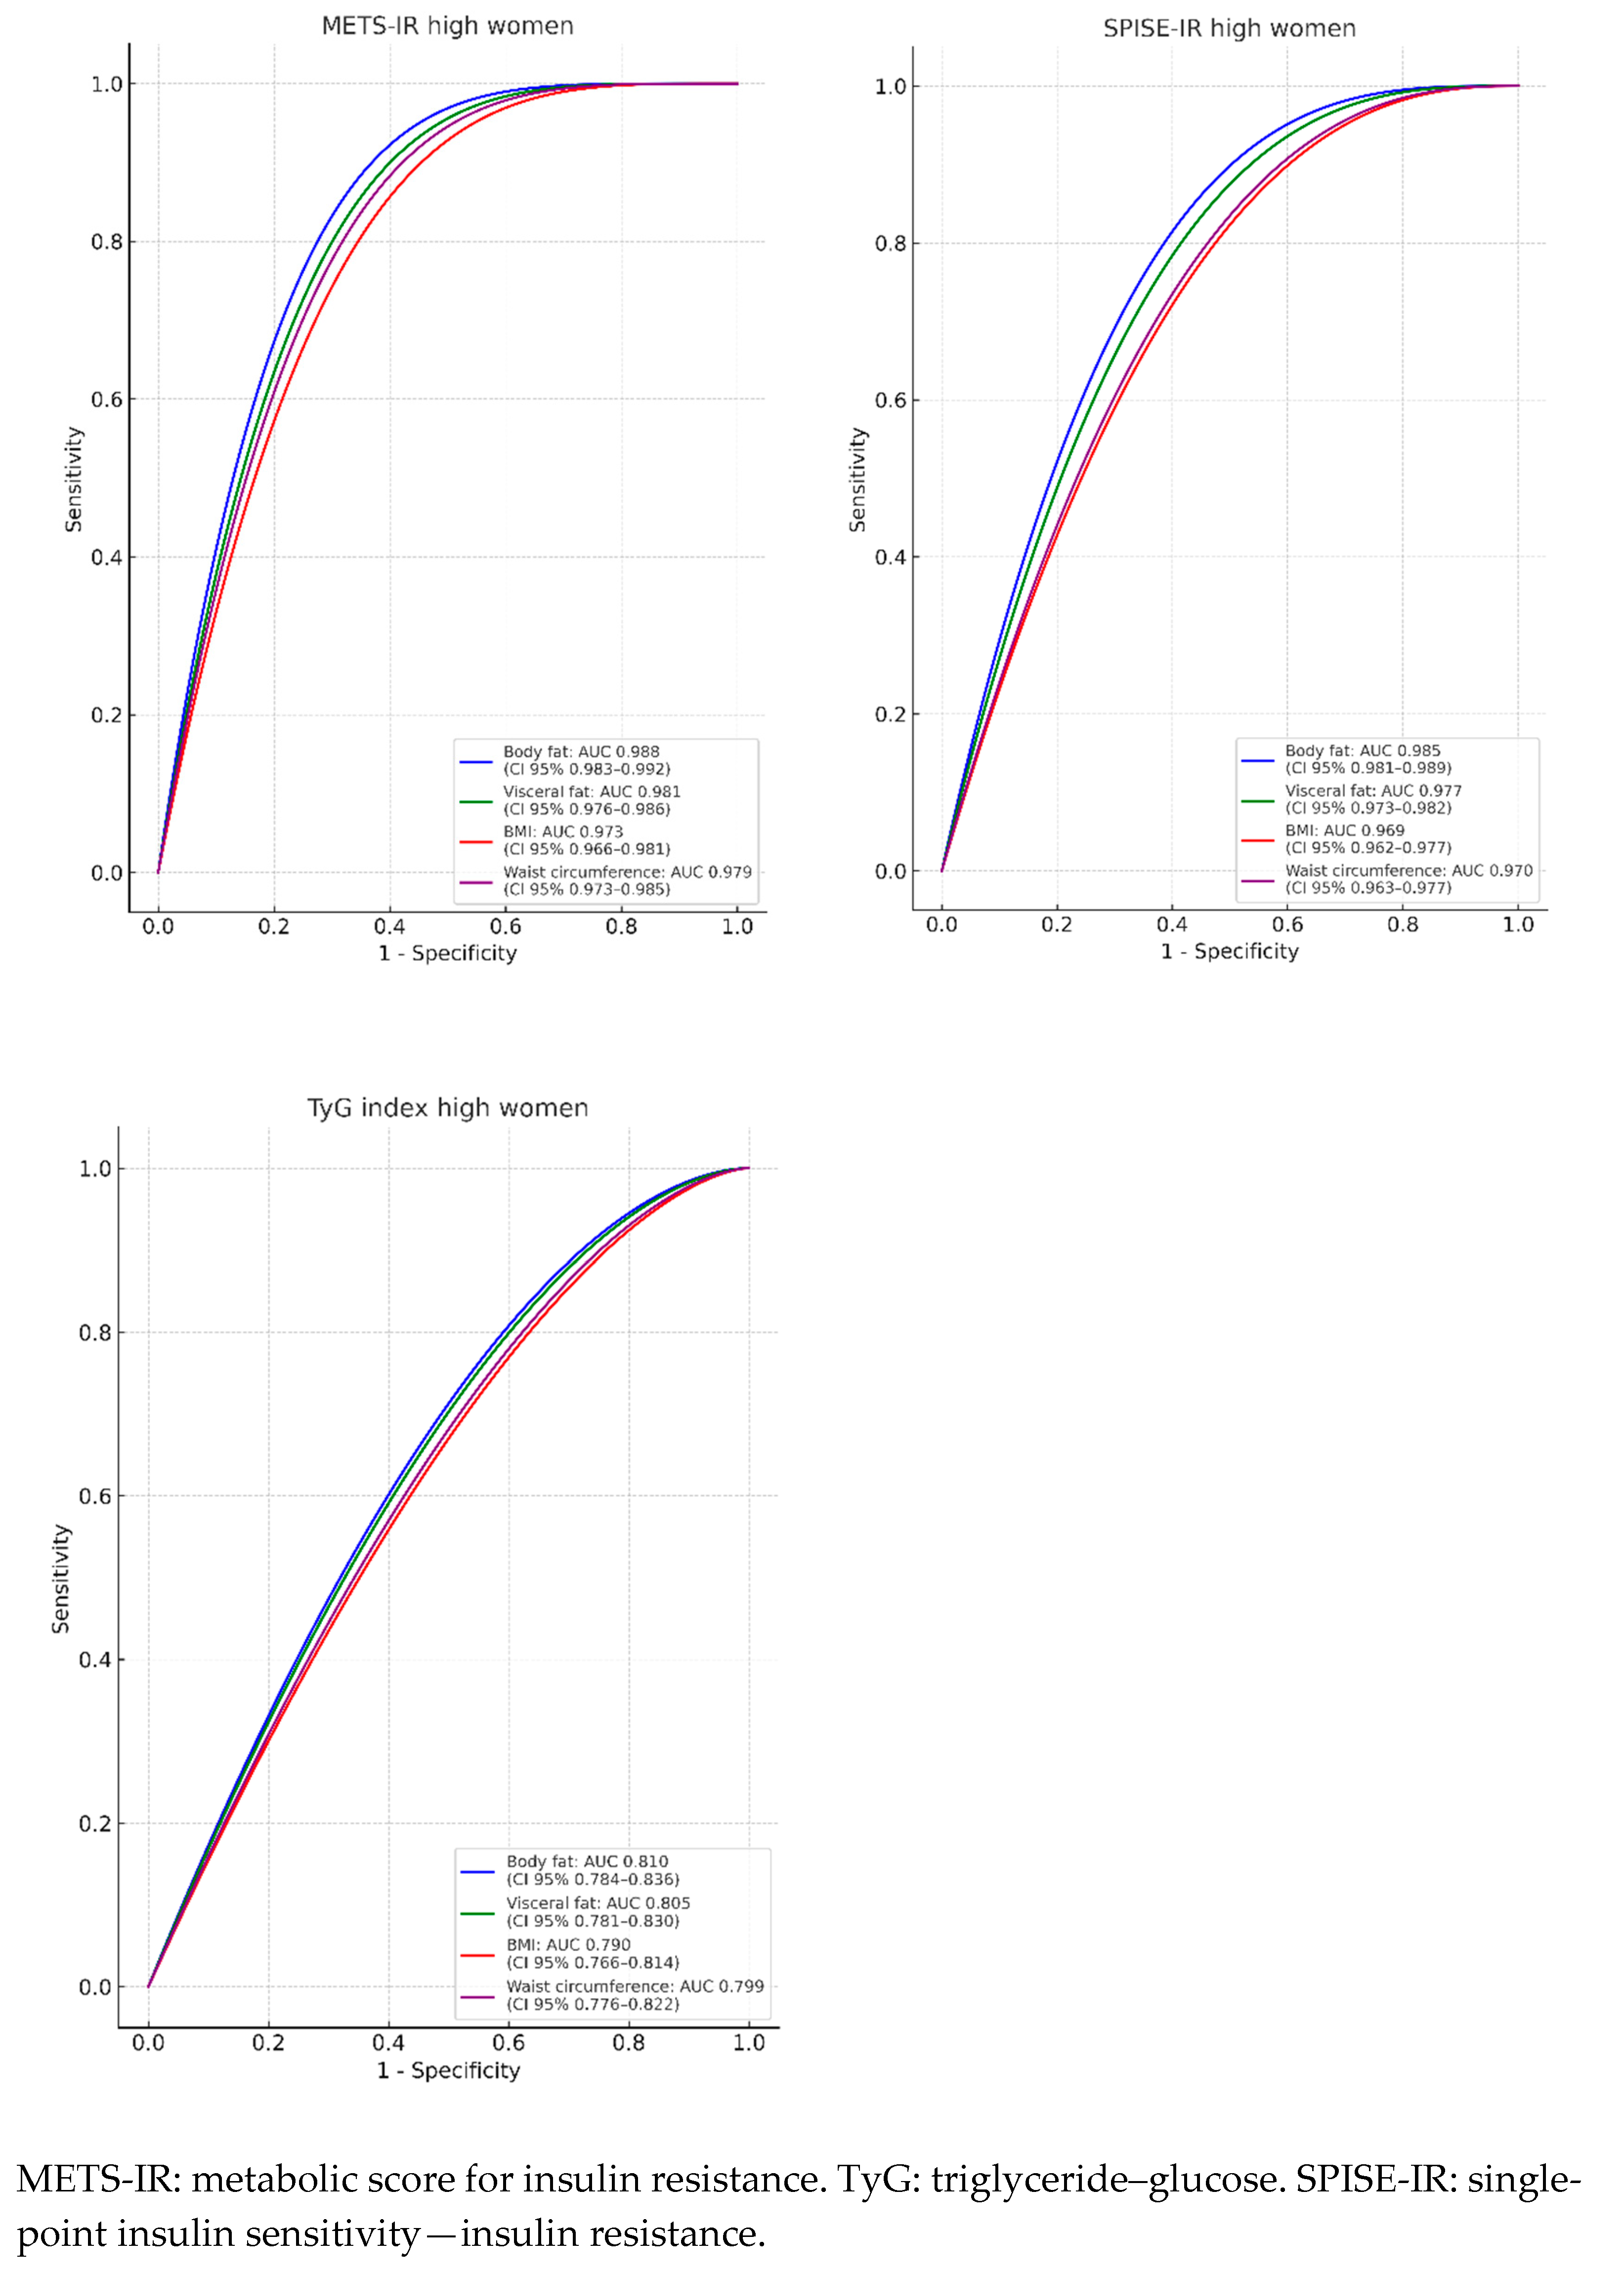
| Women n = 4486 | AUC (95% CI) | AUC (95% CI) | AUC (95% CI) | AUC (95% CI) |
| METS-IR high | 0.988 (0.983–0.992) | 0.981 (0.976–0.986) | 0.973 (0.966–0.981) | 0.979 (0.973–0.985) |
| TyG index high | 0.810 (0.784–0.836) | 0.805 (0.781–0.830) | 0.790 (0.7660.814) | 0.799 (0.776–0.822) |
| SPISE-IR high | 0.985 (0.981–0.989) | 0.977 (0.973–0.982) | 0.969 (0.962–0.977) | 0.970 (0.963–0.977) |
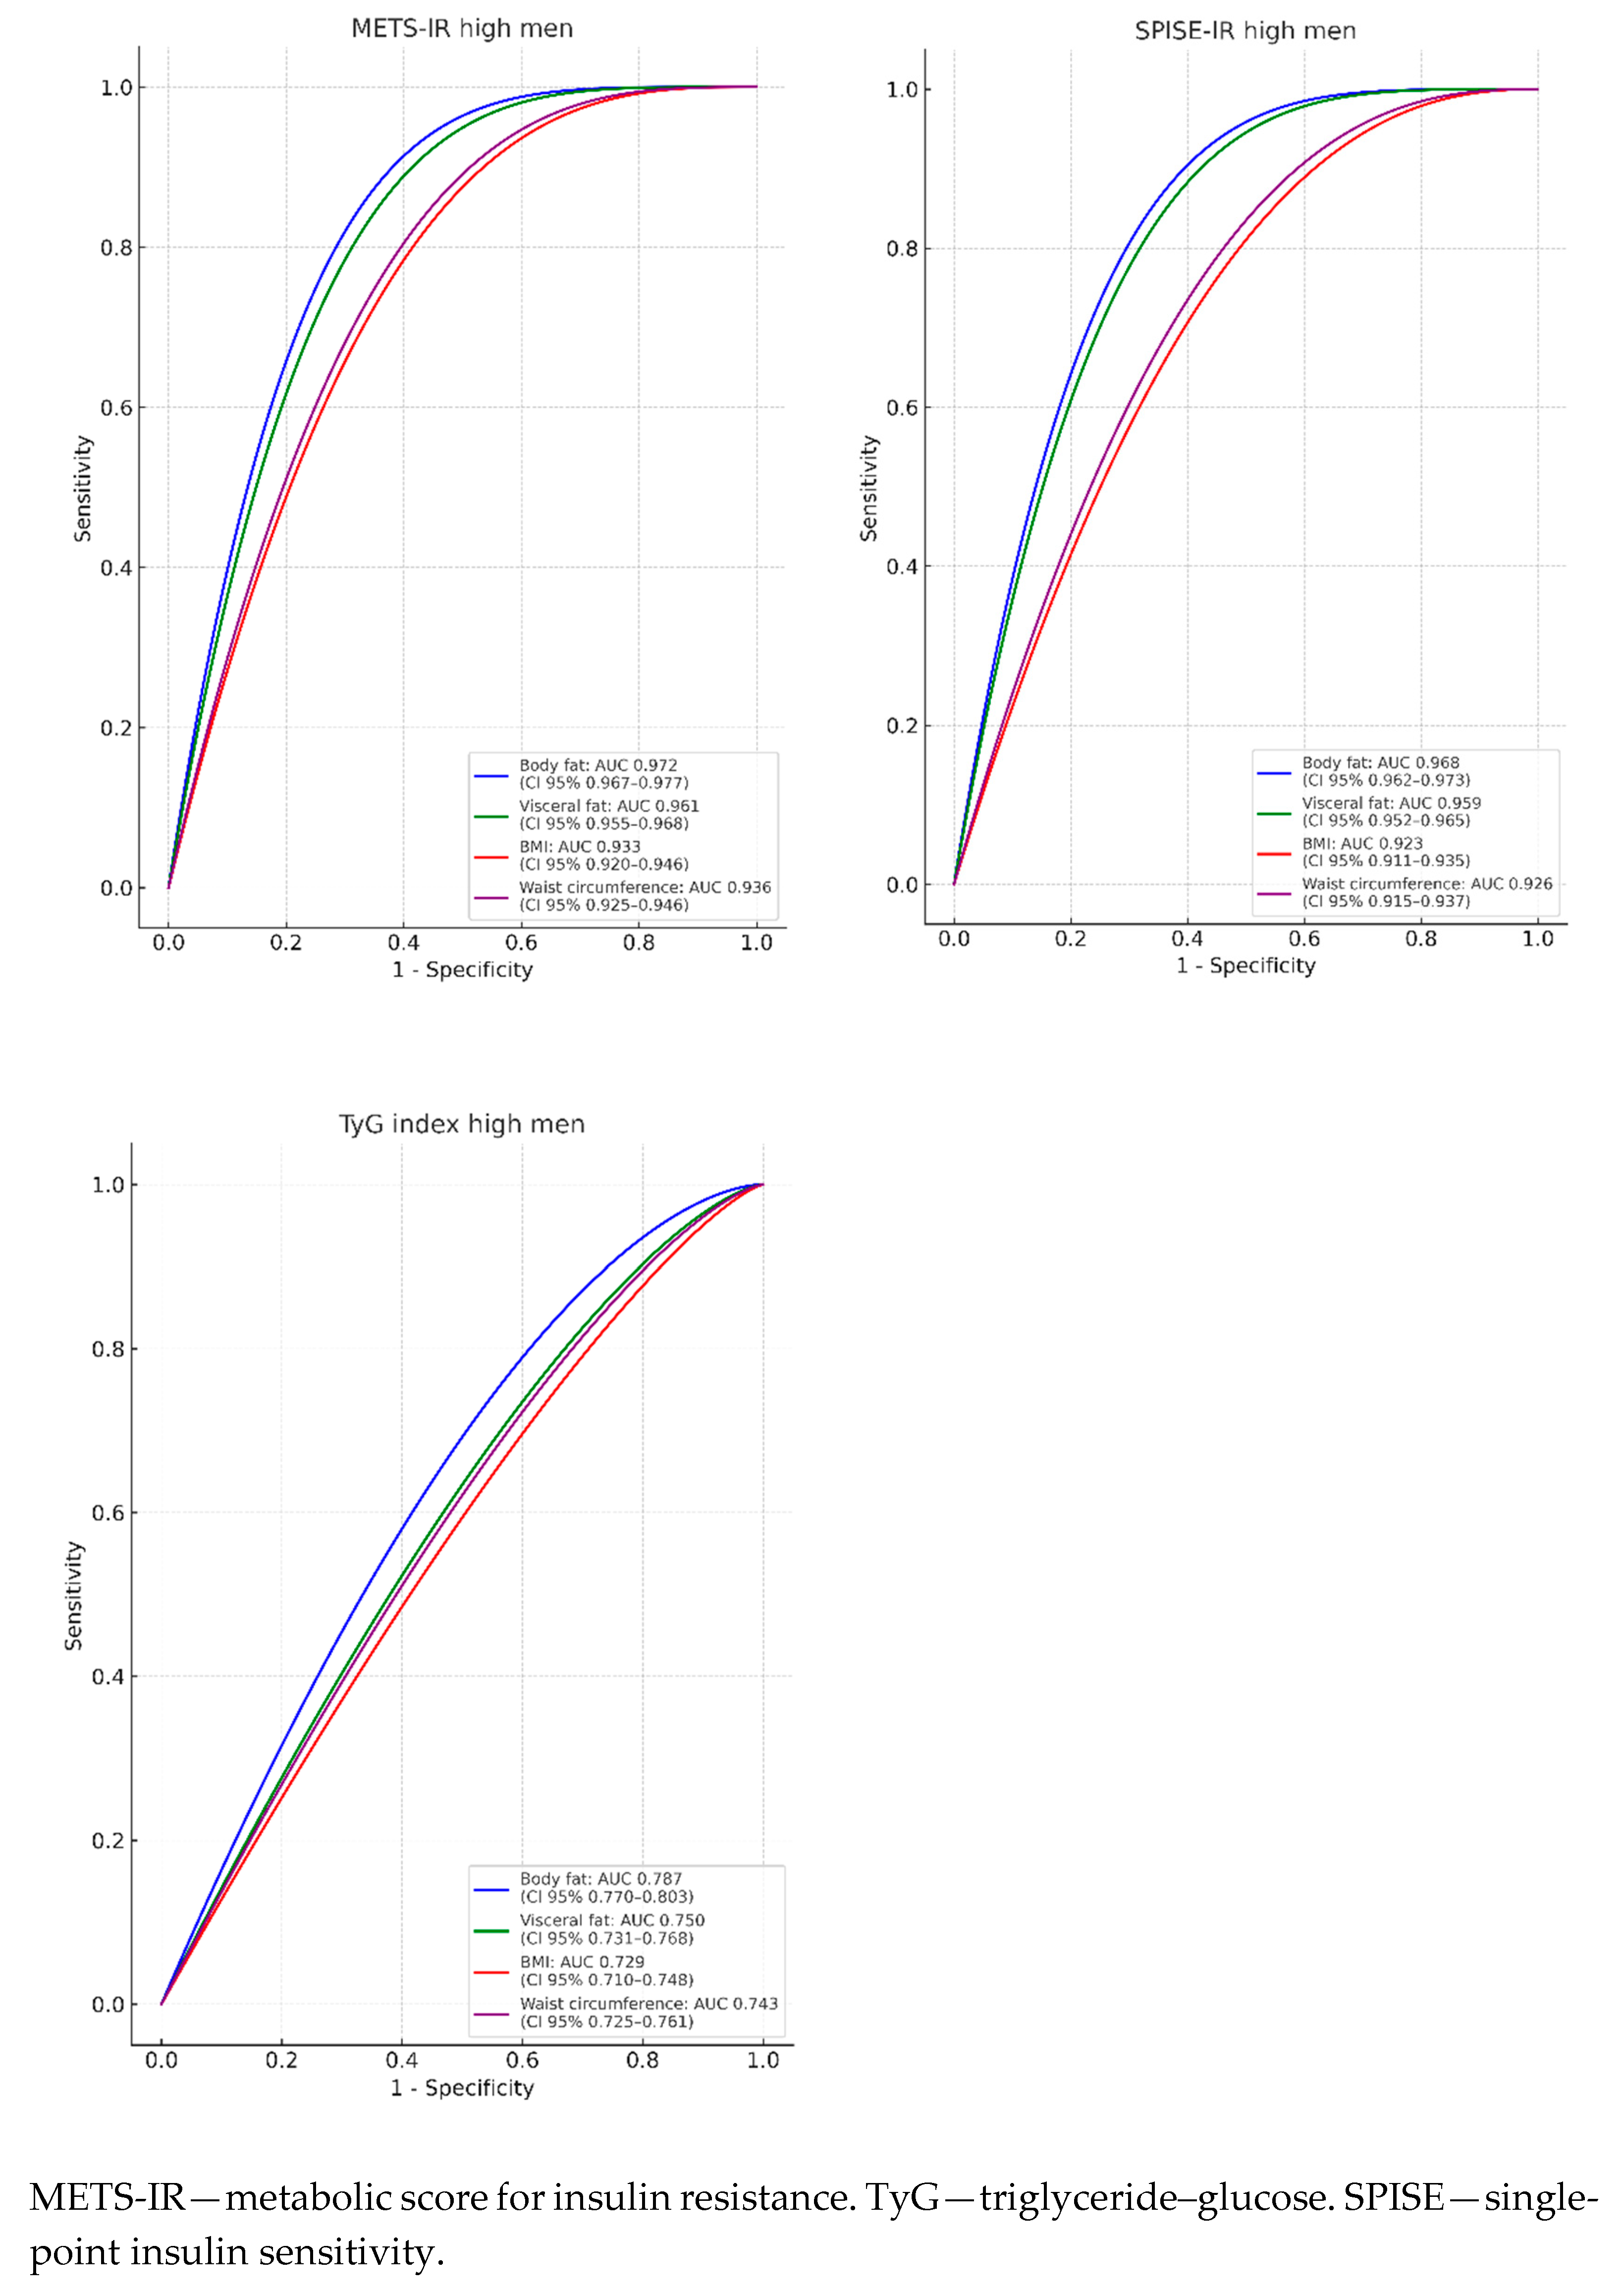
| Men n = 4104 | AUC (95% CI) | AUC (95% CI) | AUC (95% CI) | AUC (95% CI) |
| METS-IR high | 0.972 (0.967–0.977) | 0.961 (0.955–0.968) | 0.933 (0.920–0.946) | 0.936 (0.925–0.946) |
| TyG index high | 0.787 (0.770–0.803) | 0.750 (0.731–0.768) | 0.729 (0.710–0.748) | 0.743 (0.725–0.761) |
| SPISE-IR high | 0.968 (0.962–0.973) | 0.959 (0.952–0.965) | 0.923 (0.911–0.935) | 0.926 (0.915–0.937) |
| Body Fat | Visceral Fat | BMI | Waist | |
|---|---|---|---|---|
| Women n = 4486 | cut-off-sens-specif-Youden | cut-off-sens-specif-Youden | cut-off-sens-specif-Youden | cut-off-sens-specif-Youden |
| METS-IR high | 38.2-94.1-92.3-0.864 | 8.0-94.0-92.3-0.863 | 29.8-91.5-91.1-0.826 | 92.0-95.4-89.9-0.853 |
| TyG index high | 38.0-74.6-74.6-0.492 | 8.0 -74.6-74.4-0.490 | 29.7-72.8-72.5-0.453 | 92.0-73.4-73.2-0.466 |
| SPISE-IR high | 37.3-93.0-92.4-0.854 | 8.0-92.5-92.3-0.848 | 29.5-90.4-89.4-0.798 | 92.0-92.0-92.0-0.840 |
| Men n = 4104 | cut-off-sens-specif-Youden | cut-off-sens-specif-Youden | cut-off-sens-specif-Youden | cut-off-sens-specif-Youden |
| METS-IR high | 25.3-91.2-90.5-0.817 | 11.0-87.5-86.5-0.740 | 29.4-6.0-85.9-0.719 | 98.0-87.2-86.5-0.737 |
| TyG index high | 25.0-72.9-71.2-0.441 | 11.0-71.8-68.8-0.406 | 29.4-67.9-67.3-0.352 | 98.0- 69.5-69.1-0.386 |
| SPISE-IR high | 24.5-90.4-90.3-0.807 | 11.0-88.3-87.5-0.758 | 29.0-96.2-83.7-0.704 | 98.0-5.7-84.9-0.706 |
| Pearson | Cohen’s Kappa | ||||||
|---|---|---|---|---|---|---|---|
| Women | TyG index | METS-IR | SPISE-IR | Women | TyG index high | METS-IR high | SPISE-IR high |
| TyG index | 1 | 0.643 | 0.707 | TyG index high | 1 | 0.351 | 0.423 |
| METS-IR | 1 | 0.987 | METS-IR high | 1 | 0.861 | ||
| SPISE-IR | 1 | SPISE-IR high | 1 | ||||
| Men | TyG index | METS-IR | SPISE-IR | Men | TyG index high | METS-IR high | SPISE-IR high |
| TyG index | 1 | 0.552 | 0.620 | TyG index high | 1 | 0.487 | 0.385 |
| METS-IR | 1 | 0.984 | METS-IR high | 1 | 0.823 | ||
| SPISE-IR | 1 | SPISE-IR high | 1 |
Disclaimer/Publisher’s Note: The statements, opinions and data contained in all publications are solely those of the individual author(s) and contributor(s) and not of MDPI and/or the editor(s). MDPI and/or the editor(s) disclaim responsibility for any injury to people or property resulting from any ideas, methods, instructions or products referred to in the content. |
© 2025 by the authors. Licensee MDPI, Basel, Switzerland. This article is an open access article distributed under the terms and conditions of the Creative Commons Attribution (CC BY) license (https://creativecommons.org/licenses/by/4.0/).
Share and Cite
Gordito Soler, M.; Tárraga López, P.J.; López-González, Á.A.; Paublini, H.; Martínez-Almoyna Rifá, E.; Vicente-Herrero, M.T.; Ramírez-Manent, J.I. Is Measuring BMI and Waist Circumference as Good in Assessing Insulin Resistance as Using Bioelectrical Impedance to Measure Total Body Fat and Visceral Fat? Diabetology 2025, 6, 32. https://doi.org/10.3390/diabetology6040032
Gordito Soler M, Tárraga López PJ, López-González ÁA, Paublini H, Martínez-Almoyna Rifá E, Vicente-Herrero MT, Ramírez-Manent JI. Is Measuring BMI and Waist Circumference as Good in Assessing Insulin Resistance as Using Bioelectrical Impedance to Measure Total Body Fat and Visceral Fat? Diabetology. 2025; 6(4):32. https://doi.org/10.3390/diabetology6040032
Chicago/Turabian StyleGordito Soler, María, Pedro Juan Tárraga López, Ángel Arturo López-González, Hernán Paublini, Emilio Martínez-Almoyna Rifá, María Teófila Vicente-Herrero, and José Ignacio Ramírez-Manent. 2025. "Is Measuring BMI and Waist Circumference as Good in Assessing Insulin Resistance as Using Bioelectrical Impedance to Measure Total Body Fat and Visceral Fat?" Diabetology 6, no. 4: 32. https://doi.org/10.3390/diabetology6040032
APA StyleGordito Soler, M., Tárraga López, P. J., López-González, Á. A., Paublini, H., Martínez-Almoyna Rifá, E., Vicente-Herrero, M. T., & Ramírez-Manent, J. I. (2025). Is Measuring BMI and Waist Circumference as Good in Assessing Insulin Resistance as Using Bioelectrical Impedance to Measure Total Body Fat and Visceral Fat? Diabetology, 6(4), 32. https://doi.org/10.3390/diabetology6040032