Systematic Review

Efficacy of Hyperbaric Oxygen Therapy in Diabetic Retinopathy and Macular Edema: A Systematic Review and Meta-Analysis

1
Special Forces Group of the Italian Navy, 19025 Le Grazie, Italy
2
Department of Ophthalmology, Riga Stradins University, 13 Pilsoņu Iela, LV-1010 Riga, Latvia
3
Center for Neuroscience, School of Advanced Studies, University of Camerino, 62032 Camerino, Italy
4
Latvian American Eye Center (LAAC), LV-1010 Riga, Latvia
5
Hyperbaric Centre, 48124 Ravenna, Italy
6
Italian Navy, 74121 Taranto, Italy
7
Institute of Clinical Physiology, National Research Council, 56100 Pisa, Italy
8
Department of Surgical, Medical, Molecular Pathology and Critical Care Medicine, University of Pisa, 56126 Pisa, Italy
*
Author to whom correspondence should be addressed.
These authors contributed equally to this work.
Diabetology 2025, 6(11), 133; https://doi.org/10.3390/diabetology6110133
Submission received: 30 August 2025 / Revised: 28 September 2025 / Accepted: 15 October 2025 / Published: 1 November 2025

Abstract

Background: Diabetic retinopathy (DR) and diabetic macular edema (DME) are major causes of vision loss in diabetes. Hyperbaric oxygen therapy (HBOT) has been explored as an adjunctive treatment due to its potential to enhance oxygenation, reduce inflammation, and lower oxidative stress in retinal tissues. This systematic review and meta-analysis assessed HBOT’s efficacy in improving best-corrected visual acuity (BCVA) and central macular thickness (CMT). Methods: A comprehensive search across major databases up to May 2025 identified five eligible studies involving 463 eyes. Results: Pooled data showed HBOT significantly improved BCVA (mean difference—0.05 LogMAR; 95% CI: −0.09 to −0.01; p < 0.05) with no heterogeneity (I2 = 0%), suggesting consistent functional benefit. However, sensitivity analysis revealed this effect was fragile, losing significance when the largest study was excluded. For CMT, HBOT was associated with a significant reduction (−75.21 (95% CI −90.04 to −60.38; p < 0.05), though heterogeneity was high (I2 = 62%), likely due to differences in patient profiles and treatment combinations. Conclusions: While HBOT shows potential in managing DR and DME, further robust randomized trials are needed to validate its clinical utility and define optimal treatment protocols

1. Introduction

1.1. Rationale

Diabetic retinopathy (DR) and diabetic macular edema (DME) remain leading causes of visual loss in people with diabetes. Across DR/DME phenotypes, a shared denominator is retinal hypoxia with downstream VEGF-mediated permeability, blood–retinal barrier (BRB) breakdown, and neuro-vascular dysfunction [1,2]. While standard-of-care therapies—particularly intravitreal anti-VEGF agents and corticosteroids—are effective in many cases, residual unmet needs persist in refractory or recurrent edema and in patients with mixed ischemic/edematous phenotypes [3].
Hyperbaric oxygen therapy (HBOT)—intermittent inhalation of 100% O2 at 2.0–3.0 ATA in a pressurized chamber—acutely increases arterial and tissue oxygen tensions and may modulate key DR/DME mechanisms, including hypoxia-sensing (HIF–VEGF pathways), endothelial integrity/BRB, oxidative–inflammatory tone, and ocular microperfusion [4,5]. Through these pleiotropic effects, HBOT provides a biologically plausible rationale for reducing edema/permeability—captured anatomically by central macular thickness (CMT)—and for achieving a measurable functional impact on best-corrected visual acuity (BCVA) [4,5]. Acute hemodynamic changes consistent with improved ocular perfusion under hyperoxia have also been reported (e.g., increases in ophthalmic artery peak systolic velocity after a single HBOT session) [6].
Despite this rationale, clinical evidence is fragmented across designs (randomized vs. before–after), patient spectra, and protocols (HBOT alone vs. HBOT + anti-VEGF) [4,5]. Moreover, reported outcomes are not always mechanistically aligned, making it challenging to link HBOT’s biological actions to clinically relevant effects.

1.2. Background

DR’s pathogenesis is highly complex, involving prolonged biochemical and metabolic abnormalities in retinal cells. Initially considered a microangiopathy of the retina, recent studies highlight that microvascular damage is only part of a broader retinal dysfunction [1,2]. Apoptosis of cells in all retinal layers has been observed in diabetic models and human post-mortem analyses, suggesting that neurodegeneration, alongside vascular changes, significantly contributes to DR [7]. However, the precise interaction between these pathologies and their collective role in retinal damage remains unclear. A “feed-forward” mechanism of vascular–neural dysfunction, proposed by Antonetti et al., postulates that accumulated injuries and failed reparative responses drive the clinical features of DR [2].
Chronic hyperglycemia triggers several interrelated biochemical pathways that contribute to DR’s progression. These include the polyol pathway, protein kinase C (PKC) activation, advanced glycation end-product (AGE) formation, oxidative stress, inflammation, and hypoxia [8]. Oxidative stress plays a central role in linking these pathways, as high glucose levels generate reactive oxygen species (ROS) through glucose metabolism and AGE–receptor interactions. Excess ROS overwhelm endogenous antioxidant defenses, oxidizing biomolecules like DNA, proteins, and lipids. This oxidative damage leads to mitochondrial dysfunction and apoptosis in retinal cells. Studies show that antioxidants can suppress hyperglycemia-induced ROS production, prevent mitochondrial dysfunction, and normalize retinal inflammation, highlighting their therapeutic potential [9,10].
Inflammation is another critical factor in DR. Hyperglycemia triggers an inflammatory response by increasing levels of pro-inflammatory cytokines and chemokines, which damage the retinal vasculature. Leukocyte adhesion to retinal endothelial cells leads to the breakdown of the blood–retinal barrier (BRB), vascular permeability, and endothelial cell loss [11]. Inflammatory mediators like NF-kB play a key role in amplifying this response, leading to cytokine production, cell apoptosis, and neovascularization. Experimental models have shown that anti-inflammatory therapies, including glucocorticoids and aspirin, can inhibit DR development and reduce retinal inflammation, offering potential therapeutic strategies [12].
Retinal hypoxia is another significant contributor to DR. Oxygen delivery deficits are observed early in the disease, with hypoxia exacerbated by capillary dropout and ischemia [13]. Hypoxia stimulates angiogenesis through the upregulation of hypoxia-inducible factor-1 alpha (HIF-1α) and vascular endothelial growth factor (VEGF).
Angiogenesis, a hallmark of PDR, involves the formation of abnormal vascular networks in response to hypoxia and other metabolic stressors. In diabetic retinas, proangiogenic factors like VEGF dominate, while antiangiogenic mediators are reduced, shifting the balance toward pathological angiogenesis [14]. Newly formed vessels are fragile and prone to leakage, further exacerbating retinal damage. While anti-VEGF treatments address neovascularization, they may not fully prevent fibrosis and tractional retinal detachment, highlighting the need for complementary therapies [15,16].
DME, a common feature in both NPDR and PDR, is a major cause of vision impairment. It is driven by increased retinal vascular permeability, hypoxia, and oxidative stress. Enzymes like superoxide dismutase (SOD), catalase (CAT), and glutathione reductase (GSR) play crucial roles in mitigating oxidative damage.

1.3. Objectives

This systematic review aims to evaluate the efficacy of hyperbaric oxygen therapy (HBOT) as a therapeutic intervention or as an adjunctive treatment for diabetic retinopathy (DR) and diabetic macular edema (DME). The primary objectives are: (1) to determine whether HBOT improves anatomical outcomes, such as central macular thickness; and (2) to assess its effects on functional outcomes, particularly on best-corrected visual acuity. Ultimately, this review seeks to clarify whether HBOT can be considered a supportive treatment option for patients with DR and DME, either as a standalone therapy or in combination with pharmacological treatments.

2. Materials and Methods

This systematic review and meta-analysis was conducted in accordance with the PRISMA 2020 guidelines for reporting systematic reviews [17]. This study was registered with the International Prospective Register of Systematic Reviews (CRD420250509858) and adhered to the tenets of the Declaration of Helsinki.

2.1. Eligibility Criteria

Randomized and not-randomized controlled trials, and cross-sectional studies published in the English language in peer-reviewed journals, discussing the role of hyperbaric oxygen as treatment of diabetic retinopathy and macular edema were included.
The proposed review answered the following questions: In diabetic retinopathy, can hyperbaric oxygen therapy be considered as a supportive treatment option? What are the benefits and variations in outcomes concerning different HBOT treatment methodologies?

2.2. Search Strategy

Literature search strategies were developed using medical subject headings (MeSH) and text words. We searched MEDLINE (OVID and PubMed), ScienceDirect, Scopus, LILACS and the Cochrane Library (Wiley) from 4 February 2024 to May 2025. The following combination of search keywords and MeSH terms were utilized: (Hyperbaric oxygen therapy) AND (diabetic retinopathy (DR); (Hyperbaric oxygen therapy) AND (diabetic macular edema (DME).
Two of the authors (G.C. and V.R) independently performed the research, screening for eligibility. They independently extracted the data using predetermined forms. Research records were compared to eliminate duplicates. Discrepancies were resolved by agreement between the reviewers or with a third reviewer (E.M.). Data extracted from every study will include the last name of the first author, year of publication, study design, sample size, purpose, anatomical outcome, visual outcome, and pathogens studied.

2.3. Data Extraction

Data extraction was conducted systematically following standardized guidelines to ensure consistency and accuracy. Two independent reviewers (G.C. and V.R.) extracted data from each included study using a predefined data extraction form. The extracted variables encompassed study characteristics (authors, year of publication, study design, sample size), patient demographics (age, sex, baseline disease severity), intervention details (HBOT protocols, treatment duration, combination with pharmacological therapies), and outcome measures (central macular thickness [CMT], best-corrected visual acuity [BCVA], and reported adverse events).
To ensure data accuracy, the reviewers cross-checked the extracted information, and discrepancies were resolved through discussion. In cases of persistent disagreement, a third investigator (E.M.) was consulted to reach a consensus. Whenever possible, missing data were requested from the original study authors. If data were not available, standard imputation methods were applied, such as estimating standard deviations from reported confidence intervals or interquartile ranges.
Data extraction was performed using Microsoft Excel for structured tabulation and organization. Extracted values underwent a final verification step before being included in the meta-analysis, ensuring consistency between the reported and analyzed data.

2.4. Certainty of Evidence Assessment

Quality of Evidence was assessed using the Grading of Recommendations Assessment, Development and Evaluation (GRADE) system [18]. The certainty of the evidence for each outcome was assessed using the GRADE (Grading of Recommendations Assessment, Development and Evaluation) approach, through the GRADEpro GDT software (https://gradepro.org (accessed on 9 June 2025)). For each comparison (hyperbaric oxygen therapy vs. standard therapy), the following domains were considered: risk of bias, inconsistency, indirectness, imprecision, and other factors (such as publication bias, large effect, dose–response gradient, or plausible confounding). The overall certainty of evidence was rated as high, moderate, low, or very low.
Outcomes were selected based on clinical relevance and categorized as “critical” or “important” for decision-making.

2.5. Statistical Analysis

The meta-analysis aimed to evaluate the effect of hyperbaric oxygen therapy (HBOT) on best-corrected visual acuity (BCVA) and Central Macular thickness (CMT) in patients with diabetic retinopathy (DR) and diabetic macular edema (DME).

2.5.1. Data Transformation and Standardization

BCVA outcomes across the included studies were reported in various formats, such as ETDRS letters, Snellen equivalents, and logMAR scores. For consistency, all visual acuity measurements were standardized to logMAR using validated transformation formulas:
  • From ETDRS Letters [19,20]:
    logMAR = 1.0 − (ETDRS Letters/50).
  • From Snellen Equivalents [21]:
    logMAR = −log10(Snellen Fraction).
For studies reporting medians and interquartile ranges (IQRs) or ranges instead of means and standard deviations (SDs), SDs were estimated using established methods [22]:
  • From IQR:
    SD = IQR/1.35.
  • From Range:
    SD = Range/4.
In cases where post-treatment SDs were not explicitly reported, baseline SDs were applied, as minimal variability was observed between pre- and post-treatment measures in specific studies.

2.5.2. Meta-Analytic Methodology

The meta-analysis employed a random effects model with the inverse variance method, which accounts for both within-study and between-study variability. The analysis parameters were as follows:
  • Model: Random Effects Model, selected to address clinical and methodological heterogeneity across studies.
  • Method: Inverse Variance, appropriate for continuous data such as BCVA.
  • Summary Measure: Mean Difference (MD), summarizing the difference in logMAR values between HBOT and control groups after standardization.

2.5.3. Heterogeneity Assessment

To address variability in interventions and study designs:
  • Studies comparing HBOT versus placebo/control were analyzed as one group.
  • Studies combining HBOT with pharmacological treatments (e.g., aflibercept) were treated as a distinct subgroup.
The I2 statistic quantified heterogeneity, with thresholds interpreted as follows [23]:
  • Low heterogeneity: I2 < 25%;
  • Moderate heterogeneity: 25% ≤ I2 < 75%;
  • High heterogeneity: I2 ≥ 75%;
  • Cochran’s Q test was used to assess the statistical significance of heterogeneity.

2.5.4. Handling Missing Standard Deviations for CMT

For studies that did not report standard deviations (SDs) for central macular thickness (CMT), SDs were estimated based on the variability observed in other included studies. Specifically, the SD was assumed to represent approximately 3% of the mean CMT value, as derived from studies where both mean and SD were reported.

2.5.5. Software and Statistical Rationale

The analysis was conducted using the Meta-Analysis Online platform (https://metaanalysisonline.com/ (accessed on 22 July 2025)). This platform implements robust statistical methods consistent with Cochrane and PRISMA guidelines.

3. Results

3.1. Study Selection

In total, 1835 records were retrieved from multiple databases including MEDLINE (41), Cochrane Library (9), LILACS (39), Scopus (916) and ScienceDirect (830). After removing duplicates (41 records) and records marked as ineligible by automatic tools (1779), 15 records were included in the screening process. After full-text reading, 5 articles were taken into consideration in the systematic review. Figure 1 summarizes the PRISMA flow diagram.
A total of 1835 records were identified through five electronic databases. After removing duplicates and entries excluded by automation tools, 15 records were screened, of which 10 were excluded. Five full-text articles were assessed for eligibility, all of which were included in the final qualitative and quantitative synthesis.

3.2. Study Characteristics

Of these five studies, one was a randomized, single-center, double-blinded and placebo-controlled clinical trial [24], 2 were prospective non-randomized trials [25,26], one was a cross-sectional study [27], and one was an open-label, controlled study [8]. Table 1 and Table 2 provide a summary of the main characteristics of the included studies.

3.3. Risk of Bias

3.3.1. Risk of Bias in Randomized Studies

The randomized, double-blind, placebo-controlled trial by Sellman et al. [24] was assessed using the Cochrane RoB 2 tool and judged to be at low risk of bias across all five domains, including the randomization process, adherence to intended interventions, completeness of outcome data, objectivity of outcome measurement, and selective reporting (Figure 2).

3.3.2. Risk of Bias in Non-Randomized Studies

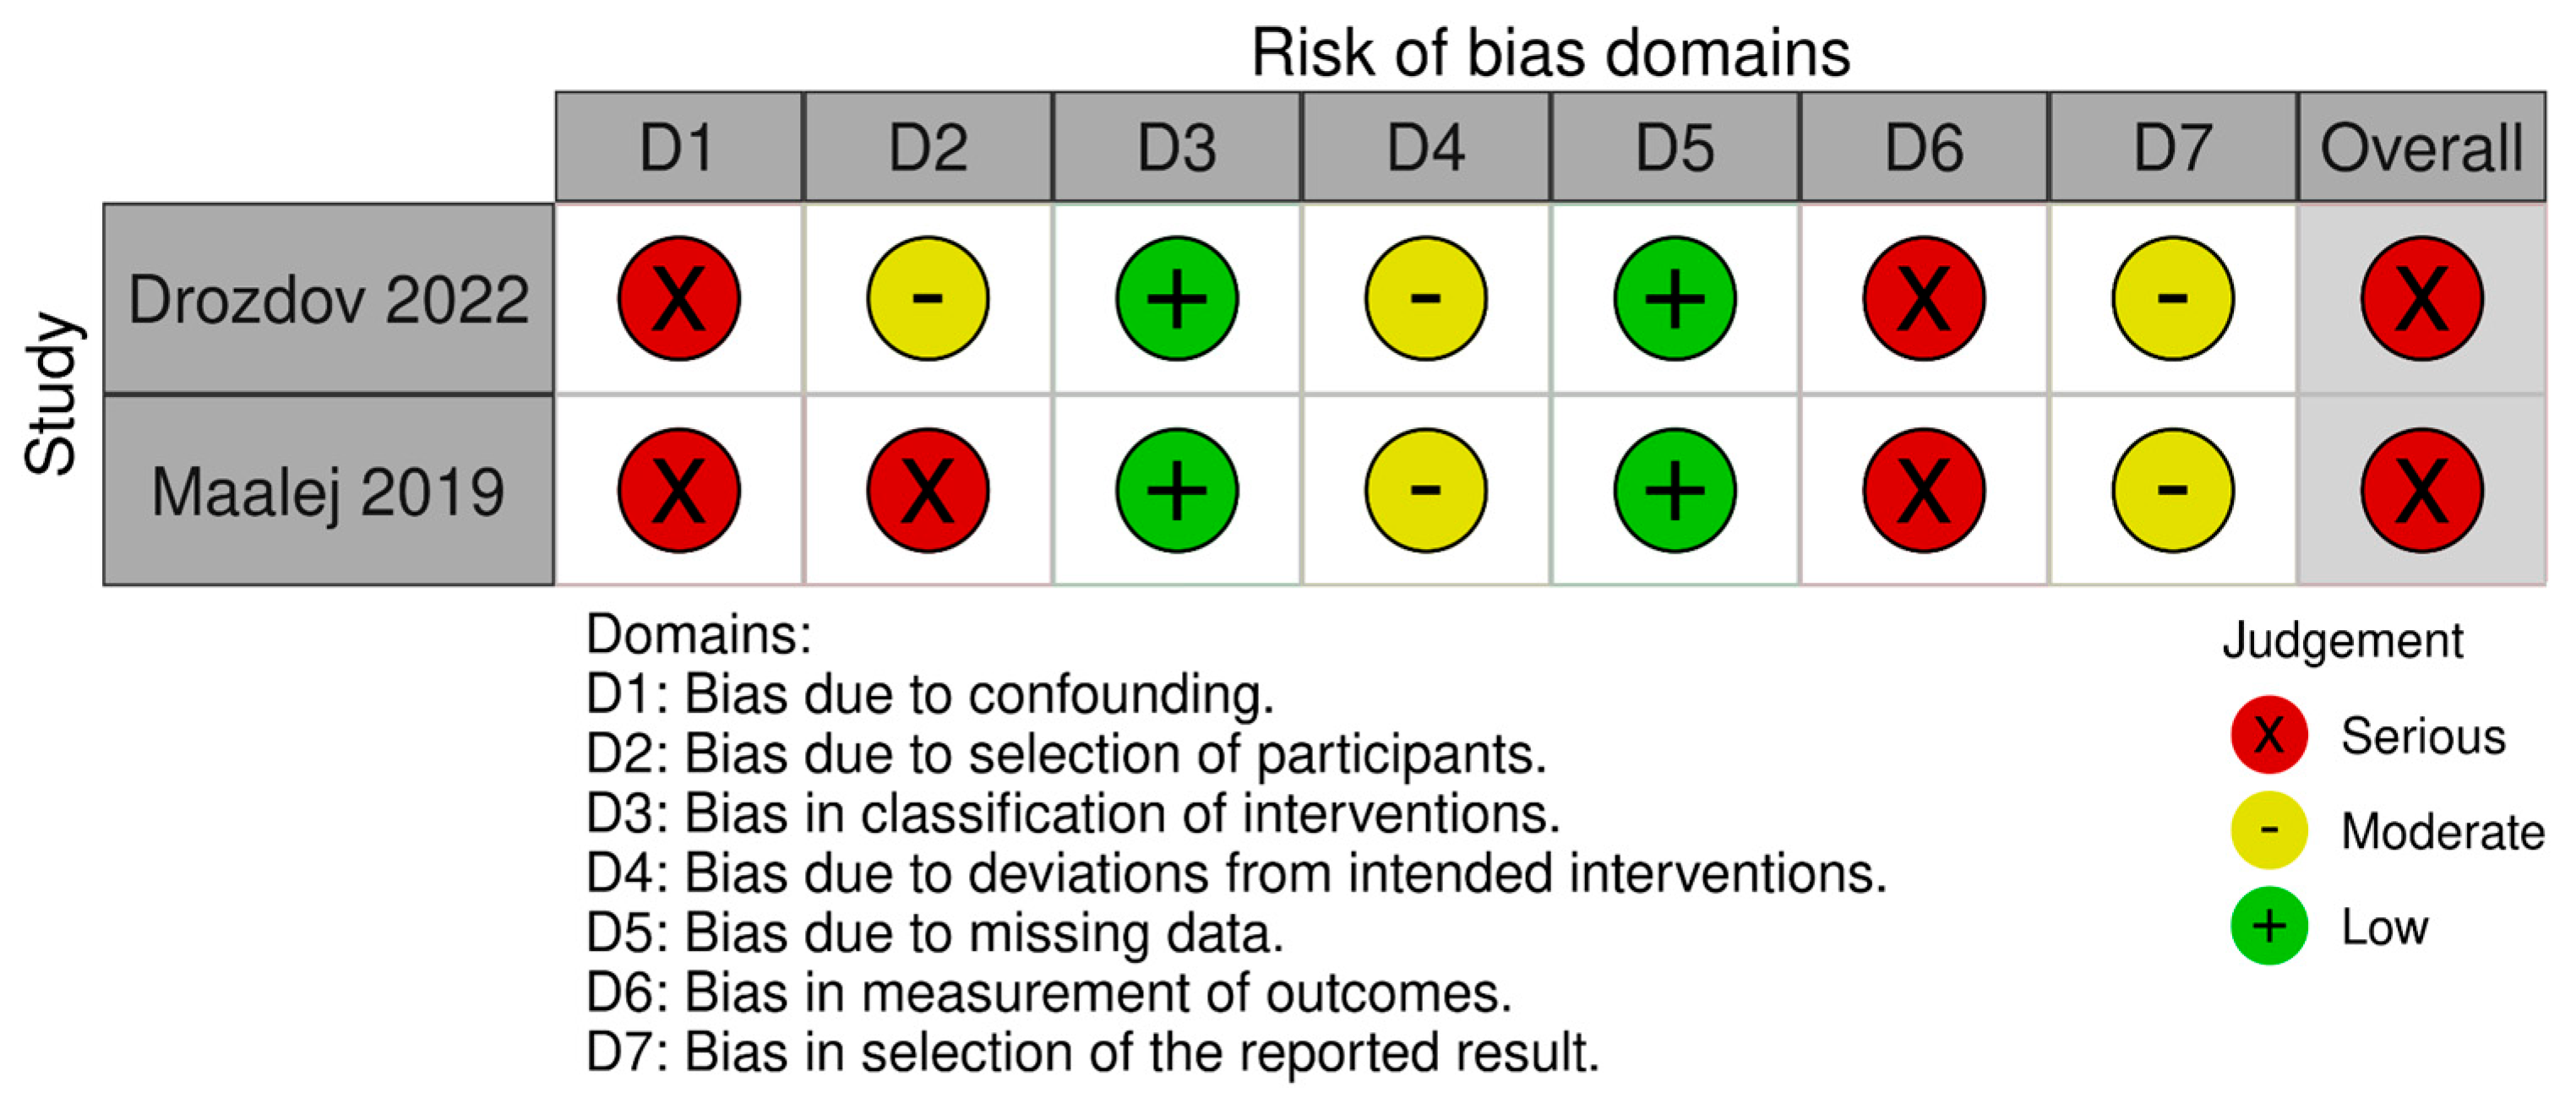
The risk of bias for non-randomized intervention studies was assessed using the ROBINS-I tool (version 22 November 2024), as shown in Figure 3. Both Drozdov et al. [8] and Maalej et al. [25] were judged to have a serious overall risk of bias. In both cases, there was no evidence of adjustment for important baseline confounders, leading to a serious risk of bias due to confounding. Additionally, the selection of participants into intervention groups appeared to be influenced by clinical decisions, with no matching or statistical control, especially in the retrospective study by Maalej et al. The classification of interventions was clearly defined in both studies (low risk), while deviations from intended interventions and outcome measurement raised moderate to serious concerns due to the lack of blinding and potential detection bias. Reporting bias was also judged as moderate in both cases due to the absence of pre-registered protocols.

3.3.3. Risk of Bias in Before–After Studies

The methodological quality of the before–after studies by Gun et al. [27] and Kaldırım et al. [26] was assessed using the NIH Quality Assessment Tool for Before–After (Pre–Post) Studies With No Control Group, as recommended for uncontrolled intervention designs. Both studies received an overall judgment of moderate risk of bias, as shown in Table 3.
In Gun et al. [27], the study objective and outcome measures were clearly reported, and statistical analyses were appropriate; however, the sample size was limited, and the completeness of participant enrollment was not fully described.
Kaldırım et al. [26] similarly reported valid outcome measures and appropriate pre–post comparisons, but lacked information regarding participant selection and recruitment procedures, and did not include repeated measurements over time. These limitations reduce confidence in the internal validity of the findings and suggest caution when interpreting the observed effects.
Summary of the quality assessment for the before–after studies by Gun et al. [27] and Kaldırım et al. [26] using the NIH Quality Assessment Tool. The table reports the evaluation of 12 key criteria, including clarity of study objectives, eligibility and selection criteria, representativeness of participants, sample size adequacy, clarity and consistency of interventions, reliability of outcome measures, blinding, loss to follow-up, statistical analysis, and repeated outcome measurements. NR: not reported; NA: not applicable.

3.4. Subgroup Analyses and Synthetic Control Group Estimation

3.4.1. Pre-Specified Sub-Groups

  • To minimize clinical heterogeneity, two meta-analytic strata were defined as a priori:
    HBOT + pharmacologic agent—studies delivering hyperbaric oxygen therapy (HBOT) together with an intravitreal drug (anti-VEGF or implant).
  • HBOT without an internal control—prospective cohorts lacking a true comparator arm; here a synthetic control arm was generated, as detailed below.

3.4.2. Source of the Synthetic Baseline

For Kaldırım et al. [26]—the only eligible study without a control group—baseline best-corrected visual acuity (BCVA) were imputed from the placebo group reported by Sellman et al. [24], while baseline central macular thickness (CMT) were imputed from the non-proliferative diabetic retinopathy/no-CSME (NPDR/CSME–) subgroup reported by Querques et al. [28].
Both investigations used the same device (Heidelberg Spectralis SD-OCT) and excluded clinically significant macular oedema, yielding comparable imaging protocols. Mean ± SD values (CMT = 294.5 ± 23.5 µm; BCVA = 0.05 ± 0.09 logMAR) from Querques et al. [28] were therefore entered as the synthetic baseline for the Kaldırım et al. [26] cohort. Cross-trial comparison showed no significant sex imbalance (70% vs. 59% male; Fisher’s p = 0.38) and only a modest, non-significant 4-year age gap within one pooled SD (Student’s t = 1.9, p = 0.06), indicating that age and sex were unlikely confounders of anatomic outcomes.

3.4.3. Ethnicity Rationale

A systematic search of Spectralis SD-OCT cohorts containing NPDR/CSME- eyes yielded no Turkish dataset. Among the remaining studies, the Italian series reported by Querques et al. [28] was chosen as the synthetic baseline because Anatolian and Italian populations both belong to the Mediterranean-Caucasian cluster, which shows only minimal intra-group variation in macular biometry [11,12,13]. By contrast, Spectralis norms from Indian and Asian eyes are systematically thinner and reflect distinct chorioretinal metrics, introducing a larger cross-ethnic bias [29,30]. In the absence of a stage-matched Turkish cohort, pairing the Turkish HBOT sample with the Italian Mediterranean reference therefore represents the closest demographic and biometric match for constructing the synthetic control arm.

3.5. Synthesis of Results

Certainty of the Evidence (GRADE)

The GRADE Summary of Findings Table (Table 4) presents the main outcomes.
Visual Acuity (5 non-randomized studies, number of patients (n) = 156) was rated as moderate certainty, downgraded for risk of bias due to lack of randomization.
Central Macular Thickness (4 studies) was assessed as very low certainty, due to risk of bias, inconsistency, and imprecision.
Diabetic Retinopathy Progression (2 studies) was rated as very low certainty, with downgrades for risk of bias, indirectness, and imprecision.
Need for Rescue Treatment (2 studies) was considered low certainty, downgraded for risk of bias and imprecision.
All outcomes were considered either critical or important for clinical decision-making. No meta-analysis was performed due to high clinical and methodological heterogeneity among studies.

3.6. Effects of Interventions

3.6.1. Visual Acuity

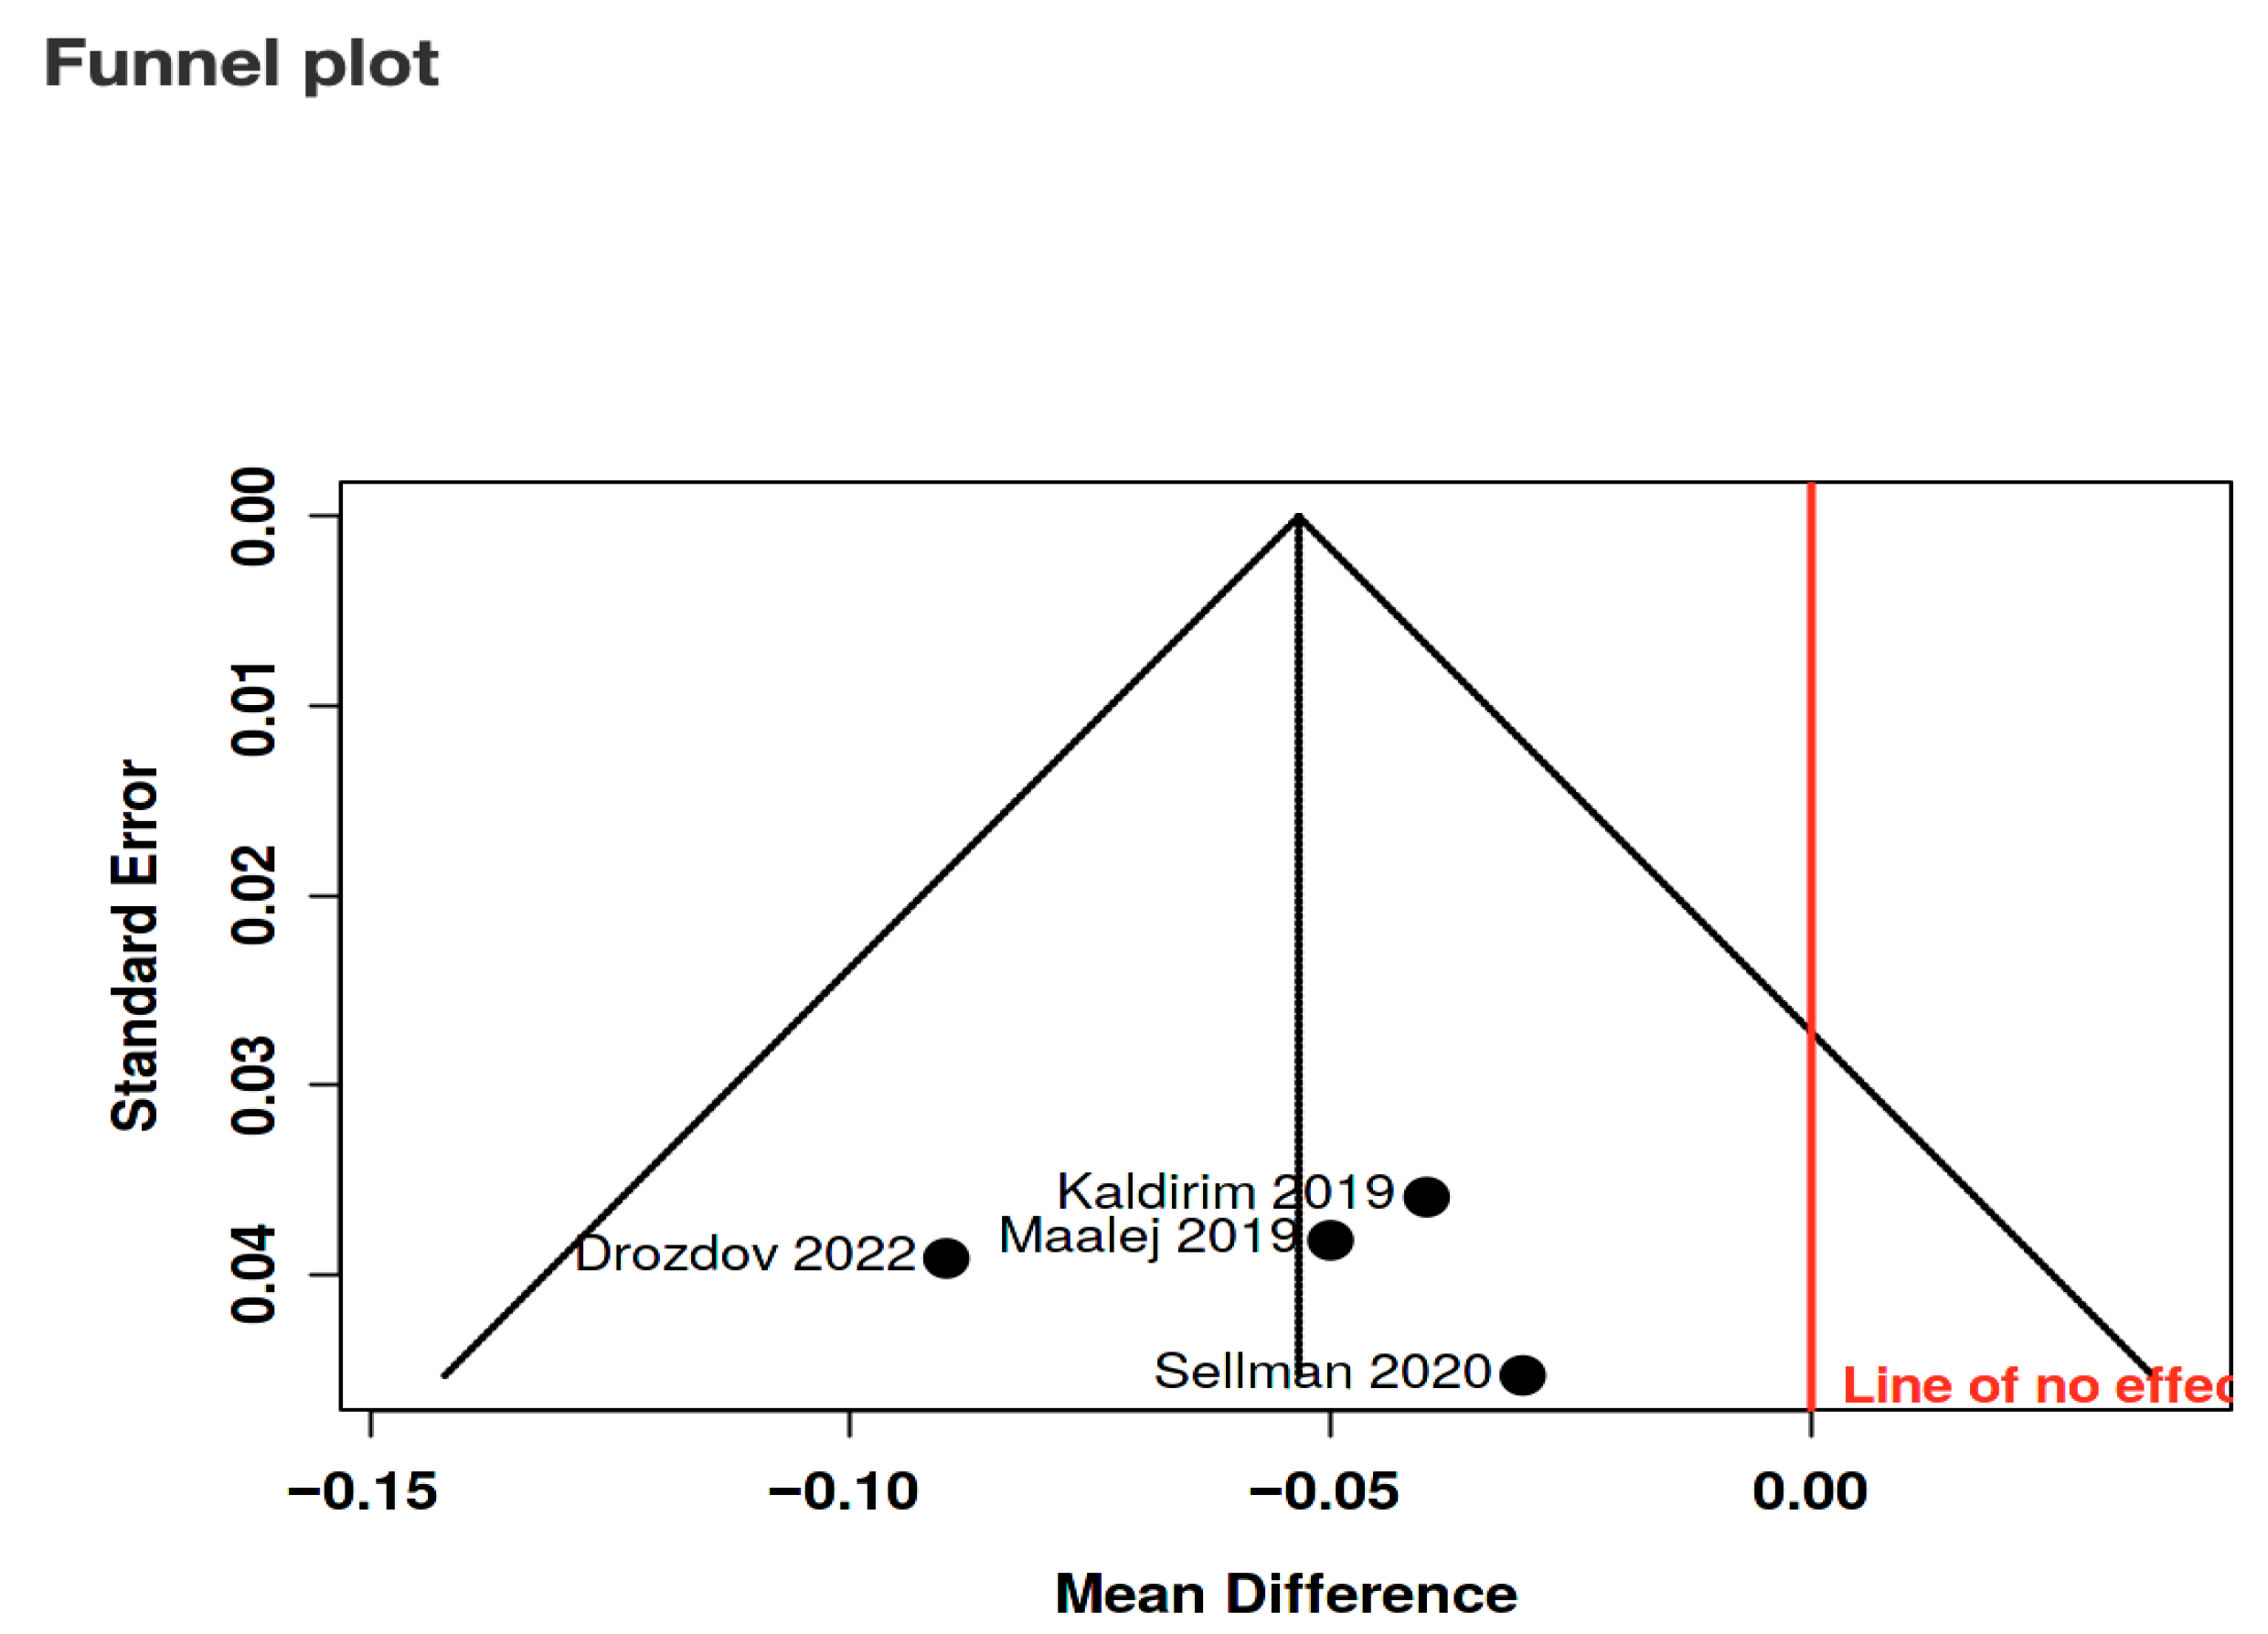
Best-corrected visual acuity (BCVA) is a pivotal metric in assessing treatment efficacy and disease progression in diabetic retinopathy (DR) and diabetic macular edema (DME). The meta-analysis standardized BCVA outcomes into logMAR to ensure consistency across studies. Forest plot and Funnel plot (Figure 4 and Figure 5, respectively) summarize the findings of the effects of HBOT on BCVA. The initial analysis included two studies: a randomized, single-center, double-blinded, and placebo-controlled clinical trial [24] and a prospective non-randomized study [25]. Adding two additional studies by Kaldırım et al. and Drozdov et al. [8,26] expanded the analysis to 144 participants in the experimental cohort and 112 in the control cohort. To address variations in design, two subgroups were analyzed:
  • HBOT vs. Control: Studies directly comparing HBOT to placebo or control interventions.
  • HBOT + Pharmacological Therapy vs. Pharmacological Therapy Alone: Studies evaluating HBOT as an adjunctive treatment with drugs like aflibercept.
Using a random effects model and inverse variance method there is a statistically significant difference between the two cohorts, the pooled mean difference (MD) for BCVA in logMAR was calculated as −0.05 (95% CI: −0.09–−0.01; p = 0.007). Additionally, heterogeneity was negligible (I2 = 0%), signifying consistency in effect sizes across these trials.
A leave-one-out procedure confirmed the stability of the pooled effect, with mean differences ranging from −0.04 to −0.06 logMAR. Statistical significance (p < 0.05) was retained when any single study was removed except Subgroup Drozdov 2022, in which case the confidence interval crossed the null (MD = −0.04 logMAR; 95% CI −0.09 to 0.00; p = 0.051).
Random-effects model (inverse variance) pooling four studies (144 eyes HBOT, 112 eyes control). The overall mean difference is −0.05 logMAR (95% CI −0.09 to −0.01; p = 0.007) with I2 = 0%, indicating no observed heterogeneity. Squares represent study-level effects sized by weight; horizontal lines show 95% CIs; the diamond denotes the pooled effect. Negative values favour HBOT. HBOT: hyperbaric oxygen therapy; BCVA: Best-corrected visual acuity; SD: standard deviation; CI: confidence interval.

3.6.2. Central Macular Thickness

This meta-analysis included three studies, comprising a total of 119 subjects in the HBOT group and 83 in the control group. The analysis, performed using a random-effects model with the inverse variance method, found a statistically significant reduction in CMT in the HBOT-treated group compared to controls, with a summarized standardized mean difference (SMD) of −75.21 (95% CI −90.04 to −60.38; p < 0.05), as shown in Figure 6.
Significant heterogeneity was detected across the included studies (p < 0.01), with an I2 value of 62%, indicating that most of the observed variability arose from differences in study characteristics rather than random chance. The high heterogeneity suggests that factors such as baseline disease severity, differences in HBOT treatment protocols, and the presence of adjunctive pharmacological treatments (e.g., Aflibercept) may have influenced the effect estimates across studies.
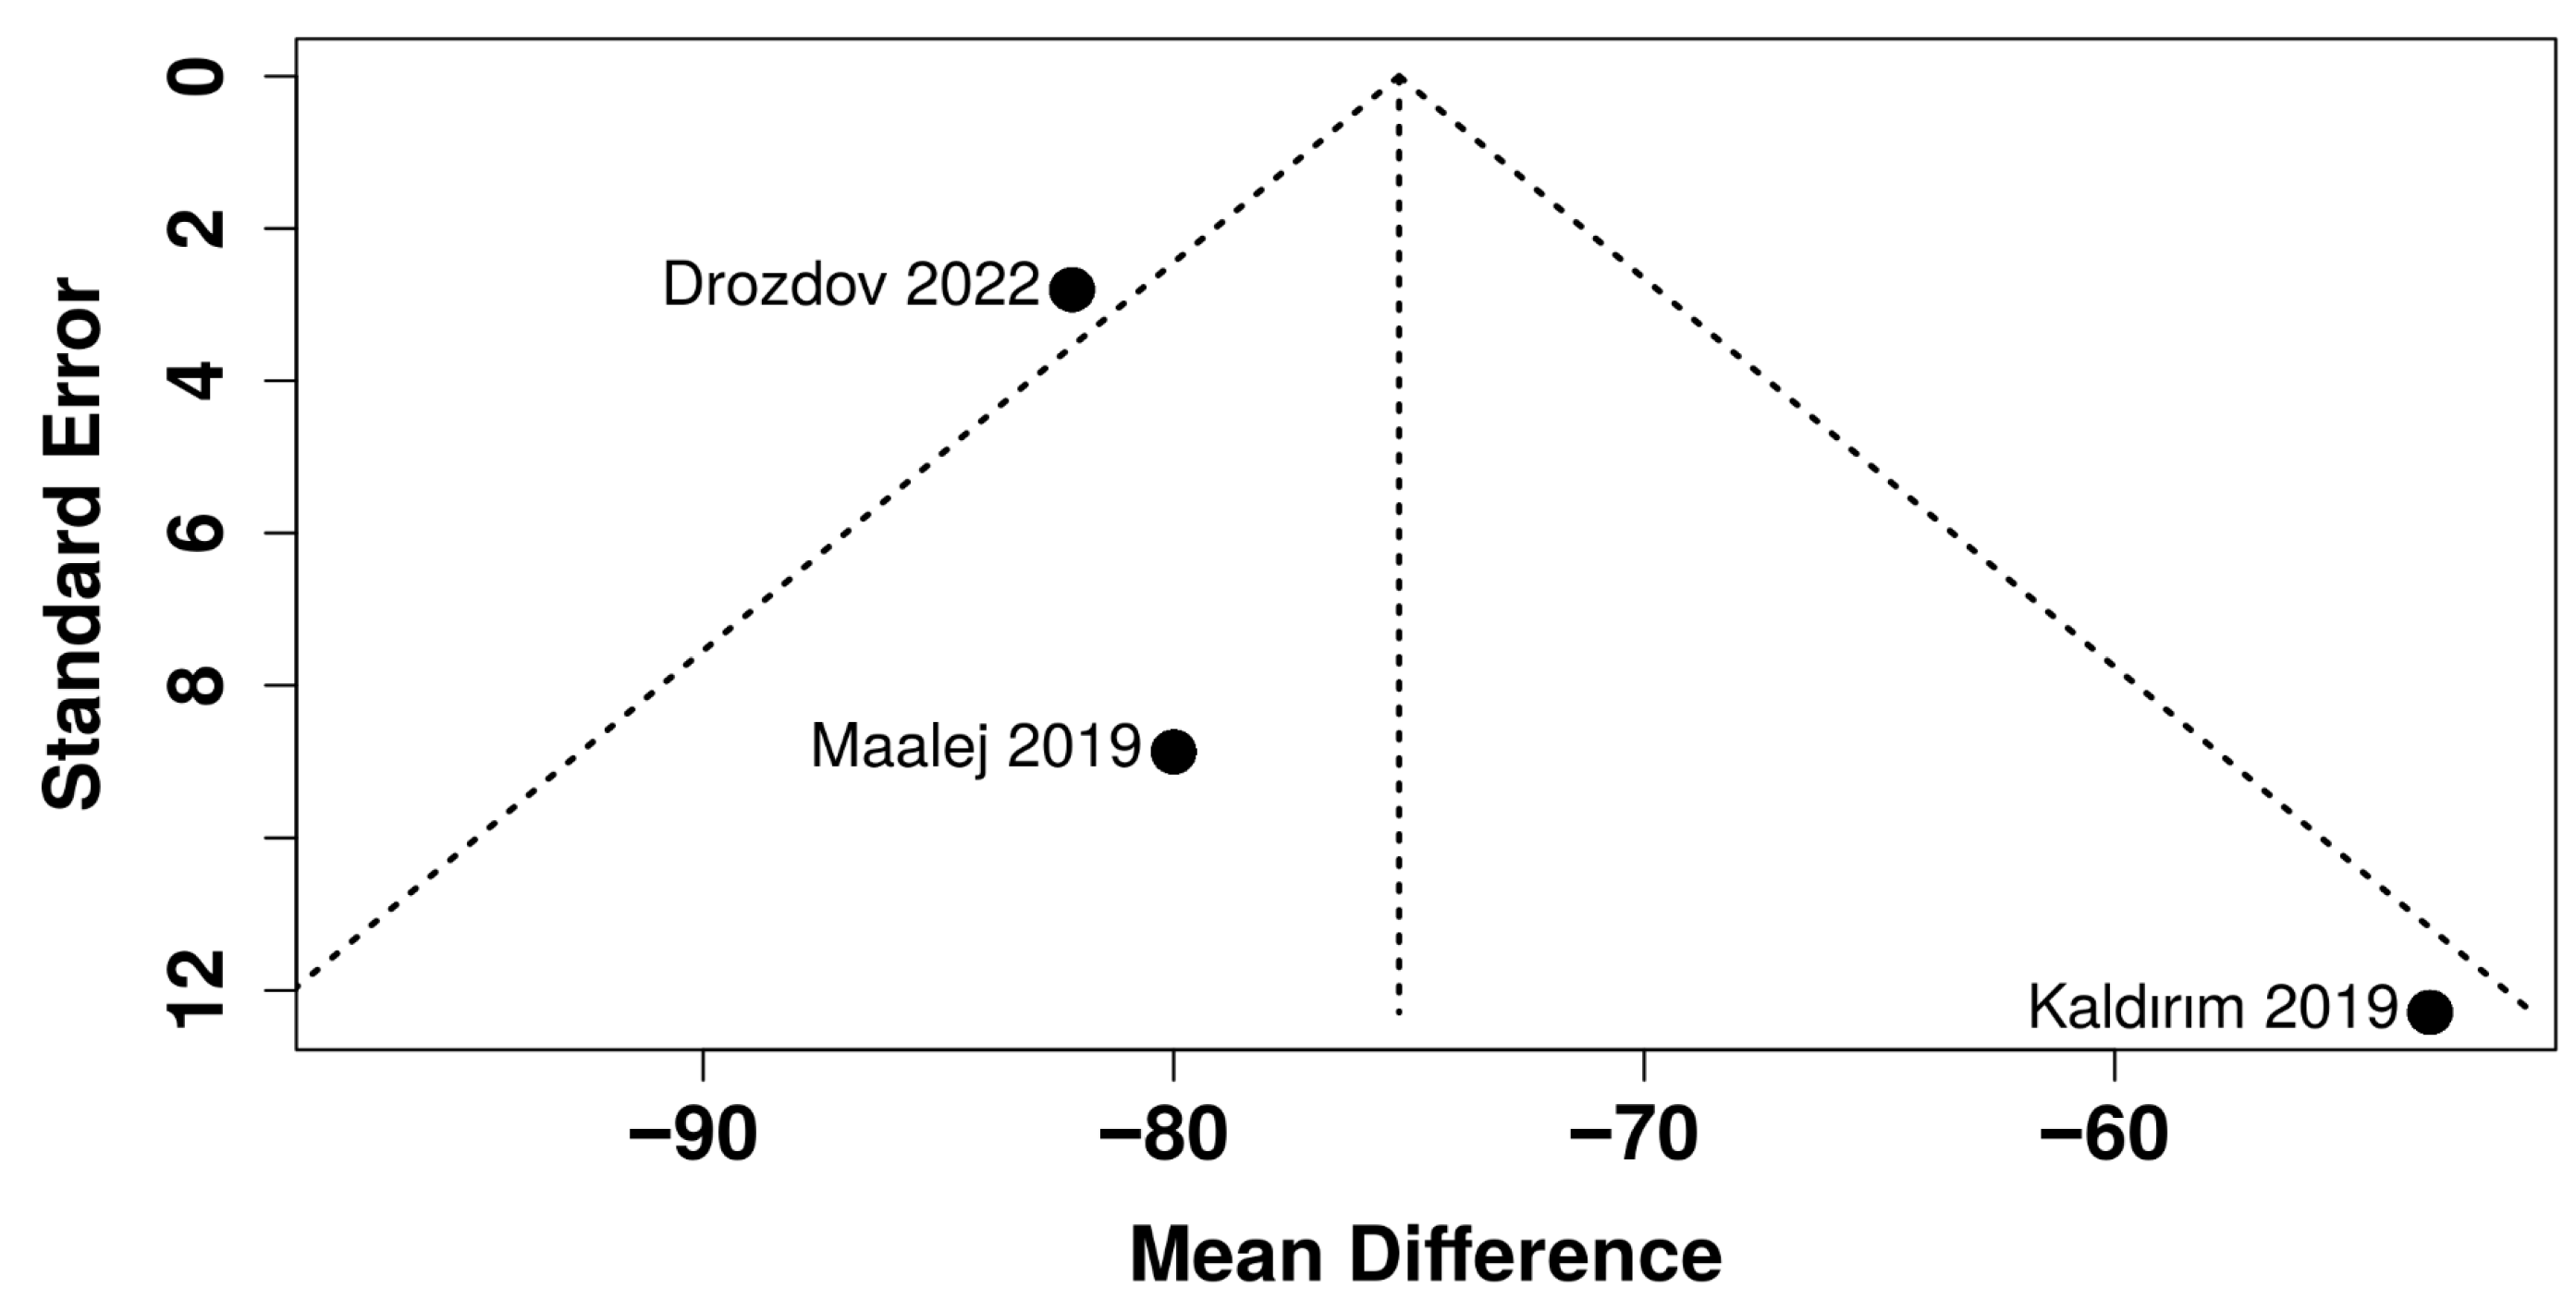
A funnel plot analysis (Figure 7) revealed potential asymmetry, which may suggest the presence of publication bias or an overestimation of HBOT’s effect due to the limited number of studies included. The results, while statistically significant, should therefore be interpreted with caution due to these underlying sources of variability.
Notably, the subgroup combining HBOT with adjuvant Aflibercept (Drozdov et al., 2022 [8]) exhibited a significantly higher baseline CMT compared to other control groups, reflecting a population exclusively comprising patients with diabetic macular edema.
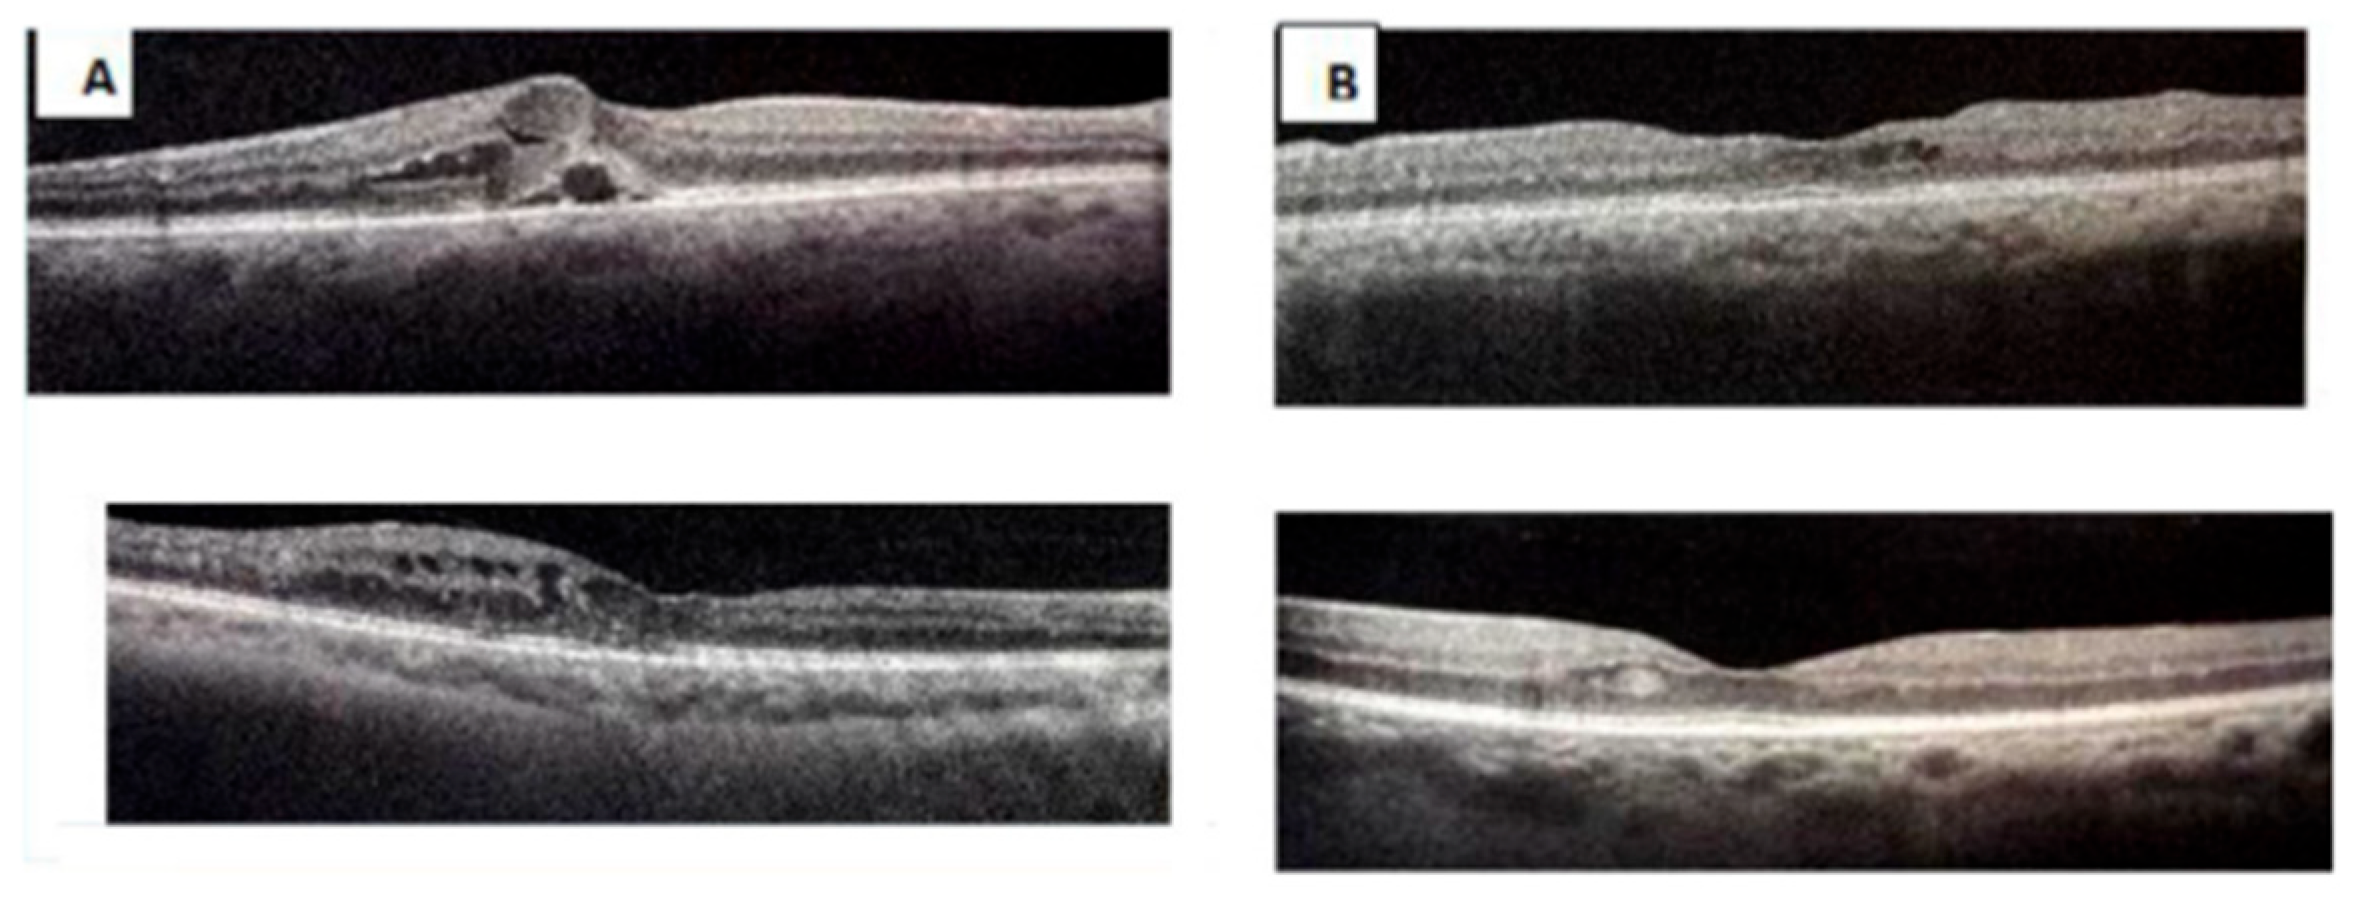
In Figure 8, an example of DME resolution after HBOT published by Maalej et al. [25].
Random-effects model pooling three studies (119 eyes HBOT, 83 eyes control). The pooled standardized mean difference is −75.21 (95% CI −90.04 to −60.38; p < 0.05). Heterogeneity is substantial (I2 = 62%), showing wide variation across studies; negative values indicate a greater CMT reduction with HBOT. Interpret the pooled estimate with caution owing to this high inconsistency. HBOT: hyperbaric oxygen therapy; CMT: central macular thickness; SD: standard deviation; CI: confidence interval.

4. Discussion

4.1. Summary of Evidence

Hyperbaric oxygen therapy (HBOT) represents a promising therapeutic approach to address the underlying pathophysiological mechanisms of diabetic retinopathy (DR) and diabetic macular edema (DME). By increasing oxygen availability to ischemic retinal tissues, HBOT counteracts hypoxia, a key driver of disease progression. Furthermore, it improves oxygen diffusion, modulates vascular function and activates endogenous antioxidant systems, thereby targeting the multifactorial interplay of hypoxia, inflammation, and oxidative stress. These mechanisms collectively provide a strong rationale for the clinical application of HBOT, although its routine role remains to be clearly defined through further investigations.
This meta-analysis demonstrates that HBOT offers significant structural and functional benefits in managing DME. A notable reduction in CMT, with a mean difference (MD) of −75.21 (95% CI −90.04 to −60.38; p < 0.05; I2 = 62%) substantiates HBOT’s capacity to reduce retinal edema. Simultaneously, the improvement in BCVA (MD= −0.04 LogMAR; 95% CI: −0.07 to −0.01; I2 = 0%), suggests a positive impact on functional outcomes. The low heterogeneity in BCVA outcomes indicates a robust and consistent benefit in visual function, reinforcing the potential of HBOT in improving quality of life in the affected patients, reflecting enhanced retinal health and visual function. Together, these findings suggest that HBOT may address both structural and functional aspects of DME, offering a dual therapeutic benefit. In contrast, heterogeneity in CMT outcomes (I2 = 62%), likely due to variations in study design, baseline disease severity, and treatment protocols. Subgroup analyses revealed that HBOT combined with pharmacological interventions, such as Aflibercept, resulted in greater CMT reductions, suggesting that HBOT may be particularly effective as adjunctive treatment in patients with advanced retinal pathology or higher baseline CMT.
The therapeutic mechanisms of HBOT include stabilization of the vascular endothelium, reduction in vascular leakage, and mitigation of edema—key contributors to vision loss in DME. Beyond its vascular effects, HBOT reduces oxidative stress, lipid peroxidation, and inflammation, preserving the blood–retinal barrier, preventing retinal neurodegeneration, and enhancing mitochondrial function, thereby contributing to improved retinal homeostasis.
Anti-VEGF agents have revolutionized the treatment of DR and DME by effectively reducing macular edema and improving visual acuity [16]. Their primary mechanism involves inhibition of vascular endothelial growth factor (VEGF), a key driver of pathological angiogenesis and vascular permeability. However, their impact on retinal perfusion and non-perfusion areas (NPAs) remains debated, particularly in patients with pre-existing ischemia [4].
While early concerns suggested that VEGF inhibition might exacerbate ischemia by reducing physiological VEGF levels and promoting capillary closure, more recent evidence suggests otherwise. Clinical trials as BRAVO, CRUISE, AFFINITY indicate that anti-VEGF therapy may promote reperfusion, particularly in the peripheral retina [3,31,32,33]. Monthly intravitreal injections of ranibizumab and aflibercept have been associated with stabilization or even reduction in NPAs and improvements in macular perfusion. In some cases, reductions in foveal avascular zone (FAZ) size have also been observed, possibly due to normalization of vascular structure and reduced inflammation.
Nevertheless, variability persists. Some patients, particularly those with extensive baseline ischemia, have shown worsening of macular perfusion metrics post-treatment. Despite this, long-term studies such as BOLT and RESTORE did not demonstrate significant deterioration in macular perfusion, reinforcing the overall retinal safety profile of anti-VEGF therapy [34,35,36].
In contrast, the role of HBOT in DR and DME remains less well established [37]. HBOT has been hypothesized to improve oxygenation in hypoxic retinal tissue, potentially stabilizing the blood–retinal barrier and reducing edema. Preliminary studies have suggested beneficial effects on retinal morphology in non-proliferative DR [2,7]. However, evidence is still inconclusive and inconsistent. For example, Sellman et al. in a placebo-controlled study found no significant difference in visual acuity, retinopathy grade, or macular edema between HBOT and control groups [24].
Furthermore, isolated case reports have raised concerns about potential hemorrhagic complications or the exacerbation of proliferative changes following HBOT, possibly due to VEGF upregulation induced by hyperoxia-driven angiogenic responses [14]. These findings, however, remain anecdotal and lack confirmation from large-scale clinical trials.
Interestingly, unlike anti-VEGF therapies, which suppress VEGF expression to reduce pathological angiogenesis and vascular permeability, HBOT may stimulate VEGF production as part of the physiological wound healing process. This dual-edged effect raises important questions about its appropriateness in advanced stages of DR, where VEGF overexpression already plays a pathological role.
By contrast, anti-VEGF therapy has demonstrated more consistent and robust evidence for improving retinal perfusion and slowing ischemic progression in both DR and DME. Its long-term safety and efficacy have been well documented. In comparison, HBOT remains an experimental or supportive therapy, with limited and heterogeneous data. While initial findings suggest potential benefits in early-stage DR, especially where retinal hypoxia is significant but neovascular changes are minimal, further research is necessary to define its role—particularly in relation to retinal ischemia and reperfusion dynamics.
Despite these encouraging signals, substantial heterogeneity was noted in CMT outcomes across the included studies (I2 = 62%), likely due to differences in study design, treatment protocols, and baseline patient characteristics. For instance, subgroup analyses showed that HBOT combined with pharmacological treatments such as Aflibercept produced more marked CMT reductions [8]. This suggests that HBOT may be especially beneficial as an adjunctive strategy in patients with advanced retinal disease or elevated baseline CMT. These findings emphasize the importance of tailoring treatment to specific clinical profiles and integrating HBOT into multimodal therapeutic regimens.
In contrast, the improvement in BCVA showed greater consistency, with a mean difference of −0.05 (95% CI: −0.09–−0.01; p = 0.007) and low heterogeneity (I2 = 0%). This indicates that the functional benefits of HBOT on visual acuity are more reliable and less influenced by study variability. It reinforces the potential of HBOT as a therapeutic option to enhance visual function, especially in patients with DR and DME.
Overall, these findings suggest a differentiated effect of HBOT: its impact on structural outcomes like CMT appears more context-dependent and influenced by baseline conditions and treatment combinations, while its effect on functional outcomes such as BCVA seems more universal and reproducible. This duality underscores the need for careful integration into clinical practice, considering patient-specific variables. The consistency in BCVA improvements further supports continued investigation into HBOT as a reliable intervention to enhance quality of life in affected patients.
Although the studies included in the meta-analysis reported a few adverse events, the broader literature outlines several potential risks associated with HBOT [37]. These include barotrauma, oxygen toxicity, and transient myopia. HBOT significantly increases oxygen tension in tissues—up to 20 times baseline levels. While hemoglobin saturation remains relatively stable, excess oxygen dissolves directly in tissues, occasionally exceeding metabolic demands and leading to the generation of reactive oxygen and nitrogen species (ROS/RNS). This surplus may result in oxidative DNA damage and ocular toxicity.
Several authors have reported HBOT-associated ocular complications, including dry eye, reversible myopic shifts (up to −4.5 D), cataracts, age related macular degeneration (AMD), and keratoconus [37,38,39]. Cataracts, particularly nuclear opacities, appear in patients undergoing more than 150 h of treatment. While myopic shifts are usually transient, cataract progression may be irreversible, especially in elderly patients whose eyes are more vulnerable to oxidative stress due to age-related decline in antioxidant defenses.
Moreover, HBOT could potentially worsen pre-existing ocular diseases associated with oxidative damage, such as AMD and glaucoma. In glaucoma, hyperoxia may damage trabecular meshwork cells, particularly when oxygen is delivered through a hood that directly exposes the anterior ocular surface. In these cases, oronasal masks are recommended as a safer alternative to minimize exposure. McMonnies et al. specifically recommends close monitoring for patients with glaucoma undergoing HBOT, due to the risk of disease progression [39]. In diabetic retinopathy, although HBOT may enhance oxygenation of ischemic retinal tissue, isolated reports have raised concerns about paradoxical worsening. For instance, a recent case described rapid visual deterioration and progression to proliferative diabetic retinopathy with macular edema and optic disc neovascularization shortly after completion of HBOT, possibly triggered by post-treatment hypoxia-induced VEGF upregulation [26]. Similarly, a previously reported case documented the onset of acute macular edema after the seventh HBOT session, potentially due to the rupture of a retinal arterial microaneurysm [25]. These findings suggest that, under certain conditions, HBOT may aggravate macular or retinal pathology, emphasizing the need for close ophthalmic monitoring, particularly in patients with advanced or unstable retinal disease.
One notable case report described the development of acute macular edema after the seventh HBOT session, possibly resulting from the rupture of a retinal arterial macroaneurysm [40]. This highlights the possibility that, under certain conditions, HBOT may aggravate macular pathology.
Although HBOT may improve tissue oxygenation and support physiological repair processes, its pro-oxidative potential must be carefully considered—particularly in older patients and those with ocular comorbidities. The true incidence of complications may be underestimated, as some may mimic natural aging processes. To mitigate risks, antioxidant supplementation could be beneficial, and HBOT protocols should be tailored or avoided in high-risk individuals [39]. Importantly, despite preliminary signals of benefit, no major international guideline currently recommends HBOT for diabetic retinopathy or diabetic macular edema. The ADA Standards of Care (2025), the AAO Preferred Practice Pattern (2024–2025), the EURETINA guidelines for DME, the ICO guidelines on diabetic eye care, and the IDF Clinical Practice Recommendations all omit HBOT from their therapeutic algorithms, underscoring its current status as an investigational approach [41,42,43,44,45].
In conclusion, while HBOT shows therapeutic promise, its application in patients with pre-existing eye disease requires cautious evaluation. These risks reinforce the importance of individualized risk-benefit assessment, continuous ocular monitoring, and targeted patient selection to ensure both efficacy and safety throughout treatment.

4.2. Limitations

This meta-analysis presents several limitations that must be acknowledged when interpreting the results. First, substantial heterogeneity was observed in central macular thickness (CMT) outcomes (I2 = 62%, p = 0.07), likely due to differences in study design, patient characteristics, and therapeutic protocols. Notably, one subgroup included only patients with advanced diabetic macular edema who received both HBOT and Aflibercept intravitreal injections, resulting in higher baseline CMT values [8]. Such variability complicates the extrapolation of findings to the broader DR/DME population, particularly in milder cases. In contrast, best-corrected visual acuity outcomes showed low heterogeneity (I2 = 0%), suggesting a more consistent functional effect of HBOT across studies. However, HBOT may confer a modest, clinically marginal improvement in BCVA (~2–3 letters), but the evidence is statistically fragile and of low certainty.
Second, the limited number of included studies reduces the statistical power and narrows the scope of subgroup analyses. This constraint affects the ability to draw definitive conclusions, especially when comparing HBOT as monotherapy versus in combination with pharmacological agents.
Third, the potential for publication bias cannot be ignored. Studies with favorable outcomes are more likely to be published, which may skew the perceived efficacy of HBOT. Additionally, the use of synthetic control groups in some analyses introduced assumptions regarding patient baselines and response variability that may not fully reflect real-world heterogeneity.
Fourth, the quality of evidence was inconsistent. Several studies lacked complete data reporting—such as standard deviations—requiring imputation or estimation, which may have introduced bias and reduced the overall validity of the pooled results. Variations in study design (e.g., RCTs versus observational studies), therapeutic regimens (HBOT alone vs. combination therapy), and follow-up durations further complicate data interpretation.
Finally, most studies lacked long-term follow-up, limiting the ability to assess the durability of HBOT’s benefits—particularly its impact on progression to proliferative diabetic retinopathy and sustained structural or visual improvements. This highlights the need for longitudinal studies to evaluate both safety and lasting efficacy.

5. Conclusions

Hyperbaric oxygen therapy (HBOT) emerges as a promising adjunctive strategy for the management of diabetic retinopathy (DR) and diabetic macular edema (DME). By enhancing retinal oxygen diffusion, stabilizing endothelial function, and modulating oxidative and inflammatory pathways, HBOT directly addresses the hypoxia-sensing mechanisms (HIF–VEGF axis) that drive disease progression. This mechanistic alignment underpins the clinical findings of our review, where HBOT was associated with significant improvements in both central macular thickness (CMT) and best-corrected visual acuity (BCVA). Importantly, BCVA outcomes were highly consistent across studies (I2 = 0%), suggesting reliable functional benefits even in heterogeneous populations.
A novel insight from this review is the potential synergy between HBOT and anti-VEGF therapies, particularly Aflibercept, which was associated with more substantial reductions in CMT. This finding positions HBOT as a valuable component of multimodal management, especially for patients with refractory or severe DME. In practice, HBOT could be considered for (i) patients with persistent DME despite standard therapy, (ii) early-stage DR/DME with pronounced hypoxia but preserved perfusion, and (iii) cases requiring tailored multimodal approaches, including antioxidant support in elderly patients or those prone to oxidative stress. Nonetheless, safety considerations remain crucial: HBOT should be used with caution in patients with glaucoma, AMD, or extensive ischemia, and protective measures such as oronasal masks may help reduce anterior segment oxygen exposure.
Despite these encouraging signals, the certainty of current evidence is limited by methodological weaknesses, small sample sizes, and variability in treatment protocols. HBOT should therefore be considered investigational and reserved for specialized settings with close ophthalmologic monitoring. Future well-designed randomized controlled trials with standardized protocols and refined patient stratification are needed to validate these preliminary benefits, identify candidates most likely to respond, and assess long-term efficacy and safety.
In summary, this review provides novel evidence that HBOT not only improves structural and functional outcomes in DR/DME but may also potentiate the effects of anti-VEGF therapy within a mechanistically aligned framework. These insights strengthen the rationale for integrating HBOT into multimodal treatment strategies and highlight its potential to evolve from a supportive intervention into a disease-modifying therapy, pending confirmation from robust clinical trials.

Author Contributions

Conceptualization, G.C., V.R. and E.M.; methodology, E.M. and M.L.; software, V.R. and E.M.; validation, G.C., V.R. and E.M.; formal analysis, G.C.,V.R. and E.M.; investigation, G.C., V.R. and E.M.; resources, G.C., V.R. and E.M.; data curation, V.R., P.L. and E.M.; writing—original draft preparation G.C., V.R. and E.M.; writing—review and editing, G.C., A.Z., V.R., A.F., P.L. and E.M.; supervision, M.L., P.L. and A.Z. All authors have read and agreed to the published version of the manuscript.

Funding

This research received no external funding.

Institutional Review Board Statement

Not applicable.

Informed Consent Statement

Not applicable.

Data Availability Statement

No new data were created or analyzed in this study.

Conflicts of Interest

The authors declare no conflicts of interest.

Abbreviations

The following abbreviations are used in this manuscript:
DRDiabetic retinopathy
DMEDiabetic macular edema
DMDiabetes mellitus
HBOTHyperbaric oxygen therapy
BCVABest corrected visual acuity
CMTCentral macular thickness
NPDRNon-proliferative diabetic retinopathy
PDRProliferative diabetic retinopathy
ERMEpiretinal membrane
PKCprotein kinase C
AGEAdvanced glycation end-product
ROSReactive oxygen species
BRBBlood–retinal barrier
VEGFVascular endothelial growth factor
HIFHypoxia inducible factor
SODSuperoxide dismutase
CATCatalase
GSRGlutathione reductase
ATAAtmospheres absolute
GRADEGrading of Recommendations Assessment, Development and Evaluation
IQRsInterquartile ranges
SDsStandard deviations
MDMean difference
I2Heterogeneity
CSMEClinically significant macular edema
kPAKilopascal
ETDRSEarly Treatment of Diabetic Retinopathy Study
CTChoroidal thickness
CIConfidence interval

References

  1. Al-Kharashi, A.S. Role of oxidative stress, inflammation, hypoxia and angiogenesis in the development of diabetic retinopathy. Saudi J. Ophthalmol. 2018, 32, 318–323. [Google Scholar] [CrossRef]
  2. Antonetti, D.A.; Barber, A.J.; Bronson, S.K.; Freeman, W.M.; Gardner, T.W.; Jefferson, L.S.; Kester, M.; Kimball, S.R.; Krady, J.K.; LaNoue, K.F.; et al. Diabetic Retinopathy. Diabetes 2006, 55, 2401–2411. [Google Scholar] [CrossRef]
  3. Chatziralli, I.; Touhami, S.; Cicinelli, M.V.; Agapitou, C.; Dimitriou, E.; Theodossiadis, G.; Theodossiadis, P. Disentangling the association between retinal non-perfusion and anti-VEGF agents in diabetic retinopathy. Eye 2022, 36, 692–703. [Google Scholar] [CrossRef]
  4. Ortega, M.A.; Fraile-Martinez, O.; García-Montero, C.; Callejón-Peláez, E.; Sáez, M.A.; Álvarez-Mon, M.A.; García-Honduvilla, N.; Monserrat, J.; Álvarez-Mon, M.; Bujan, J.; et al. A General Overview on the Hyperbaric Oxygen Therapy: Applications, Mechanisms and Translational Opportunities. Medicina 2021, 57, 864. [Google Scholar] [CrossRef]
  5. Gnanasambandam, B.; Prince, J.; Limaye, S.; Moran, E.; Lee, B.; Huynh, J.; Irudayaraj, J.; Tsipursky, M. Addressing retinal hypoxia: Pathophysiology, therapeutic innovations, and future prospects. Ther. Adv. Ophthalmol. 2024, 26, 16. [Google Scholar] [CrossRef]
  6. Okamoto, N. Effect of Hyperbaric Oxygen on Ophthalmic Artery Blood Velocity in Patients With Diabetic Neuropathy. Jpn. J. Ophthalmol. 1998, 42, 406–410. [Google Scholar] [CrossRef] [PubMed]
  7. Barber, A.J. A new view of diabetic retinopathy: A neurodegenerative disease of the eye. Prog. Neuropsychopharmacol. Biol. Psychiatry 2003, 27, 283–290. [Google Scholar] [CrossRef]
  8. Drozdov, V.O.; Sakovych, V.M. Changes in clinical and biochemical characteristics in combination treatment for diabetic macular edema. Oftalmol. Zh. 2022, 98, 18–23. [Google Scholar] [CrossRef]
  9. Santos, J.M.; Mohammad, G.; Zhong, Q.A.; Kowluru, R. Diabetic Retinopathy, Superoxide Damage and Antioxidants. Curr. Pharm. Biotechnol. 2011, 12, 352–361. [Google Scholar] [CrossRef]
  10. Mohammad, G.; Alam, K.; Nawaz, M.I.; Siddiquei, M.M.; Mousa, A.; Abu El-Asrar, A.M. Mutual enhancement between high-mobility group box-1 and NADPH oxidase-derived reactive oxygen species mediates diabetes-induced upregulation of retinal apoptotic markers. J. Physiol. Biochem. 2015, 71, 359–372. [Google Scholar] [CrossRef] [PubMed]
  11. Joussen, A.M.; Poulaki, V.; Le, M.L.; Koizumi, K.; Esser, C.; Janicki, H.; Schraermeyer, U.; Kociok, N.; Fauser, S.; Kirchhof, B.; et al. A central role for inflammation in the pathogenesis of diabetic retinopathy. FASEB J. 2004, 18, 1450–1452. [Google Scholar] [CrossRef]
  12. Romeo, G.; Liu, W.-H.; Asnaghi, V.; Kern, T.S.; Lorenzi, M. Activation of Nuclear Factor-κB Induced by Diabetes and High Glucose Regulates a Proapoptotic Program in Retinal Pericytes. Diabetes 2002, 51, 2241–2248. [Google Scholar] [CrossRef] [PubMed]
  13. Curtis, T.M.; Gardiner, T.A.; Stitt, A.W. Microvascular lesions of diabetic retinopathy: Clues towards understanding pathogenesis? Eye 2009, 23, 1496–1508. [Google Scholar] [CrossRef]
  14. Zhang, S.X.; Ma, J.X. Ocular neovascularization: Implication of endogenous angiogenic inhibitors and potential therapy. Prog. Retin. Eye Res. 2007, 26, 1–37. [Google Scholar] [CrossRef] [PubMed]
  15. Arevalo, J.F.; Wu, L.; Sanchez, J.G.; Maia, M.; Saravia, M.J.; Fernandez, C.F.; Evans, T. Intravitreal bevacizumab (avastin) for proliferative diabetic retinopathy: 6-months follow-up. Eye 2009, 23, 117–123. [Google Scholar] [CrossRef]
  16. Spaide, R.F.; Fisher, Y.L. Intravitreal bevacizumab (avastin) treatment of proliferative diabetic retinopathy complicated by vitreous hemorrhage. Retina 2006, 26, 275–278. [Google Scholar] [CrossRef]
  17. Page, M.J.; McKenzie, J.E.; Bossuyt, P.M.; Boutron, I.; Hoffmann, T.C.; Mulrow, C.D.; Shamseer, L.; Tetzlaff, J.M.; Akl, E.A.; Brennan, S.E.; et al. The PRISMA 2020 statement: An updated guideline for reporting systematic reviews. BMJ 2021, 372, n71. [Google Scholar] [CrossRef] [PubMed]
  18. Piggott, T.; Morgan, R.L.; Cuello-Garcia, C.A.; Santesso, N.; Mustafa, R.A.; Meerpohl, J.J.; Schünemann, H.J. Grading of Recommendations Assessment, Development, and Evaluations (GRADE) notes: Extremely serious, GRADE’s terminology for rating down by three levels. J. Clin. Epidemiol. 2020, 120, 116–120. [Google Scholar] [CrossRef]
  19. Bailey, I.L.; Lovie-Kitchin, J.E. Visual acuity testing. From the laboratory to the clinic. Vis. Res. 2013, 90, 2–9. [Google Scholar] [CrossRef]
  20. Ferris, F.L.; Kassoff, A.; Bresnick, G.H.; Bailey, I. New Visual Acuity Charts for Clinical Research. Am. J. Ophthalmol. 1982, 94, 91–96. [Google Scholar] [CrossRef]
  21. Raasch, T.W.; Bailey, I.L.; Bullimore, M.A. Repeatability of Visual Acuity Measurement. Optom. Vis. Sci. 1998, 75, 342–348. [Google Scholar] [CrossRef]
  22. Hozo, S.P.; Djulbegovic, B.; Hozo, I. Estimating the mean and variance from the median, range, and the size of a sample. BMC Med. Res. Methodol. 2005, 5, 13. [Google Scholar]
  23. Higgins, J.P.T. Measuring inconsistency in meta-analyses. BMJ 2003, 327, 557–560. [Google Scholar] [CrossRef] [PubMed]
  24. Sellman, A.; Katzman, P.; Andreasson, S.; Löndahl, M. Long-term effects of hyperbaric oxygen therapy on visual acuity and retinopathy. Undersea Hyperb. Med. 2020, 47, 423–430. [Google Scholar] [CrossRef]
  25. Maalej, A.; Khallouli, A.; Choura, R.; Ben Sassi, R.; Rannen, R.; Gharsallah, H. The effects of hyperbaric oxygen therapy on diabetic retinopathy: A preliminary study. J. Fr. Ophtalmol. 2020, 43, 133–138. [Google Scholar] [CrossRef] [PubMed]
  26. Kaldırım, H.; Yazgan, S.; Ceylan, B.; Atalay, K. The effect of hyperbaric oxygen therapy on retinal thickness and progression of retinopathy in patients with Type 2 diabetes: A prospective cohort study. Cutan. Ocul. Toxicol. 2019, 38, 233–239. [Google Scholar] [CrossRef]
  27. Gün, R.D.; Gümüş, T.; Kardaş, A.S.Y.; Kardaş, G. Acute effect of hyperbaric oxygen therapy on macular and choroidal thickness in patients with type 2 diabetes and diabetic foot ulcers: Optical coherence tomography based study. Photodiagnosis Photodyn. Ther. 2022, 39, 102926. [Google Scholar] [CrossRef] [PubMed]
  28. Querques, G.; Lattanzio, R.; Querques, L.; Del Turco, C.; Forte, R.; Pierro, L.; Souied, E.H.; Bandello, F. Enhanced Depth Imaging Optical Coherence Tomography in Type 2 Diabetes. Investig. Opthalmology Vis. Sci. 2012, 53, 6017. [Google Scholar] [CrossRef]
  29. Gopalakrishnan, M.; Appukuttan, B.; Giridhar, A.; Sivaprasad, S. Normative spectral domain optical coherence tomography data on macular and retinal nerve fiber layer thickness in Indians. Indian J. Ophthalmol. 2014, 62, 316. [Google Scholar] [CrossRef]
  30. Shen, L.; Gao, F.; Xu, X.; Lin, Z.; Zhang, Z.; Zhao, B.; Zhang, X.; Li, B.; Jonas, J.B. Macular thickness in Chinese. Acta Ophthalmol. 2013, 91, e77–e79. [Google Scholar] [CrossRef]
  31. Campochiaro, P.A.; Bhisitkul, R.B.; Shapiro, H.; Rubio, R.G. Vascular Endothelial Growth Factor Promotes Progressive Retinal Nonperfusion in Patients with Retinal Vein Occlusion. Ophthalmology 2013, 120, 795–802. [Google Scholar] [CrossRef] [PubMed]
  32. Kim, Y.J.; Yeo, J.H.; Son, G.; Kang, H.; Sung, Y.S.; Lee, J.Y.; Kim, J.-G.; Yoon, Y.H. Efficacy of intravitreal AFlibercept injection for Improvement of retinal Nonperfusion in diabeTic retinopathY (AFFINITY study). BMJ Open Diabetes Res. Care. 2020, 8, e001616. [Google Scholar] [CrossRef] [PubMed]
  33. Terui, T.; Kondo, M.; Sugita, T.; Ito, Y.; Kondo, N.; Ota, I.; Miyake, K.; Terasaki, H. Changes in areas of capillary nonperfusion after intravitreal injection of bevacizumab in eyes with branch retinal vein occlusion. Retina 2011, 31, 1068–1074. [Google Scholar] [CrossRef]
  34. Chung, E.J.; Roh, M.I.; Kwon, O.W.; Koh, H.J. Effects of Macular Ischemia on the Outcome of Intravitreal Bevacizumab Therapy for Diabetic Macular Edema. Retina 2008, 28, 957–963. [Google Scholar] [CrossRef]
  35. Karst, S.G.; Deak, G.G.; Gerendas, B.S.; Waldstein, S.M.; Lammer, J.; Simader, C.; Guerin, T.; Schmidt-Erfurth, U.M. Association of Changes in Macular Perfusion with Ranibizumab Treatment for Diabetic Macular Edema. JAMA Ophthalmol. 2018, 136, 315. [Google Scholar] [CrossRef]
  36. Michaelides, M.; Fraser-Bell, S.; Hamilton, R.; Kaines, A.; Egan, C.; Bunce, C.; Peto, T.; Hykin, P. Macular Perfusion determined by Fundus Fluorescein Angiography at the 4-month time point in a prospective randomized trial of intravitreal bevacizumab or laser therapy in the management of diabetic macular edema (BOLT Study). Retina 2010, 30, 781–786. [Google Scholar] [CrossRef] [PubMed]
  37. Micun, Z.; Dobrzyńska, W.; Sieśkiewicz, M.; Zawadzka, I.; Dmuchowska, D.A.; Wojewodzka-Zelezniakowicz, M.; Konopińska, J. Hyperbaric Oxygen Therapy in Ophthalmology: A Narrative Review. J. Clin. Med. 2023, 13, 29. [Google Scholar] [CrossRef]
  38. Malik, A.; Golnik, K. Hyperbaric Oxygen Therapy in the Treatment of Radiation Optic Neuropathy. J. Neuro-Ophthalmol. 2012, 32, 128–131. [Google Scholar] [CrossRef]
  39. Mcmonnies, C.W. Hyperbaric oxygen therapy and the possibility of ocular complications or contraindications. Clin. Exp. Optom. 2015, 98, 122–125. [Google Scholar] [CrossRef]
  40. Yonekawa, Y.; Hypes, S.M.; Abbey, A.M.; A Williams, G.; Wolfe, J.D. Exacerbation of macular oedema associated with hyperbaric oxygen therapy. Clin. Exp. Ophthalmol. 2016, 44, 625–626. [Google Scholar] [CrossRef]
  41. International Diabetes Federation. Clinical Practice Recommendations for Managing Diabetic Macular Edema; International Diabetes Federation: Brussels, Belgium, 2019. [Google Scholar]
  42. Wong, T.Y.; Sun, J.; Kawasaki, R.; Ruamviboonsuk, P.; Gupta, N.; Lansingh, V.C.; Maia, M.; Mathenge, W.; Moreker, S.; Muqit, M.M.; et al. Guidelines on Diabetic Eye Care. Ophthalmology 2018, 125, 1608–1622. [Google Scholar] [CrossRef] [PubMed]
  43. Schmidt-Erfurth, U.; Garcia-Arumi, J.; Bandello, F.; Berg, K.; Chakravarthy, U.; Gerendas, B.S.; Jonas, J.; Larsen, M.; Tadayoni, R.; Loewenstein, A. Guidelines for the Management of Diabetic Macular Edema by the European Society of Retina Specialists (EURETINA). Ophthalmologica 2017, 237, 185–222. [Google Scholar] [CrossRef]
  44. Lim, J.I.; Kim, S.J.; Bailey, S.T.; Kovach, J.L.; Vemulakonda, G.A.; Ying, G.-S.; Flaxel, C.J. Diabetic Retinopathy Preferred Practice Pattern®. Ophthalmology 2025, 132, P75–P162. [Google Scholar] [CrossRef] [PubMed]
  45. American Diabetes Association Professional Practice Committee; ElSayed, N.A.; McCoy, R.G.; Aleppo, G.; Balapattabi, K.; Beverly, E.A.; Early, K.B.; Bruemmer, D.; Callaghan, B.C.; Echouffo-Tcheugui, J.B.; et al. 12. Retinopathy, Neuropathy, and Foot Care: Standards of Care in Diabetes—2025. Diabetes Care 2025, 48 (Suppl. 1), S252–S265. [Google Scholar]
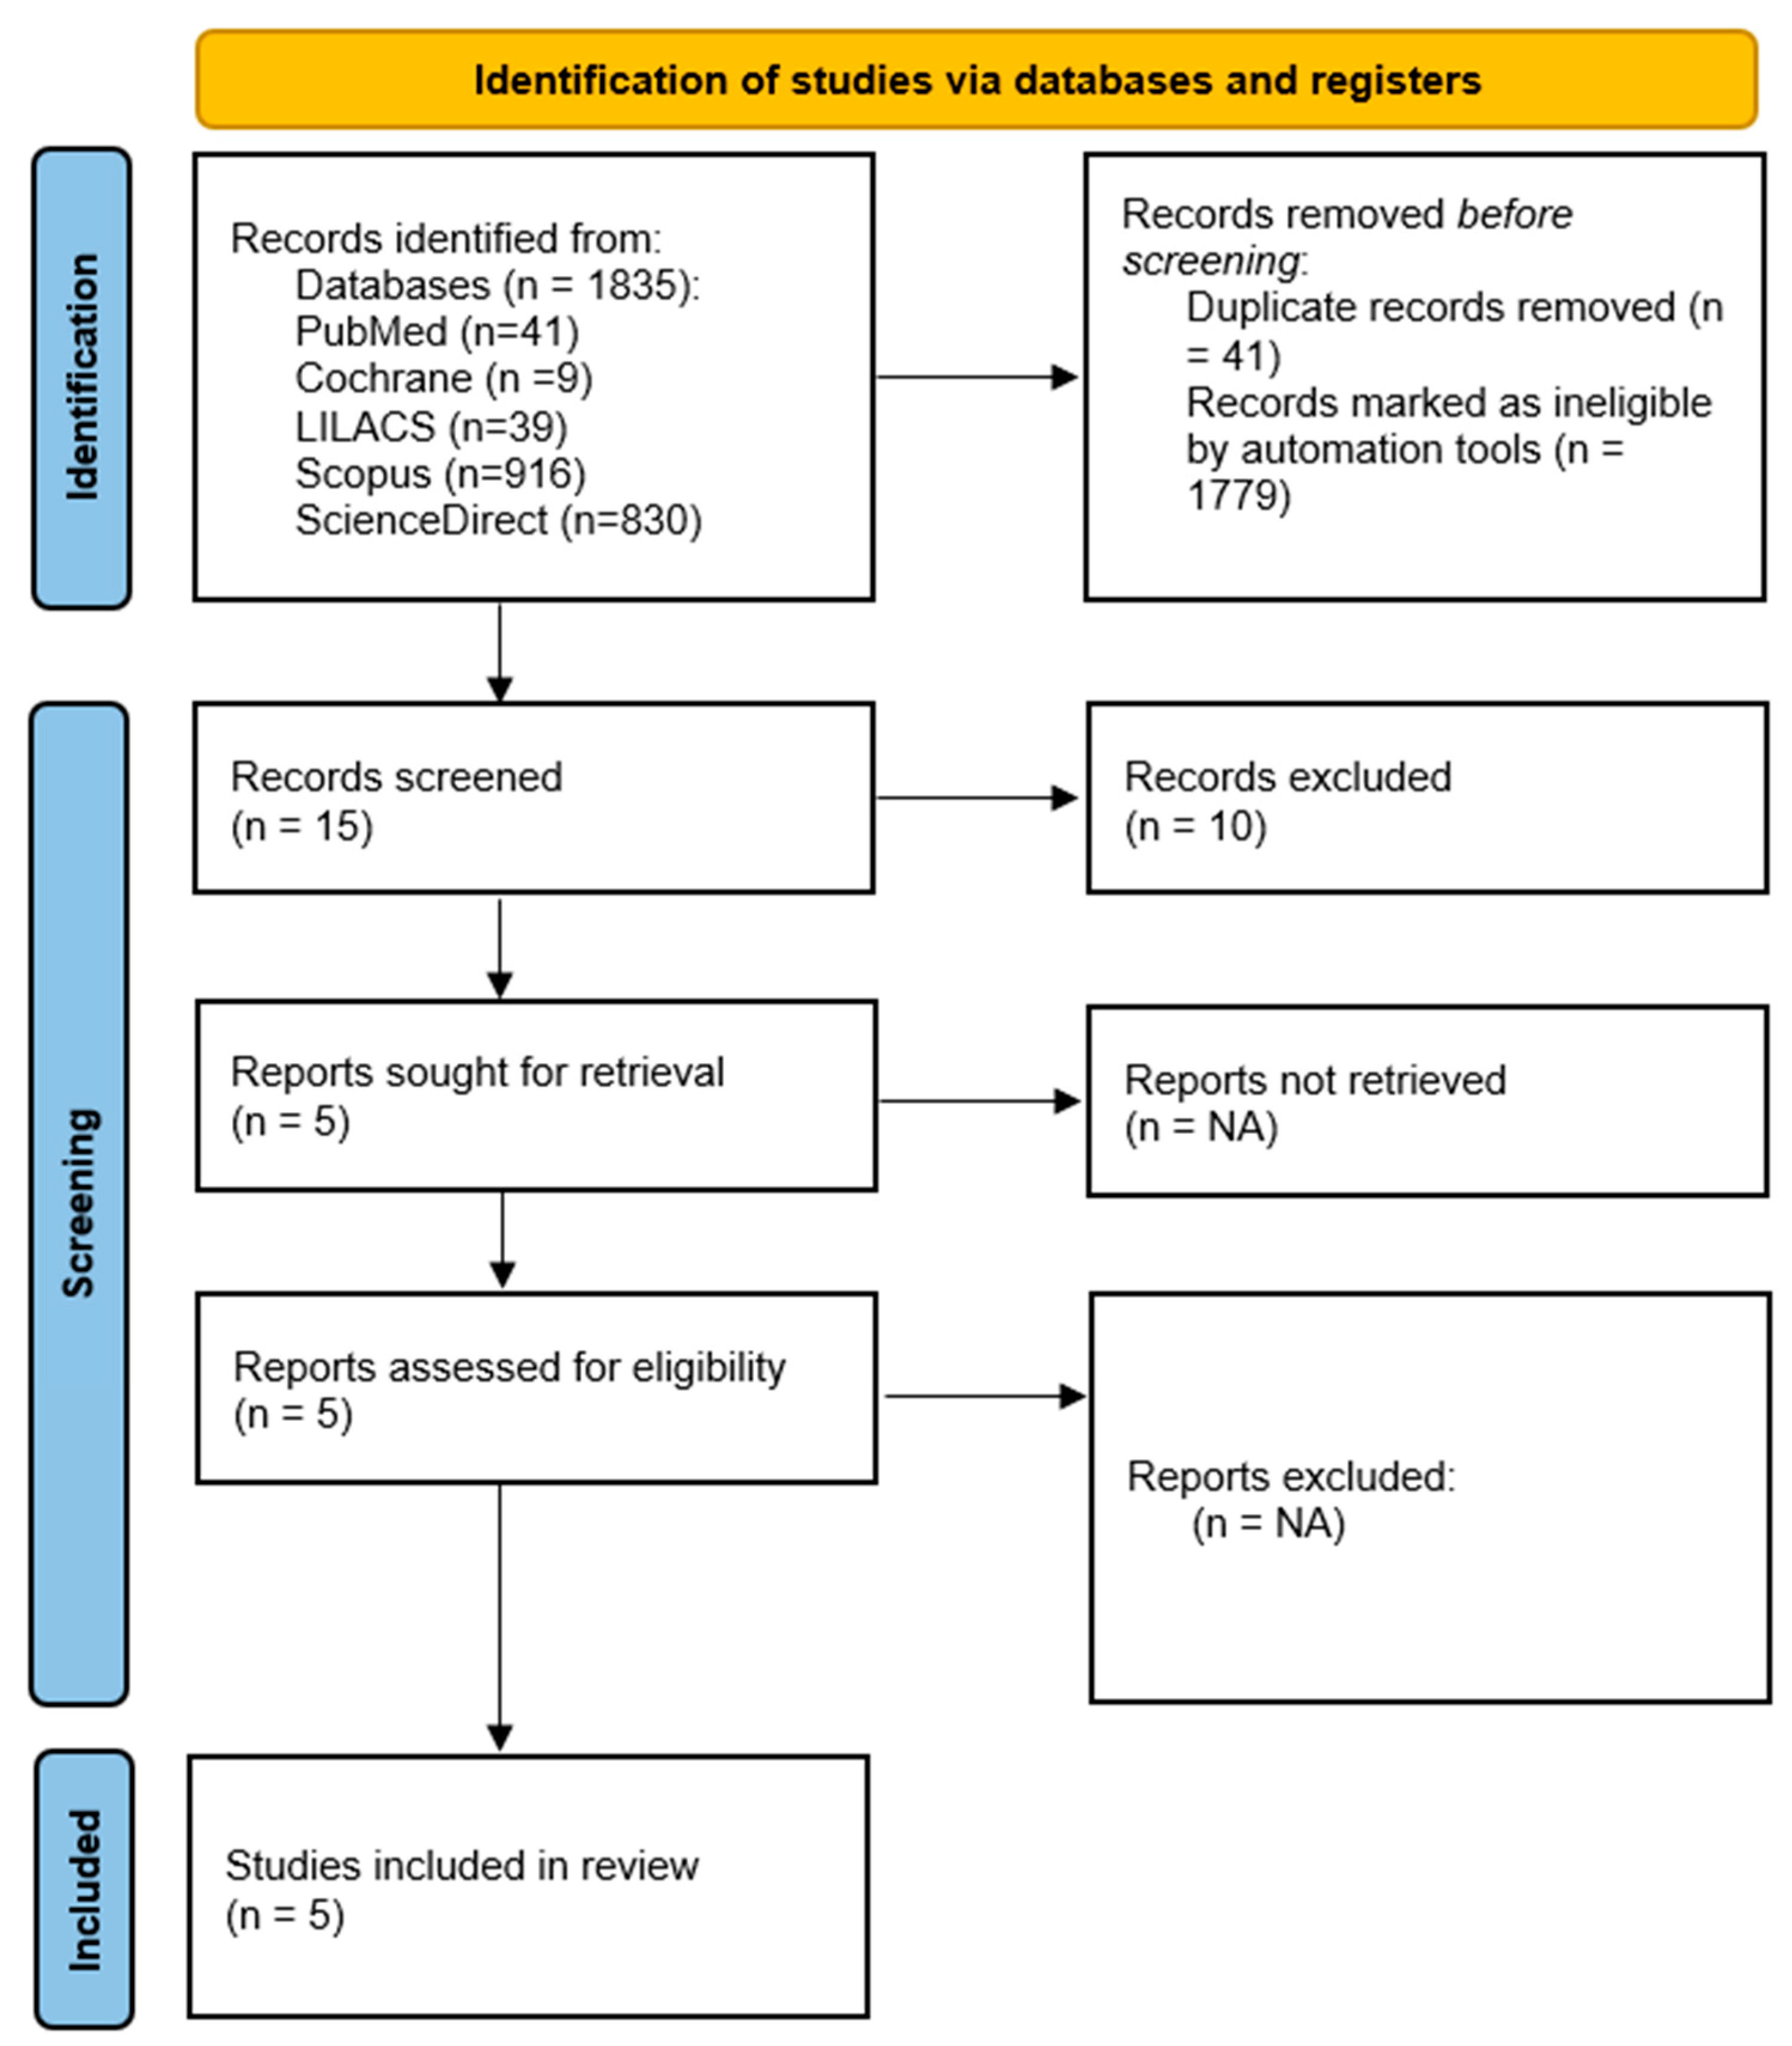
Figure 1. PRISMA flow diagram illustrating the study selection process.
Diabetology 06 00133 g001
Figure 2. Risk of bias assessment for the randomized controlled trial: graphical representation of the Cochrane RoB 2 assessment for the randomized, placebo-controlled trial by Sellman et al. [24]. The study was judged to have a low risk of bias across all five domains: randomization process (D1), deviations from intended interventions (D2), missing outcome data (D3), measurement of the outcome (D4), and selection of the reported result (D5). The overall risk of bias was classified as low.
Diabetology 06 00133 g002
Figure 3. Risk of bias assessment for non-randomized studies: graphical summary of the ROBINS-I risks of bias assessment for two non-randomized intervention studies: Drozdov et al. [8] and Maalej et al. [25]. Both studies were judged to have a serious overall risk of bias, primarily due to confounding factors and selection of participants. Domains assessed included confounding (D1), selection of participants (D2), classification of interventions (D3), deviations from intended interventions (D4), missing outcome data (D5), measurement of outcomes (D6), and selection of the reported result (D7). Color-coded judgments indicate risk level: green (low), yellow (moderate), and red (serious).
Diabetology 06 00133 g003
Figure 4. Forest plot—Hyperbaric oxygen therapy vs. control for BCVA, Sellman et al., 2020 [24]; Maalej et al., 2019 [25]; Drozdov et al., 2022 [8]; and Kaldirim et al., 2019 [26].
Diabetology 06 00133 g004
Figure 5. Funnel plot—Publication-bias assessment for BCVA outcome. Each dot is an individual study plotted against its standard error. Sellman et al., 2020 [24]; Maalej et al., 2019 [25]; Drozdov et al., 2022 [8]; and Kaldirim et al., 2019 [26].
Diabetology 06 00133 g005
Figure 6. Forest plot—Hyperbaric oxygen therapy vs. control for CMT. Maalej et al., 2019 [25]; Drozdov et al., 2022 [8]; and Kaldirim et al., 2019 [26].
Diabetology 06 00133 g006
Figure 7. Funnel plot—Publication-bias assessment for CMT outcome. Each dot is an individual study plotted against its standard error. Maalej et al., 2019 [25]; Drozdov et al., 2022 [8]; and Kaldirim et al., 2019 [26].
Diabetology 06 00133 g007
Figure 8. Improvement of the diabetic macular edema after HBOT. (A) Macular OCT scans before HBOT. (B) Macular OCT scans after HBOT [25].
Diabetology 06 00133 g008
Table 1. Summary of the main characteristics of the included studies. Ref: reference; DR: diabetic retinopathy; DME: diabetic macular edema; HBOT: hyperbaric oxygen therapy; CSME: clinically significant macular edema; ATA: atmospheres absolute; kPA: kilopascal; ETDRS: Early Treatment of Diabetic Retinopathy Study; BCVA: best corrected visual acuity; DM: diabetes mellitus; NPDR: non-proliferative diabetic retinopathy; PDR: proliferative diabetic retinopathy; VEGF: vascular endothelial growth factor; CT: choroidal thickness.
Study, RefPurposePopulation & Baseline DR/DME SeverityComparison GroupsNumber of HBOT TreatmentsHBOT
Treatment
Sellman A, 2020, Sweden [24]Effects of HBOT on visual acuity and retinopathy in patients with chronic diabetic foot ulcers62 adults with chronic diabetic foot ulcers (median age ≈ 64–70 y). DR graded with the Wisconsin Epidemiologic Study of Diabetic Retinopathy (WESDR) scale, ranging from none/slight (levels 1–5) to proliferative (≥10). CSME assessed at baseline according to ETDRS criteria.HBOT Group vs. Placebo GroupMax 40 treatmentsCompression at 2.5 ATA (253.31 kPa) with 100% oxygen or air
Maalej A, 2019, Tunisia [25]Effects of HBOT on diabetic retinopathy lesions and macular edema50 patients receiving HBOT for foot ulcers; all eyes showed non-proliferative DR (ETDRS). Stages recorded as mild, moderate, or severe; no proliferative lesions reported at inclusion. OCT used to document macular thickness, with limited DME prevalence. HBOT+ (diabetic ulcers) vs. HBOT− (no ulcers)30 sessionsCompression at 2.5 ATA (253.31 kPa) for 90 min
Kaldrim H, 2019, Turkey [26]Effect of HBOT on retinopathy progression and retinal/choroidal thicknessProspective cohort of 30 type 2 DM patients (60 eyes) divided into three groups: mild-to-moderate NPDR (14 eyes), severe NPDR (20 eyes), and inactive post-laser PDR (26 eyes). Only isolated DME cases noted at baseline.Mild/moderate DR, Severe DR, Inactive proliferative30 sessionsInhalation of 100% oxygen at 2–2.5 ATA (202.65–253.31 kPa)
Gun, 2022, Turkey [27]Acute effect of HBOT on macular and choroidal thickness in patients with type 2 diabetesCross-sectional series of 26 patients (49 eyes). Baseline grading: 10 eyes mild NPDR, 10 moderate NPDR, 13 severe NPDR; remaining eyes with no DR. PDR, recent anti-VEGF/laser, and clinical DME were exclusion criteria.Insulin Group vs. Insulin+ Oral Antidiabetics Group1 sessionCompression at 2.4 ATA (243.18 kPa) with ‘air breaks’
Drozdov, 2022, Ukraine [8]Efficacy of the combination treatment for DME in type 2 diabetic patients with non-proliferative diabetic retinopathy71 type 2 DM patients with both NPDR and center-involved DME. Inclusion required NPDR (PDR excluded) and ETDRS-confirmed DME; mean age 62 y, diabetes duration ~12 y, moderate glycemic control.Aflibercept + HBOT vs. Aflibercept-only (as control)10 sessionsMonthly aflibercept for 3 months with 10 HBOT sessions
Table 2. Outcomes and results of the included studies. Ref: reference; ETDRS: early treatment diabetic retinopathy study; VA: visual acuity; OCT: optical coherence tomography; BCVA: best corrected visual acuity; HBOT: hyperbaric oxygen therapy; EDI-OCT: enhanced depth imaging OCT; CT: choroidal thickness.
Study, RefOphthalmological EvaluationMeasured OutcomesResults
Sellman A, 2020 [24]Visual acuity (ETDRS), fundus photoDiabetic retinopathy grading and visual acuityNo significant difference in VA or retinopathy levels between groups over 2 years
Maalej A, 2019 [25]OCT, fundus photography, BCVACentral macular thickness, fundus lesionsReduction in macular thickness and stabilization of lesions in the HBOT+ group
Kaldrim H, 2019 [26]OCT, EDI-OCT, fluorescein angiographyMacular and choroidal thicknessSignificant reduction in CT, no significant change in DR
Gun, 2022 [27]OCTMacular and choroidal thicknessSignificant increase in nasal CT after HBOT in eyes with DR
Drozdov, 2022 [8]OCT, BCVA, Clinical and biochemical examsRetinal light sensitivity, serum glucose levels, serum activities of enzymesImprovements in visual acuity, retinal light sensitivity and in antioxidant protection
Table 3. NIH Quality Assessment Tool for Before–After studies.
CriterionGun 2022 [27]Kaldirim 2019 [26]
1. Was the study question or objective clearly stated?YesYes
2. Were eligibility/selection criteria for the study population prespecified and clearly described?YesNR
3. Were the participants representative of those who would be eligible for the intervention in the general or clinical population?YesNR
4. Were all eligible participants that met the prespecified entry criteria enrolled?NRNR
5. Was the sample size sufficiently large to provide confidence in the findings?NoNo
6. Was the intervention clearly described and consistently delivered across the study population?YesYes
7. Were the outcome measures prespecified, clearly defined, valid, reliable, and assessed consistently across all study participants?YesYes
8. Were the people assessing the outcomes blinded to the participants’ exposures/interventions?NoNo
9. Was the loss to follow-up after baseline 20% or less?YesYes
10. Did the statistical methods examine changes in outcome measures from before to after the intervention?YesYes
11. Were outcome measures taken multiple times before and after the intervention?NoNo
12. If the intervention was conducted at a group level, did the analysis account for the use of individual-level data to determine effects at the group level?NANA
Table 4. GRADE Summary of Findings for the included studies.
Certainty Assessment№ of PatientsEffectCertaintyImportance
№ of StudiesStudy DesignRisk of BiasInconsistencyIndirectnessImprecisionOther ConsiderationsHyperbaric Oxygen Therapystandard TherapyRelative
(95% CI)
Absolute
(95% CI)
Visual acuity (assessed with: logMAR)
5 anon-randomised studiesSerious bnot seriousnot seriousnot seriousnone12135-see comment⨁⨁⨁◯
Moderate b
IMPORTANT
Central Macular Thickness (assessed with: OCT (Optical Coherence Tomography))
4 cnon-randomised studiesSerious dSerious enot seriousSerious fnone1120-see comment⨁◯◯◯
Very low d,e,f
IMPORTANT
Diabetic Retinopathy Progression (assessed with: Retinal grading/DR stage)
2 gnon-randomised studiesSerious hnot seriousserious iserious jnone35/35 (100.0%)11/35 (31.4%)not pooledsee comment⨁◯◯◯
Very low h,i,j
CRITICAL
Need for Rescue Treatment (assessed with: Intravitreal injection requirement)
2 knon-randomised studiesSerious lnot seriousnot seriousSerious mnone11/51 (21.6%)0/0not pooledsee comment⨁⨁◯◯
Low l,m
CRITICAL
The GRADE approach was used to evaluate the certainty of evidence for each critical or important outcome: visual acuity, central macular thickness, diabetic retinopathy progression, and need for rescue treatment. Visual acuity was rated as moderate certainty, while the other outcomes were rated low or very low due to limitations such as risk of bias, imprecision, and inconsistency. Explanatory footnotes summarize the rationale behind each downgrade, referencing study design limitations, small sample sizes, and heterogeneity. CI: confidence interval; MD: mean difference. a. Studies included: Sellman et al., 2020 [24]; Gun et al., 2022 [27]; Maalej et al., 2019 [25]; Drozdov et al., 2022 [8]; and Kaldirim et al., 2019 [26]. Although one randomized controlled trial was included (Sellman et al., 2020 [24]), the majority of included studies were prospective before–after designs, and this classification was adopted for the GRADE rating. b. The risk of bias was rated as serious due to the predominance of non-randomized before–after studies with no control group, limited blinding, and a lack of allocation concealment. Only one included study (Sellman et al., 2020 [24]) was a randomized controlled trial with low risk of bias, but the remaining studies (Drozdov et al., 2022 [8], Maalej et al., 2019 [25], Gun et al., 2022 [27], Kaldirim et al., 2019 [26]) showed methodological limitations in participant selection, outcome assessment, and control for confounding. c. Gun et al., 2022 [27], Drozdov et al., 2022 [8], Kaldirim et al., 2019 [26], and Maalej et al., 2019 [25]. d. All studies were before–after designs, lacking randomization and adequate control for confounders. Therefore, a serious risk of bias was judged. e. There was substantial variation in the direction and magnitude of CMT change across studies, with some reporting large reductions and others minimal effects. f. Small sample sizes and lack of reported confidence intervals increase uncertainty in the estimated effect. g. Sellman et al., 2020 [24] and Drozdov et al., 2022 [8]. h. Mixed study designs and lack of standardized, blinded assessment of DR progression introduce serious concerns regarding risk of bias. i. Definitions of DR progression were not consistent or validated across studies. j. Very low number of events and small samples result in very serious imprecision. k. Gun 2022 et al., [27] and Kaldirim et al., 2019 [26]. l. Both included studies were non-randomised before–after designs without a control group, with potential for selection bias and lack of blinding in outcome assessment. m. The total number of patients was limited (n = 51), with few events and wide confidence intervals, limiting the precision of the estimated effect. Circles indicate the level of certainty of the evidence according to the GRADE approach: ⨁◯◯◯ = very low, ⨁⨁◯◯ = low, ⨁⨁⨁◯ = moderate, ⨁⨁⨁⨁ = high.
Disclaimer/Publisher’s Note: The statements, opinions and data contained in all publications are solely those of the individual author(s) and contributor(s) and not of MDPI and/or the editor(s). MDPI and/or the editor(s) disclaim responsibility for any injury to people or property resulting from any ideas, methods, instructions or products referred to in the content.