Article

Peripheral Blood Gene Expression Profiling in Proliferative Diabetic Retinopathy Using NanoString Technology

1
Department of Ophthalmology and Eye Research Laboratory, Felsenstein Medical Research Center, Rabin Medical Center, Petach Tikva 4941492, Israel
2
Gray Faculty of Medical and Health Sciences, Tel Aviv University, Tel Aviv 6997801, Israel
3
The Krieger Eye Research Laboratory, Ruth and Bruce Rappaport Faculty of Medicine, Technion-Institute of Technology, Haifa 3498838, Israel
4
Department of Ophthalmology, Bnai-Zion Medical Center, Haifa 3339419, Israel
*
Author to whom correspondence should be addressed.
Diabetology 2025, 6(11), 132; https://doi.org/10.3390/diabetology6110132
Submission received: 14 August 2025 / Revised: 13 October 2025 / Accepted: 24 October 2025 / Published: 1 November 2025

Abstract

Background: Proliferative diabetic retinopathy (PDR) is a vision-threatening complication of diabetes characterized by retinal neovascularization. Predicting which diabetic patients will develop PDR remains challenging. Measuring mRNA expression levels may help elucidate the molecular pathways involved in PDR pathogenesis. This study investigated the expression of genes related to inflammatory and proliferative pathways in the peripheral blood of patients with PDR, compared to patients with non-proliferative diabetic retinopathy (NPDR) and healthy controls, using NanoString technology. The findings may aid in identifying potential biomarkers and therapeutic targets for early intervention. Methods: This prospective study was approved by the institutional ethics review board, and written informed consent was obtained from all participants. The study included patients with PDR (n = 9), NPDR (n = 8), and non-diabetic controls (n = 6). Total RNA was extracted from whole blood samples using the MagNA Pure Compact RNA Isolation Kit (Roche Ltd., Basel, Switzerland) and analyzed with the NanoString platform (Agentek Ltd., Yakum, Israel). Results: Expression levels of 578 genes across 15 signaling pathways, including inflammation (e.g., IL-17, TNF, and NF-κB) and cancer-related PI3K-Akt pathways, were evaluated. Sixty-six genes (11.5%) were differentially expressed (p < 0.05) between the PDR group and the NPDR and control groups. The most prominently overexpressed genes in PDR included TGFβ1, TGFβ1R, IL23R, BAX, and CFB, which were primarily involved in inflammatory and proliferative signaling. Conclusions: Gene expression profiling using NanoString technology revealed significant upregulation of genes related to inflammation and proliferation in patients with PDR. These findings suggest that beyond angiogenesis, inflammatory and proliferative pathways may play a central role in PDR development and could serve as targets for novel therapeutic strategies.

1. Introduction

Diabetes mellitus is a prevalent metabolic disorder associated with multiple microvascular complications, among which diabetic retinopathy (DR) remains a leading cause of visual impairment and blindness worldwide [1,2]. The diagnosis and classification of DR are primarily based on the evaluation of retinal microvascular changes. Proliferative diabetic retinopathy (PDR) represents an advanced and severe stage of the disease, characterized by retinal neovascularization, and is associated with a high risk of irreversible vision loss [3]. While poor glycemic control and longer disease duration are known risk factors, some patients, particularly younger individuals with relatively short disease duration and adequate metabolic control, nonetheless develop PDR [4]. This observation supports a possible genetic predisposition to PDR.
The pathophysiology of diabetic retinopathy is complex and multifactorial, involving metabolic, genetic, and environmental components [5]. The non-proliferative phase is characterized by retinal microvascular changes, such as microaneurysms, intraretinal hemorrhages, venous beading, and pericyte loss, which often remain asymptomatic [6]. If untreated, this phase may progress to PDR, a condition marked by retinal neovascularization and increased risk of vision loss. Typically, PDR develops after 10–15 years of poorly controlled diabetes, although some patients progress more rapidly [7,8,9]. Previous studies have investigated the genetic contribution to DR, implicating a range of biological pathways including angiogenesis, oxidative stress response, insulin signaling, inflammation, and neurogenesis [10,11,12,13,14,15]. Although over 65 genes have been linked to DR susceptibility, no consistent genetic profile has emerged to reliably identify individuals at risk for progression to PDR.
Recent advances in molecular profiling, particularly the NanoString platform, enable direct quantification of mRNA transcripts and facilitate the detection of gene expression changes without the need for reverse transcription or amplification [16]. This platform allows researchers to assess the activity of genes within specific biological pathways relevant to disease progression. In the context of DR, altered expression of genes related to inflammation and proliferation may reflect early molecular events associated with the transition to PDR.
In this study, we aimed to investigate whether gene expression profiling using the NanoString platform could distinguish patients with PDR from those with non-proliferative diabetic retinopathy (NPDR) or no retinopathy. By analyzing mRNA extracted from peripheral blood and focusing on genes involved in inflammatory and proliferative pathways, we sought to identify a blood-based molecular signature associated with PDR. Our goal was to evaluate the feasibility of this minimally invasive approach for early identification of patients at risk for vision-threatening complications and facilitate future development of targeted therapeutic strategies.

2. Materials and Methods

2.1. Study Design and Patients

This prospective study was conducted at a tertiary medical center and adhered to the tenets of the Declaration of Helsinki. Ethical approval was obtained from the local institutional review board, and written informed consent was obtained from all participants prior to enrollment.
The study population included three groups: patients diagnosed with PDR (n = 9), patients with NPDR (n = 8), and age-matched healthy controls without diabetes (n = 6). Peripheral venous blood samples were collected from all participants. Total RNA was extracted from the samples, and gene expression profiling was performed using NanoString technology.

2.2. Sample Collection

Peripheral venous blood samples were collected from each participant using a sterile 25-gauge needle into 5 mL EDTA-containing tubes. Samples were gently inverted several times to ensure proper anticoagulation and processed immediately or stored at 4 °C until RNA extraction.

2.3. RNA Extraction

Total RNA was extracted from whole blood samples using the MagNA Pure Compact kit and the MagNA Pure Compact RNA Isolation Kit (Roche Ltd., Basel, Switzerland), following the manufacturer’s protocol. Gene expression analysis was performed using the NanoString platform (Agentek Ltd., Yakum, Israel), which allows direct multiplexed quantification of mRNA transcripts without the need for reverse transcription or amplification.

2.4. NanoString Technique

Gene expression profiling was performed using the NanoString nCounter Analysis System (NanoString Technologies, Seattle, WA, USA). This platform enables direct multiplexed measurement of mRNA transcripts through hybridization with color-coded probe pairs, without the need for reverse transcription or amplification. The assay allows for high sensitivity and precision in quantifying gene expression levels across multiple predefined targets in a single reaction. Data were processed and normalized using the NanoString nSolver software v4.0.70 according to the manufacturer’s guidelines.

2.5. Molecular Analysis Procedure

Molecular analysis was performed using the NanoString nCounter Analysis System (NanoString Technologies, Seattle, WA, USA), which allows for multiplexed, direct digital quantification of mRNA transcripts without the need for reverse transcription, cDNA synthesis, or amplification. Total RNA extracted from peripheral blood was quantified using spectrophotometry, and 100–150 ng of RNA per sample was used for each hybridization reaction, following the manufacturer’s recommendations.
Each sample was hybridized overnight (16–20 h) at 65 °C with a custom CodeSet containing pairs of reporter and capture probes designed to target 578 genes relevant to inflammatory and proliferative pathways. Reporter probes carry a fluorescent barcode unique to each target, while capture probes allow immobilization of probe-target complexes. After hybridization, reactions were processed in the nCounter Prep Station, where unbound probes were removed through a series of automated wash steps, and probe-target complexes were aligned and immobilized on a streptavidin-coated cartridge.
The cartridges were then scanned using the nCounter Digital Analyzer (NanoString Technologies, Inc., Seattle, WA, USA), which performs direct single-molecule imaging and counts individual barcodes, resulting in raw digital transcript counts for each gene. These raw counts were subjected to quality control, including verification of imaging fields-of-view, and were normalized in a two-step process: (1) technical normalization using internal positive spike-in controls and background correction using negative controls, and (2) biological normalization to selected housekeeping genes to correct for sample-to-sample variability in RNA input and quality.
The final output represents background-subtracted, normalized digital counts for each target gene. Because the nCounter platform is not sequencing-based, these data are not expressed as transcripts per million (TPM) but rather as absolute counts normalized to internal controls and housekeeping genes. Normalized expression data were analyzed using the NanoString nSolver Analysis Software to identify differentially expressed genes and generate pathway-level insights.

2.6. Bioinformatics Analysis

Gene Ontology (GO) enrichment analysis was performed using g:Profiler (https://biit.cs.ut.ee/gprofiler, version e113_eg59_p19_f6a03c19, accessed 3 October 2025). The list of differentially expressed genes was queried against the human genome as background, and enrichment was calculated across GO Biological Process, Molecular Function, and Cellular Component categories. p values were corrected for multiple testing using the default g:SCS algorithm, and adjusted p < 0.05 was considered statistically significant.

2.7. Statistical Analysis

Continuous variables are presented as mean ± standard deviation (SD), and categorical variables as absolute numbers and percentages. Gene expression levels between groups (PDR, NPDR, and controls) were compared using unpaired Student’s t-test or one-way ANOVA, as appropriate. A p-value of <0.05 was considered statistically significant. All statistical analyses were performed using SPSS for Windows (version 29; IBM Corp., Armonk, NY, USA). NanoString gene expression data were normalized using internal positive controls and housekeeping genes within the nSolver analysis software (NanoString Technologies).

3. Results

A total of 23 participants were enrolled in the study: 9 with PDR, 8 with NPDR, and 6 non-diabetic controls. Table 1 presents demographic and laboratory data of the study cohort. Representative OCT images from two individuals in each group (controls, NPDR, and PDR) are presented in Figure 1, demonstrating the characteristic retinal morphology of each category. The PDR group included 5 males, while the NPDR and control groups each included 3 males. The mean age was 61 ± 8 years for PDR patients, 76 ± 10 years for NPDR, and 58 ± 17 years for controls. All PDR patients had a history of hypertension; 6 had hyperlipidemia, 1 had chronic renal failure, 1 had congestive heart failure, and 1 had a previous cerebrovascular accident. Mean HbA1c levels were 8.6 ± 1.5 in the PDR group, 6.9 ± 0.46 in the NPDR group, and 5.3 ± 0.26 in the control group. Duration of diabetes ranged from 7 to 33 years in the PDR group (mean 18 ± 10) and from 6 to 24 years in the NPDR group (mean 16 ± 7.5).
Total RNA was extracted from whole blood samples, and mRNA expression levels were successfully analyzed using NanoString technology for all patients.

3.1. Gene Expression Analysis

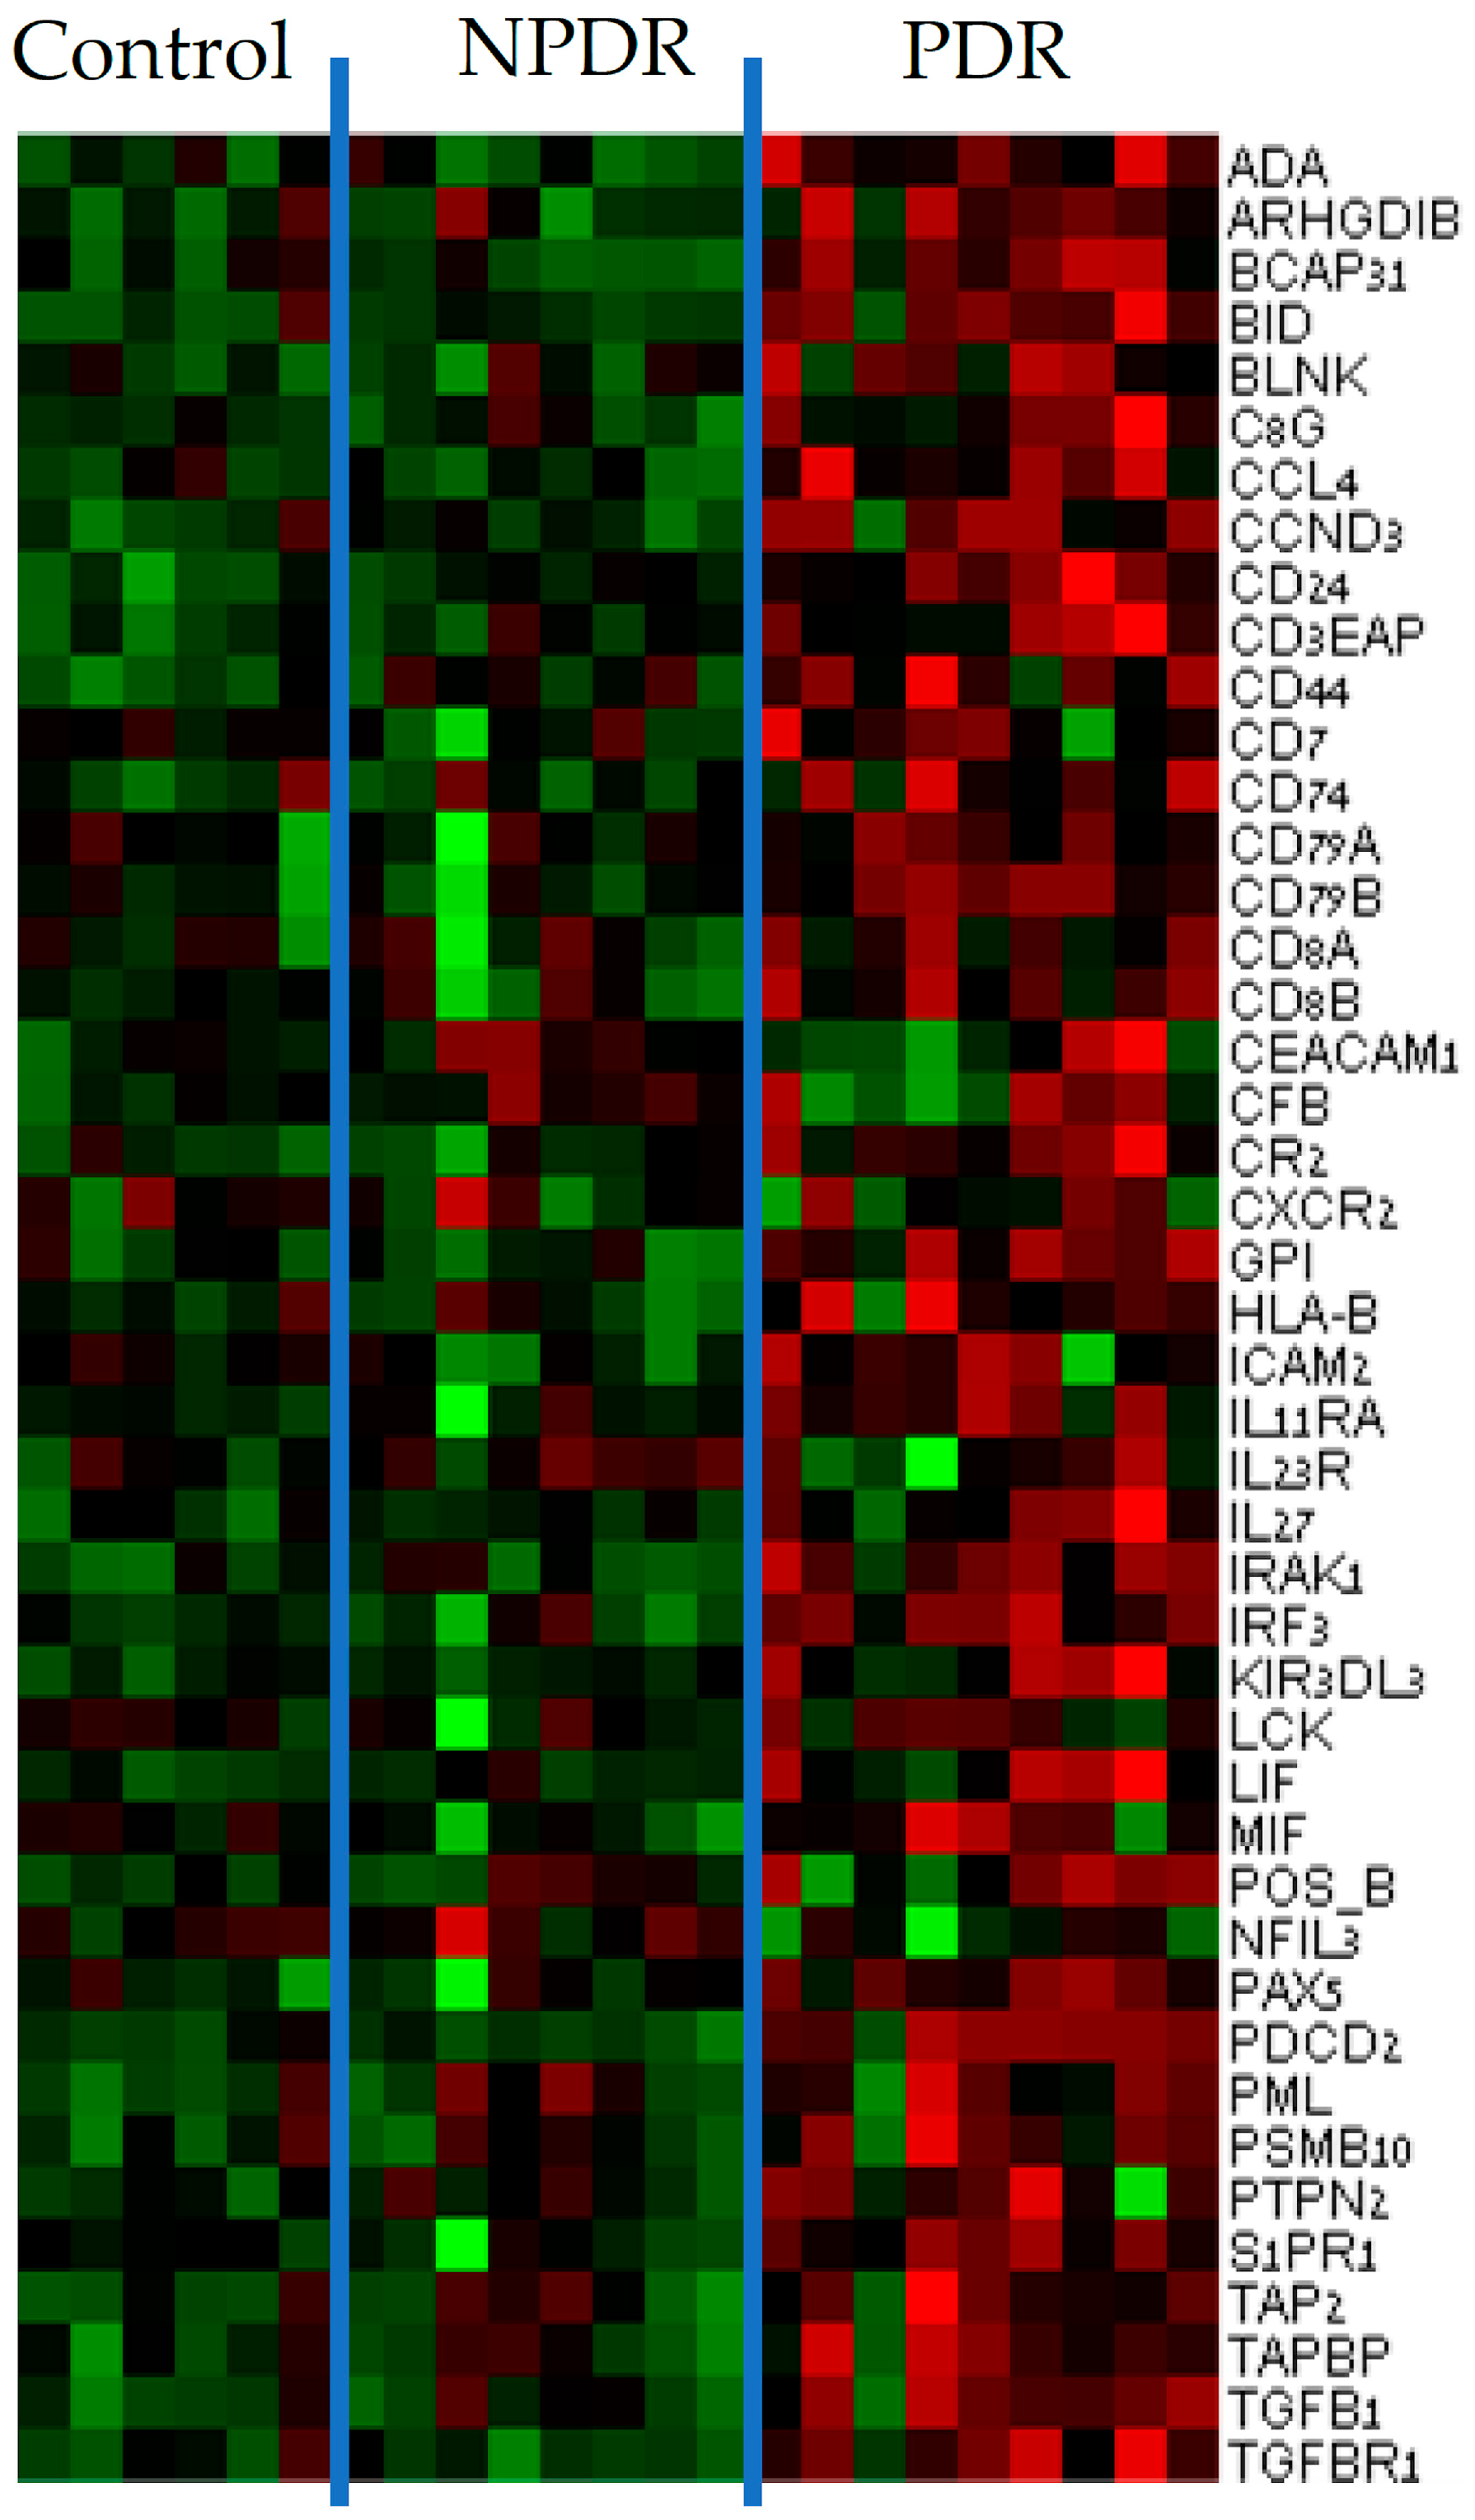
Expression levels of 578 genes associated with inflammation and cancer-related pathways (a total of 15 biological pathways) were evaluated across all samples. A total of 66 genes (11.5%) were found to be significantly differentially expressed between the PDR group and the NPDR/control groups (p < 0.05) (Figure 2). Bioinformatic pathway analysis using nSolver™ Analysis Software v4.0.70 was conducted to identify the most relevant pathways involved in PDR development.
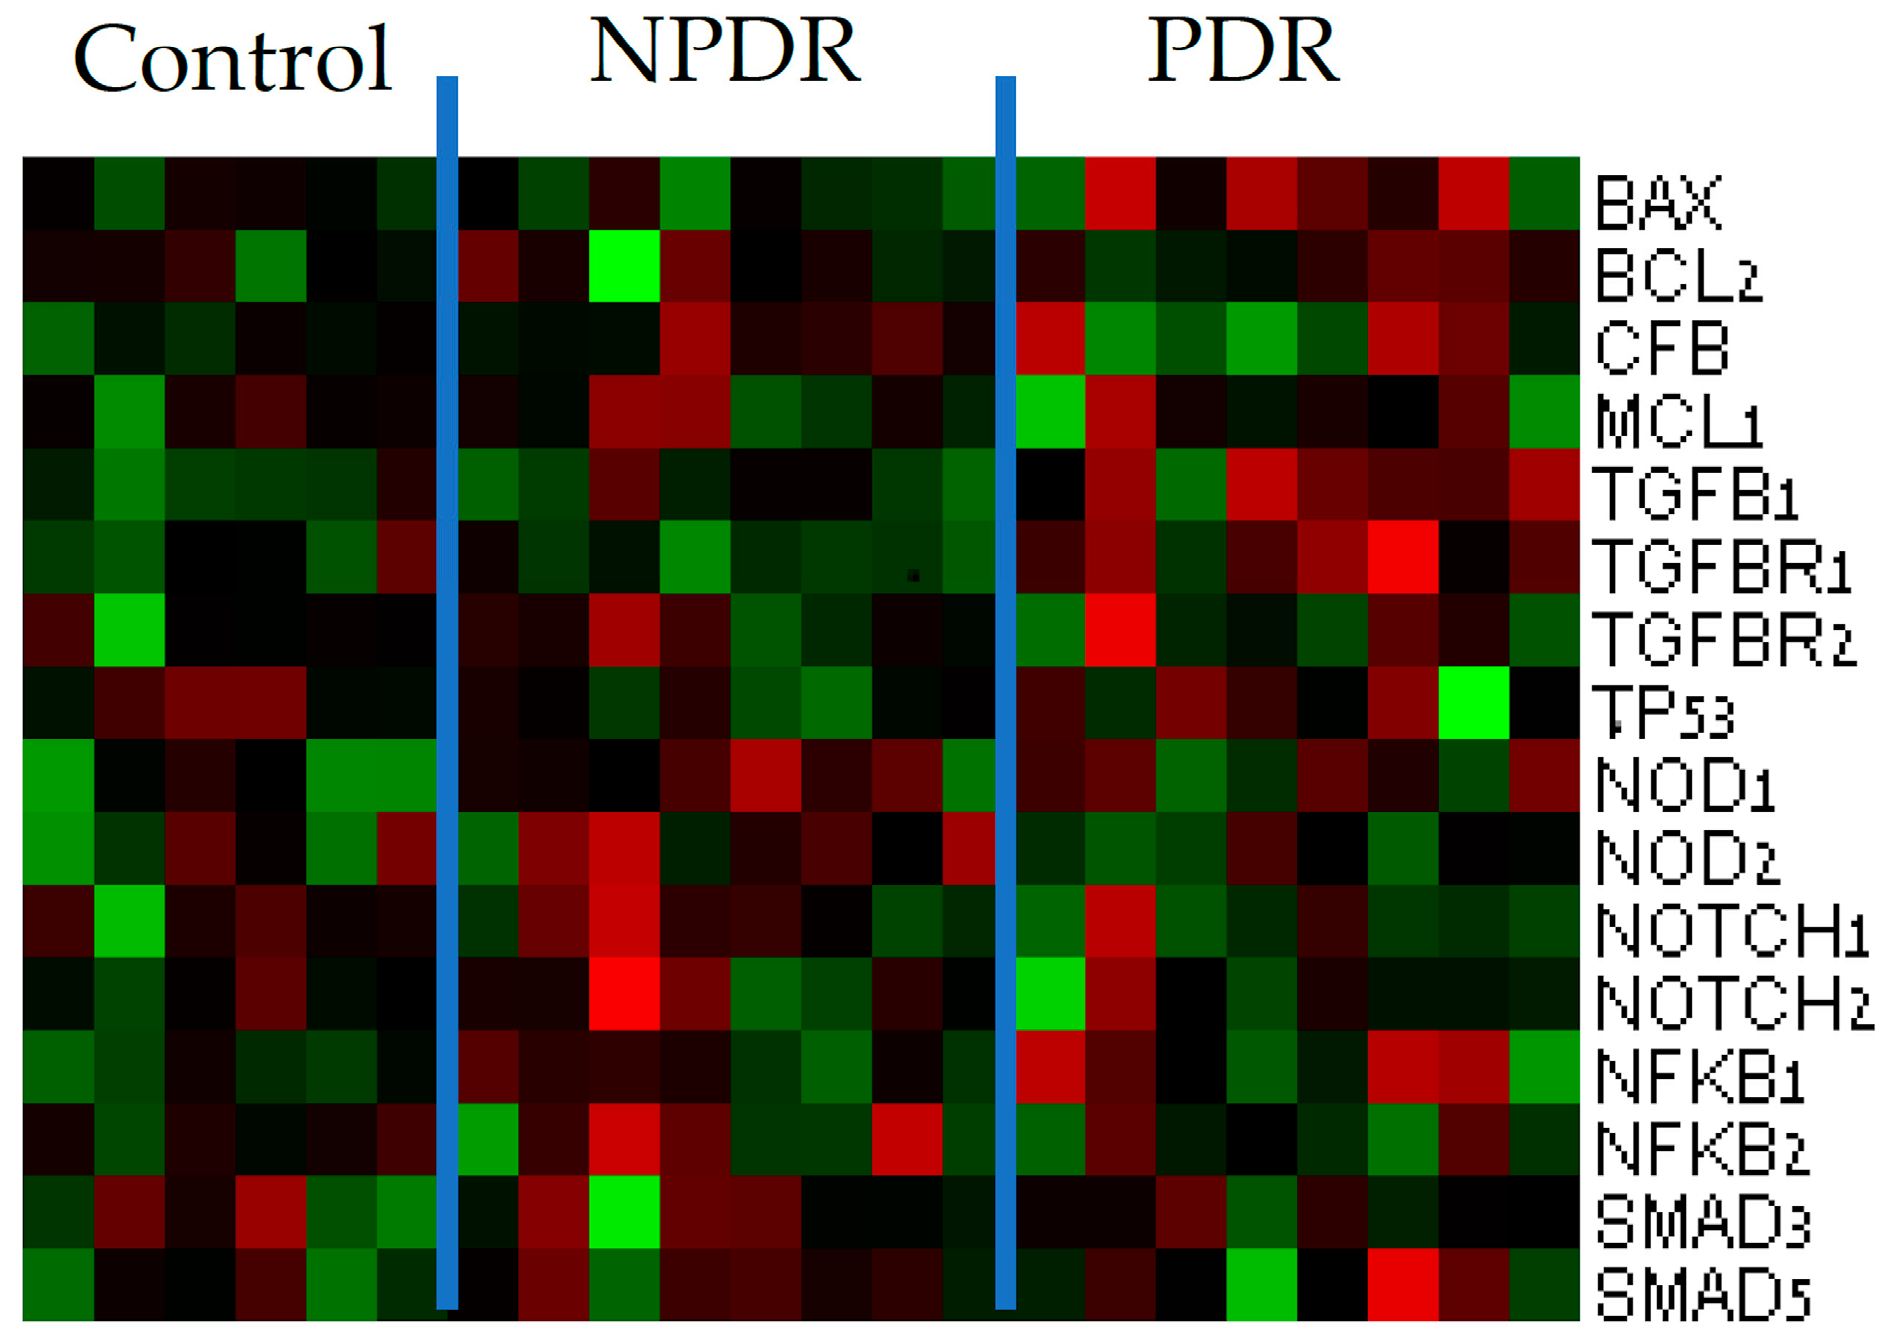
Among the 66 differentially expressed genes, 14 were notably overexpressed in the PDR group and mapped to proliferative and cancer-related pathways. These included BCL2, TGFβR, BAX, CFB, and IL23R (Figure 3).

3.2. Gene Ontology Enrichment Analysis

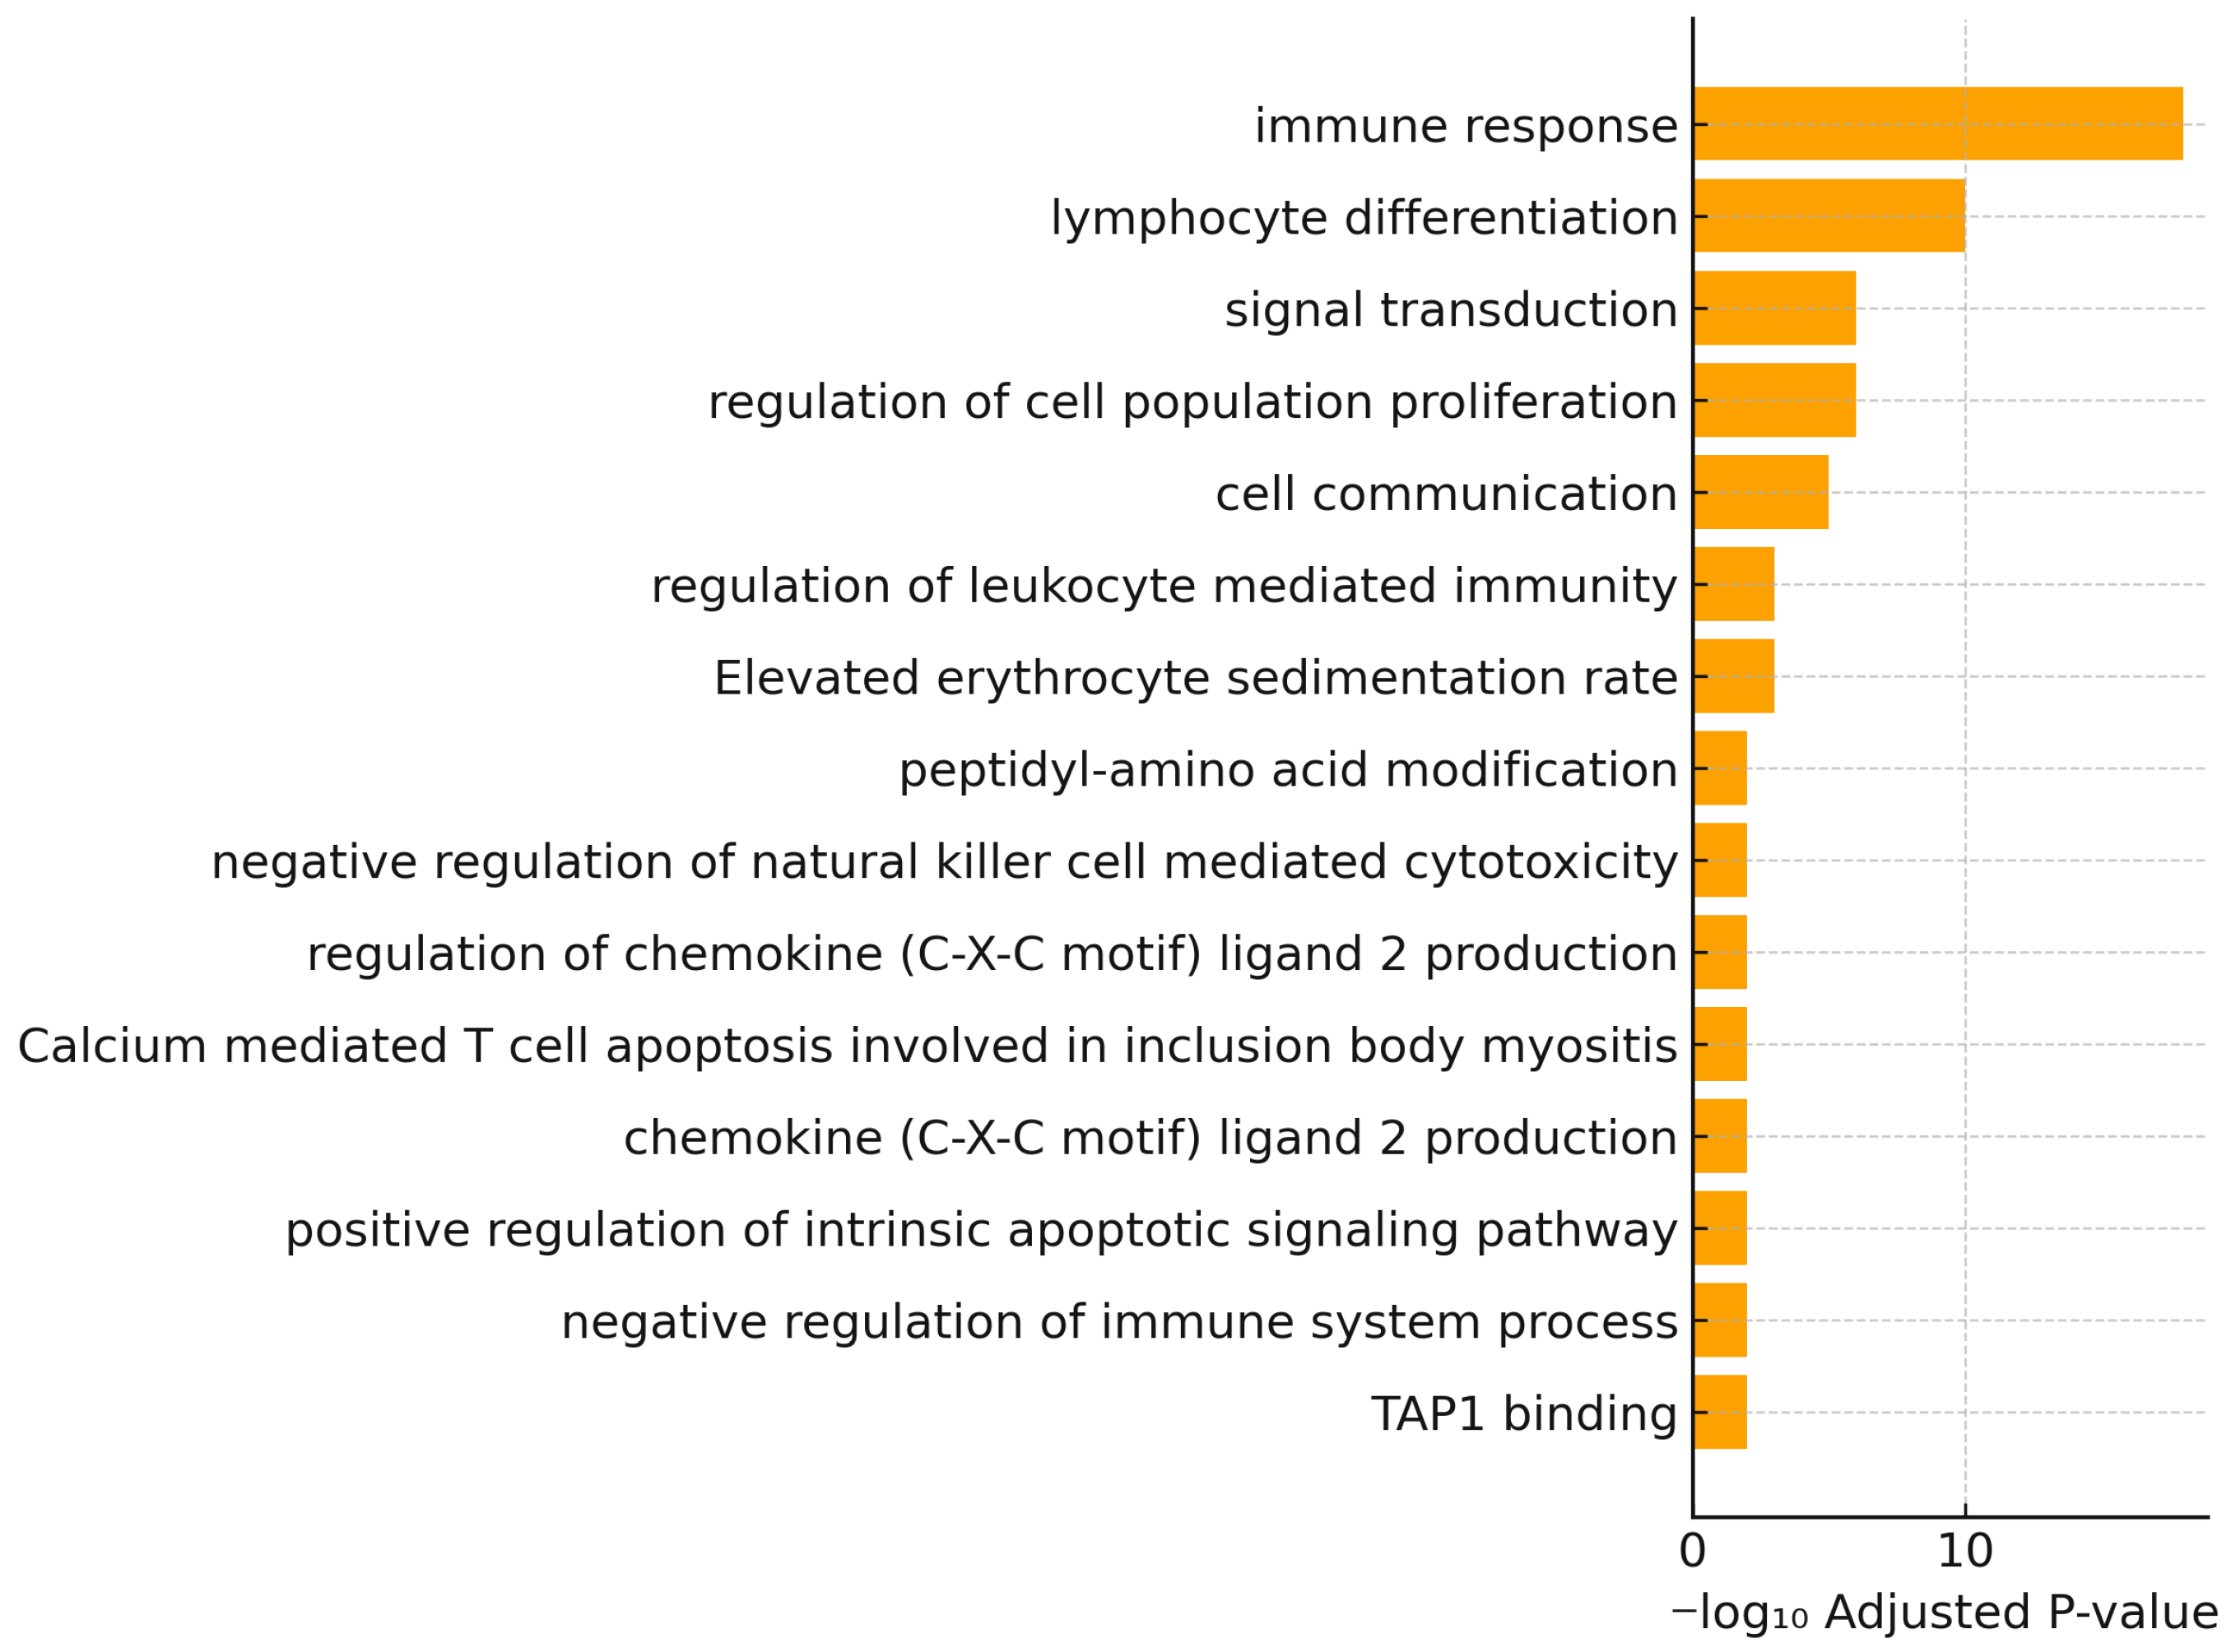
Gene Ontology (GO) enrichment analysis of the differentially expressed genes revealed highly significant enrichment of immune-related processes, including immune system process, immune response, lymphocyte activation, and leukocyte activation (adjusted p values as low as 10−23). Additional enriched categories included cytokine activity, signaling receptor binding, MHC protein complex binding, complement activation, and apoptotic regulation. A summary of the top enriched GO terms is presented in Table 2, and the top categories are illustrated in Figure 4.

4. Discussion

In this study, we identified distinct gene expression signatures in the peripheral blood of patients with PDR compared to those with NPDR and healthy controls. Using the NanoString platform, we demonstrated differential expression of 66 genes, many of which are implicated in key inflammatory, immune, proliferative, and apoptotic pathways. Notably, genes such as TGFβR, BCL2, BAX, IL23R, and CFB were significantly overexpressed in PDR patients, suggesting a systemic molecular fingerprint of advanced retinal disease.
Our findings reinforce the emerging understanding that PDR is not solely driven by angiogenesis but also by chronic low-grade inflammation, oxidative stress, and immune dysregulation [17]. This is consistent with recent transcriptomic and proteomic studies showing that patients with PDR exhibit elevated circulating levels of pro-inflammatory cytokines (IL-6, TNF-α), angiogenic mediators [vascular endothelial growth factor (VEGF)], and apoptotic markers (caspase-3), along with increased oxidative stress indicators such as malondialdehyde (MDA) and 4-hydroxynonenal (4HNE) [18]. These alterations are accompanied by decreased antioxidant defenses, including superoxide dismutase (SOD) and catalase (CAT), indicating systemic redox imbalance [18].
Pathway-level analyses in prior work have also implicated VEGF signaling, NF-κB activation, Toll-like receptor pathways (TLR4), complement activation, endoplasmic reticulum stress (e.g., TP53, TXNIP, TRAM1), and extracellular matrix remodeling (e.g., CTGF, SERPINH1, LOX) in the progression of PDR [19,20,21]. Our identification of IL23R and CFB among the upregulated genes adds further support to the role of adaptive immunity and complement system involvement in PDR, as IL-23 promotes Th17-mediated inflammation and CFB amplifies the alternative complement cascade, a pathway increasingly recognized in retinal microvascular injury [19,21].
Of note, several of the genes identified in our analysis, particularly IL23R and CFB, have not previously been reported in human peripheral blood expression studies comparing NPDR and PDR, suggesting a potentially novel association with disease progression. Other genes such as BAX, BCL2, TGFBR1/2, TNF, and NFKB1 have been implicated in diabetic retinopathy in vitreous or retinal tissue, and our findings extend these observations by demonstrating differential expression between NPDR and PDR in blood.
The functional significance of these transcriptional changes was supported by Gene Ontology enrichment analysis, which demonstrated strong overrepresentation of immune-related processes, including immune system process, lymphocyte and leukocyte activation, and immune response, with adjusted p values as low as 10−18. Enrichment for cytokine activity, signaling receptor binding, and MHC protein complex binding further emphasizes the role of adaptive immunity and antigen presentation in the transition from NPDR to PDR. Complement-related categories, driven in part by CFB and C8G, were also enriched, highlighting amplification of the alternative complement pathway, while apoptotic regulation reflected the contribution of pro-apoptotic genes such as BAX and BID. Together, these results provide functional validation of our gene-level findings and suggest that PDR progression is mediated not only by angiogenic mechanisms but also by systemic immune activation, complement amplification, and dysregulated cell survival pathways.
With the emergence of artificial intelligence-based analytical approaches, future research may focus on integrating the expression profiles of multiple genes to identify reproducible molecular patterns associated with disease progression. Even in the absence of a single novel gene, characteristic expression signatures comprising several upregulated genes may, with sufficient data and machine learning, become diagnostic or prognostic tools for early detection of PDR.
Previous blood-based gene expression studies in PDR have primarily relied on bulk transcriptomic techniques (e.g., microarrays, qPCR, or RNA-seq) [22,23,24]. Our study is the first, to our knowledge, to apply NanoString nCounter technology to compare NPDR and PDR, enabling direct, amplification-free digital quantification of gene expression. NanoString allows multiplexed, direct digital quantification of RNA transcripts without reverse transcription or amplification, offering high sensitivity and reproducibility in analyzing clinical samples. This platform is well suited to detect modest yet biologically relevant changes in gene expression, especially when sample input is limited or RNA integrity is suboptimal, a common challenge in blood-based assays.
Importantly, our results support and extend the findings of prior studies conducted in adult populations with type 2 diabetes and advanced retinopathy. These studies typically compare PDR patients to diabetic individuals without retinopathy or to healthy controls and consistently identify upregulation of inflammatory, angiogenic, and apoptotic markers in the peripheral blood [18,22]. By including NPDR patients as an intermediate group, our study provides insight into potential transcriptional shifts associated with retinopathy progression. Although this was a cross-sectional analysis, the differential expression observed in PDR, but not NPDR, suggests that some of these molecular changes may be linked to the transition from non-proliferative to proliferative stages.
Another key observation is the overexpression of BAX and BCL2, genes central to mitochondrial-mediated apoptosis. Their concurrent upregulation may reflect a dysregulated balance between cell survival and programmed cell death, possibly contributing to ongoing retinal injury [19]. Likewise, TGFβR overexpression suggests an active profibrotic and immunomodulatory axis, which has been linked to endothelial-mesenchymal transition and neovascular membrane formation in diabetic eyes [21].
Despite the success of anti-VEGF therapies in managing PDR, there remains an ongoing search for additional intraocular targets that could address the broader pathophysiology of the disease [25]. Current treatments primarily focus on angiogenic mediators such as VEGF and angiopoietin, yet do not fully address the inflammatory and neurodegenerative components of diabetic retinopathy [26,27]. Our findings highlight upregulated inflammatory and apoptotic markers and underscore the potential utility of targeting non-angiogenic pathways, such as IL-23 signaling or complement activation, for therapeutic modulation. As such, expanding the therapeutic landscape to include anti-inflammatory, immunomodulatory, or anti-apoptotic agents for intraocular administration may offer complementary or alternative strategies for patients who do not adequately respond to VEGF inhibition [28,29].
While our findings are promising, the study has several limitations. The relatively small sample size reduces statistical power and limits subgroup analyses based on age, diabetes duration, or systemic comorbidities such as hypertension and renal disease, which were present in several PDR patients. Although peripheral blood profiling offers a minimally invasive window into disease biology, it may not fully capture retina-specific events. Nevertheless, the overlap between systemic and intraocular molecular alterations in diabetic retinopathy has been repeatedly demonstrated [30,31], supporting the relevance of blood-based biomarkers. Finally, this study was not powered to calculate relative risk or odds ratios for progression to PDR, and such risk estimates will require larger, longitudinal cohorts that track clinical conversion over time.
Moreover, the functional consequences of the observed transcriptional changes remain to be elucidated. Further studies incorporating protein-level validation, single-cell transcriptomics, and functional assays (e.g., pathway inhibition or gene knockdown) are necessary to determine whether these differentially expressed genes are causally involved in PDR pathogenesis or represent downstream markers of tissue injury. In addition, integrating gene expression data with methylation profiling [22] and metabolomic or proteomic data [32] may yield a more comprehensive picture of the disease process and help refine predictive models. Such integrative approaches could also clarify whether the observed transcriptional signature reflects disease-specific alterations or underlying inter-individual variability, including genetic polymorphisms in inflammatory, complement, and apoptotic pathways. These polymorphisms could predispose certain patients to an exaggerated retinal response to the metabolic stress of diabetes, thereby accelerating progression from NPDR to PDR. Notably, several of the upregulated genes in our study (e.g., IL23R, CFB, BAX) are involved in immune activation, complement amplification, and apoptosis, suggesting that similar molecular patterns might be present in other ocular diseases driven by inflammation or neovascularization, such as neovascular age-related macular degeneration, retinal vein occlusion, or uveitis-related neovascularization. Future work comparing peripheral blood gene expression across these conditions, and in non-diabetic cohorts, will be essential to determine whether the observed profile represents a PDR-specific fingerprint or a broader systemic pro-inflammatory and pro-angiogenic phenotype.
Interestingly, analysis of the normalized NanoString data revealed that a subset of NPDR patients exhibited expression levels for several of the most strongly upregulated genes in PDR, including BAX, BCL2, TGFBR1, TGFBR2, CFB, IL23R, NFKB1, and TNF, that overlapped with or approached those of the PDR group. For example, IL23R expression in one NPDR patient exceeded that of most PDR samples, and several NPDR patients had BAX and BCL2 expression within the PDR range. These findings suggest that partial activation of apoptotic, immune, and complement pathways may already be present in some NPDR individuals, possibly indicating a pre-proliferative molecular phenotype. This observation supports the concept of a molecular continuum between NPDR and PDR and highlights the potential of these genes as candidate biomarkers for progression. Longitudinal studies will be essential to determine whether these transcriptional profiles precede clinical conversion to PDR and could guide early identification of high-risk patients.
Looking ahead, future research should focus on longitudinal studies to assess whether the identified gene signatures precede the clinical onset of PDR, and whether they can be modulated by pharmacological interventions. The ultimate goal would be to develop a non-invasive blood-based diagnostic panel that incorporates inflammatory and proliferative gene markers to facilitate early risk stratification, personalized monitoring, and targeted therapy for diabetic patients.

5. Conclusions

This study demonstrates that NanoString-based gene expression profiling can reveal systemic molecular alterations in patients with PDR, supporting the involvement of inflammatory, immune, angiogenic, apoptotic, and fibrotic pathways in disease pathogenesis. Gene expression profiling using NanoString technology may aid in distinguishing PDR patients from NPDR patients and healthy individuals based on inflammatory and proliferative pathway activation. These findings highlight the potential of peripheral blood as a source of clinically useful biomarkers and underscore the need for integrative, multi-omics approaches to improve prediction and prevention of vision-threatening diabetic retinopathy.

Author Contributions

Conceptualization, A.Z., S.W. and N.G.-C.; methodology, A.Z., S.W., J.A.D., T.S. and N.G.-C.; formal analysis, A.Z., S.W., J.A.D., T.S. and N.G.-C.; investigation, A.Z., S.W., J.A.D., T.S. and N.G.-C.; resources, N.G.-C.; data curation, S.W., J.A.D., T.S. and N.G.-C.; writing—original draft preparation, A.Z., S.W. and N.G.-C.; writing—review and editing, A.Z., S.W., J.A.D., T.S. and N.G.-C.; supervision, N.G.-C.; funding acquisition, N.G.-C. All authors have read and agreed to the published version of the manuscript.

Funding

This study was supported in part by the Zanvyl and Isabelle Krieger Fund, Baltimore, MD, USA (N.G.-C.).

Institutional Review Board Statement

The study was conducted in accordance with the Declaration of Helsinki, and approved by the Institutional Review Board (or Ethics Committee) of Bani Zion Medical Center, Israel, approval number 0121-16-BNZ, 20 April 2017.

Informed Consent Statement

Informed consent was obtained from all subjects involved in the study.

Data Availability Statement

The raw data supporting the conclusions of this article will be made available by the authors on request.

Conflicts of Interest

The authors declare no conflicts of interest.

Abbreviations

The following abbreviations are used in this manuscript:
PDRProliferative diabetic retinopathy
NPDRNon-proliferative diabetic retinopathy
DRDiabetic retinopathy
VEGFVascular endothelial growth factor
MDAMalondialdehyde
4HNE4-hydroxynonenal
SODSuperoxide dismutase
CATCatalase
TLR4Toll-like receptor 4

References

  1. Choi, T.B.; Boado, R.J.; Pardridge, W.M. Blood-brain barrier glucose transporter mRNA is increased in experimental diabetes mellitus. Biochem. Biophys. Res. Commun. 1989, 164, 375–380. [Google Scholar] [CrossRef] [PubMed]
  2. Veenstra, A.; Liu, H.; Lee, C.A.; Du, Y.; Tang, J.; Kern, T.S. Diabetic retinopathy: Retina-specific methods for maintenance of diabetic rodents and evaluation of vascular histopathology and molecular abnormalities. Curr. Protoc. Mouse Biol. 2015, 5, 247–270. [Google Scholar] [CrossRef]
  3. Pusparajah, P.; Lee, L.H.; Abdul Kadir, K. Molecular markers of diabetic retinopathy: Potential screening tool of the future? Front. Physiol. 2016, 7, 200. [Google Scholar] [CrossRef]
  4. Cho, H.; Sobrin, L. Genetics of diabetic retinopathy. Curr. Diab. Rep. 2014, 14, 515. [Google Scholar] [CrossRef]
  5. Morya, A.K.; Ramesh, P.V.; Nishant, P.; Kaur, K.; Gurnani, B.; Heda, A.; Salodia, S. Diabetic retinopathy: A review on its pathophysiology and novel treatment modalities. World J. Methodol. 2024, 14, 95881. [Google Scholar] [CrossRef]
  6. Marques, I.P.; Ribeiro, M.L.; Santos, T.; Reste-Ferreira, D.; Mendes, L.; Martinho, A.C.; Santos, A.R.; Figueira, J.; Lobo, C.; Cunha-Vaz, J. Patterns of progression of nonproliferative diabetic retinopathy using non-invasive imaging. Transl. Vis. Sci. Technol. 2024, 13, 22. [Google Scholar] [CrossRef]
  7. Ehrlich, R.; Zahavi, A.; Axer-Siegel, R.; Budnik, I.; Dreznik, A.; Dahbash, M.; Nisgav, Y.; Megiddo, E.; Kenet, G.; Weinberger, D.; et al. Correlation between Interleukin-6 and thrombin-antithrombin iii complex levels in retinal diseases. Curr. Eye Res. 2017, 42, 1269–1272. [Google Scholar] [CrossRef]
  8. Tsuboi, K.; Mazloumi, M.; Guo, Y.; Wang, J.; Flaxel, C.J.; Bailey, S.T.; Wilson, D.J.; Huang, D.; Jia, Y.; Hwang, T.S. Early sign of retinal neovascularization evolution in diabetic retinopathy: A longitudinal OCT angiography study. Ophthalmol. Sci. 2023, 4, 100382. [Google Scholar] [CrossRef]
  9. Dorchy, H.; Claes, C.; Verougstraete, C. Risk factors of developing proliferative retinopathy in type 1 diabetic patients: Role of BMI. Diabetes Care 2002, 25, 798–799. [Google Scholar] [CrossRef] [PubMed]
  10. Sharma, A.; Valle, M.L.; Beveridge, C.; Liu, Y.; Sharma, S. Unraveling the role of genetics in the pathogenesis of diabetic retinopathy. Eye 2019, 33, 534–541. [Google Scholar] [CrossRef] [PubMed]
  11. Petrovič, D. Candidate genes for proliferative diabetic retinopathy. BioMed Res. Int. 2013, 2013, 540416. [Google Scholar] [CrossRef]
  12. Warpeha, K.M.; Chakravarthy, U. Molecular genetics of microvascular disease in diabetic retinopathy. Eye 2003, 17, 305–311. [Google Scholar] [CrossRef] [PubMed]
  13. Ng, D.P. Human genetics of diabetic retinopathy: Current perspectives. J. Ophthalmol. 2010, 2010, 172593. [Google Scholar] [CrossRef]
  14. Patel, S.; Chen, H.; Tinkham, N.H.; Zhang, K. Genetic susceptibility of diabetic retinopathy. Curr. Diab. Rep. 2008, 8, 257–262. [Google Scholar] [CrossRef]
  15. Petrovic, M.G.; Korosec, P.; Kosnik, M.; Osredkar, J.; Hawlina, M.; Peterlin, B.; Petrovic, D. Local and genetic determinants of vascular endothelial growth factor expression in advanced proliferative diabetic retinopathy. Mol. Vis. 2008, 14, 1382–1387. [Google Scholar]
  16. Estopinal, C.B.; Chocron, I.M.; Parks, M.B.; Wade, E.A.; Roberson, R.M.; Burgess, L.G.; Brantley, M.A., Jr.; Samuels, D.C. Mitochondrial haplogroups are associated with severity of diabetic retinopathy. Investig. Ophthalmol. Vis. Sci. 2014, 55, 5589–5595. [Google Scholar] [CrossRef] [PubMed]
  17. Kim, Y.W.; West, X.Z.; Byzova, T.V. Inflammation and oxidative stress in angiogenesis and vascular disease. J. Mol. Med. 2013, 91, 323–328. [Google Scholar] [CrossRef]
  18. Andrés-Blasco, I.; Gallego-Martínez, A.; Machado, X.; Cruz-Espinosa, J.; Di Lauro, S.; Casaroli-Marano, R.; Alegre-Ituarte, V.; Arévalo, J.F.; Pinazo-Durán, M.D. Oxidative stress, inflammatory, angiogenic, and apoptotic molecules in proliferative diabetic retinopathy and diabetic macular edema patients. Int. J. Mol. Sci. 2023, 24, 8227. [Google Scholar] [CrossRef]
  19. Chen, H.; Chen, E.; Liu, M.; Wang, J.; Yin, J.; Zhao, P.; Xu, Y. Identification of immune-related endoplasmic reticulum stress genes in proliferative diabetic retinopathy using bioinformatics analysis. Front. Endocrinol. 2024, 15, 1341206. [Google Scholar] [CrossRef]
  20. Miao, A.; Lu, J.; Wang, Y.; Mao, S.; Cui, Y.; Pan, J.; Li, L.; Luo, Y. Identification of the aberrantly methylated differentially expressed genes in proliferative diabetic retinopathy. Exp. Eye Res. 2020, 199, 108141. [Google Scholar] [CrossRef] [PubMed]
  21. Zou, G.; Que, L.; Liu, Y.; Lu, Q. Interplay of endothelial-mesenchymal transition, inflammation, and autophagy in proliferative diabetic retinopathy pathogenesis. Heliyon 2024, 10, e25166. [Google Scholar] [CrossRef]
  22. Chen, H.; Zhang, X.; Liao, N.; Ji, Y.; Mi, L.; Gan, Y.; Su, Y.; Wen, F. Identification of NLRP3 inflammation-related gene promoter hypomethylation in diabetic retinopathy. Investig. Ophthalmol. Vis. Sci. 2020, 61, 12. [Google Scholar] [CrossRef]
  23. Manoel-Caetano, F.S.; Xavier, D.J.; Evangelista, A.F.; Takahashi, P.; Collares, C.V.; Puthier, D.; Foss-Freitas, M.C.; Foss, M.C.; Donadi, E.A.; Passos, G.A.; et al. Gene expression profiles displayed by peripheral blood mononuclear cells from patients with type 2 diabetes mellitus focusing on biological processes implicated on the pathogenesis of the disease. Gene 2012, 511, 151–160. [Google Scholar] [CrossRef]
  24. Jena, L.; Kaur, P.; Singh, T.; Sharma, K.; Kotru, S.; Munshi, A. Gene expression analysis in T2DM and its associated microvascular diabetic complications: Focus on risk factor and RAAS pathway. Mol. Neurobiol. 2024, 61, 8656–8667. [Google Scholar] [CrossRef] [PubMed]
  25. Stewart, M.W. Anti-VEGF therapy for diabetic macular edema. Curr. Diab. Rep. 2014, 14, 510. [Google Scholar] [CrossRef] [PubMed]
  26. Semeraro, F.; Cancarini, A.; dell’Omo, R.; Rezzola, S.; Romano, M.R.; Costagliola, C. Diabetic retinopathy: Vascular and inflammatory disease. J. Diabetes Res. 2015, 2015, 582060. [Google Scholar] [CrossRef]
  27. Rübsam, A.; Parikh, S.; Fort, P.E. Role of inflammation in diabetic retinopathy. Int. J. Mol. Sci. 2018, 19, 942. [Google Scholar] [CrossRef] [PubMed]
  28. Tang, J.; Kern, T.S. Inflammation in diabetic retinopathy. Prog. Retin. Eye Res. 2011, 30, 343–358. [Google Scholar] [CrossRef]
  29. Coucha, M.; Elshaer, S.L.; Eldahshan, W.S.; Mysona, B.A.; El-Remessy, A.B. Molecular mechanisms of diabetic retinopathy: Potential therapeutic targets. Middle East Afr. J. Ophthalmol. 2015, 22, 135–144. [Google Scholar] [CrossRef]
  30. Richard, S.; Kharouba, R.; Abu-Dbai, J.; Gagarin, O.; Kratz, A.; Obied, B.; Zahavi, A.; Goldenberg-Cohen, N. Screening blood and vitreous for biomarkers associated with proliferative diabetic retinopathy. Diagnostics 2025, 15, 1344. [Google Scholar] [CrossRef]
  31. Honoré, B.; Cehofski, L.J.; Heegaard, S.; Brandslund, I.; Vorum, H.; Slidsborg, C. Proteomic blood-biomarkers for personalized risk stratification of diabetic retinopathy patients. Expert Rev. Proteom. 2025, 22, 287–295. [Google Scholar] [CrossRef] [PubMed]
  32. Wen, X.; Han, F.; Zhang, H.; Luo, T.; Jiang, J.; Zhang, Z.; Zhang, T.; Li, Y.; Yang, L.; Yan, W.; et al. Integrative single-cell and bulk transcriptomics with Mendelian randomization reveals NAD-related biomarkers in diabetic retinopathy: Insights and experimental validation. Int. Immunopharmacol. 2025, 159, 114949. [Google Scholar] [CrossRef] [PubMed]
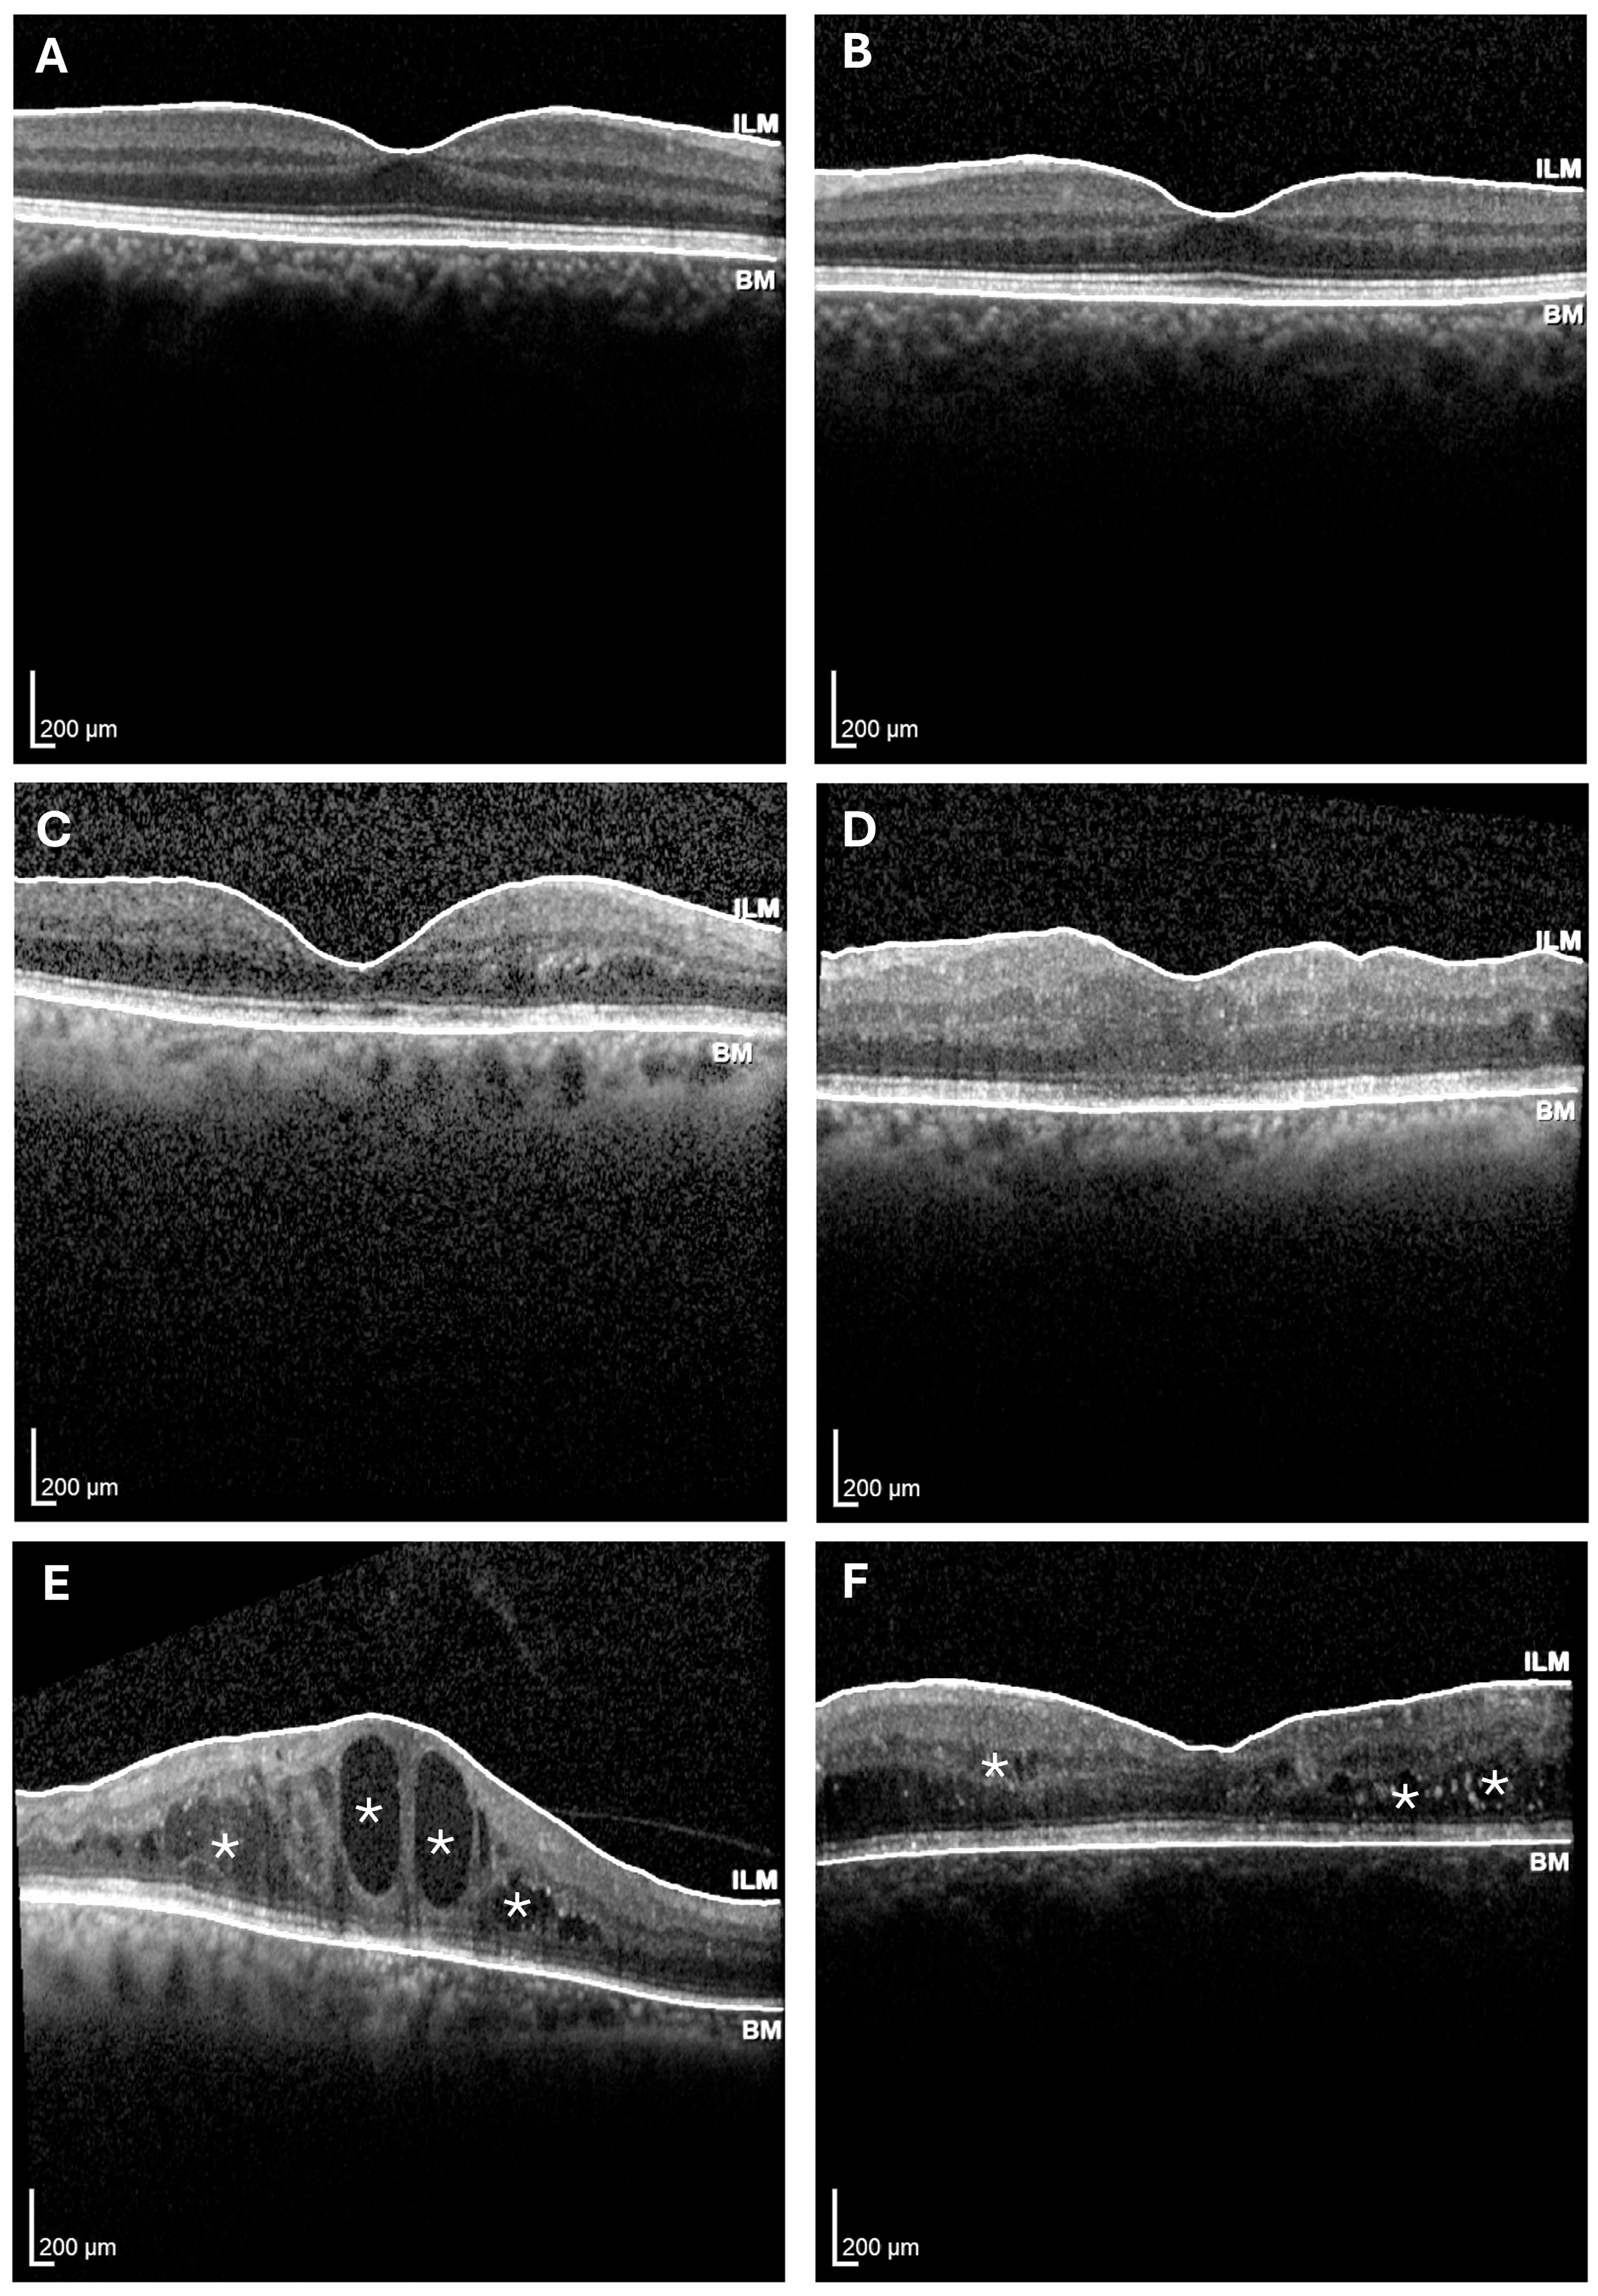
Figure 1. Representative optical coherence tomography (OCT) scans of study participants. (A,B) Control subjects showing normal foveal contour, intact retinal layers, and absence of intraretinal or subretinal fluid. (C,D) Non-proliferative diabetic retinopathy (NPDR) patients demonstrating preserved outer retinal structure with mild inner retinal thickening and no cystoid macular edema. (E,F) Proliferative diabetic retinopathy (PDR) patients exhibiting cystoid macular edema with subfoveal elevation and disruption of the foveal architecture. Asterisks denote areas of cystoid macular edema.
Diabetology 06 00132 g001
Figure 2. Heatmap showing 66 statistically different genes between the PDR and the NPDR and control groups. Colors indicate relative gene expression levels, with red representing upregulated genes and green representing downregulated genes.
Diabetology 06 00132 g002
Figure 3. Heatmap of the 14 relevant genes overexpressed in the PDR group. Colors indicate relative gene expression levels, with red representing upregulated genes and green representing downregulated genes.
Diabetology 06 00132 g003
Figure 4. Top enriched Gene Ontology (GO) terms identified by g:Profiler analysis of the differentially expressed genes between PDR and NPDR/control groups (https://biit.cs.ut.ee/gprofiler, version e113_eg59_p19_f6a03c19; analysis date: 3 October 2025). The figure displays the top GO Biological Process and Molecular Function categories ranked by significance. Bars represent the negative logarithm (−log10) of the adjusted p-value for each enriched term, calculated using the g:SCS multiple testing correction.
Diabetology 06 00132 g004
Table 1. Demographic and laboratory data of study cohort.
DiagnosisSexAgeYears of DiabetesHbA1C Levels
ControlFemale66None*
ControlMale79None5.4
ControlMale43None*
ControlFemale38None5
ControlFemale48None5.5
ControlMale76None*
NPDRMale71*6.8
NPDRFemale72**
NPDRFemale8566.5
NPDRFemale91**
NPDRMale74**
NPDRFemale62176.5
NPDRFemale85186.8
NPDRMale67247.4
PDRMale58237.3
PDRFemale57**
PDRMale647*
PDRMale64*6.3
PDRFemale80337.8
PDRFemale532710
PDRMale551110.4
PDRMale56209.3
PDRFemale6189.2
PDR, proliferative diabetic retinopathy; NPDR, non-proliferative diabetic retinopathy. * Missing or unavailable data.
Table 2. Gene ontology enrichment analysis.
GO TermGO IDIntersection SizeTerm SizeEnrichment RatioAdjusted p-Value
Peptidyl-amino acid modificationGO:001819396860.0131.01 × 10−2
Negative regulation of natural killer cell mediated cytotoxicityGO:00459533180.1671.02 × 10−2
Regulation of chemokine (C-X-C motif) ligand 2 productionGO:20003413180.1671.02 × 10−2
Calcium mediated T cell apoptosis involved in inclusion body myositisWP:WP51423200.151.02 × 10−2
Chemokine (C-X-C motif) ligand 2 productionGO:00725673180.1671.02 × 10−2
Immune responseGO:00069553020700.0141.02 × 10−18
Positive regulation of intrinsic apoptotic signaling pathwayGO:20012444600.0671.04 × 10−2
Regulation of leukocyte mediated immunityGO:000270372550.0271.04 × 10−3
Signal transductionGO:00071653160020.0051.04 × 10−6
Lymphocyte differentiationGO:0030098144420.0321.04 × 10−10
Elevated erythrocyte sedimentation rateHP:00035656760.0791.05 × 10−3
Cell communicationGO:00071543165400.0051.06 × 10−5
Regulation of cell population proliferationGO:00421271816850.0111.06 × 10−6
Negative regulation of immune system processGO:000268385150.0161.07 × 10−2
TAP1 bindingGO:0046978240.51.07 × 10−2
Disclaimer/Publisher’s Note: The statements, opinions and data contained in all publications are solely those of the individual author(s) and contributor(s) and not of MDPI and/or the editor(s). MDPI and/or the editor(s) disclaim responsibility for any injury to people or property resulting from any ideas, methods, instructions or products referred to in the content.