Article

Data-Efficiency with Comparable Accuracy: Personalized LSTM Neural Network Training for Blood Glucose Prediction in Type 1 Diabetes Management

1
Lee Kong Chian School of Medicine, Nanyang Technological University, Singapore 308232, Singapore
2
Department of Biomedical and Chemical Engineering, Syracuse University, Syracuse, NY 13244, USA
3
Interdisciplinary Neuroscience Program, Syracuse University, Syracuse, NY 13244, USA
4
Department of Biology, Syracuse University, Syracuse, NY 13244, USA
*
Author to whom correspondence should be addressed.
Diabetology 2025, 6(10), 115; https://doi.org/10.3390/diabetology6100115
Submission received: 27 June 2025 / Revised: 29 August 2025 / Accepted: 30 September 2025 / Published: 9 October 2025

Abstract

Background/Objectives: Accurate blood glucose forecasting is critical for closed-loop insulin delivery systems to support effective disease management in people with type 1 diabetes (T1D). While long short-term memory (LSTM) neural networks have shown strong performance in glucose prediction tasks, the relative performance of individualized versus aggregated training remains underexplored. Methods: In this study, we compared LSTM models trained on individual-specific data to those trained on aggregated data from 25 T1D subjects using the HUPA UCM dataset. Results: Despite having access to substantially less training data, individualized models achieved comparable prediction accuracy to aggregated models, with mean root mean squared error across 25 subjects of 22.52 ± 6.38 mg/dL for the individualized models, 20.50 ± 5.66 mg/dL for the aggregated models, and Clarke error grid Zone A accuracy of 84.07 ± 6.66% vs. 85.09 ± 5.34%, respectively. Subject-level analyses revealed only modest differences between the two approaches, with some individuals benefiting more from personalized training. Conclusions: These findings suggest that accurate and clinically reliable glucose prediction is achievable using personalized models trained on limited individual data, with important implications for adaptive, on-device training, and privacy-preserving applications.

1. Introduction

Type 1 diabetes (T1D) mellitus is a chronic autoimmune condition in which the body’s immune system mistakenly targets and eliminates the insulin-producing beta-cells (β-cells) in the pancreas, resulting in a complete inability to produce insulin [1]. Insulin is a vital hormone responsible for regulating blood glucose levels by enabling the transport of glucose into cells for energy use or storage [2]. Without endogenous insulin, individuals with T1D experience persistent hyperglycemia, which can lead to acute metabolic emergencies such as diabetic ketoacidosis and long-term complications including cardiovascular disease, nerve damage, kidney failure, vision loss, seizures, and cognitive decline [3,4]. Globally, there is an estimate of 9.5 million people living with T1D [5]. The incidence of T1D was 15 per 100,000 people [6] and this number is rising by approximately 2–3% annually, especially among children and adolescents [5,7]. Despite advances in therapy, maintaining glycemic control remains challenging, with up to 30–40% of individuals experiencing severe hypoglycemia each year [8]. Hence, there is a continuous and urgent need to improve insulin monitoring for T1D management.
Managing T1D requires careful monitoring of blood glucose and precise administration of insulin, often multiple times per day. However, achieving optimal glucose control remains a major challenge due to the complex and dynamic nature of insulin-glucose interactions, individual variability, and numerous external factors such as diet, exercise, stress, and illness [9]. While insufficient insulin can cause elevated blood glucose levels which leads to long term complications, too much insulin can cause hypoglycemia which can be catastrophic in the short-term [10]. Therefore, proper management of T1D requires delivering the optimal amount of insulin to regulate blood glucose levels [11]. In recent years, the integration of continuous glucose monitoring (CGM) systems and insulin pumps has led to the emergence of automated insulin delivery systems which have opened new frontiers in T1D care [12,13]. These technologies are also known as closed-loop or “artificial pancreas” systems which are capable of helping optimize insulin dosing in real time [12,13]. Automated insulin delivery systems forecast blood glucose levels a few hours into the future and recommend insulin doses accordingly, making them heavily dependent on the development of a reliable blood glucose prediction model capable of accurate forecasting [14,15].
Broadly, blood glucose forecasting can be categorized into two primary strategies: physiological modeling and data driven modeling. Physiological models of insulin glucose dynamics are based in the physiology of glucoregulatory systems. Among the most widely used is the UVA/Padova model, a multi-compartmental system incorporating plasma and interstitial glucose, plasma and hepatic insulin, subcutaneous insulin absorption, and a gastrointestinal subsystem for modeling glucose appearance from meals [16]. It is considered the standard for in silico evaluation of artificial pancreas systems and has received FDA approval for such simulations. The Hovorka model offers a two-compartment glucose system and multiple insulin action compartments to capture the delayed and compartmentalized effects of insulin on glucose uptake and production [17]. The Sorensen model represents major organ systems such as the brain, liver, muscle, and kidneys through individual compartments, with mass-balance equations capturing organ-specific glucose and insulin exchange [18]. Despite their foundation in physiological mechanisms, however, these models often have the limitation in fully capturing the complex and noisy patterns present in real-world glucose dynamics [19]. In contrast, data-driven models have been applied to predict blood glucose levels from CGM data. Models such as linear regression or support vector machines can capture short-term glucose trends but often rely on manual feature engineering and cannot fully account for complex nonlinear physiological influences. More advanced ML approaches, including decision tree ensembles, have also been explored to incorporate additional signals (e.g., insulin dose, carbohydrate intake) with moderate success, but they still struggle with the long-range temporal dependencies in glucose dynamics [20]. Long short-term memory (LSTM) neural networks have achieved superior performance in this domain. They can capture nonlinear, time-dependent patterns and have demonstrated strong predictive performance on CGM data [21,22,23]. Briefly, LSTM models have been used to forecast glucose trends 30 to 60 min in advance, enabling proactive insulin dosing and hypoglycemia prevention [24,25].
LSTM models have been used to predict blood glucose levels in individuals with T1D using both aggregated (population-level) and personalized (individual-specific) data [26]. While models trained on aggregated data leverage larger datasets to capture general glucose dynamics, they often lack precision for individual variability [27,28]. In contrast, a personalized subject-specific training approach aims to tailor a model to an individual’s unique glucose patterns, insulin sensitivity, and lifestyle factors, which can capture more individual variability. While both models are promising tools for T1D management, the comparison of the data-efficiency and prediction performance between these two models remains to be clarified. In this context, data efficiency refers to achieving the same or better performance while using limited or less training data. In this study, we evaluate the predictive performance of LSTM models trained using both aggregated and individualized strategies, aiming to clarify the potential benefits and practical necessity of personalization in blood glucose forecasting for clinical implementation.

2. Materials and Methods

2.1. T1D Dataset Utilized for Analysis

We utilized the HUPA UCM diabetes dataset [29], which consists of data from 25 individuals with T1D under free-living conditions. It was curated by researchers at the Universidad Complutense de Madrid and made publicly available for research purposes. No additional ethical approval was required for its use. The dataset includes CGM values, insulin delivery data (both basal and bolus), and carbohydrate intake recorded at 5 min intervals. The dataset also contains physiological and lifestyle metrics such as steps, calories burned, heart rate, and sleep quality and quantity in free living conditions. We used the preprocessed version of the dataset which required no additional cleaning or imputation. For our study, we extracted four features, including blood glucose, carbohydrate intake, bolus insulin, and basal insulin rate, from each subject which are relevant for our analysis.

2.2. LSTM Model Development

LSTMs are designed to capture long-term dependencies in sequential data. By sequentially processing past data and internalizing trends, the model learns to forecast how values are likely to evolve. We formulate the blood glucose forecasting task as a sequence-to-sequence problem. The model takes as input a sequence of past values consisting of blood glucose levels, carbohydrate intake, bolus insulin, and basal insulin over a 180 min window and predicts a future sequence of blood glucose levels 60 min ahead (Figure 1). We use a walk-forward rolling forecast approach wherein each time step of the test dataset is walked one at a time. At each time step the model outputs predictions up to one hour into the future. As and when the true blood glucose value arrives, it is made available to the model for the forecast on the next time step. In practice, continuous glucose monitoring (CGM) devices generate readings at fixed intervals (e.g., every 5 min), and the most recent value can be made available to the algorithm as soon as it is recorded. Therefore, this approach mirrors real-world use cases, where true CGM values become available to the model in real time and can be used to inform predictions for the next time step.
The dataset was split chronologically into training, validation, and test sets in a 60:20:20 ratio. Each input sequence consisted of 36 time steps (corresponding to 180 min of data at 5 min intervals) and 4 features: blood glucose, carbohydrate intake, and basal and bolus insulin doses. The model was trained to predict a 12-dimensional output corresponding to subsequent 60 min blood glucose values. The LSTM-based model was implemented using the Keras, which is a high-level neural network API written in Python 3.12.11 that enables training of deep learning models. The architecture included a single LSTM layer with 50 hidden units and a tanh activation function, followed by two fully connected Dense layers with 32 and 12 units, respectively. The final layer size corresponds to the prediction horizon. The model was trained with a batch size of 32, which is the Keras default. The model was trained using the Adam optimizer with a learning rate of 0.001. Mean squared error was used as the loss function, and root mean squared error (RMSE) was monitored as the evaluation metric. A model checkpoint was used to save the best-performing model on the validation set. The model was trained for 50 epochs, and validation loss was used to track performance over training. The choice of 50 LSTM units and 50 training epochs was based on preliminary experimentation, balancing predictive performance and computational efficiency. While more complex architectures were tested, they did not yield meaningful improvements in RMSE and increased training time.

2.3. Individual Versus Aggregate Model Training

We implemented and compared two training strategies: individual and aggregate. In the individualized training strategy, we trained 25 separate LSTM models, one for each subject in the dataset. Each model was trained and evaluated independently using only that subject’s data. In the aggregated training strategy, the model was trained on a dataset formed by combining the training data from all 25 individuals. The model architecture and training procedure remained the same across both approaches, but in the first approach the model learned individual-specific parameters and in the second approach the model learned shared parameters representative of the combined population.

2.4. Evaluation and Comparative Analysis

To evaluate model performance and accuracy of blood glucose predictions, we used RMSE as the primary metric. RMSE was computed between the predicted and true glucose values over the test set for each individual. For the individual LSTM models, RMSE was computed on the test data specific to the individual the model was trained on. For the aggregate model, which was trained on the combined data from all 25 individuals, we evaluated its performance separately on each individual’s test set. In addition to RMSE, we employed the Clarke error grid [30,31] analysis to assess the clinical accuracy of each model’s predictions. Clarke error grid is a clinically grounded evaluation method to assess the accuracy of blood glucose prediction systems. Its function is to determine whether prediction errors are likely to result in inappropriate clinical decisions. The grid is designed as a scatter plot comparing predicted glucose values to reference measurements, partitioned into five zones (A to E) reflecting different levels of clinical risk: Zone A: No effect on clinical action; Zone B: Altered clinical action with little or no effect on clinical outcome; Zone C: Altered clinical action, which is likely to affect clinical outcome; Zone D: Altered clinical action, which could have significant medical risk; Zone E: Altered clinical action, which could have dangerous consequences.

3. Results

3.1. Single Window and Full-Series Rolling Forecasts Using Individualized and Aggregated Models

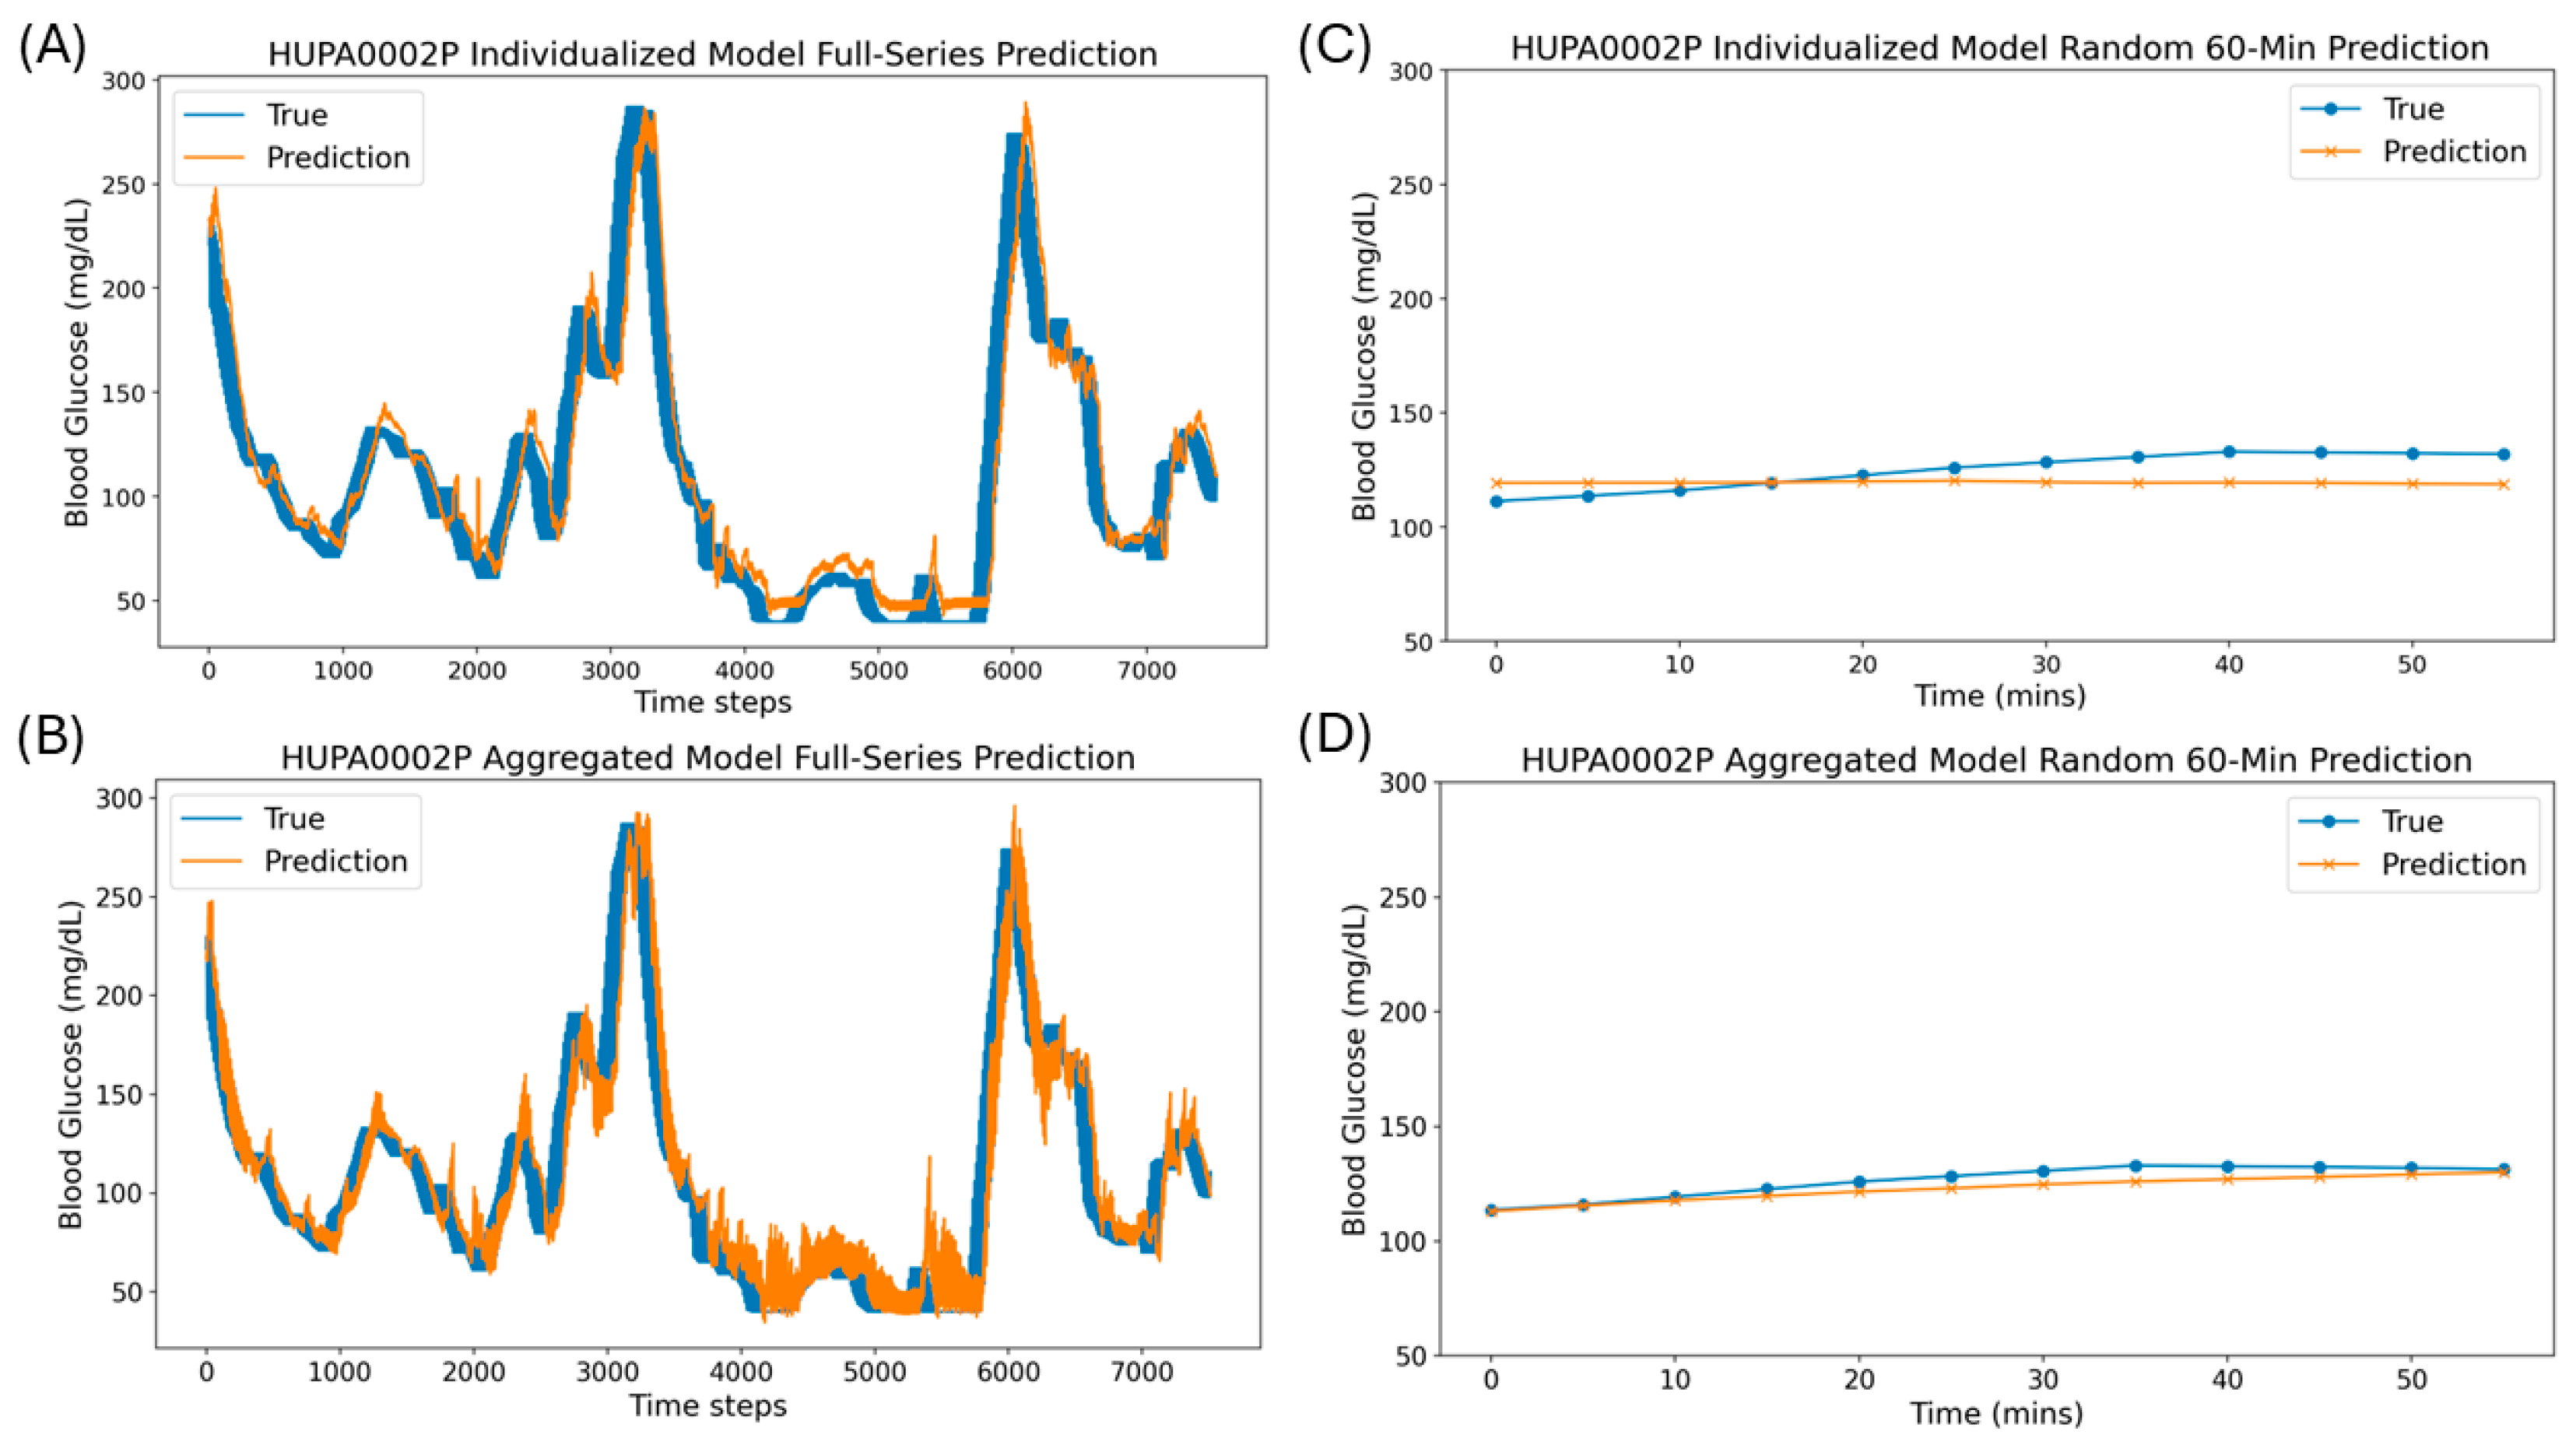
To compare individualized and aggregated models, we first obtained rolling glucose predictions from both models across the entire test set for each subject. A representative example from subject HUPA0002 is presented, where a continuous sequence of overlapping 60 min forecasts is compared against the true CGM values (Figure 2A,B). All other samples were analyzed using the same procedure and exhibited broadly similar trends. Both individualized and aggregated models demonstrate strong performance in predicting true values. The full-series rolling forecasts provide a high-level view of model behavior that is useful for model development and evaluation and enables the assessment of generalization, identification of trends, and detection of systematic errors across the test set. To assess short-term predictions, we displayed a randomly selected 60 min forecast window for both individualized and aggregated models (Figure 2C,D). As expected, both individualized and aggregated models show excellent predictions of the true values. Short-term forecasts, such as those within a 60 min time window, are critical determining parameters for driving automated insulin delivery systems to make real-time therapeutic decisions, making it a more clinically meaningful measure of model performance.

3.2. Individualized Models Achieve Comparable Quantitative Accuracy to Aggregated Models

To quantitatively assess the accuracy of both individualized and aggregated models, we used the RMSE as a parameter for comparison. LSTM models trained using the individualized strategy performed comparably to those trained using the aggregated strategy in terms of RMSE (Table S1 and Figure 3A). The difference between the RMSE of both models was also analyzed (Figure 3B). Positive values indicate cases where the individualized model had higher errors, while negative values indicate subjects for whom the individualized model outperformed the aggregated model. Although the differences in prediction error between the two models were generally small, the RMSE values are generally lower in the aggregated model, with a few cases where the individualized RMSE was lower than the aggregated model. We also generated a scatterplot of RMSE values to evaluate their performance (Figure 3C). Points below the line represent subjects for whom the aggregated model achieved lower RMSE, while points above the line indicate better performance from the individualized model. With most points located near the diagonal reference line (Y = X), this indicates comparable quantitative accuracy across both training strategies. This is further supported by a boxplot comparison (Figure 3D), which reveals similar RMSE distributions for the two training strategies. The aggregated model exhibits a slightly narrower spread, while the individualized model shows greater variability in RMSE across subjects. Despite this, the medians are similar, indicating overall comparable performance between the two training strategies.

3.3. Clarke Error Grid Analysis of the Individualized and Aggregated Models

To evaluate the clinical accuracy of glucose predictions for both the individualized and aggregated models, we used the Clarke error grid analysis, which is designed to assess the clinical significance of differences between the glucose measurement technique under test, in this case both of our models, and the blood glucose reference measurements. The Clarke error grid analysis and quantification for both the individualized (Figure 4A,B) and aggregated (Figure 4C,D) models of a representative subject HUPA0002P is shown. The plots categorize prediction errors into five clinical regions (Zones A–E) according to their potential impact on treatment decisions. Both Zones A and B are considered clinically acceptable, with Zone A indicating accurate predictions and Zone B reflecting benign deviations. In contrast, Zones C through E represent increasingly severe levels of clinical risk associated with glucose monitoring errors. In both models, the percentage of prediction points falling within Zone A is relatively the same, 83.35% in the individualized model and 84.34% in the aggregated model (Figure 4A–D). On the other hand, the individualized LSTM model appears to have a higher percentage of prediction points in Zone B (13.10%) but fewer in Zone D (3.51%) (Figure 4A,B) as compared to the aggregated model with 9.19% and 6.47% of the points in Zone B and D, respectively (Figure 4C,D). This suggests slightly better clinical accuracy of the individualized model for subject HUPA0002P. In both models, there is very little or none of the prediction points in Zone C and E.

3.4. Individualized Models Achieve Comparable Clinical Accuracy to Aggregated Models

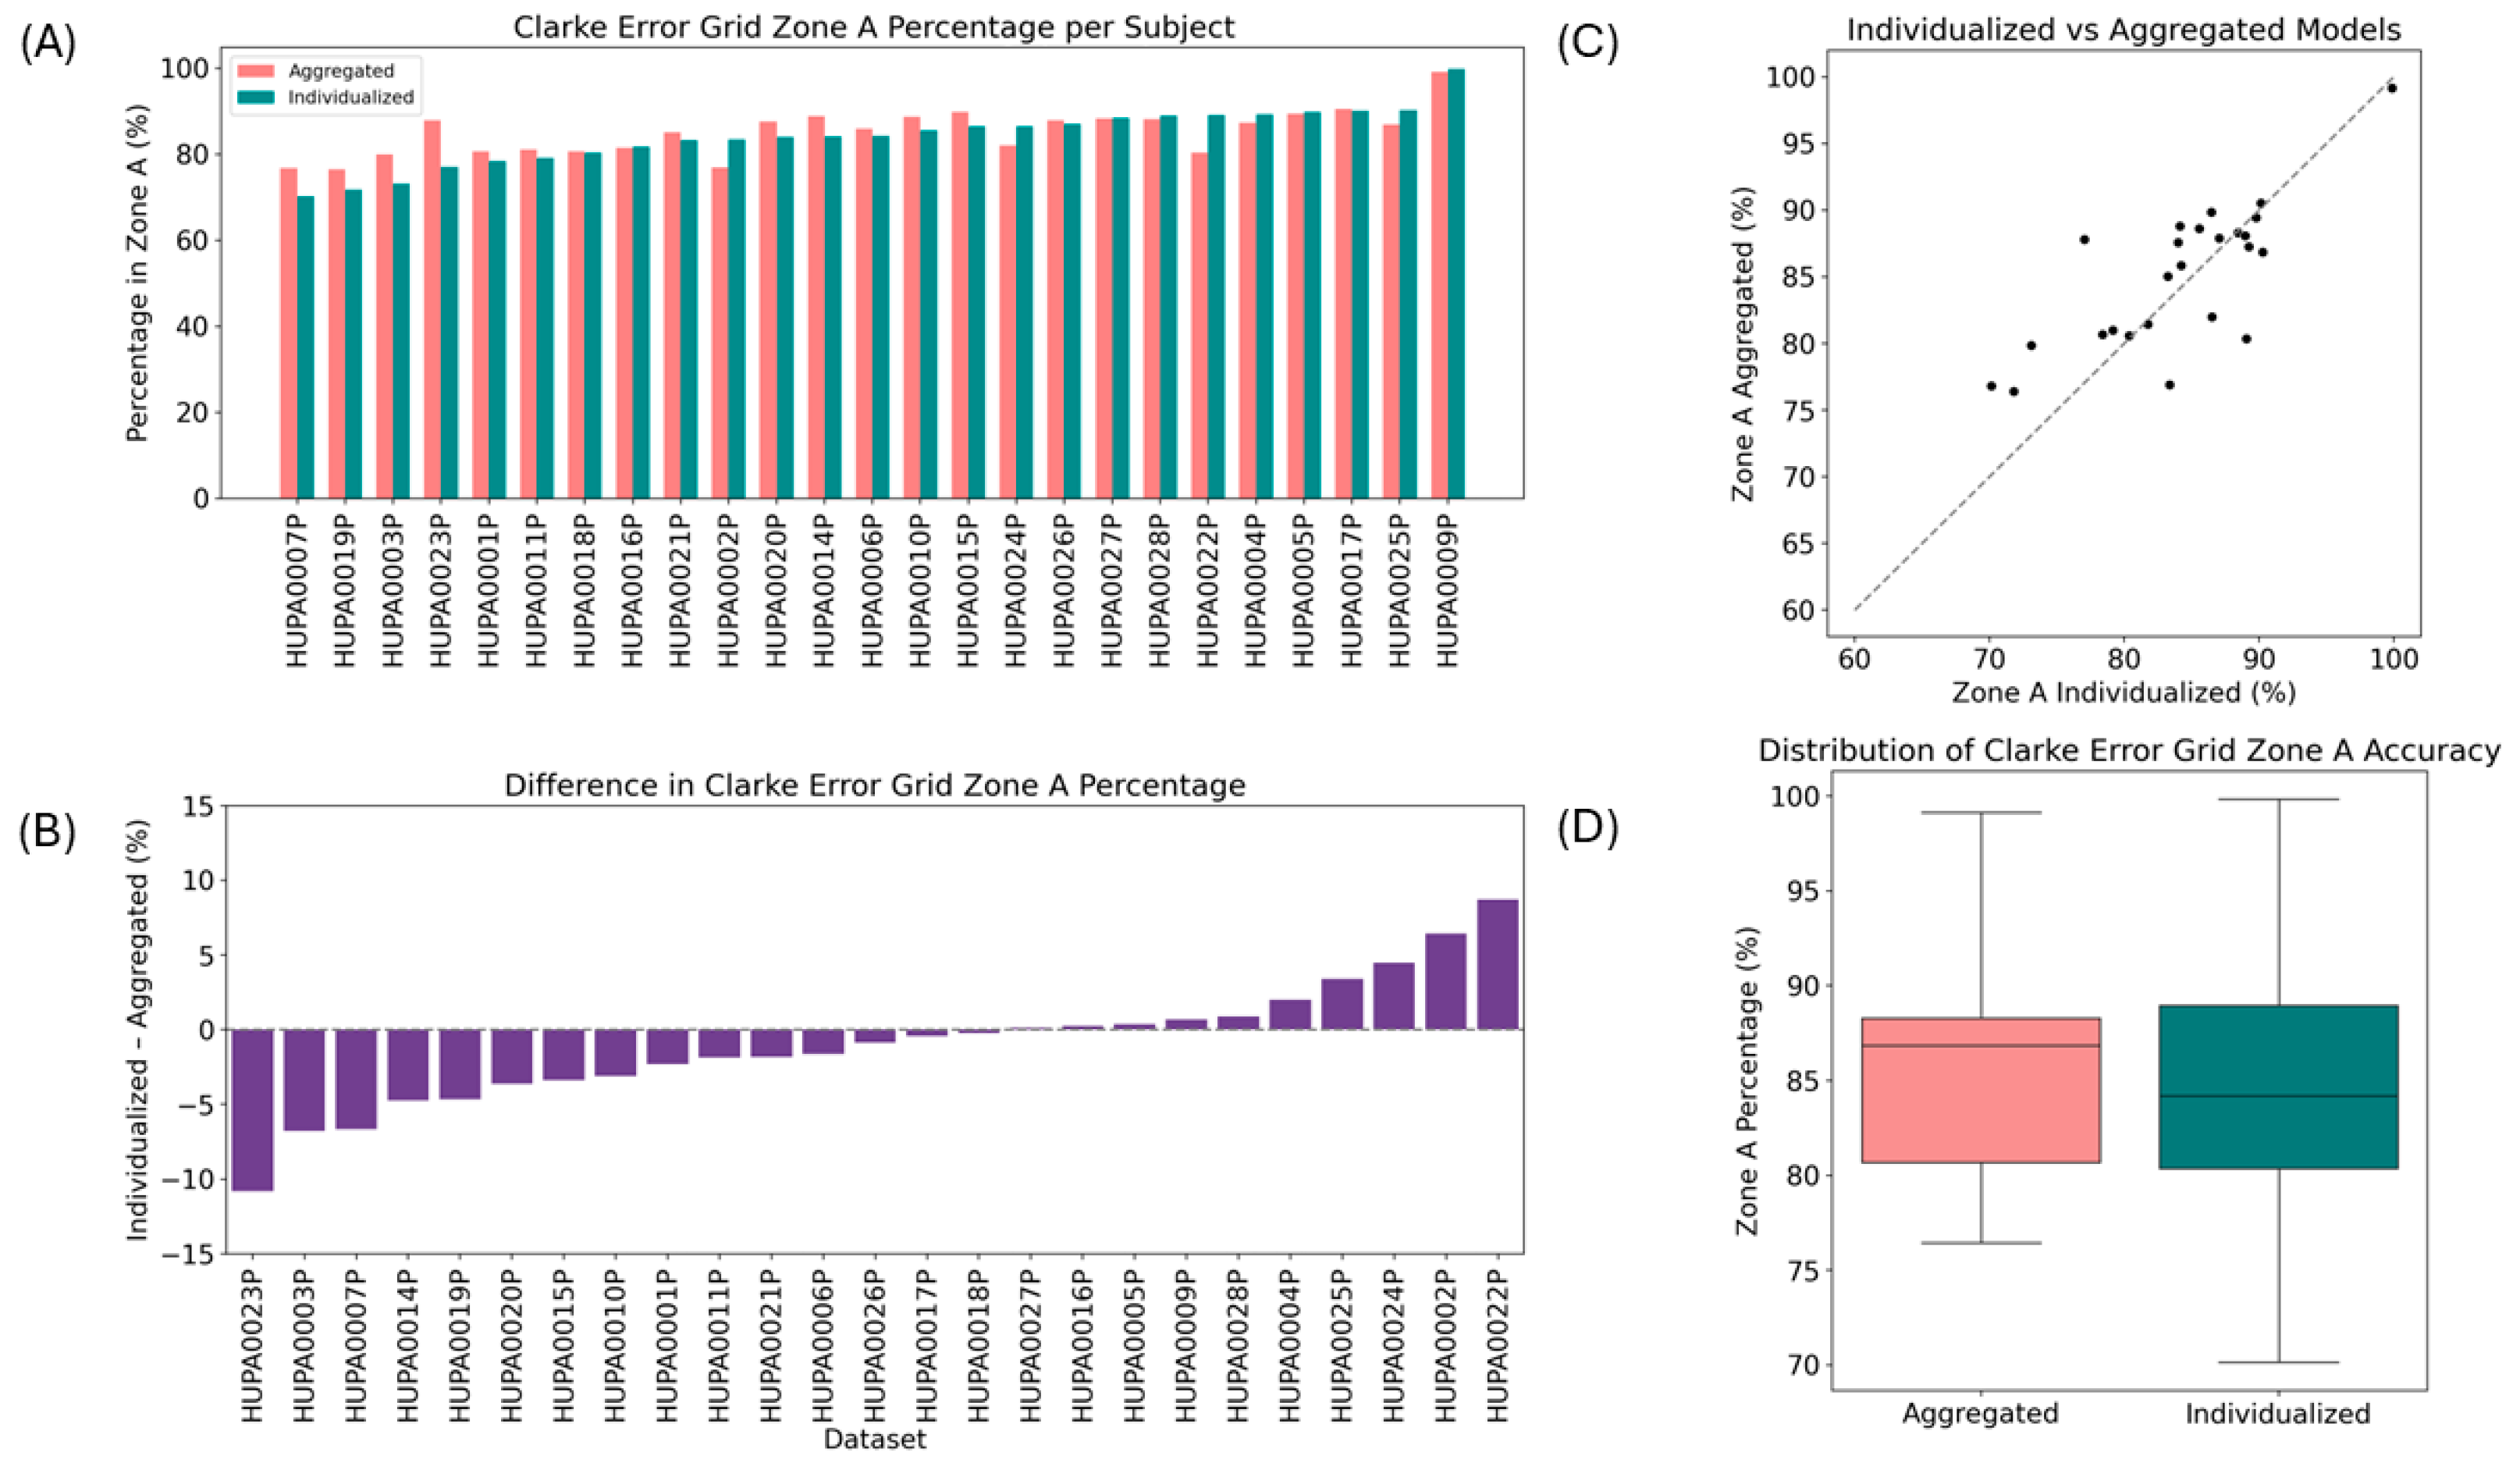
To evaluate the clinical accuracy of both individualized and aggregated LSTM models, we used the percentage of prediction points in Clarke error grid Zone A as a parameter for comparison. Across the cohort, both the individualized and aggregated models achieved high Zone A percentages, indicating strong clinical accuracy and safety in their predictions (Table S2 and Figure 5A). The difference between the percentage of prediction points in Zone A in both models was also analyzed (Figure 5B). Positive values indicate better performance by the individualized model and negative values indicate better performance by the aggregated model. On average, the individualized models performed comparably to the aggregated models, with some subjects showing improved Zone A coverage under personalized training. Specifically, in about half of the subjects in the cohort, the individualized model achieved an equal or higher proportion of prediction points in Zone A than the aggregated model (Figure 5B). We also generated a scatterplot of the percentage of Zone A predictions to evaluate the performance of the two LSTM models (Figure 5C). Points below the line represent subjects for whom the individualized model achieved higher percentage of Zone A predictions, while points above the line indicate better performance from the aggregated model. The overall clustering near the diagonal reference line (Y = X) suggests broadly comparable predictive accuracy across both training strategies. This is further supported by a boxplot comparison (Figure 5D), which reveals a very similar distribution of the percentage of Zone A predictions across the two training strategies, with slightly wider variability in the individualized models. The results indicate that both training strategies yield high clinical accuracy across subjects.

4. Discussion

This study demonstrates that individualized LSTM models can achieve strong forecasting performance using only single-subject data, with accuracy levels comparable to those of models trained on substantially larger, population-level datasets. Even in cases where the aggregated strategy achieved slightly lower RMSE, clinical accuracy remained equivalent between the two approaches [31,32]. In the context of T1D management, such small RMSE differences are unlikely to meaningfully influence clinical decision-making. Ultimately, what matters is whether a prediction would alter therapeutic action, and both modeling strategies consistently generated forecasts within clinically acceptable and safe zones [31,32]. Our findings indicate that an LSTM model trained exclusively on an individual’s own data performed nearly as well as an LSTM trained on an aggregated dataset derived from 25 T1D individuals, consistent with previous work in other domains showing that substantially smaller datasets can still yield competitive forecasting accuracy [33].
Given the heterogeneity in T1D [34], much of the predictive signal for an individual’s glucose dynamics appears to be contained in that person’s historical data alone, as also reported in other studies [26,35,36,37]. This observation aligns with prior work demonstrating the advantages of individualized modeling approaches over population-based ones. For example, Shen and Kleinberg [38] proposed an incrementally retrained stacked LSTM that begins with a general model trained on multi-subject data and progressively updates its parameters as new CGM readings from the target individual become available. Their individualized approach consistently outperformed generalized models: for instance, the RMSE was reduced from 14.55 to 10.23 mg/dL on the OpenAPS dataset, and from 17.15 to 13.41 mg/dL on the Replace-BG dataset. Similarly, Neumann et al. [26] developed a subject-specific recurrent neural network framework in which each individual’s model was either trained exclusively on their own data or adapted from a global model via fine-tuning. They found that, while the best-performing model type varied across individuals, the personalized models were uniformly more accurate. When selecting the best-performing model for each patient, the mean RMSE was 7.46 mg/dL for 10 min ahead predictions and 17.74 mg/dL for 30 min ahead predictions—substantially better than the corresponding generalized models. Together, these findings from multiple independent groups reinforce a consistent pattern: across modeling strategies and datasets, individualized models capture person-specific dynamics more effectively than generalized approaches. At the same time, we note that a direct comparison of our results with prior personalized approaches is inherently difficult, as the datasets, prediction horizons, and evaluation metrics differ substantially. While our analysis demonstrates that similar efficacy can be achieved with substantially less data, our dataset does not allow us to conclude that personalization is categorically superior to aggregation. We have therefore acknowledged this as a limitation of our study, while also highlighting that broader literature consistently supports the advantages of individualized approaches.
Individual-specific characteristics, such as insulin sensitivity profiles, habitual meal timing, and daily activity cycles, can be more effectively captured by a dedicated model than by a one-size-fits-all model, which must average over diverse behaviors across patients. This underscores the value of personalization, where models tailored to individual physiology can match the performance of population-level models while requiring far less data [38,39]. From a translational and engineering perspective, these results suggest that massive multi-patient datasets are not always necessary to achieve high accuracy in glucose forecasting for a given user. Instead, emphasis can be placed on collecting high-quality, continuous time-series data for each patient and training a personalized model. Such an approach is well-suited for on-device training and adaptation in closed-loop systems. For example, a smartphone-based controller could continuously update its glucose prediction model using the user’s most recent data, thereby adapting to evolving physiological patterns and lifestyle changes, while maintaining data privacy by ensuring raw data never leaves the device [40]. Another promising strategy is transfer learning, as used in computer vision and natural language processing, where pretrained models are adapted to new domains or tasks using limited task-specific data [41,42]. In this context, a population-level model trained on aggregated multi-individual data could serve as a general foundation, which is then fine-tuned on a specific individual’s data in the later network layers. This hybrid approach could leverage common patterns across patients while optimizing for the unique physiological characteristics of each user.
While other open glycemic datasets exist, as reviewed by Del Guidice et al. [43], we selected the HUPA-UCM dataset because it was newly released (2024) during the course of this work and offers several advantages: (a) it provides clearly demarcated, patient-wise records essential for comparing individualized versus aggregated models; (b) it is fully preprocessed and annotated, reducing uncertainty in preprocessing steps and acquisition conditions that often limits older datasets; and (c) it includes continuous glucose monitoring (CGM), insulin, and carbohydrate intake data, all of which align with our modeling requirements. Nonetheless, validating these findings on additional public datasets remains an important direction for future research. In summary, this work demonstrates that personalized LSTM models trained on limited individual data can achieve blood glucose forecasting accuracy comparable to models trained on much larger aggregated datasets. These findings support the feasibility of data-efficient, privacy-preserving strategies for real-time glucose prediction in type 1 diabetes management.

Supplementary Materials

The following supporting information can be downloaded at https://www.mdpi.com/article/10.3390/diabetology6100115/s1, Table S1: Comparison of the root mean squared error (RMSE) between individualized and aggregated models; Table S2: Comparison of the Clarke error grid Zone A between individualized and aggregated models.

Author Contributions

Conceptualization, E.M.; methodology, E.M.; software, E.M.; validation, E.M.; formal analysis, E.M.; investigation, E.M., J.Z. and C.H.L.; resources, E.M.; data curation, E.M.; writing—original draft preparation, E.M., J.Z. and C.H.L.; writing—review and editing, E.M., J.Z. and C.H.L.; visualization, E.M., J.Z. and C.H.L.; supervision, C.H.L.; funding acquisition, C.H.L. All authors have read and agreed to the published version of the manuscript.

Funding

This research was funded by a start-up grant from the Department of Biology at Syracuse Biology (C.H.L.).

Institutional Review Board Statement

Not applicable.

Informed Consent Statement

Not applicable.

Data Availability Statement

Data is contained within the article or Supplementary Materials.

Acknowledgments

The authors thank the funding sources for supporting this study.

Conflicts of Interest

The authors declare no conflicts of interest. The funders had no role in the design of the study; in the collection, analyses, or interpretation of data; in the writing of the manuscript; or in the decision to publish the results.

Abbreviations

The following abbreviations are used in this manuscript:
T1DType 1 diabetes
CGMContinuous glucose monitoring
LSTMLong short-term memory
RMSERoot mean squared error

References

  1. Mauvais, F.-X.; van Endert, P.M. Type 1 Diabetes: A Guide to Autoimmune Mechanisms for Clinicians. Diabetes Obes. Metab. 2025, 27, 40–56. [Google Scholar] [CrossRef]
  2. Apostolopoulou, M.; Lambadiari, V.; Roden, M.; Dimitriadis, G.D. Insulin Resistance in Type 1 Diabetes: Pathophysiological, Clinical, and Therapeutic Relevance. Endocr. Rev. 2025, 46, 317–348. [Google Scholar] [CrossRef]
  3. Mao, Y.; Gau, J.-T.; Jiang, N. Obesity, Metabolic Health, and Diabetic Complications in People with Type 1 Diabetes. Endocrinol. Diabetes Metab. 2025, 8, e70017. [Google Scholar] [CrossRef]
  4. Braffett, B.H.; Bebu, I.; Lorenzi, G.M.; Martin, C.L.; Perkins, B.A.; Gubitosi-Klug, R.; Nathan, D.M.; DCCT/EDIC Research Group. The NIDDK Takes on the Complications of Type 1 Diabetes: The Diabetes Control and Complications Trial/Epidemiology of Diabetes Interventions and Complications (DCCT/EDIC) Study. Diabetes Care 2025, 48, 1089–1100. [Google Scholar] [CrossRef]
  5. Ogle, G.D.; Wang, F.; Haynes, A.; Gregory, G.A.; King, T.W.; Deng, K.; Dabelea, D.; James, S.; Jenkins, A.J.; Li, X.; et al. Global type 1 diabetes prevalence, incidence, and mortality estimates 2025: Results from the International diabetes Federation Atlas, 11th Edition, and the T1D Index Version 3.0. Diabetes Res. Clin. Pract. 2025, 225, 112277. [Google Scholar] [CrossRef]
  6. Mobasseri, M.; Shirmohammadi, M.; Amiri, T.; Vahed, N.; Hosseini Fard, H.; Ghojazadeh, M. Prevalence and incidence of type 1 diabetes in the world: A systematic review and meta-analysis. Health Promot. Perspect. 2020, 10, 98–115. [Google Scholar] [CrossRef]
  7. Kamrath, C.; Holl, R.W.; Rosenbauer, J. Elucidating the Underlying Mechanisms of the Marked Increase in Childhood Type 1 Diabetes During the COVID-19 Pandemic—The Diabetes Pandemic. JAMA Netw. Open 2023, 6, e2321231. [Google Scholar] [CrossRef]
  8. Dib, S.A. Hypoglycemia in type 1 diabetes: A burden to worry about during treatment. Arch. Endocrinol. Metab. 2022, 66, 776–779. [Google Scholar] [CrossRef]
  9. Kovatchev, B.P. Metrics for glycaemic control—From HbA1c to continuous glucose monitoring. Nat. Rev. Endocrinol. 2017, 13, 425–436. [Google Scholar] [CrossRef]
  10. Kolb, H.; Kempf, K.; Röhling, M.; Martin, S. Insulin: Too much of a good thing is bad. BMC Med. 2020, 18, 224. [Google Scholar] [CrossRef]
  11. Starr, L.; Dutta, S.; Danne, T.; Karpen, S.R.; Hutton, C.; Kowalski, A. The Urgent Need for Breakthrough Therapies and a World Without Type 1 Diabetes. Diabetes Ther. 2025, 16, 1063–1076. [Google Scholar] [CrossRef]
  12. Boughton, C.K.; Hovorka, R. New closed-loop insulin systems. Diabetologia 2021, 64, 1007–1015. [Google Scholar] [CrossRef]
  13. Royston, C.; Roman, H.; Boughton, C.K. Closed-loop therapy: Recent advancements and potential predictors of glycemic outcomes. Expert. Opin. Drug Deliv. 2025, 22, 875–892. [Google Scholar] [CrossRef]
  14. Yu, T.S.; Song, S.; Yea, J.; Jang, K.-I. Diabetes Management in Transition: Market Insights and Technological Advancements in CGM and Insulin Delivery. Adv. Sens. Res. 2024, 3, 2400048. [Google Scholar] [CrossRef]
  15. Hughes, M.S.; Levy, C.J. The Future of Automated Insulin Delivery Systems. Endocr. Pract. 2025, 31, 1162–1170. [Google Scholar] [CrossRef]
  16. Man, C.D.; Micheletto, F.; Lv, D.; Breton, M.; Kovatchev, B.; Cobelli, C. The UVA/PADOVA Type 1 Diabetes Simulator: New Features. J. Diabetes Sci. Technol. 2014, 8, 26–34. [Google Scholar] [CrossRef]
  17. Hovorka, R.; Canonico, V.; Chassin, L.J.; Haueter, U.; Massi-Benedetti, M.; Federici, M.O.; Pieber, T.R.; Schaller, H.C.; Schaupp, L.; Vering, T.; et al. Nonlinear model predictive control of glucose concentration in subjects with type 1 diabetes. Physiol. Meas. 2004, 25, 905. [Google Scholar] [CrossRef] [PubMed]
  18. Sorensen, J.T. A Physiologic Model of Glucose Metabolism in Man and Its Use to Design and Assess Improved Insulin Therapies for Diabetes; Massachusetts Institute of Technology: Boston, MA, USA, 1985. [Google Scholar]
  19. Miller, A.C.; Foti, N.J.; Fox, E. Learning Insulin-Glucose Dynamics in the Wild. Proc. Mach. Learn. Res. 2020, 126, 1–25. [Google Scholar]
  20. Nemat, H.; Khadem, H.; Elliott, J.; Benaissa, M. Data-driven blood glucose level prediction in type 1 diabetes: A comprehensive comparative analysis. Sci. Rep. 2024, 14, 21863. [Google Scholar] [CrossRef]
  21. Yu, X.; Yang, Z.; Sun, X.; Liu, H.; Li, H.; Lu, J.; Zhou, J.; Cinar, A. Deep Reinforcement Learning for Automated Insulin Delivery Systems: Algorithms, Applications, and Prospects. AI 2025, 6, 87. [Google Scholar] [CrossRef]
  22. Zhang, M.; Flores, K.B.; Tran, H.T. Deep learning and regression approaches to forecasting blood glucose levels for type 1 diabetes. Biomed. Signal Process. Control 2021, 69, 102923. [Google Scholar] [CrossRef]
  23. Prendin, F.; Pavan, J.; Cappon, G.; Del Favero, S.; Sparacino, G.; Facchinetti, A. The importance of interpreting machine learning models for blood glucose prediction in diabetes: An analysis using SHAP. Sci. Rep. 2023, 13, 16865. [Google Scholar] [CrossRef] [PubMed]
  24. Rabby, M.F.; Tu, Y.; Hossen, M.I.; Lee, I.; Maida, A.S.; Hei, X. Stacked LSTM based deep recurrent neural network with kalman smoothing for blood glucose prediction. BMC Med. Inform. Decis. Mak. 2021, 21, 101. [Google Scholar] [CrossRef]
  25. Sun, Q.; Jankovic, M.V.; Bally, L.; Mougiakakou, S.G. Predicting Blood Glucose with an LSTM and Bi-LSTM Based Deep Neural Network. In Proceedings of the 14th Symposium on Neural Networks and Applications (NEUREL), Belgrade, Serbia, 20–21 November 2018. [Google Scholar]
  26. Neumann, A.; Zghal, Y.; Cremona, M.A.; Hajji, A.; Morin, M.; Rekik, M. A data-driven personalized approach to predict blood glucose levels in type-1 diabetes patients exercising in free-living conditions. Comput. Biol. Med. 2025, 190, 110015. [Google Scholar] [CrossRef]
  27. Carvalho, C.F.; Liang, Z. Glucose Prediction with Long Short-Term Memory (LSTM) Models in Three Distinct Populations. Eng. Proc. 2024, 82, 87. [Google Scholar]
  28. Rancati, S.; Bosoni, P.; Schiaffini, R.; Deodati, A.; Mongini, P.A.; Sacchi, L.; Toffanin, C.; Bellazzi, R. Exploration of Foundational Models for Blood Glucose Forecasting in Type-1 Diabetes Pediatric Patients. Diabetology 2024, 5, 584–599. [Google Scholar] [CrossRef]
  29. Hidalgo, J.I.; Alvarado, J.; Botella, M.; Aramendi, A.; Velasco, J.M.; Garnica, O. HUPA-UCM diabetes dataset. Data Brief 2024, 55, 110559. [Google Scholar] [CrossRef]
  30. Clarke, W.L.; Cox, D.; Gonder-Frederick, L.A.; Carter, W.; Pohl, S.L. Evaluating Clinical Accuracy of Systems for Self-Monitoring of Blood Glucose. Diabetes Care 1987, 10, 622–628. [Google Scholar] [CrossRef]
  31. Krouwer, J.S. Validation of the Diabetes Technology Society Error Grid. J. Diabetes Sci. Technol. 2025, 19, 853–854. [Google Scholar] [CrossRef]
  32. Tyler, N.S.; Jacobs, P.G. Artificial Intelligence in Decision Support Systems for Type 1 Diabetes. Sensors 2020, 20, 3214. [Google Scholar] [CrossRef]
  33. Lindholm, M.; Palmborg, L. Efficient use of data for LSTM mortality forecasting. Eur. Actuar. J. 2022, 12, 749–778. [Google Scholar] [CrossRef]
  34. Ilonen, J.; Lempainen, J.; Veijola, R. The heterogeneous pathogenesis of type 1 diabetes mellitus. Nat. Rev. Endocrinol. 2019, 15, 635–650. [Google Scholar] [CrossRef] [PubMed]
  35. Lara-Abelenda, F.J.; Chushig-Muzo, D.; Peiro-Corbacho, P.; Wägner, A.M.; Granja, C.; Soguero-Ruiz, C. Personalized glucose forecasting for people with type 1 diabetes using large language models. Comput. Methods Programs Biomed. 2025, 265, 108737. [Google Scholar] [CrossRef]
  36. Rodríguez-Rodríguez, I.; Chatzigiannakis, I.; Rodríguez, J.-V.; Maranghi, M.; Gentili, M.; Zamora-Izquierdo, M.-Á. Utility of Big Data in Predicting Short-Term Blood Glucose Levels in Type 1 Diabetes Mellitus Through Machine Learning Techniques. Sensors 2019, 19, 4482. [Google Scholar] [CrossRef]
  37. Iacono, F.; Magni, L.; Toffanin, C. Personalized LSTM-based alarm systems for hypoglycemia and hyperglycemia prevention. Biomed. Signal Process. Control 2023, 86, 105167. [Google Scholar] [CrossRef]
  38. Shen, Y.; Kleinberg, S. Personalized Blood Glucose Forecasting from Limited CGM Data Using Incrementally Retrained LSTM. IEEE Trans. Biomed. Eng. 2024, 72, 1266–1277. [Google Scholar] [CrossRef]
  39. Adadi, A. A survey on data-efficient algorithms in big data era. J. Big Data 2021, 8, 24. [Google Scholar] [CrossRef]
  40. Ahmed, B.M.; Ali, M.E.; Masud, M.M.; Naznin, M. Recent trends and techniques of blood glucose level prediction for diabetes control. Smart Health 2024, 32, 100457. [Google Scholar] [CrossRef]
  41. Zhu, T.; Li, K.; Herrero, P.; Georgiou, P. Personalized Blood Glucose Prediction for Type 1 Diabetes Using Evidential Deep Learning and Meta-Learning. IEEE Trans. Biomed. Eng. 2022, 70, 193–204. [Google Scholar] [CrossRef] [PubMed]
  42. Seo, W.; Park, S.-W.; Kim, N.; Jin, S.-M.; Park, S.-M. A personalized blood glucose level prediction model with a fine-tuning hanstrategy: A proof-of-concept study. Comput. Methods Programs Biomed. 2021, 211, 106424. [Google Scholar] [CrossRef]
  43. Del Giudice, L.L.; Piersanti, A.; Göbl, C.; Burattini, L.; Tura, A.; Morettini, M. Availability of Open Dynamic Glycemic Data in the Field of Diabetes Research: A Scoping Review. J. Diabetes Sci. Technol. 2025, 19322968251316896. [Google Scholar] [CrossRef] [PubMed]
Figure 1. Overview of the LSTM model architecture for blood glucose forecasting. Patient time-series data including blood glucose, carbohydrate intake, and insulin from the previous 180 min (36 time steps) are input into the model. The input sequence is processed by a single LSTM layer followed by two fully connected dense layers. The output layer produces a 12-dimensional vector representing predicted blood glucose values at 5 min intervals over the next 60 min.
Diabetology 06 00115 g001
Figure 2. Single window and full-series rolling forecasts using individualized and aggregated models. (A,B) Walk-forward 60 min predictions across the full-series of test set for a representative subject HUPA0002P by both (A) individualized and (B) aggregated models. Each prediction was generated using a rolling window, resulting in a continuous sequence of overlapping 60 min forecasts (orange) compared against the true CGM values (blue). (C,D) Random 60 min forecast for a representative subject HUPA0002P by both (C) individualized and (D) aggregated models. A 60 min glucose forecast (orange) is compared to the true values (blue) at a randomly selected time window from the test set.
Diabetology 06 00115 g002
Figure 3. Comparable quantitative accuracy between individualized and aggregated models. (A) RMSE comparison between individualized and aggregated LSTM models across 25 subjects in ascending order of RMSE. Each pair of bars represents the RMSE for a single subject, with pink indicating the aggregated model and green indicating the individualized model. (B) Quantitative difference in RMSE between individualized and aggregated LSTM models across 25 subjects. Bars represent the difference in RMSE for each subject, using the following calculation (Individualized Model RMSE—Aggregated Model RMSE). (C) Scatterplot comparing RMSE values from individualized and aggregated LSTM models for each subject. Each point represents one subject, with the X-axis showing RMSE from the individualized model and the Y-axis showing RMSE from the aggregated model. The diagonal reference line (Y = X) indicates equal performance between the two models. (D) Boxplot comparing the distribution of RMSE values across individualized and aggregated LSTM models. *** p < 0.001 by paired Student’s t-test.
Diabetology 06 00115 g003
Figure 4. Clarke error grid analysis of glucose predictions for a representative subject using the individualized and aggregated LSTM models. (A,B) Clarke error grid analysis and quantification for the individualized model. (C,D) Clarke error grid analysis and quantification for the aggregated model. The plots classify prediction errors into five clinical regions (Zones A–E) based on their potential impact on treatment decisions. While both Zones A and B are clinically acceptable, Zones C–E indicate increasing levels of error and risk with a possibility of making clinically significant mistakes.
Diabetology 06 00115 g004
Figure 5. Comparable clinical accuracy between individualized and aggregated models using Clarke error grid analysis. (A) Percentage of prediction points falling within Clarke error grid Zone A for each subject, using individualized and aggregated LSTM models. Each bar pair shows the proportion of Zone A predictions for one subject under both models. (B) Difference in Clarke error grid Zone A percentages between individualized and aggregated models across subjects. Values are calculated as (Individualized—Aggregated) for each subject. (C) Scatterplot comparing Zone A accuracy from individualized and aggregated LSTM models for each subject. Each point represents one subject, with the X-axis showing the percentage of Zone A predictions from the individualized model and the Y-axis showing the percentage of Zone A predictions from the aggregated model. The diagonal reference line (Y = X) indicates equal performance between the two models. (D) Boxplot summarizing the clinical accuracy and distribution of glucose predictions from individualized and aggregated models across all subjects. No statistically significant difference was observed between the two models, as determined by a paired Student’s t-test.
Diabetology 06 00115 g005
Disclaimer/Publisher’s Note: The statements, opinions and data contained in all publications are solely those of the individual author(s) and contributor(s) and not of MDPI and/or the editor(s). MDPI and/or the editor(s) disclaim responsibility for any injury to people or property resulting from any ideas, methods, instructions or products referred to in the content.