Article

Association between Altered Thyroid Function and Prediabetes in Diet-Induced Prediabetic Male Sprague Dawley Rats

1
Department of Human Physiology, School of Laboratory Medicine and Medical Sciences, College of Health Sciences, University of KwaZulu-Natal, Westville, Durban 4000, South Africa
2
Department of Pharmacy and Pharmacology, Rhodes University, Grahamstown 6139, South Africa
*
Author to whom correspondence should be addressed.
Diabetology 2023, 4(3), 406-417; https://doi.org/10.3390/diabetology4030034
Submission received: 7 July 2023 / Revised: 24 August 2023 / Accepted: 4 September 2023 / Published: 12 September 2023

Abstract

:
There is a correlation between the existence of type 2 diabetes mellitus (T2DM) and the development of thyroid disorders. Prediabetes is a progressive state of moderate insulin resistance that often precedes the onset of T2DM. However, the association between prediabetes and thyroid function is unknown. This study assessed changes in markers of thyroid function in diet-induced prediabetes. Twelve male Sprague Dawley rats (n = 12) were randomly assigned into two groups. Rats in the non-prediabetic (NPD) group were fed a standard rat diet, while rats in the prediabetic (PD) were fed a high-fat high-carbohydrate diet for 20 weeks to induce prediabetes. Thereafter, fasting blood glucose levels were measured. Plasma samples were assessed for triiodothyronine (T3), thyroxine (T4), thyroxine peroxidase (TPO) antibody, insulin, and glycated hemoglobin (HbA1c) concentrations. The elevated blood glucose, HbA1c, and plasma insulin levels coincided with increased T3 and reduced T4 levels in the PD group when compared to the NPD group. There was also an increase in the concentration of TPO antibodies in the PD group. Additionally, there was a significant correlation between the thyroid hormone concentrations and HbA1c levels. In conclusion, these results indicated that there is a positive association between thyroid dysfunction and diet-induced prediabetes in rats.

1. Introduction

Type 2 diabetes mellitus (T2DM) is regarded as a metabolic disorder that occurs due to the down-regulation of insulin receptors on target tissues and persistent hyperinsulinemia, which overtimes lead to beta cell exhaustion, thus resulting in chronically elevated blood glucose concentrations [1]. There are numerous long-term metabolic complications that are associated with T2DM, which culminate into serious long-term cardiovascular and renal complications. These have been have been well-documented [2]. The metabolic aberrations observed in T2DM are associated with neuroendocrine disruption, including the hypothalamic–pituitary–adrenal and hypothalamic–pituitary–thyroid gland axis. However, several studies have shown that the genesis of the complications linked with T2DM complications occurs during the prediabetic state [3,4]. Prediabetes (PD) is regarded as a state of chronic moderate hyperglycemia during which glycemic indicators such as impaired fasting glucose, impaired glucose tolerance, elevated glycated hemoglobin (HbA1c), as well as homeostasis model assessment (HOMA-IR) levels are at a level above the homeostatic range but are not high enough to reach the threshold for a diagnosis of T2DM [5,6]. In addition, studies have shown that the functions of some metabolic hormones, such as insulin, ghrelin, cortisol, and aldosterone, are impaired in the prediabetic state [7,8,9]. Furthermore, there have been studies that have shown dysregulation in both the hypothalamic–pituitary–adrenal axis and the renin angiotensin aldosterone system [3,4]. The above highlights the necessity to further investigate other possible changes that could be manifested earlier in the inception of the diseases.
Thyroid hormones, such as triiodothyronine (T3) and thyroxine (T4), are regulatory hormones that are primarily associated with metabolic function and energy expenditure [10]. These hormones, along with thyroid peroxidase (TPO), are vital components of glucose homeostasis, while the dysregulation of thyroid hormones has been found to correlate with reduced insulin sensitivity, metabolic dysfunction, and increased incidence of T2DM [11,12]. Plasma creatinine and insulin levels have also been used to assess changes in metabolic functions, which are also associated with irregular thyroid hormone production [13]. Recent studies have further indicated that individuals diagnosed with T2DM are at a higher risk of developing thyroid disorders [14,15]. Both hyperthyroidism and hypothyroidism have been associated with diabetes mellitus, with the latter being the more prevalent diagnosis in T2DM [16]. The current literature seems to suggest that there is an undefined bi-directional link between the incidence of thyroid disorders and diabetes mellitus.
Studies show that over 70% of people with prediabetes go on to develop T2DM while also showing that a large number of them go on to develop thyroid disorders [6]. Additionally, studies in our laboratory using a diet-induced rat model of prediabetes have shown that the genesis of various endocrine disorders occurs during the prediabetic phase [8,9,17,18]. At present, however, the association between prediabetes and thyroid hormone function has yet to be investigated and understood. Therefore, in this study, we sought to determine the changes in some selected markers of thyroid function in prediabetes using a diet-induced animal model of prediabetes. We envisaged that assessing thyroid-stimulating hormone, triiodothyronine, thyroxine, and TPO antibodies could shed light on the state of thyroid system function in a prediabetic state.

2. Materials and Methods

2.1. Animals and Housing

Sprague Dawley male rats (150–180 g) bred and housed in the Biomedical Research Unit (BRU) of the University of Kwa-Zulu Natal were used in this study. The animals were kept under standard environmental conditions of constant temperature (22 ± 2 °C), relative humidity (55 ± 5%), CO2 content (<500 ppm), and illumination on a 12 h light and 12 h dark cycle with lights on at 7 a.m. The noise levels were kept below 65 decibels, and the animals were acclimatized for a period of one week and fed standard chow and water without restriction prior to the induction of prediabetes. All protocols and environmental conditions were in accordance with the use of laboratory animals and agreed to by the Animal Ethics Committee of the University of KwaZulu Natal (reference: AREC/026/017M).

2.2. Study Desgin and Insduction of Prediabetes

The study was designed as outlined in Figure 1 while the induction of prediabetes in the male rats was done according to a previously described experimental protocol [17]. Briefly, the animals were assigned randomly into two groups (Group 1 and Group 2) and fed their respective diets for a duration of 20 weeks. Group 1, the non-prediabetic control group (NPD) (n = 6), was fed standard rat chow and water, while Group 2, the prediabetic group (PD) (n = 6), was fed the high-fat high-carbohydrate (HFHC) diet (carbohydrate, 55% cal/g, fats, 30% kcal/g and proteins, 15% kcal/g), which was supplemented with 15% fructose water. After the 20-week induction period, the American Diabetes Association criteria were used for the diagnosis of prediabetes in the animals. Briefly, animals were fasted for 18 h before fasting glucose measurements were taken. Animals with a fasting blood glucose concentration of 5.6–7.1 mmol/L, as well as a 2-h postprandial blood glucose concentration of 7.1–11.1 mmol/L following an oral glucose tolerance test were considered prediabetic, while all measurements that did not meet the requirements for a prediabetes diagnosis were considered non-prediabetic.

2.3. Blood Collection

At the end of the experimental period, the individual body weights of the animals were measured. Thereafter, all the animals were individually placed in a gas chamber (Biomedical Resource Unit, UKZN, Durban South Africa). The animal would then be anesthetized with 100 mg/kg of Isofor (Safeline Pharmaceuticals (Pty) Ltd., Johannesburg, South Africa) for a duration of 3 min. Whilst in an unconscious state, the cardiac puncture was employed to collect blood samples from the animals into two separate pre-cooled heparinized sample containers. A portion of each of the blood samples was used to determine glycated hemoglobin concentration while the rest of each of the samples were centrifuged (Eppendorf centrifuge 5403, Germany) at 4 °C, 503× g for 15 min to obtain plasma. The plasma was then stored at −80 °C in a Bio Ultra freezer (Snijers Scientific, Holland) until biochemical analysis was conducted.

2.4. Biochemical Analysis

The blood glucose concentrations were determined by using a One-Touch glucometer (Lifescan, Mosta, Malta, UK) through the tail-prick method. The glycated hemoglobin (HbA1c), insulin, thyroid stimulating hormone (TSH), thyroxine (T4) triiodothyronine (T3), and thyroid peroxidase (TPO) antibody concentrations were determined by using their respective ELISA kits (Elabscience Biotechnology Co., Ltd., Houston, TX, USA) using the manufacturer’s specifications. Briefly, the ELISA kits contained micro-ELISA plates that were coated with antibodies. The plasma samples were pipetted into their specified wells, and the respective biotinylated detection antibody (50 µL) was subsequently added to each well. The samples were then incubated at 37 °C for a duration of 45 min, after which the unbound constituents were removed using the wash buffer supplied. Post-washing, 100 µL of Avidin-horseradish peroxidase (HRP) was added to the microplates and incubated for 30 min at 37 °C. A second wash step further removed the unbound constituents. Thereafter, the substrate reagent (90 µL) was added to the wells, followed by an additional incubation period of 15 min at 37 °C. Finally, a stop solution (50 µL) was added to the wells to halt the reaction so that the appropriate measurements could be taken. The optical densities were measured spectrophotometrically at a wavelength of 450 nm using a nano spectrophotometer (BMG Labtech, Passau, Germany). The concentrations of the plasma insulin, TSH, T3, T4, and TPO antibodies within the samples were extrapolated from their respective standard curves.
Furthermore, to assess insulin resistance, the homeostasis model assessment was used to measure the HOMA-IR index using the HOMA2 Calculator v2.2.3 program [19]. In homeostasis model assessment (HOMA), insulin resistance is expressed as HOMA-IR value <1.0 = insulin-sensitive, >1.9 = early insulin resistance, and >2.9 = significant insulin resistance.

2.5. Statistical Analysis

All the data obtained from the experiment were expressed as means ± SEM. Statistical comparisons were performed using Graph Pad In Stat Software (version 5.00, Graph Pad Software, Inc., San Diego, CA, USA). In order to determine the differences between the two groups, unpaired independent t-tests were used, while Pearson’s correlation analysis was used to determine the associations between the glycated hemoglobin and triiodothyronine (T3)/thyroxine (T4) hormones. A value of p < 0.05 was considered statistically significant. A coefficient value between ±0.5 and ±1.0 was considered significant.

3. Results

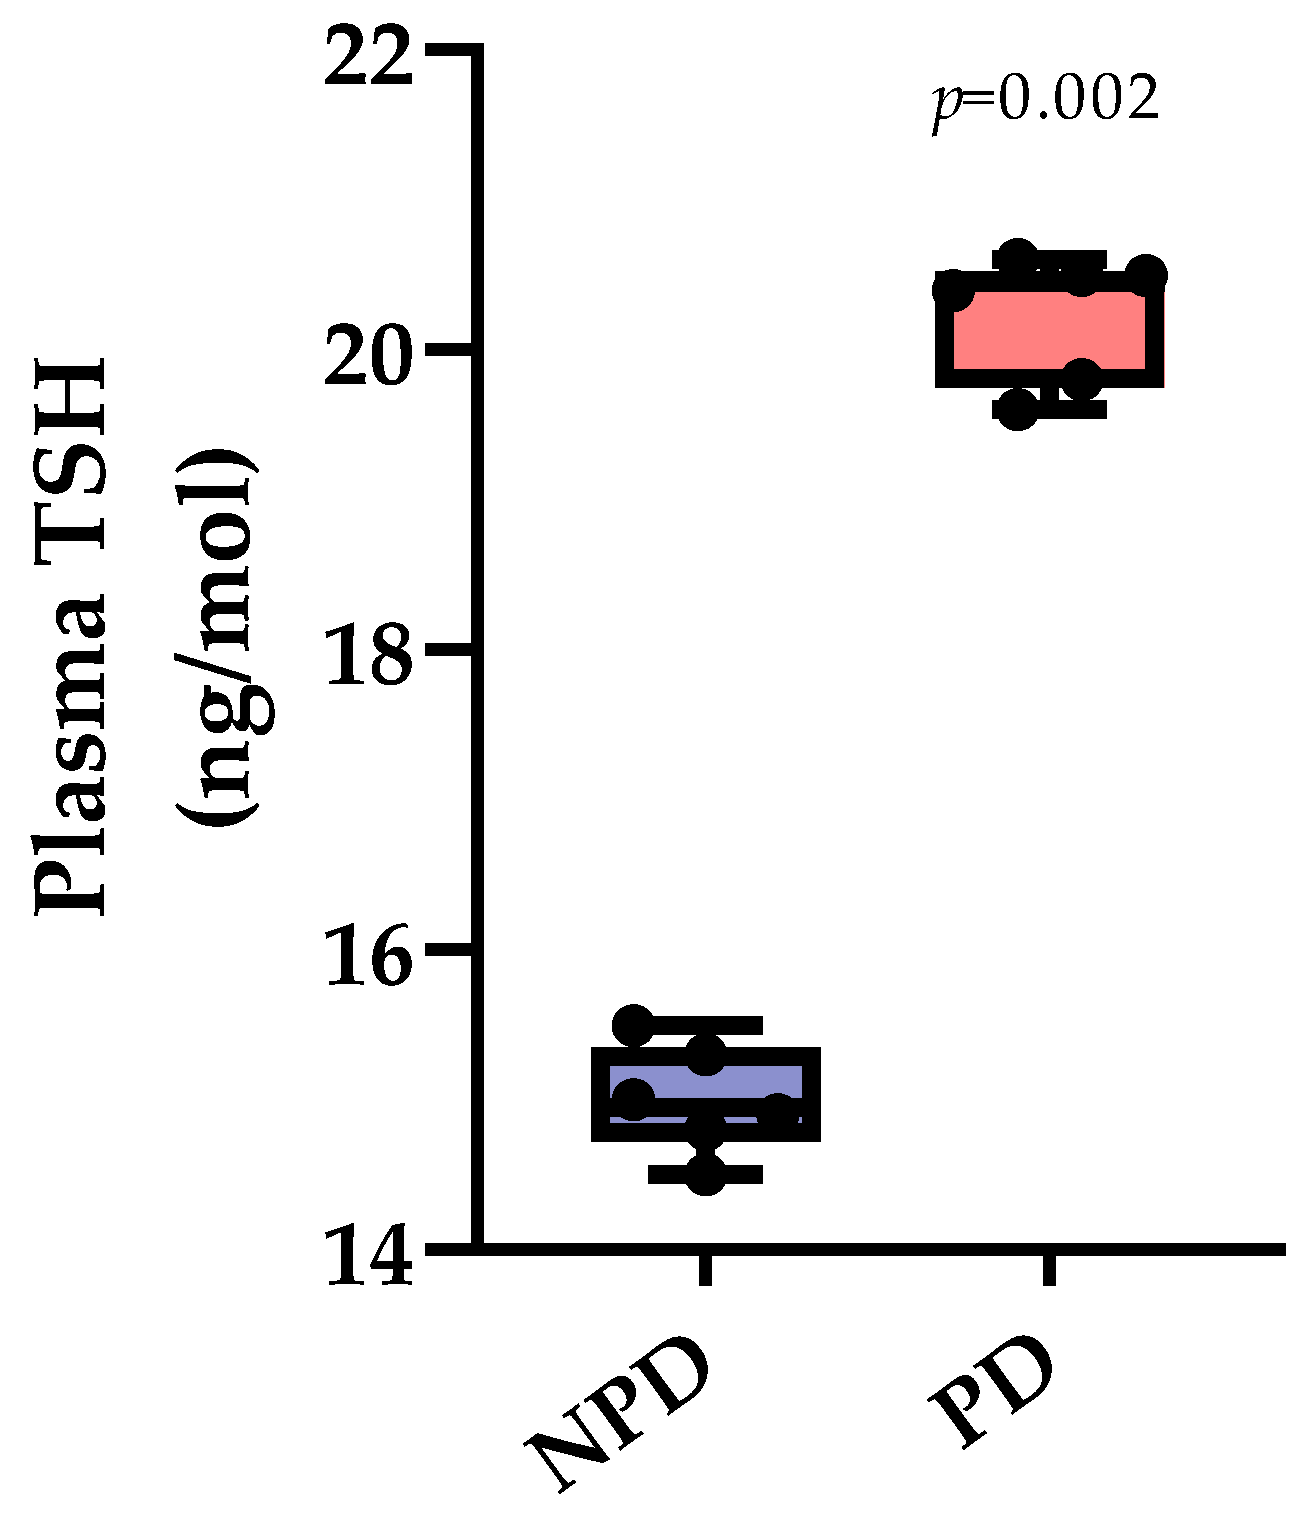
3.1. Plasma Thyroid Stimulating Hormone (TSH)

At the end of the 20-week induction period, plasma thyroid stimulating hormone (TSH) concentration was measured in the non-prediabetic (NPD) and prediabetic (PD) groups. The results (Figure 2) showed that the PD group had a significantly (p = 0.002) increased concentration of TSH compared to the NPD group.

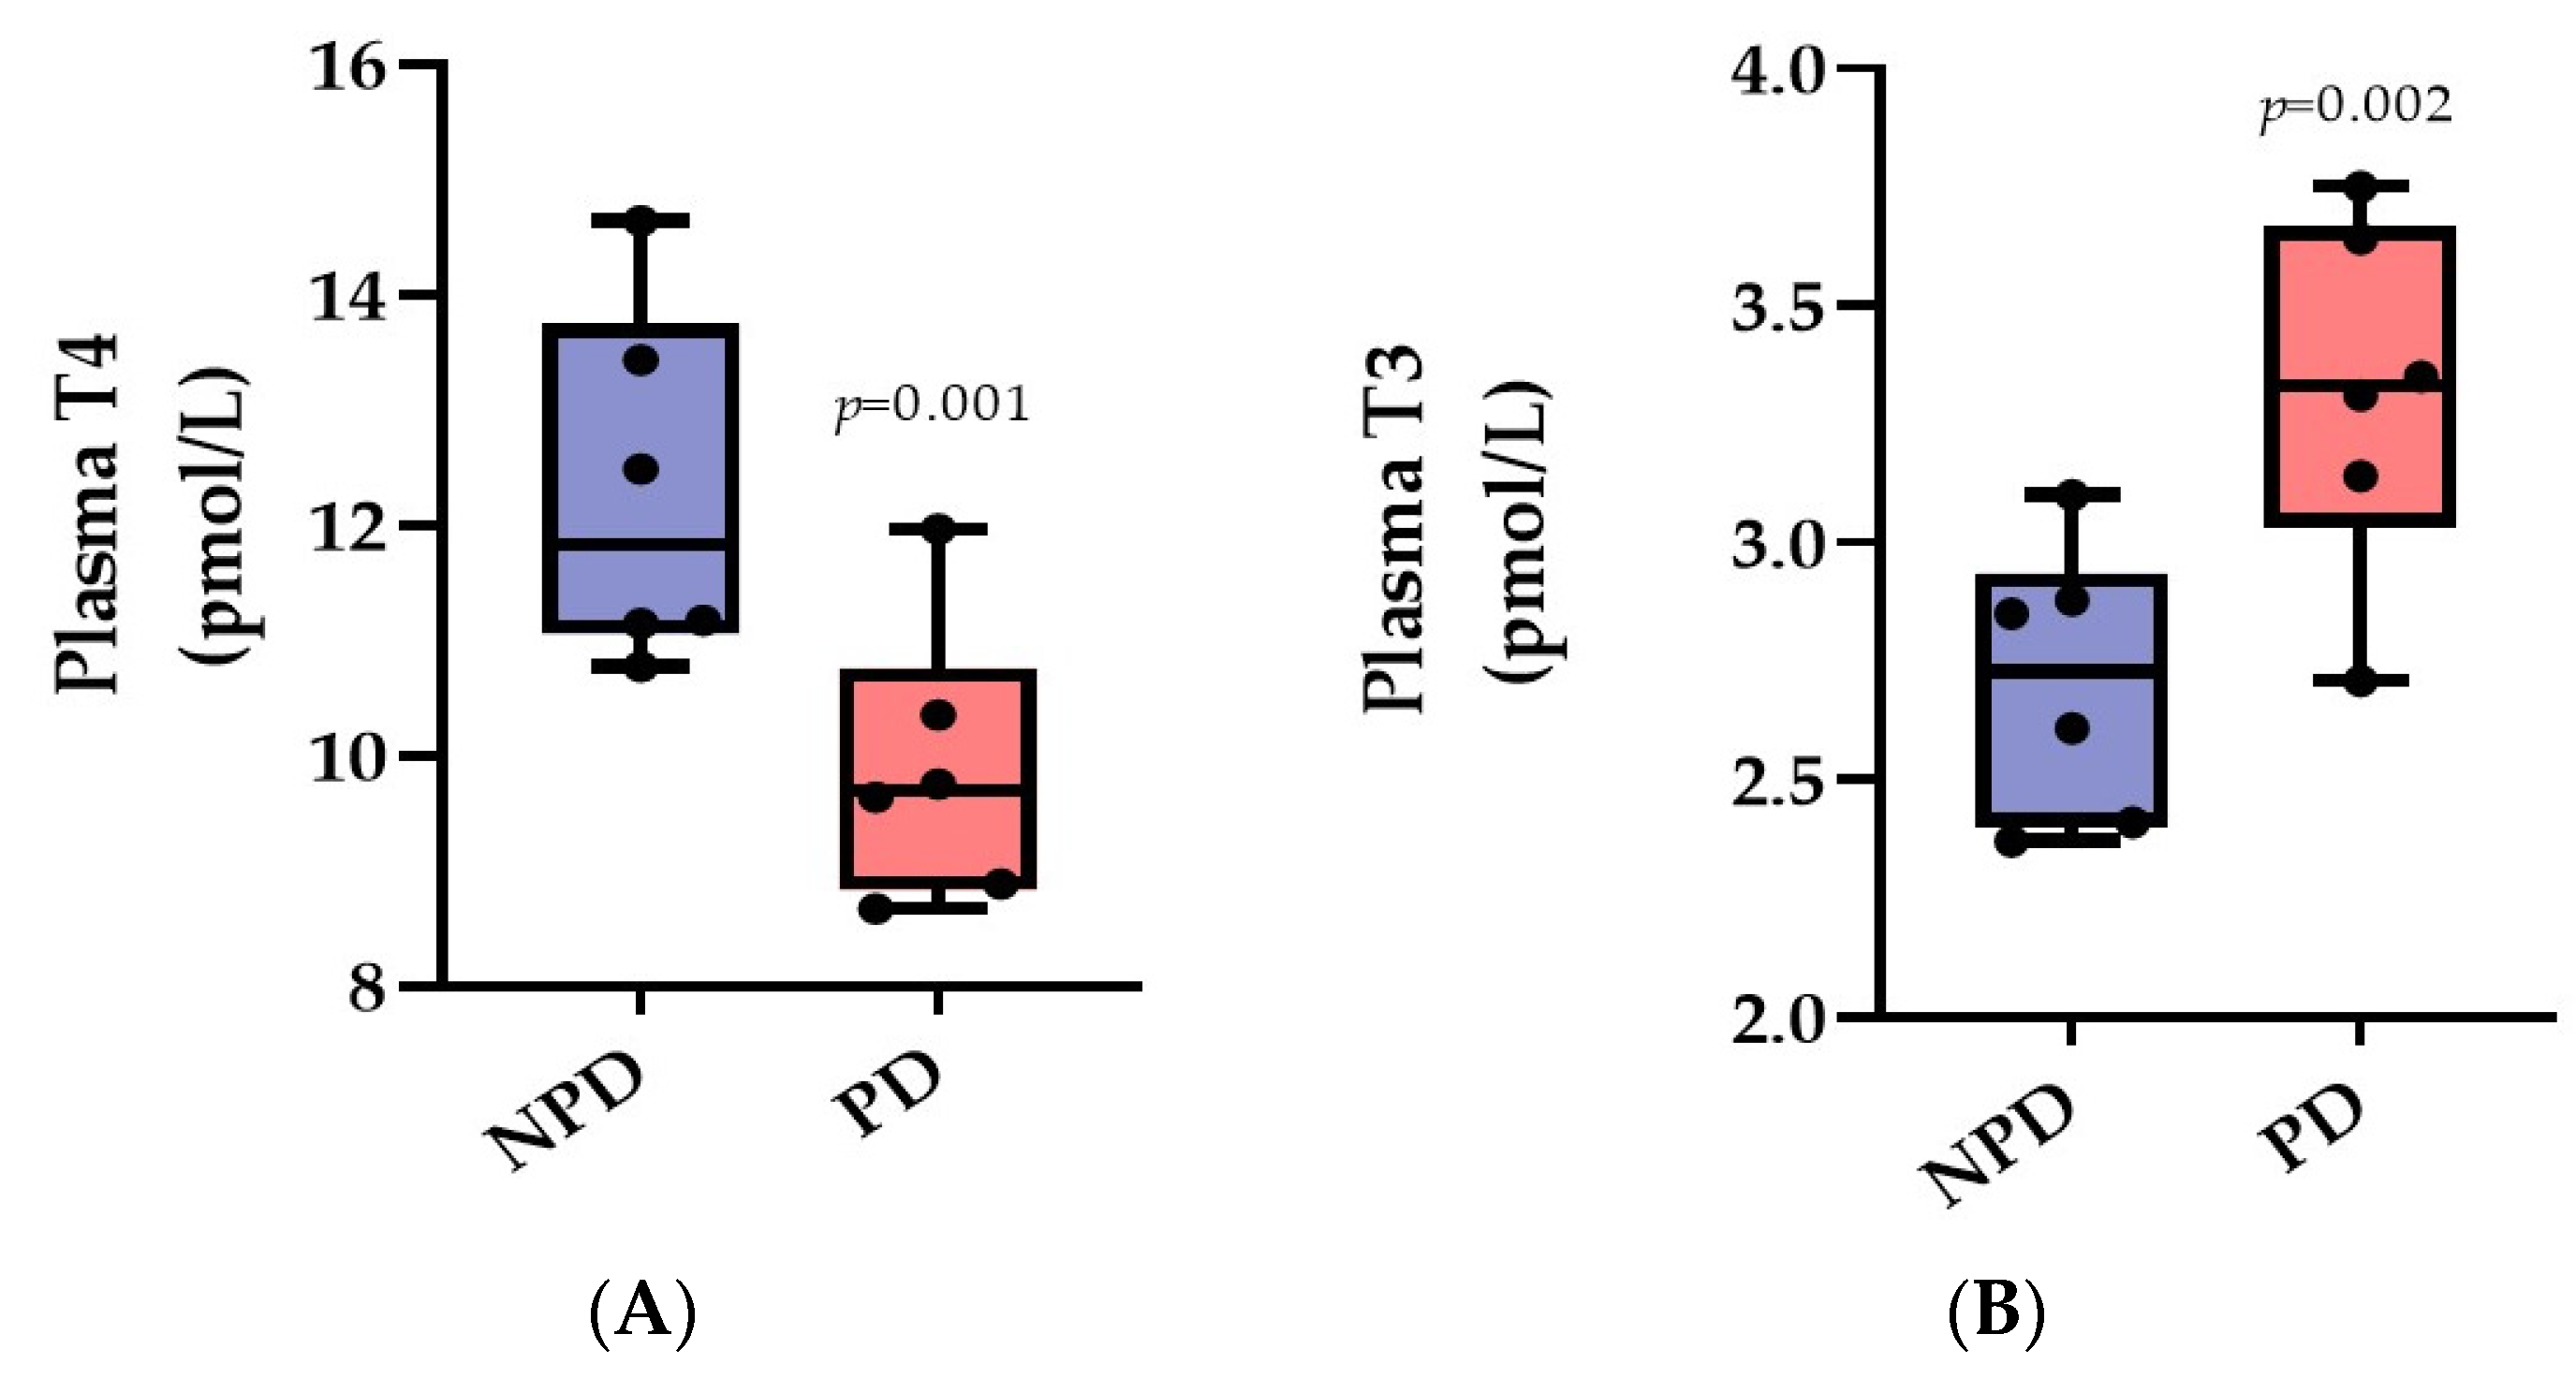
3.2. Plasma Thyroxine (T4) and Triiodothyronine (T3)

Plasma thyroxine (T4) and triiodothyronine (T3) hormone concentrations were analyzed at the end of the 20-week induction period in both the non-prediabetic (NPD) and the prediabetic (PD) groups. The results (Figure 3) showed that the PD group had a significantly (p = 0.001) lower T4 concentration in comparison to the NPD group, while the T3 concentration in the PD group was significantly (p = 0.002) * higher in comparison to the NPD group.

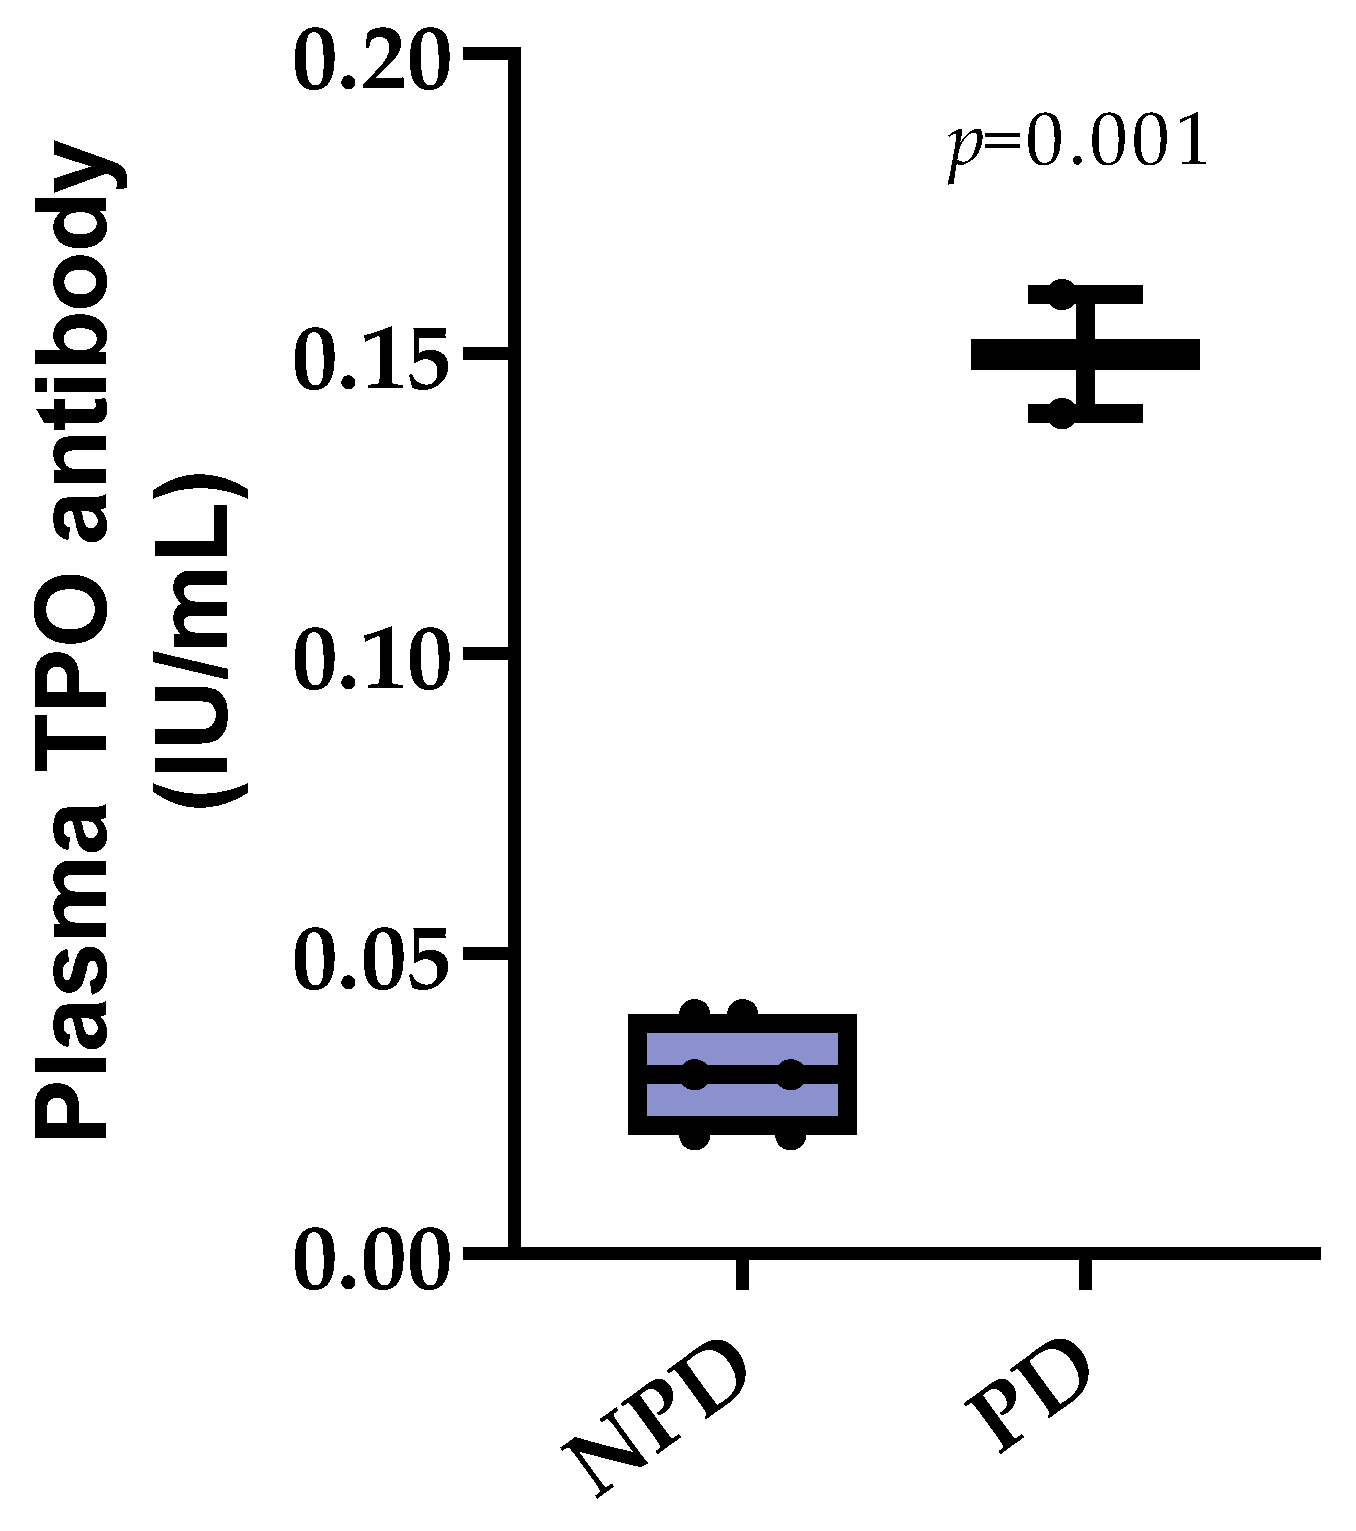
3.3. Plasma Thyroid Peroxidase (TPO) Antibody

Plasma thyroid peroxidase (TPO) antibody concentrations were analyzed at the end of the 20-week induction period in both the non-prediabetic control group (NPD) and the prediabetic group (PD). The results (Figure 4) showed that the PD group had a significantly higher TPO antibody concentration (p = 0.001) in comparison to the NPD group.

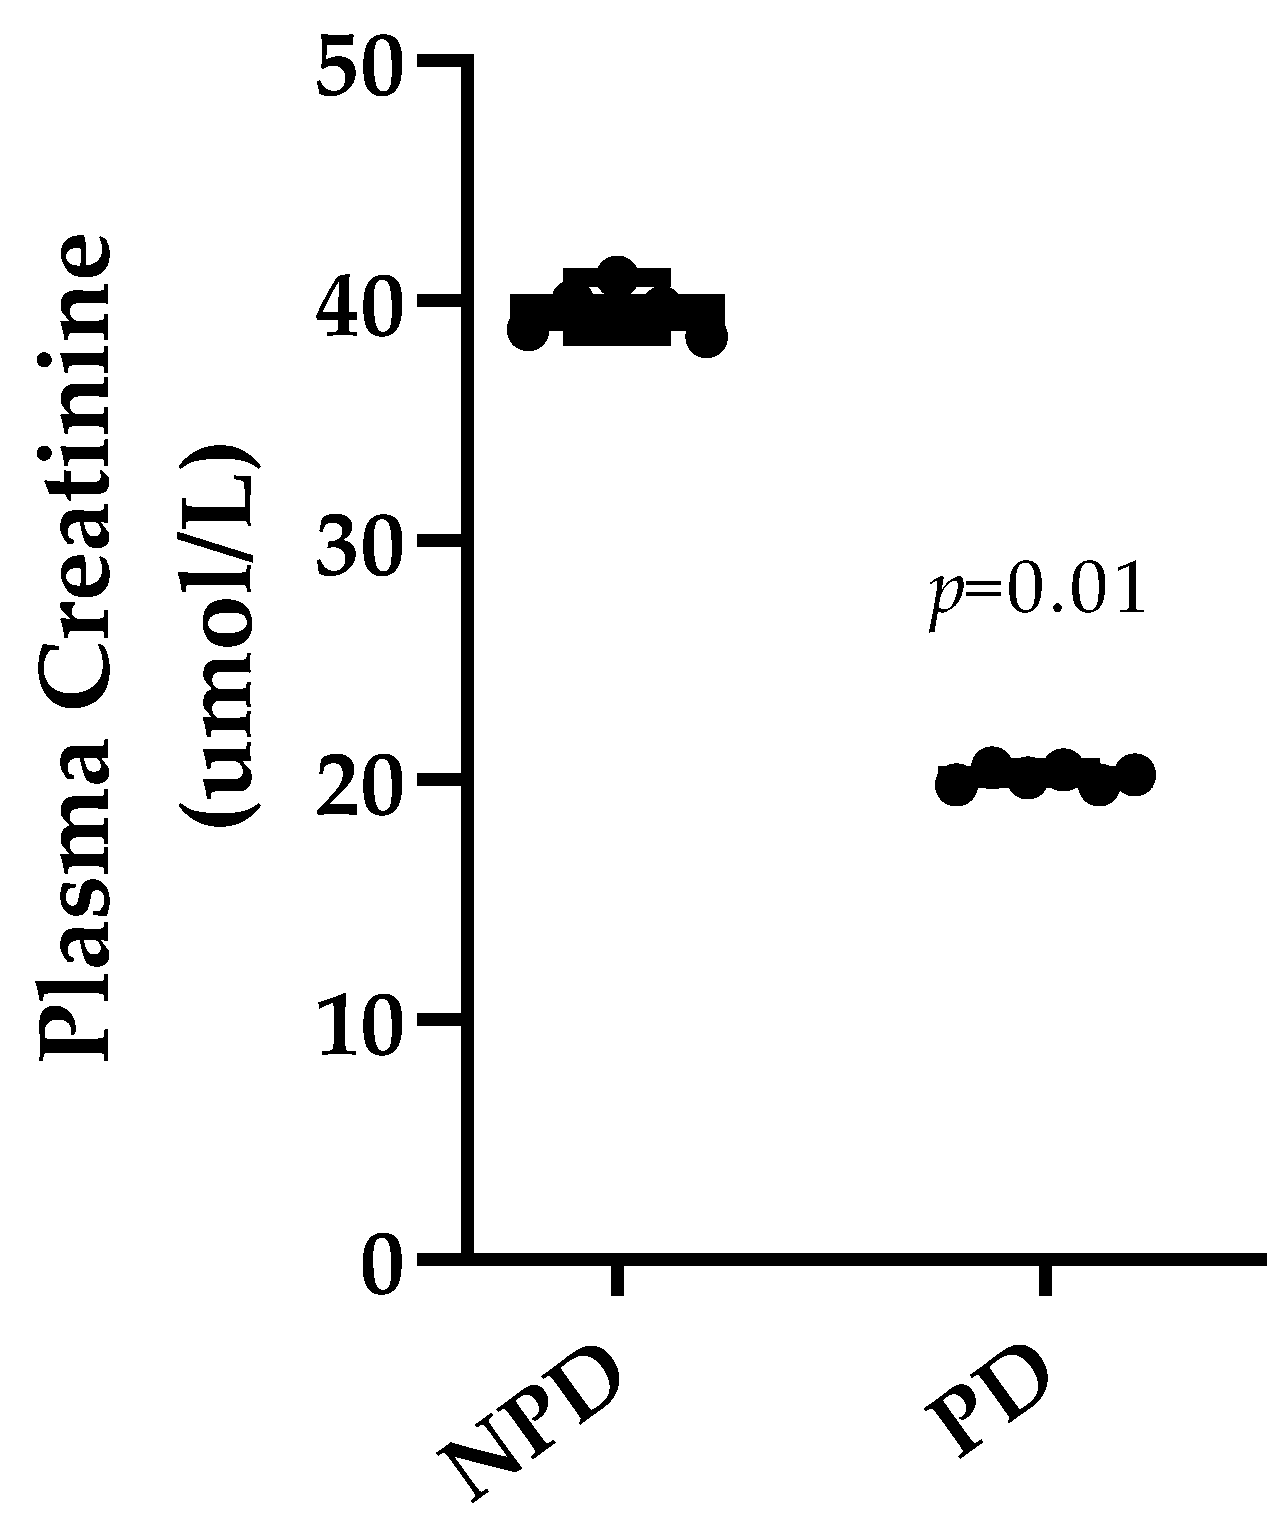
3.4. Plasma Creatinine

Plasma creatinine concentrations were analyzed at the end of the 20-week induction period in both the non-prediabetic control group (NPD) and the prediabetic group (PD). The results (Figure 5) showed that the PD group had significantly (p = 0.01) lower plasma creatinine concentration in comparison to the NPD group.

3.5. Plasma Insulin and Glycated Hemoglobin

Plasma insulin concentrations and glycated hemoglobin (HbA1c) concentrations of non-prediabetic control group (NPD) and prediabetic group (PD) were determined at the end of the experimental period (Table 1). The insulin and HbA1c concentrations significantly increased in the prediabetic group in comparison to the non-prediabetic group #.

3.6. HbA1c and Thyroid Hormones (T3 and T4) Correlation

As indicated in Table 2, HbA1c concentrations were shown to have a positive correlation (r = 0.8122) with T3 plasma concentration and a negative correlation (r = −0.8238) with T4 plasma concentration in the prediabetic (PD) group. Therefore, as the HbA1c concentration increased, the T3 plasma concentration increased while the T4 plasma concentration decreased. However, there was insignificant correlation between HbA1c and T3 concentrations as well as the T4 concentration in non-prediabetic (NPD) group

4. Discussion

T2DM is a metabolic disorder that is characterized by chronic hyperglycemia that occurs due to a reduction in insulin sensitivity in target tissues [1]. This disorder has been shown to result in a wide array of micro- and macrovascular disorders [2]. The association between T2DM and thyroid dysfunction has been extensively studied [13]. The onset of T2DM has been shown to be often preceded by prediabetes, which is a state of chronic intermediate hyperglycemia [3,20]. Thyroid hormones have been shown to play a regulatory role in glucose homeostasis, metabolic function, and energy expenditure [10]. There have been several studies that have investigated changes in thyroid function during T2DM [11,12]. Thyroid dysfunction (TD) and diabetes mellitus (DM) are two of the most frequent chronic endocrine disorders with variable prevalence among different populations. Both hyperthyroidism and hypothyroidism can impair metabolic control in patients with diabetes, which can have a negative effect on the management of the diseases. There have been studies that have shown that individuals diagnosed with T2DM are at a higher risk of developing thyroid disorders, while other studies have shown that thyroid disorders are positively associated with the development of diabetes mellitus. While several studies have shown that complications associated with T2DM begin during prediabetes, there have been no studies have been conducted to investigate thyroid function during the prediabetic phase [14,15,16]. An HFHC-diet-induced animal model of prediabetes has been used in the study of prediabetes as this model has been found to mimic the human prediabetic condition [17]. This model has been demonstrated to be associated with disturbances in the metabolic control, HPA axis, and RAAS system, and moreover, cardiovascular and renal dysfunction has been established [7,8,9] In this model, using this animal model, we investigated changes in thyroid function during the prediabetic state by looking at selected markers of thyroid function.
The thyroid hormones triiodothyronine (T3) and thyroxine (T4) have an imperative function in both metabolic and protein synthesis pathways [21]. Previous studies have shown that individuals diagnosed with T2DM often present with supraphysiological concentrations of insulin coupled with a dysregulation in the plasma levels of thyroid hormones [22]. The synthesis of thyroid hormones requires the cumulative effort of the thyroid gland, regulated biochemical signaling cascades, and sufficient dietary iodine intake [23]. The hypothalamic–pituitar–thyroid axis (HPT axis) is stimulated to regulate the excitatory and inhibitory signals that trigger the production of thyroid hormones. Thyroid-stimulating hormone (TSH), released from the anterior pituitary gland, is the primary stimulator of thyroid hormone synthesis [24]. The release of TSH is stimulated by thyroid-releasing hormone (TRH) from the hypothalamus, both of which are regulated via the negative feedback loops that act on the HPT axis [25]. Studies have shown that impairment of these feedback loops results in increased release of both T3 and T4 hormone production simultaneously [26,27]. In this study, the T3 levels were found to be elevated in the prediabetic group, whereas the T4 levels were reduced. These findings were supported by previous literature, which showed that a subsequent increase in T3 hormone production coincided with a reduction in T4 production [28]. This imbalance in hormone synthesis is suspected to arise from the thyroid gland itself rather than the HPT axis [28]. The synthesis of thyroid hormones requires a multi-step process along with vital metabolic and cellular constituents. This intricate process is initiated by the binding of TSH to the TSH receptor on the surface of the follicular cell within the thyroid gland. Once the receptor–ligand complex has formed, an intracellular signaling cascade is stimulated, thus leading to the synthesis of T3 and T4 [29]. The major constituents of thyroid hormones are tyrosine and iodine. A key enzyme in the synthesis of thyroid hormones is thyroid peroxidase (TPO), which has multiple functions in the synthesis pathway. It is responsible for the formation of iodine by oxidizing the iodide ions as well as initiating the formation of covalent bonds between the iodide and the thyroglobulin [30]. This covalent bonding ultimately leads to the synthesis of monoiodotryrosine (MIT) and diiodotyrosine (DIT), depending on their single or double iodinated state [31]. TPO then regulates the generation of T4 by coupling two DIT residues or T3 by coupling a DIT with an MIT.
Studies have identified T4 as the more abundant thyroid hormone as TPO is predisposed to promote the coupling of DIT-to-DIT residues rather than the alternative DIT to MIT [32]. Thus, a reduction in T4 hormone production may be attributed to the simultaneous reduction in TPO enzyme synthesis or function. Therefore, the results of this study corroborated with that of previous literature, as the plasma T4 levels were significantly reduced in the prediabetic group, along with an increase in TPO antibody production. TPO enzyme function is disrupted by the production of TPO antibodies, which are synthesized by the lymphocytes of the autoimmune system [33]. Thyrocyte destruction precedes the action of TPO antibodies as they exert an intracellular inhibitory effect on the TPO enzymes and their associated signaling cascade [34]. TPO antibodies competitively inhibit the action of TPO enzyme activity by forming conformational isotopes of the enzymes, which impede its function in the thyroid hormone synthesis pathway. These antibodies also contribute to the fixation of complement, which results in the destruction of the thyroid gland [35]. In this study, we found elevated levels of TPO antibody production in the prediabetic group as compared to the non-diabetic group. A previous study has shown that there is dysregulation of immune function during the prediabetic state, leading to an elevation of lymphohycytes [18]. We therefore speculate that the reduction in TPO enzyme activity may be attributed to the increase in TPO antibody production; thus, the thyroid hormone synthesis pathways favored the deionization of T4 to T3 in response to the diminished hormone production. However, it could also be a necessity for more future studies to elucidate the expression of gene expression of TPO to further understand whether thesis synthesis is disrupted or not.
The reduction in the T4 hormone concentration leads to the reduced function of the thyroid gland [36]. This leads to a reduction in circulating T4 levels, resulting in diminished biological function [37]. One of such physiological functions is that of protein synthesis. In a previous study, elevated levels of thyroid hormone were found to correlate with the destruction of protein stores from skeletal muscle [38]. Thus, an inference can be made regarding the reduced creatinine levels, which form as a by-product of protein degradation in the prediabetic group, as the reduction in T4 would subsequently enhance the synthesis and degradation of proteins. A previously published study showed no significant changes in glomerular filtration during the prediabetic state, thus eliminating hyperfiltration as a possible cause for the reduction in creatinine levels [39]. The reduced plasma creatinine observed in the prediabetic group may therefore be an indicator of reduced protein synthesis, preceded by the reduction in thyroid hormone activity [40].
Thyroid hormone precipitates hepatic glucose output through increased hepatic expression of glucose transporter (GLUT)2 and stimulates the endogenous production of glucose through the increase in gluconeogenesis and glycogenolysis, which can allude to the decrease in liver sensitivity to insulin [41]. Administration of thyroid hormones was demonstrated to increase alanine transport into hepatocytes and the conversion of alanine into glucose (Singh). An important effect of T3 is the increase in glucose 6-phosphate mRNA expression and the synthesis of PEPCK [42,43]. Hepatic PEPCK mRNA has been shown to stimulated 3.5-fold in thyrotoxic rats, and an interesting observation is that it is resistant to insulin suppression of hepatic glucose production compared to rats with normal thyroid function [44]. Other hepatic gluconeogenic enzymes have also been shown to be positively regulated by TH [45]. Lastly, thyroid hormone antagonism effect on insulin action could be ascribed to heightened sympathetic activation. Another imperative function of thyroid hormones is to facilitate the breakdown of insulin [22]. Previous studies have found a correlation between insulin resistance and thyroid disorders. Thyroid hormones have been found to impede the action of insulin whilst stimulating hepatic gluconeogenesis [46,47]. The increase in plasma insulin observed in the prediabetic group may be due to the diminished activity of the circulating thyroid hormones. Thus, there is hyperinsulinemia as well as increased insulin half-life, which promotes insulin resistance [12]. This may be a compensatory mechanism that arises due to the cells’ failure to respond to insulin, leading to a fall in T4 concentrations, thus ensuring higher insulin concentrations. Additionally, studies have found a positive correlation between elevated T3 levels and insulin resistance [48]. T3 was found to be actively involved in the regulation of metabolic transcription factors, which are attributed to insulin resistance [49,50]. In this study, we found elevated T3 levels in the prediabetic state. This suggests that thyroid dysfunction in the prediabetic state may contribute to the progression of prediabetes to overt type 2 diabetes. Since T4 is the more abundant thyroid hormone, a reduction in its plasma concentration may suggest the onset of a thyroid disorder. On the other hand, the increase in the biologically active T3 hormone may be due to the impediment of the TPO enzyme leading to the over-activity of the deiodinase system, resulting in an increase in T3 production [51]. The interaction between the concentration of the thyroid hormones, along with their downstream enzymes metabolic and biosynthetic pathways, attests to the importance of the thyroid and the consequences of its dysfunction.
Moreover, in this study, there was increased glycated hemoglobin (HbA1c) in correlation with increased T3 and decreased T4 concentration in prediabetic rats, while this was not observed in non-prediabetic rats. One of the characteristics of prediabetes is elevated HbA1c, which has been associated with insulin resistance. As discussed above, the increase in T3 or decrease in T4 production may be a compensatory mechanism to alleviate insulin resistance in prediabetic conditions. Therefore, we may suggest that the compensatory mechanism engendered the observed positive correlation of HbA1c with T3 and negative correlation of HbA1c with T4 in the prediabetic rats. However, the limitation of this study is the absence of molecular and cellular changes that occur in the thyroid gland following prediabetes; therefore, future studies need to be carried out in these areas. The findings from this paper could assist in expanding the literature to better understand the possible role of thyroid hormones in the development and progression of DM and vice versa. Furthermore, this may also highlight the necessity of screening for thyroid disorders in prediabetic individuals; where possible, management of thyroid disorders should be prioritized. Moreover, understanding the disruption of the thyroid system pathway could perhaps assist clinicians and researchers in intensifying the management of prediabetes envisaged to delay the onset and progression of thyroid disorders.

5. Conclusions

In conclusion, this study has shown for the first time that thyroid hormone dysregulations also occur in prediabetes, the condition that often precedes the onset of type 2 diabetes, by using a diet-induced prediabetic animal model. There is evidence from this study that a correlation exists between diet-induced prediabetes and thyroid dysfunction via increased triiodothyronine (T3) and a subsequent decrease in thyroxine (T4) hormone concentrations as HbA1c increased in the prediabetic state. This observed dysregulation of thyroid hormones in the prediabetic stage was further evidenced by the increased production of TPO antibodies. Taken together, the finding of this study suggests that thyroid hormone homeostasis is disrupted during prediabetes; therefore, future research on the thyroid hormone synthesis pathway in prediabetic conditions is crucial to delineate the mechanism by which prediabetes affects thyroid hormone production.

Author Contributions

Conceptualization, M.P. and A.K.; methodology, M.P., P.M., A.A., N.S., P.N. and A.K.; software, M.P., P.M. and A.K.; validation, M.P., P.N., N.S. and A.K.; formal analysis, M.P. and A.K.; investigation, M.P., P.M., A.A., N.S., P.N. and A.K.; resources, A.K.; data curation, M.P., P.M. and A.A.; writing—original draft preparation, M.P.; writing—review and editing, M.P., P.M., A.A., N.S., P.N. and A.K.; supervision, P.N., N.S. and A.K.; project administration A.K.; funding acquisition, A.K. All authors have read and agreed to the published version of the manuscript.

Funding

This research was funded by the National Research Foundation (NRF) (grant 106041), and the APC was funded by the University of KwaZulu Natal College of Health Science.

Institutional Review Board Statement

The animal study protocol was approved by the Institutional Animal Research Ethics Committee of the University of KwaZulu-Natal UKZN (protocol code AREC/026/017M).

Informed Consent Statement

Not applicable.

Data Availability Statement

The data presented in this study are available on request from the corresponding author.

Acknowledgments

The authors acknowledge Dennis Makhubela from the physiology department for laboratory assistance and the personnel at the UKZN Biomedical Resource Unit for their technical assistance.

Conflicts of Interest

The authors declare no conflict of interest. The funders had no role in the design of the study; in the collection, analyses, or interpretation of data; in the writing of the manuscript; or in the decision to publish the results.

References

  1. Punthakee, Z.; Goldenberg, R.; Katz, P. Definition, classification and diagnosis of diabetes, prediabetes and metabolic syndrome. Can. J. Diabetes 2018, 42, S10–S15. [Google Scholar] [CrossRef]
  2. Shah, A.; Kanaya, A.M. Diabetes and associated complications in the South Asian population. Curr. Cardiol. Rep. 2014, 16, 476. [Google Scholar] [CrossRef]
  3. Dorcely, B.; Katz, K.; Jagannathan, R.; Chiang, S.S.; Oluwadare, B.; Goldberg, I.J.; Bergman, M. Novel biomarkers for prediabetes, diabetes, and associated complications. Diabetes Metab. Syndr. Obes. Targets Ther. 2017, 10, 345–361. [Google Scholar] [CrossRef]
  4. Tuso, P. Prediabetes and lifestyle modification: Time to prevent a preventable disease. Perm. J. 2014, 18, 88. [Google Scholar] [CrossRef]
  5. Bansal, N. Prediabetes diagnosis and treatment: A review. World J. Diabetes 2015, 6, 296. [Google Scholar] [CrossRef]
  6. Yip, W.C.; Sequeira, I.R.; Plank, L.D.; Poppitt, S.D. Prevalence of pre-diabetes across ethnicities: A review of impaired fasting glucose (IFG) and impaired glucose tolerance (IGT) for classification of dysglycaemia. Nutrients 2017, 9, 1273. [Google Scholar] [CrossRef]
  7. Akinnuga, A.M.; Siboto, A.; Khumalo, B.; Sibiya, N.H.; Ngubane, P.; Khathi, A. Evaluation of the effects of bredemolic acid on selected markers of glucose homeostasis in diet-induced prediabetic rats. Arch. Physiol. Biochem. 2022, 128, 306–312. [Google Scholar] [CrossRef]
  8. Mkhize, B.C.; Mosili, P.; Ngubane, P.S.; Sibiya, N.H.; Khathi, A. Diet-induced prediabetes: Effects on the activity of the renin–angiotensin–aldosterone system in selected organs. J. Diabetes Investig. 2022, 13, 768–780. [Google Scholar] [CrossRef]
  9. Mosili, P.; Mkhize, B.C.; Ngubane, P.; Sibiya, N.; Khathi, A. The dysregulation of the hypothalamic–pituitary–adrenal axis in diet-induced prediabetic male Sprague Dawley rats. Nutr. Metab. 2020, 17, 104. [Google Scholar] [CrossRef]
  10. Mullur, R.; Liu, Y.-Y.; Brent, G.A. Thyroid hormone regulation of metabolism. Physiol. Rev. 2014, 94, 355–382. [Google Scholar] [CrossRef]
  11. Makandar, A.; Sonagra, A.D.; Shafi, N. Study of thyroid function in type 2 diabetic and non-diabetic population. Int. J. Med. Sci. Public Health 2015, 4, 769–772. [Google Scholar] [CrossRef]
  12. Ahmed, R. Thyroid-insulin dysfunction during development. Int. J. Res. Stud. Zool. 2017, 3, 73–75. [Google Scholar]
  13. Zhao, W.; Li, X.; Liu, X.; Lu, L.; Gao, Z. Thyroid function in patients with type 2 diabetes mellitus and diabetic nephropathy: A single center study. J. Thyroid Res. 2018, 2018, 9507028. [Google Scholar] [CrossRef]
  14. Jali, M.; Kambar, S.; Jali, S.M.; Pawar, N.; Nalawade, P. Prevalence of thyroid dysfunction among type 2 diabetes mellitus patients. Diabetes Metab. Syndr. Clin. Res. Rev. 2017, 11, S105–S108. [Google Scholar] [CrossRef]
  15. Subekti, I.; Pramono, L.A.; Dewiasty, E.; Harbuwono, D.S. Thyroid dysfunction in type 2 diabetes mellitus patients. Acta Med. Indones. 2018, 49, 314. [Google Scholar]
  16. Nishi, M. Diabetes mellitus and thyroid diseases. Diabetol. Int. 2018, 9, 108–112. [Google Scholar] [CrossRef]
  17. Luvuno, M.; Mbongwa, H.; Khathi, A. Development of a novel prediabetes animal model using a high fat high carbohydrate diet: Implications for type 2 diabetes. PLoS ONE 2017, 13, 8–14. [Google Scholar]
  18. Mzimela, N.C.; Ngubane, P.S.; Khathi, A. The changes in immune cell concentration during the progression of pre-diabetes to type 2 diabetes in a high-fat high-carbohydrate diet-induced pre-diabetic rat model. Autoimmunity 2019, 52, 27–36. [Google Scholar] [CrossRef] [PubMed]
  19. Diabetes, Endocrinology & Metabolism. Diabetes Trial Unit. HOMA Calculator. Available online: http://www.dtu.ox.ac.uk/ (accessed on 9 July 2016).
  20. Gamede, M.; Mabuza, L.; Ngubane, P.; Khathi, A. The effects of plant-derived oleanolic acid on selected parameters of glucose homeostasis in a diet-induced pre-diabetic rat model. Molecules 2018, 23, 794. [Google Scholar] [CrossRef]
  21. Carvalho, D.P.; Dupuy, C. Thyroid hormone biosynthesis and release. Mol. Cell. Endocrinol. 2017, 458, 6–15. [Google Scholar] [CrossRef] [PubMed]
  22. De Vito, P.; Candelotti, E.; Ahmed, R.G.; Luly, P.; Davis, P.J.; Incerpi, S.; Pedersen, J.Z. Role of thyroid hormones in insulin resistance and diabetes. Immunol. Endocr. Metab. Agents Med. Chem. (Former. Curr. Med. Chem. Immunol. Endocr. Metab. Agents) 2015, 15, 86–93. [Google Scholar] [CrossRef]
  23. Rousset, B.; Dupuy, C.; Miot, F.; Dumont, J. Thyroid Hormone Synthesis and Secretion, Endotext. Mary Anne Liebert Publishers Inc. 2015. Available online: https://www.thyroidmanager.org/chapter/chapter-2-thyroid-hormone-synthesis-and-secretion (accessed on 10 March 2023).
  24. Liu, C.-C.; Dong, Z.-Q.; Zhou, Y.-L.; Liao, Z.-B.; RH, A.; Ming, X.; Guo, J.; Sun, X.-L. Role of HPA and HPT Axis in Anxiety Disorder Complicated with Diabetes Mellitus. Sichuan Da Xue Xue Bao. Yi Xue Ban = J. Sichuan Univ. Med. Sci. Ed. 2017, 48, 895–899. [Google Scholar]
  25. Fliers, E.; Bianco, A.C.; Langouche, L.; Boelen, A. Thyroid function in critically ill patients. Lancet Diabetes Endocrinol. 2015, 3, 816–825. [Google Scholar] [CrossRef]
  26. Annamalai, A. Medical Management of Psychotropic Side Effects; Springer: Berlin/Heidelberg, Germany, 2017. [Google Scholar] [CrossRef]
  27. Ramos-Leví, A.M.; Marazuela, M. Pathogenesis of thyroid autoimmune disease: The role of cellular mechanisms. Endocrinol. Nutr. 2016, 63, 421–429. [Google Scholar] [CrossRef] [PubMed]
  28. Sharma, A.N.; Levy, D.L. Thyroid and adrenal disorders. In Rosen’s Emergency Medicine: Concepts and Clinical Practice; Mosby: St. Louis, MO, USA, 2014; pp. 1676–1693. [Google Scholar]
  29. Hannoush, Z.C.; Weiss, R.E. Defects of thyroid hormone synthesis and action. Endocrinol. Metab. Clin. 2017, 46, 375–388. [Google Scholar] [CrossRef]
  30. Vissenberg, R.; Manders, V.; Mastenbroek, S.; Fliers, E.; Afink, G.; Ris-Stalpers, C.; Goddijn, M.; Bisschop, P. Pathophysiological aspects of thyroid hormone disorders/thyroid peroxidase autoantibodies and reproduction. Hum. Reprod. Update 2015, 21, 378–387. [Google Scholar] [CrossRef]
  31. Summers, R.; Macnab, R. Thyroid, parathyroid hormones and calcium homeostasis. Anaesth. Intensive Care Med. 2017, 18, 522–526. [Google Scholar] [CrossRef]
  32. Abdalla, S.M.; Bianco, A.C. Defending plasma T3 is a biological priority. Clin. Endocrinol. 2014, 81, 633–641. [Google Scholar] [CrossRef]
  33. Loh, T.P.; Tee, J.C.S.; Tee, N.W.S.; Cheng, W.L.; Thevarajah, M.; Sabir, N.; Chew, Y.Y.; Sethi, S.K.; Khoo, C.M. Association between thyroid function tests and anti-thyroid peroxidase (TPO) antibodies in pregnancy. Endocrine 2016, 53, 865–867. [Google Scholar] [CrossRef]
  34. Fröhlich, E.; Wahl, R. Thyroid autoimmunity: Role of anti-thyroid antibodies in thyroid and extra-thyroidal diseases. Front. Immunol. 2017, 8, 521. [Google Scholar] [CrossRef]
  35. Kumru, P.; Erdogdu, E.; Arisoy, R.; Demirci, O.; Ozkoral, A.; Ardic, C.; Ertekin, A.A.; Erdogan, S.; Ozdemir, N.N. Effect of thyroid dysfunction and autoimmunity on pregnancy outcomes in low risk population. Arch. Gynecol. Obstet. 2015, 291, 1047–1054. [Google Scholar] [CrossRef] [PubMed]
  36. Schroeder, A.C.; Privalsky, M.L. Thyroid hormones, t3 and t4, in the brain. Front. Endocrinol. 2014, 5, 40. [Google Scholar] [CrossRef] [PubMed]
  37. Dunn, D.; Turner, C. Hypothyroidism in women. Nurs. Women’s Health 2016, 20, 93–98. [Google Scholar] [CrossRef]
  38. Bernardes, S.S.; Guarnier, F.A.; Marinello, P.C.; Armani, A.; Simão, A.N.C.; Cecchini, R.; Cecchini, A.L. Reactive oxygen species play a role in muscle wasting during thyrotoxicosis. Cell Tissue Res. 2014, 357, 803–814. [Google Scholar] [CrossRef]
  39. Khathi, A.; Luvuno, M.; Mabandla, M. Diet-induced prediabetes: Effects on oxidative stress and inflammatory biomarkers as agents for vascular complications in renal function. PONTE Int. J. Sci. Res. 2019, 75. [Google Scholar] [CrossRef]
  40. Cicatiello, A.G.; Di Girolamo, D.; Dentice, M. Metabolic effects of the intracellular regulation of thyroid hormone: Old players, new concepts. Front. Endocrinol. 2018, 9, 474. [Google Scholar] [CrossRef]
  41. Duntas, L.H.; Orgiazzi, J.; Brabant, G. The interface between thyroid and diabetes mellitus. Clin. Endocrinol. 2011, 75, 1–9. [Google Scholar] [CrossRef]
  42. Park, E.; Jerden, D.C.; Bahouth, S.W. Regulation of phosphoenolpyruvate carboxykinase gene transcription by thyroid hormone involves two distinct binding sites in the promoter. Biochem. J. 1995, 309, 913–919. [Google Scholar] [CrossRef]
  43. Park, E.A.; Song, S.; Vinson, C.; Roesler, W.J. Role of CCAAT enhancer-binding protein β in the thyroid hormone and cAMP induction of phosphoenolpyruvate carboxykinase gene transcription. J. Biol. Chem. 1999, 274, 211–217. [Google Scholar] [CrossRef]
  44. Klieverik, L.P.; Sauerwein, H.P.; Ackermans, M.T.; Boelen, A.; Kalsbeek, A.; Fliers, E. Effects of thyrotoxicosis and selective hepatic autonomic denervation on hepatic glucose metabolism in rats. Am. J. Physiol. Endocrinol. Metab. 2008, 294, E513–E520. [Google Scholar] [CrossRef]
  45. Brenta, G. Why can insulin resistance be a natural consequence of thyroid dysfunction? J. Thyroid Res. 2011, 2011, 152850. [Google Scholar] [CrossRef] [PubMed]
  46. Gierach, M.; Gierach, J.; Junik, R. Insulin resistance and thyroid disorders. Endokrynol. Pol. 2014, 65, 70–76. [Google Scholar] [CrossRef]
  47. Samy, D.M.; Ismail, C.A.; Nassra, R.A. Circulating irisin concentrations in rat models of thyroid dysfunction—Effect of exercise. Metabolism 2015, 64, 804–813. [Google Scholar] [CrossRef]
  48. Jayanthi, R.; Srinivasan, A.R.; Hanifah, M.; Maran, A.L. Associations among Insulin resistance, triacylglycerol/high density lipoprotein (TAG/HDL ratio) and thyroid hormone levels—A study on type 2 diabetes mellitus in obese and overweight subjects. Diabetes Metab. Syndr. Clin. Res. Rev. 2017, 11, S121–S126. [Google Scholar] [CrossRef]
  49. Ağbaht, K.; Erdogan, M.F.; Emral, R.; Baskal, N.; Güllü, S. Circulating glucagon to ghrelin ratio as a determinant of insulin resistance in hyperthyroidism. Endocrine 2014, 45, 106–113. [Google Scholar] [CrossRef] [PubMed]
  50. Martinez, B.; Ortiz, R.M. Thyroid hormone regulation and insulin resistance: Insights from animals naturally adapted to fasting. Physiology 2017, 32, 141–151. [Google Scholar] [CrossRef] [PubMed]
  51. Gereben, B.; McAninch, E.A.; Ribeiro, M.O.; Bianco, A.C. Scope and limitations of iodothyronine deiodinases in hypothyroidism. Nat. Rev. Endocrinol. 2015, 11, 642–652. [Google Scholar] [CrossRef]
Figure 1. Experimental design.
Diabetology 04 00034 g001
Figure 2. Plasma thyroid stimulating hormone (TSH) concentration in the non-prediabetic group (NPD) (n = 6) and prediabetic group (PD) (n = 6).
Diabetology 04 00034 g002
Figure 3. Plasma tetraiodothyronine (T4) (A) and plasma triiodothyronine (T3) (B) concentrations in the non-prediabetic group (NPD) (n = 6) and prediabetic group (PD) (n = 6).
Diabetology 04 00034 g003
Figure 4. Plasma thyroid peroxidase (TPO) antibody in both the non-prediabetic control group (NPD) (n = 6) and prediabetic group (PD) (n = 6).
Diabetology 04 00034 g004
Figure 5. The plasma creatinine concentrations in both the non-prediabetic control group (ND) (n = 6) and prediabetic group (PD) (n = 6).
Diabetology 04 00034 g005
Table 1. Plasma insulin concentrations (ng/mL) and glycated hemoglobin (HbA1c) concentrations (%) of non-diabetic control group (ND) and prediabetic group (PD).
GroupNPDPDp Value
Plasma Insulin (ng/mL)2.97 ± 0.0114.25 ± 0.12 ★p < 0.0001
Blood Glucose (mmol/L)4.62 ± 0.116.25 ± 0.11 ★p < 0.001
HOMA-IR0.61 ± 0.013.96 ± 0.09 ★p < 0.0001
HbA1c (%)3.80 ± 1.176.30 ± 0.36 ★p < 0.001
Body Weight (g)368.71 ± 4.02568.50 ± 8.57 ★p < 0.0001
★ Denotes comparison with NPD group.
Table 2. Correlation between glycated hemoglobin (HbA1c) and triiodothyronine (T3) as well as tetraiodothyronine or thyroxine (T4) in non-prediabetic (NPD) and prediabetic (PD) rats. r = Pearson’s correlation coefficient, n = sample size.
GroupsCorrelation AnalysisIndependent Variable:
HbA1c vs. Dependent Variable: T3
Independent Variable:
HbA1c vs. Dependent Variable: T4
NPDR−0.06800.5016
p value0.8981 NS0.3107 NS
N66
PDR0.8122−0.8238
p value0.0496 *0.0438 *
N66
NS Not significant. * p < 0.05.
Disclaimer/Publisher’s Note: The statements, opinions and data contained in all publications are solely those of the individual author(s) and contributor(s) and not of MDPI and/or the editor(s). MDPI and/or the editor(s) disclaim responsibility for any injury to people or property resulting from any ideas, methods, instructions or products referred to in the content.

