Article

Analytical Method Development and Validation: Calcium Butyrate

by
Ayşe Pınar Yağcılar
1,
Emre Şefik Çağlar
2 and
Neslihan Üstündağ Okur
3,*
1
Department of Radiopharmacy, Faculty of Pharmacy, University of Health Sciences, Istanbul 34668, Turkey
2
Department of Pharmaceutical Biotechnology, Faculty of Pharmacy, University of Health Sciences, Istanbul 34668, Turkey
3
Department of Pharmaceutical Technology, Faculty of Pharmacy, University of Health Sciences, Istanbul 34668, Turkey
*
Author to whom correspondence should be addressed.
Analytica 2025, 6(4), 42; https://doi.org/10.3390/analytica6040042
Submission received: 17 September 2025 / Revised: 12 October 2025 / Accepted: 20 October 2025 / Published: 23 October 2025
(This article belongs to the Topic Advances in Chromatographic Separation)

Abstract

This study was designed for the analytical method development and validation for Calcium butyrate (CAB) using High-Performance Liquid Chromatography (HPLC). 1H and 13C Nuclear Magnetic Resonance (NMR) and Fourier Transform Infrared (FTIR) spectroscopy analysis were carried out to examine the molecular structure. For HPLC analysis, a blend of acetonitrile and phosphoric acid solution (0.1%) (20:80) (v/v) was used as a mobile phase. A C18 column (5 µm, 250 × 4.6 mm) was used as a stationary phase. The eluent of CAB was monitored with a UV detector at a wavelength of 206 nm and a flow rate of 1 mL/min. According to the results, FTIR and NMR spectra were consistent with the structural characteristics of CAB, and the expected proton and carbon signals were observed. During the HPLC analysis, due to the ionization of CAB, three distinct retention times were observed in the chromatograms at 3.4, 4.5, and 7.4 min. The validation was performed according to ICH guidelines. The obtained results demonstrated that the analytical method was successfully validated, with LOD values of 1.211, 0.606, and 1.816 µg/mL, and LOQ values of 3.670, 1.835, and 3.676 µg/mL. The assay displayed a linear range of 5–1000 µg/L concentration and was found suitable for further formulation content analysis.

1. Introduction

It is of great importance to develop and validate specific analytical methods for each substance for precise and accurate quantification of active substances in pharmaceutical products [1]. These studies, which are carried out both in research and development studies and by the units responsible for quality in the pharmaceutical industry, are closely related to the physicochemical properties of substances and play essential role in the correct amount, efficacy and safety of drugs [2]. HPLC is the primary pharmaceutical and biomedical analysis method used today due to its ability to provide high-efficiency separations and, in most cases, high detection sensitivity. Compared to other methods, HPLC offers numerous advantages, including specificity, speed, accuracy, sensitivity, and ease of automation. Due to the limitations of methods such as LC-MS/MS in terms of sensitivity, specificity, and efficiency parameters, which are closely related to each other, as well as their high cost and the need for qualified personnel, HPLC analyses may be preferred in the pharmaceutical field where multi-component dosage forms are involved [3,4].
Butyric acid is recognized as a prebiotic substance that regulates metabolism and serves as an organic acid source. It is produced in colon microbiota by fermentation of nutritional contents, controls the metabolism and motility, and more importantly, protects from infection and mediates inflammatory response. Due to its low molecular weight, it reduces fat accumulation in some farm animals through a down-regulation mechanism via free fatty acid binding receptors [5,6].
Moreover, short-chain fatty acids, such as butyric acid, play a role in promoting immune function through butyrate, achieving this by decreasing pro-inflammatory cytokines and diminishing the proliferation and activation of lymphocytes through inhibition of the NF-κB pathway [5].
Calcium butyrate is a fatty acid salt whose chemical structure can be seen in Figure 1, which serves as nutrition for colonocytes and promotes the development of epithelial cells and their viability [7]. Since 10–20% of the bacteria in the body belong to butyrate-producing families, the biosynthesis of butyrate is a distinctive metabolic activity that supports health. These are mainly revealed because of the complex carbohydrates, which could not be digested initial intestinal part through pyruvate and acetyl-coenzyme A [8].
Various clinical studies and activity assessments, which have mostly focused on butyric acid, have demonstrated the anti-inflammatory effects of both butyric acid and CAB. However, it is crucial to develop a validated analytical method for determining characteristics such as quantitative determination, in vitro release determination, and ex vivo permeation, which are critical processes for formulation development stages [7,9,10,11]. Although numerous studies have reported the analysis of short-chain fatty acids [12,13,14,15,16] and a limited number have focused specifically on sodium butyrate [17,18], research on the development and validation of analytical methods for CAB remains insufficient. Non-acidic mobile phases were used in the analyses developed for sodium butyrate. This suggests that sodium butyrate and CAB, with pKa values between 4 and 5, cause ionization. The present study aimed to develop and validate an HPLC-based analytical method for CAB in accordance with the International Council for Harmonisation (ICH) guidelines. The validated method is expected to serve as a reliable tool for application in future formulation studies.

2. Experimental

2.1. Materials

Acetonitrile (HPLC grade) and o-phosphoric acid were procured from Merck, Darmstadt, Germany. CAB (95% purity) was gifted from Medera Nutrition BV, Utrecht, The Netherlands, Izmir, Türkiye. Ultrapure water was procured from the Direct-Q® Water Purification System, Merck, Darmstadt, Germany. Throughout the study, the chemicals and solvents used were of analytical or HPLC grade.

2.2. FTIR Analysis

The sample was scanned between 4000–600 cm−1 through an FTIR (Shimadzu IRSpirit-X, Kyoto, Japan) spectrophotometer, and the wavelengths at which the peaks occurred were determined [19].

2.3. NMR Analysis

NMR spectra of CAB were saved with the help of a Bruker Avance-III 400 Fourier Transform spectrometer (Karlsruhe, Germany) operating at 400 MHz for 1H and 13C NMR equipped with a 5 mm probe, in deuterium oxide (D2O), with all shifts referring to internal tetramethyl silane (TMS). Baseline correction and imaging studies of the 1H NMR spectra were carried out using the software Mestrenova v14.1.2–25024 (Mestrelab Research SL, Santiago de Compostela, Spain).

2.4. Instrumentation

An instrument including a gradient pump, thermostable column section, and a UV detector (Agilent 1200, Santa Clara, CA, USA) was used for HPLC analysis. A temperature-controlled C18 column (5 µm, 250 × 4.6 mm) (Develosil, Seto, Japan) was utilized in this system. UV detectors were used throughout the analysis. ChemStation v4.03.016 software was used for the analysis conditions and all results obtained.

2.5. Chromatographic Conditions

The optimum wavelength was selected by following a previous study carried out [20] for the determination of CAB and to prevent the undesired noise.
The mobile phase was prepared as a mixture of acetonitrile and o-phosphoric acid solution (0.1%) (20:80) (v/v) and pumped at a 1 mL per minute flow rate. The temperature of the column was fixed at 30 °C over the analyses, and the injection volume of the sample was set to 20 μL. Before sample injection into the device, the column was equilibrated by passing the mobile phase through it for at least 40 min. All prepared samples were filtered through a membrane filter with a 0.45 μm pore size prior to analysis. The run time was set to 10 min for each sample.

2.6. Preparation of Stock Solution and Standard Sample Solutions

Stock solutions (1000 μg/mL) of CAB were prepared by dissolving 250 mg of the drug in 250 mL of the mobile phase mixture. The prepared standard solutions were stored at 4 °C in amber-colored glass volumetric flasks. Concentrations of 5, 10, 25, 50, 100, 200, 400, 600, 800, and 1000 μg/mL were selected for the creation of calibration curves. These working solutions were freshly prepared before the analyses. All samples were filtered using a 0.45 µm pore size membrane filter before being injected into the device.

2.7. HPLC Method Validation

The validation of the method was examined in terms of linearity, LOD, LOQ, precision, accuracy, specificity and robustness according to ICH guidelines Q2(R1) [21].

2.7.1. Linearity

The linearity between the peak areas in the chromatograms obtained from the analysis of the samples and the concentration was analyzed using a calibration curve created in the range of 5 to 1000 µg/mL.

2.7.2. Specificity

Specificity was examined by analyzing the mobile phase and solutions of CAB, which will be used to prepare formulations.

2.7.3. Precision

To verify the precision parameter, 200 µg/mL of CAB solution was injected into the device ten times, and the mean, standard deviation (SD), and coefficient of variation (CV%) values of the series were determined.
The repeatability of the method was tested using six different samples on consecutive days. Afterwards, intermediate precision was tested by two different analysts with six different levels.

2.7.4. Accuracy

The three prepared standard solutions (200, 400, and 1000 µg/mL) were analyzed five times at different levels as test samples using the device.

2.7.5. Robustness

The robustness of the developed method was determined by the peak area values of the prepared solutions, which were tested at various time points (30, 60, 120, and 240 min, as well as 24 and 48 h) in accordance with the guidelines.

2.7.6. Determination of Detection Limit and Quantification Limit

The LOD value of the developed method for CAB is calculated by dividing the SD of the data obtained from the minimum concentrations in the sampling series by the slope of the calibration curve and multiplying by 3.3; the LOQ is calculated by multiplying by 10.

3. Results and Discussion

3.1. FTIR Analysis

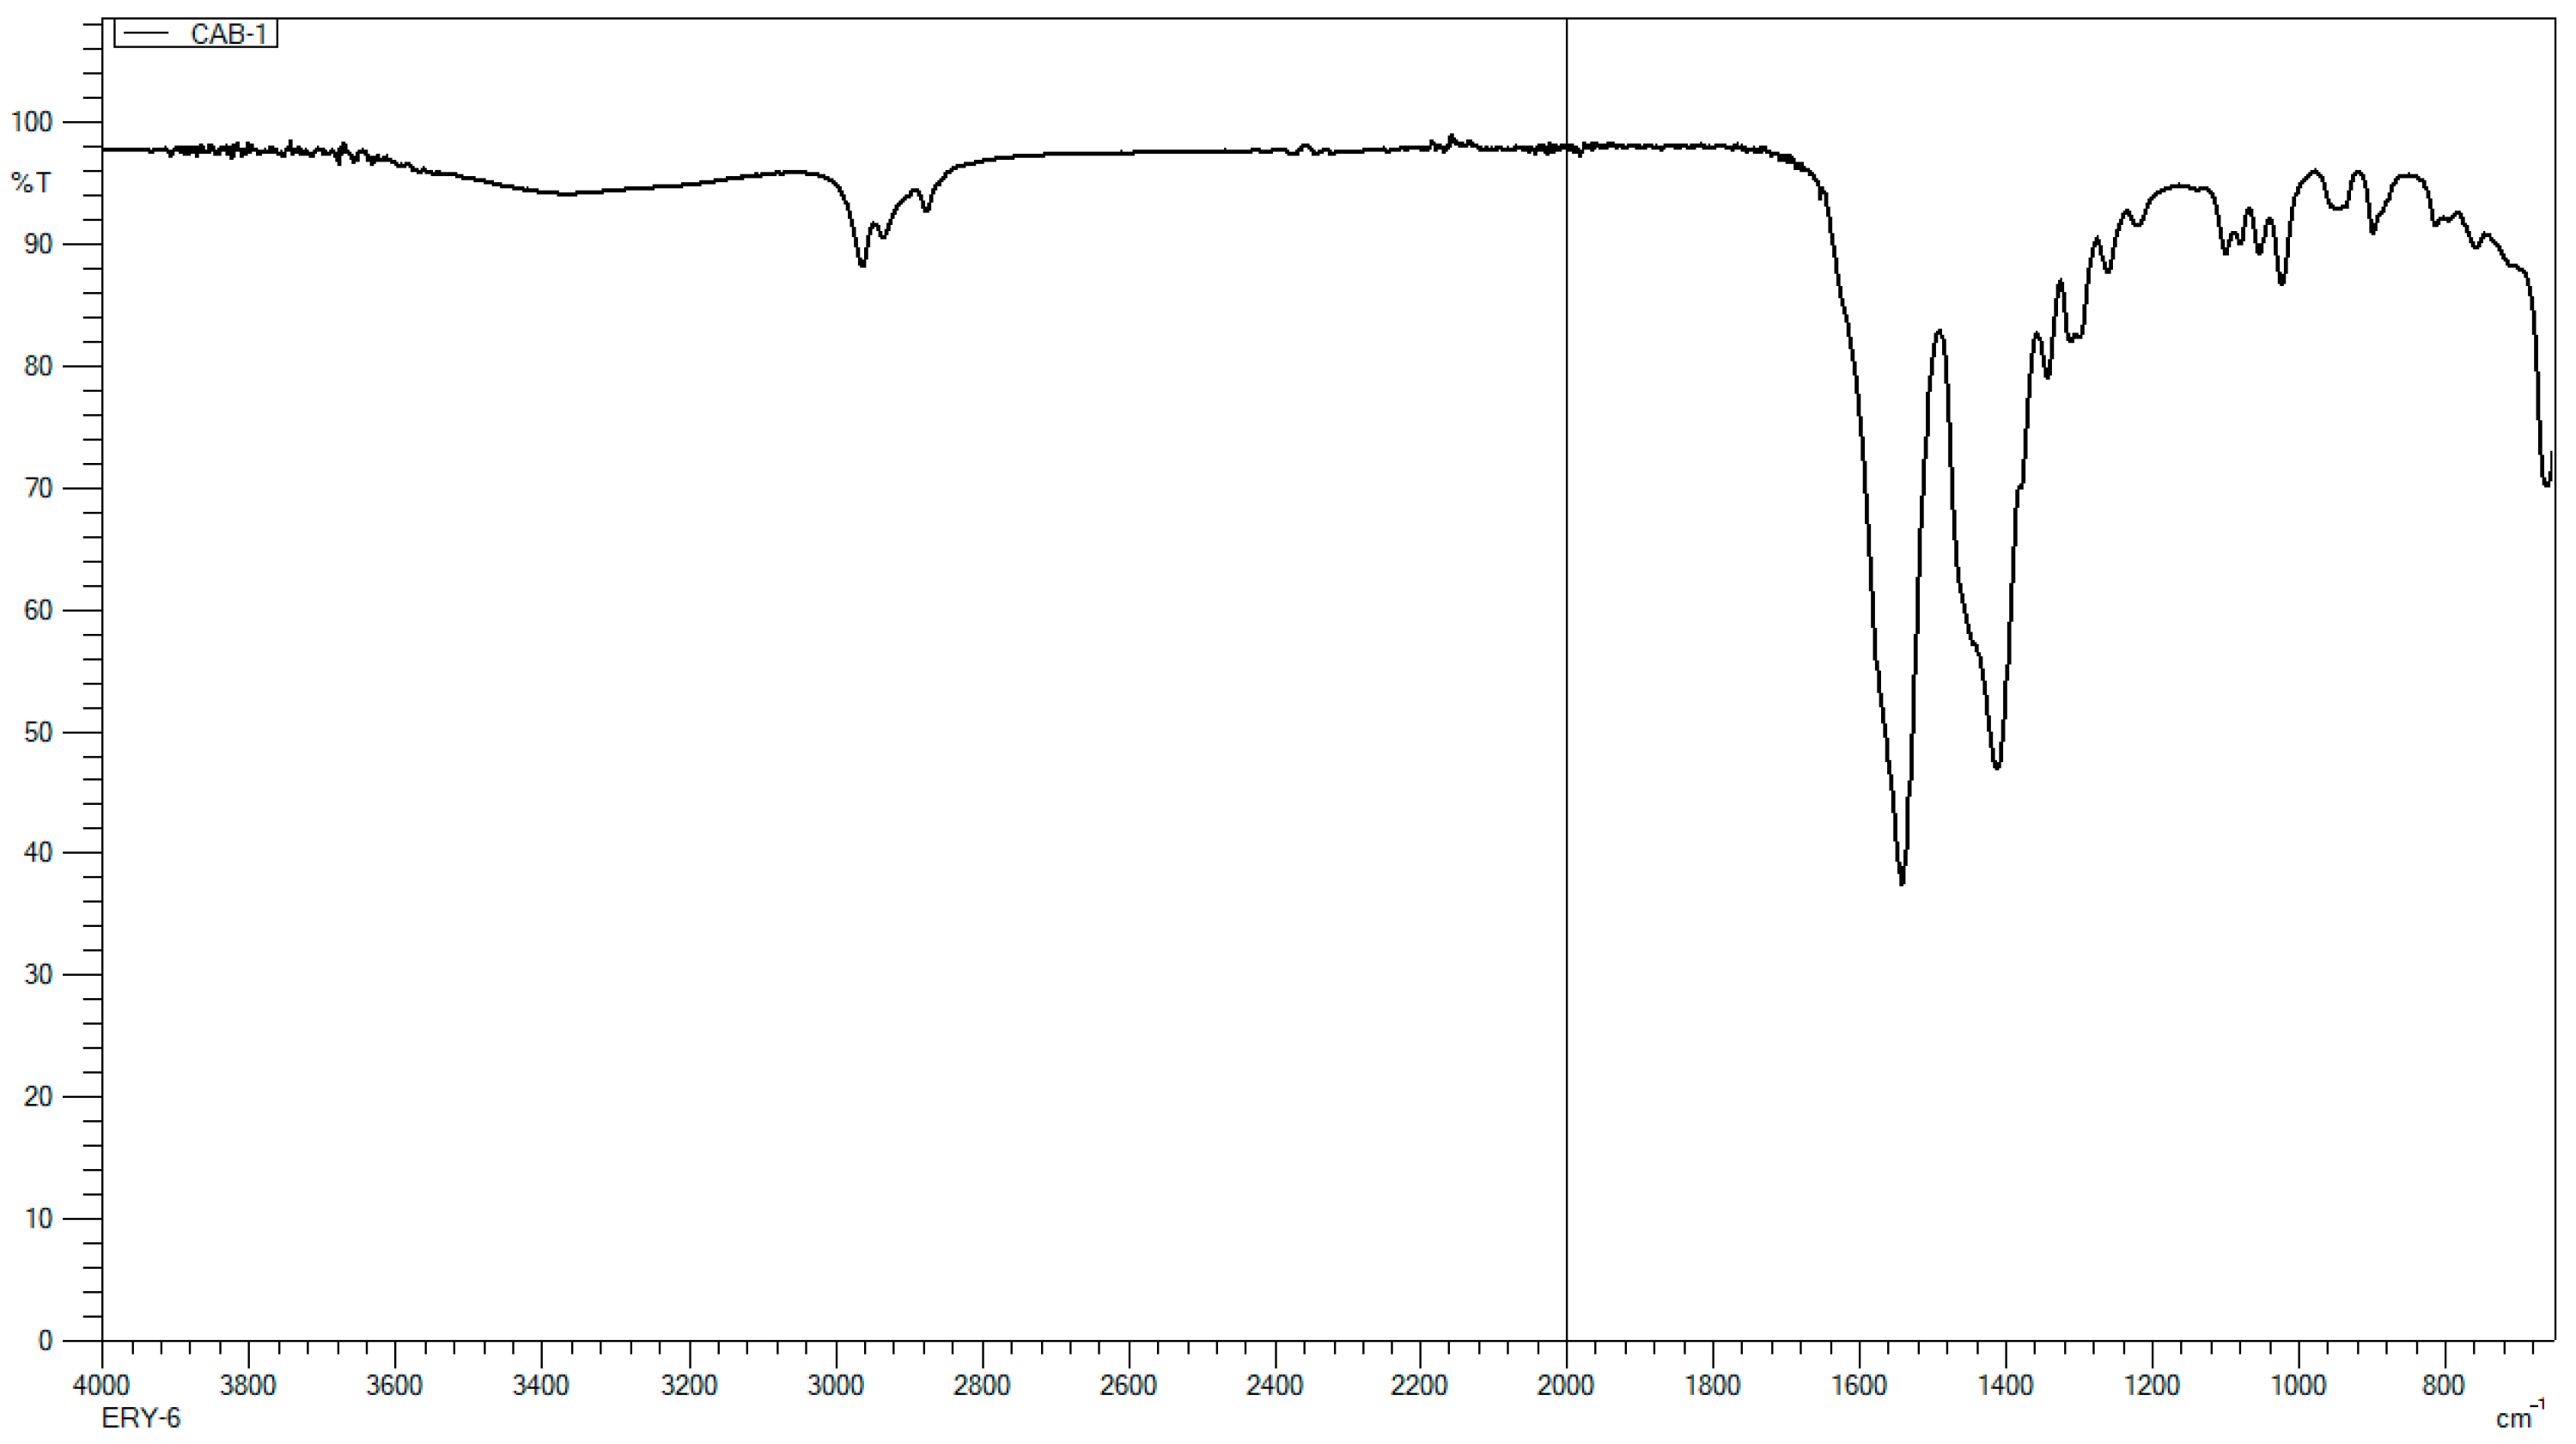
The spectrum of CAB was examined between 4000 and 600 cm−1 with a resolution of 4 cm−1. The stretching between 3000 and 2800 cm−1, especially in 2962 cm−1, exhibited C-H stretching of methyl groups of the structure, similar to the literature [22]. Moreover, the strong bands in 1541 cm−1 and 1411 cm−1 demonstrate the stretching vibrations of the COO group. The band at 1022 cm−1 was evaluated as the C–O stretching vibrations belong to the molecule [23]. The spectrum of CAB is shown in Figure 2.

3.2. NMR Analysis

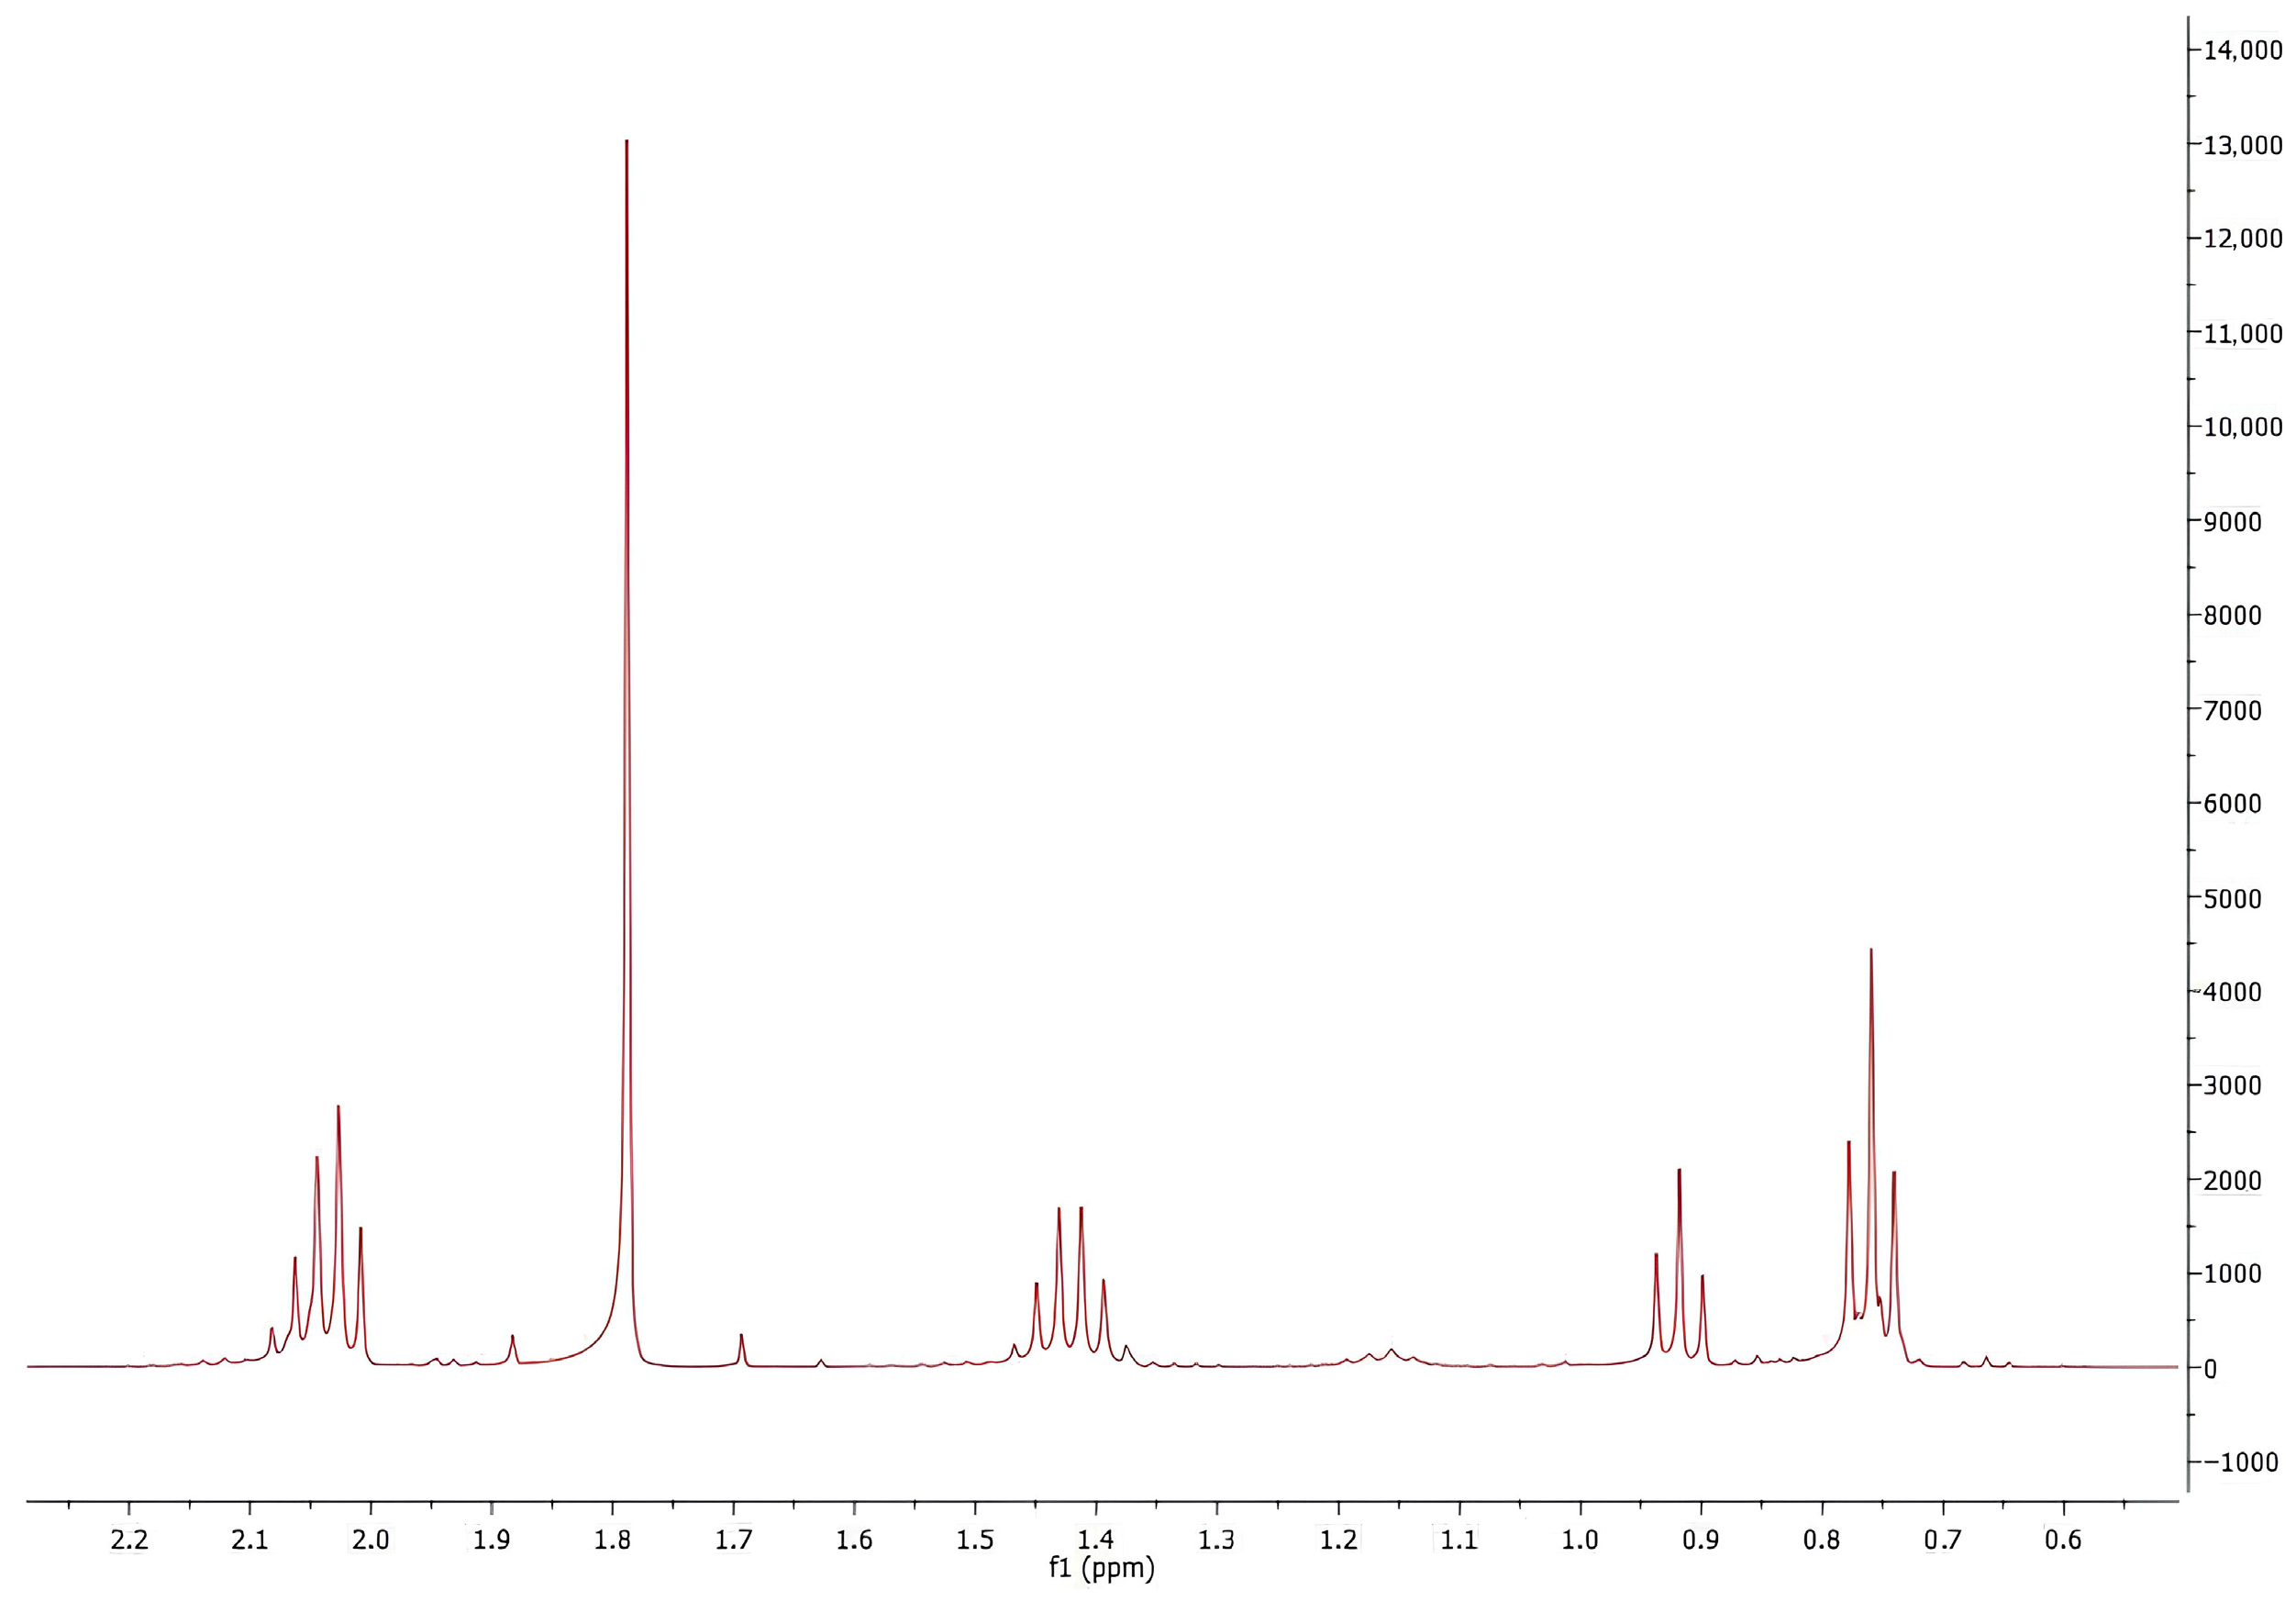
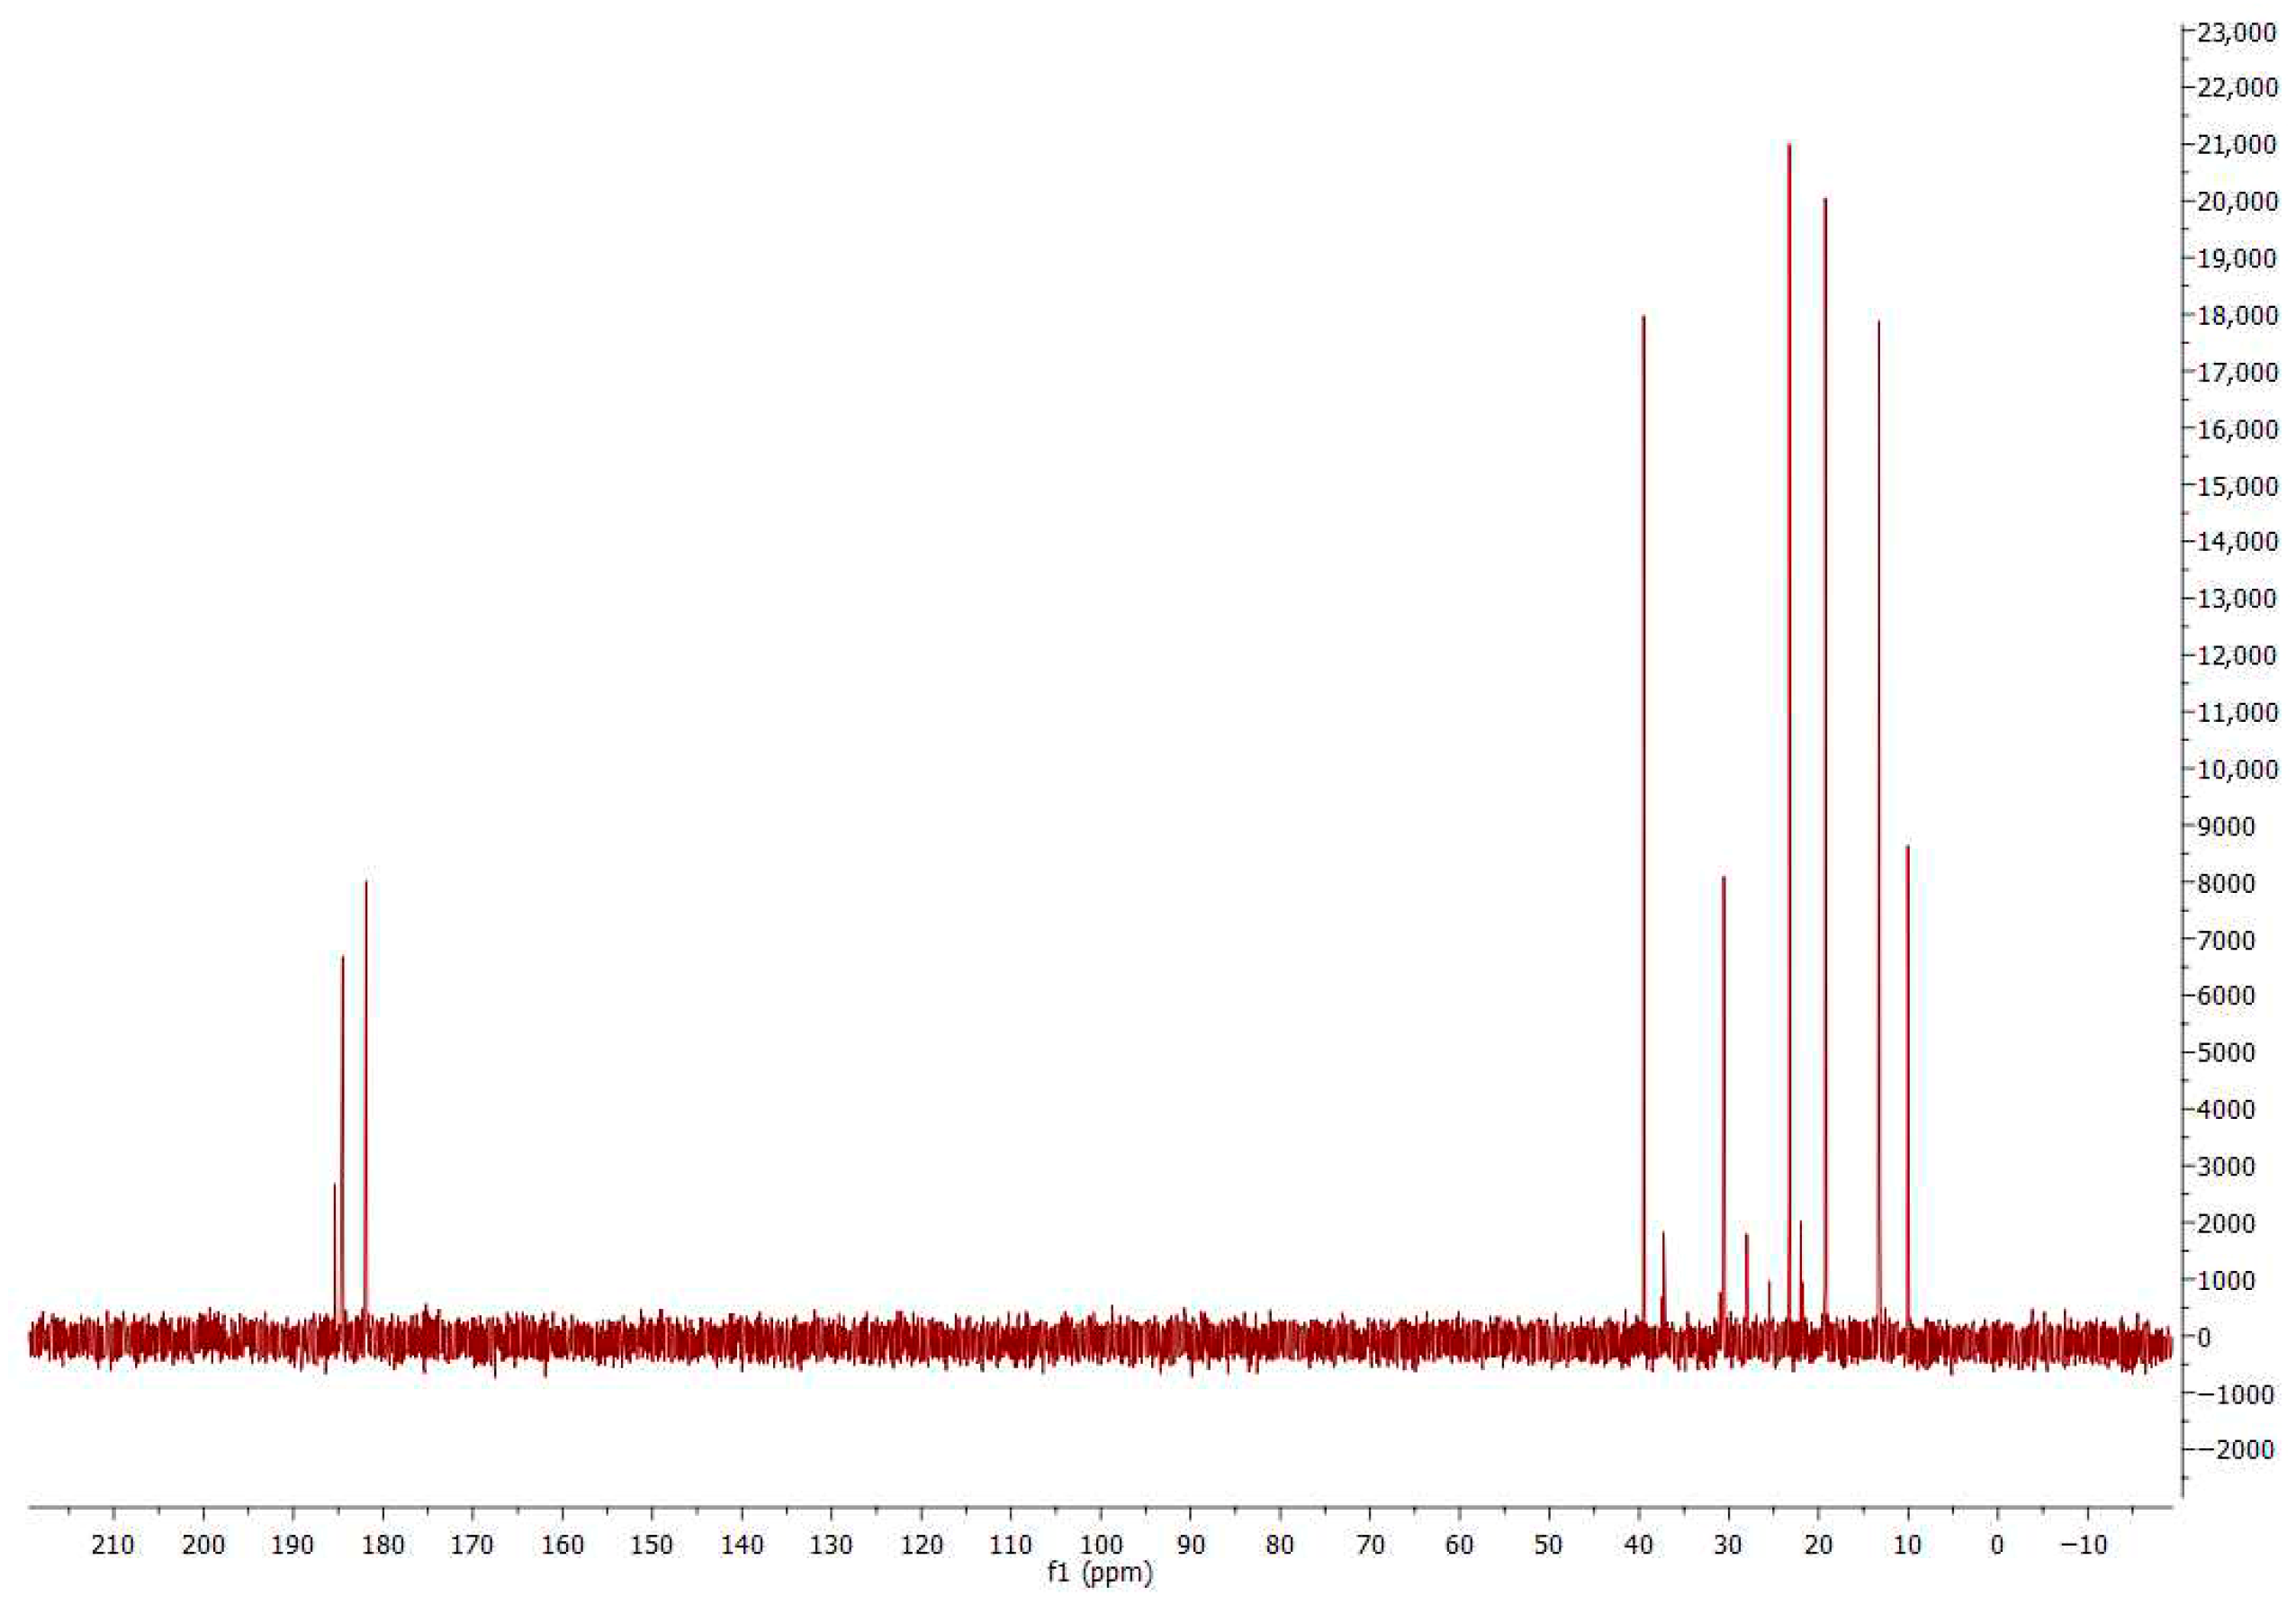
1H NMR (δ, ppm, solution) and 13C NMR (δ, ppm, solution) analysis findings are given in Figure 3 and Figure 4. The obtained spectra confirm that it is an aliphatic compound. Signals in the 0.6 to 2.4 ppm range in the 1H spectrum and in the 10–40 ppm region in the 13C spectrum prove the presence of aliphatic carbon signals, especially terminal -CH3. When examining the 1H spectrum, the sharp singlet peak observed at 1.788 ppm is attributed to the -CH3 group. The multiplets observed between 0.7–0.95 ppm and 1.40–1.50 ppm are signals from branched alkane methyl groups and, consequently, from the -CH2-CH2- groups in the butyrate structure. The multiplets observed in the 2.0–2.1 range are interpreted as a signal originating from the carbonyl group adjacent to the alkyl group [24,25]. Considering the 13C spectrum, signals between 180–190 ppm, especially 181.899 ppm, belong to the carbonyl group. Additionally, signals of similar intensity observed in the 23.259 ppm, 19.246 ppm, 39.490 ppm and 13.243 ppm indicate the presence of multiple equivalent carbons as in aliphatic groups (CH3-CH2-CH2-) of butyrate [26]. Both spectra demonstrate that they belong solely to CAB.

3.3. HPLC Analysis and Validation

The analyses were performed using UV light at a low wavelength, such as 206 nm. The choice of low wavelength is due to the absence of chromophore groups in the molecular structures of short-chain fatty acids, as well as the UV spectrophotometer absorbance values of calcium butyrate [16]. During the analysis, the chromatograms displayed three different peaks in 3.4, 4.5 and 7.4min as shown in Figure 5B. Each peak showed area values directly proportional to the concentration given.
As seen in the results obtained, CAB does not behave as a single elute in the mobile phase with an acidic aqueous environment used in the method. Considering the pKa value (~4–5), the analyte exists in equilibrium as multiple ionic forms (protonated butyric acid and butyrate anion) and calcium counterion binder/ion pairs. These coexisting species differ in terms of hydrophobicity and ion pairing interactions and therefore exhibit distinct retention on the column, yielding three reproducible peaks (3.4, 4.5, 7.4 min). The absence of these peaks in blank readings, the proportional increase in each peak area with CAB concentration in the range of 5–1000 µg/mL (R2 ≥ 0.998), the near 100% precision, and the low %RSD confirm the analytical results for CAB. While we were unable to perform additional mass-based chromatographic analyses (e.g., LC–MS) or peak purity tests at this stage, which we recognize as a limitation, the reproducible chromatographic data together with FTIR and NMR analyses provide structural insight into CAB and support our explanation of the three peaks. The obtained results are consistent with HPLC analyses of short-chain fatty acids performed at low wavelengths such as 210 nm. In such compounds, the pH of the mobile phase, ionization state, and ion pairing can affect retention on the column and lead to separate, reproducible peaks for different types of the same substance. However, when these conditions are carefully controlled, this situation does not adversely affect the accuracy of quantitative analyses. De Baere and colleagues demonstrated the applicability of non-derivatized HPLC for short-chain fatty acids and emphasized the role of mobile phase conditions on retention [16]. A similar result was also observed by Low et al. During the analysis of catecholamines, sodium heptane sulfonate (ion-pair reagent) and sodium sulfate (neutral salt) were used in different proportions in the C18 column and mobile phase. Acetic acid was used to maintain a pH of around 3, ensuring the protonation of all compounds. HPLC analyses of ephedrine showed that the peaks were split into two and three, with the first peak belonging to the ephedrine–heptane sulfonate ion pair, as seen in GC-MS analyses. Here, the formation of ion pairs, their adsorption onto the hydrophobic phase, and the dynamic ion exchange mechanism, whereby the ion-pair reagent adsorbs onto the column surface and forms a temporary ion exchange surface, are explained as the mechanisms causing the formation of three peaks. Therefore, it is assumed that peak splitting is a physical phenomenon observed in reverse-phase columns and that the separation of ion pairs by HPLC is based on a mixed mechanism [27]. Additionally, Jiang et al. demonstrated in their study on tobacco-specific N-nitrosamines that the stability of the E/Z isomers of these molecules changes depending on their protonation state and that mobile phase pH and temperature affect peak separation [28].
A calibration curve was created in the concentration range of 5 to 1000 μg/mL, and three independent determinations were performed to determine the area values corresponding to each concentration. As shown in Figure 6, the data examined for each different peak vary linearly in the concentration range studied for CAB. Additionally, the standard deviations of the slopes and intercepts were found to be low. The value R2, the determination coefficient for the regression line, is 0.998 at each peak. The slopes and intercepts of three different peaks are as follows:
Min 3.4: y = 0.2725x + 2.6656
Min 4.5: y = 0.0734x + 0.0802
Min 7.4: y = 0.1822x − 0.1874
System suitability was assessed at the beginning of each analytical batch (n = 10 injections, 200 µg/mL). The mean backpressure ranged from 119.47 ± 1.26 to 120.23 ± 1.01 bar. The relative standard deviation (RSD) of retention time was ≤0.5% for each of the three CAB peaks, while the peak area RSD remained ≤2%. Theoretical plate counts were 12,060.70 ± 166.84, 15,058.90 ± 743.55, and 19,264.70 ± 364.97 for the peaks eluting at 3.4, 4.5, and 7.4 min, respectively. Retention time variation across 10-sample sequences was within ±0.051, ±0.009, and ±0.022 min for the 3.4, 4.5, and 7.4 min peaks, respectively. The resolutions of these peaks were 9.342 ± 0.098, 7.739 ± 0.118, and 15.584 ± 0.188, while their selectivity values were 1.480 ± 0.000, 1.303 ± 0.005, and 1.620 ± 0.000, respectively.
The system suitability parameters obtained demonstrated excellent chromatographic performance and high method reproducibility. The mean backpressure values (119.47–120.23 bar) indicated stable system operation throughout the injection series, confirming the robustness of the chromatographic conditions. The low retention time RSD (≤0.5%) for all three CAB peaks reflected high precision and stability of the analytical system, while the peak area RSD (≤2%) further supported the repeatability of detector response.
Theoretical plate numbers for the peaks at 3.4, 4.5, and 7.4 min (12,060.70 ± 166.84, 15,058.90 ± 743.55, and 19,264.70 ± 364.97, respectively) were well above the minimum acceptable limit of 2000, indicating good column efficiency and sharp peak symmetry. The minimal variation in retention times across 10-sample sequences (±0.051, ±0.009, and ±0.022 min) demonstrated excellent run-to-run stability and negligible drift in chromatographic performance.
In addition, the resolution values (9.342 ± 0.098, 7.739 ± 0.118, and 15.584 ± 0.188) confirmed complete separation between adjacent peaks, exceeding the commonly accepted criterion of Rs > 2. The selectivity factors (1.480, 1.303, and 1.620) were consistent with well-resolved analyte interactions under the optimized conditions. Collectively, these results confirmed that the method fulfilled all ICH and USP requirements for system suitability, ensuring reliability for quantitative analysis of CAB and its related components.
The specificity of the analyte and the developed method was investigated in the case of the presence and absence of CAB. The results obtained from the chromatogram, as can be seen in Figure 5A, showed that the method was specific for CAB.
The precision of an analytical method is the proximity of coherence between a series of analyses procured from identical sample levels under the same circumstances. In order to evaluate method precision, in the concentration of 200 µg/mL, solutions were injected ten times into the HPLC system, and the percentage of recovery was calculated. As presented in Table 1, the means of the percentage of recovery values were 100.633 ± 0.393, 105.214 ± 1.409 and 105.434 ± 0.402 for the three different peaks obtained from the analysis. Given that the recoveries were close to 100% and the SD values of the series were less than the acceptance criteria, which is 2%, the analysis method is confirmed to be valid for precision. The average of 105% obtained in the precision study, when evaluated together with the RSD value of <2%, which is an indicator of intra-method repeatability, demonstrates that the method provides consistent and reliable results. Therefore, the average value is within acceptable bias limits, and it is understood that the precision parameter of the method is satisfied.
Repeatability is a parameter that reveals whether the method is consistent under the same conditions inter days [29]. Accordingly, 200 µg/mL concentration samples were analyzed over two consecutive days, and the results showed that all RSD values were below 2%, as listed in Table 2, indicating successful repeatability.
Intermediate precision studies are conducted to demonstrate the repeatability of the method under possible variations during laboratory work [30]. To evaluate whether the intermediate precision parameter was met, six different samples of the same concentration were prepared and analyzed by two analysts under the same conditions. The results obtained clearly demonstrated that the same concentrations can be determined even if different analysts prepared them, as can be seen in Table 3 with the required RSD value (less than 2%).
The validation of an analytical method’s accuracy is expressed as the ratio of the obtained concentration values to the true values or reference values and the percentage of recoveries [31]. The results obtained in this study, as shown in Table 4, indicate that the average recovery data for CAB in the sample ranged from 100.575% to 103.842%. The average % R.S.D. ranged from 0.245% to 1.721%, which, as previously mentioned, is within acceptable limits. Therefore, the accuracy of the method has been confirmed.
The robustness test is a parameter that demonstrates the stability of the developed method even when changes are made within certain limits. This study serves as a valuable guide for demonstrating stability in formulation studies, where such changes are often unavoidable. Thus, it establishes the reliability and applicability of the method in the pharmaceutical field [32]. The robustness of CAB in standard solutions at a concentration of 200 µg/mL was examined over a total period of 48 h. Freshly prepared solutions were stored at room temperature (24 ± 1 °C) and injected into the HPLC system at specific times for measurement. When the obtained data were compared to each other, it was observed that the solutions remained stable for 48 h. Thus, it demonstrates that CAB is stable in standard solutions at room temperature for at least 2 days and maintains its stability. The results are in Table 5.
LOD and LOQ values of the developed method were evaluated following the ICH guidelines, and the obtained results of each peak were below the investigated concentration range. The results are in Table 6.

4. Conclusions

In this study, the molecular analysis of CAB was performed using FTIR and NMR studies, and then a simple and effective HPLC method was developed and validated for its quantitative determination. The spectra of the substance confirmed the specific structure of the molecule. In the developed analytical method, the substance was observed to give peaks at three different times, and the method was validated for each area value. In the validation studies conducted according to the ICH guideline, the method was validated by demonstrating good linearity with a determination coefficient of 0.9998 for each, high accuracy, precision, adequate LOD and LOQ values, selectivity, and stability. Owing to the developed method, it has been possible to determine CAB using an aqueous mobile phase with a method that is as environmentally friendly, economical, and practical as possible in terms of analysis time. In conclusion, the developed and validated method has been confirmed as simple, cost-effective, and efficient, providing detailed information for the quantitative analysis of CAB, including drug content, in vitro release, and in vivo distribution studies, in pharmaceutical dosage forms for future studies.

Author Contributions

Conceptualization, E.Ş.Ç. and N.Ü.O.; Methodology, A.P.Y., E.Ş.Ç. and N.Ü.O.; Software, A.P.Y. and E.Ş.Ç.; Validation, A.P.Y., E.Ş.Ç. and N.Ü.O.; Formal Analysis, A.P.Y. and E.Ş.Ç.; Investigation, A.P.Y. and E.Ş.Ç.; Resources, N.Ü.O.; Data Curation, A.P.Y. and E.Ş.Ç.; Writing—Original Draft Preparation, A.P.Y.; Writing—Review & Editing, A.P.Y., E.Ş.Ç. and N.Ü.O.; Visualization, A.P.Y.; Supervision, N.Ü.O.; Project Administration, N.Ü.O.; Funding Acquisition, N.Ü.O. All authors have read and agreed to the published version of the manuscript.

Funding

This research received no external funding.

Data Availability Statement

The original contributions presented in this study are included in the article. Further inquiries can be directed to the corresponding author.

Acknowledgments

All of the authors extend their appreciation to Medera Nutrition BV for kindly supplying CAB, thereby facilitating the progress of this investigation.

Conflicts of Interest

The authors declare no conflicts of interest.

References

  1. Nadar, A.; Jain, V.; D’Sa, M. Stability-indicating RP-HPLC method development and validation for simultaneous quantification of ciprofloxacin, curcumin, and piperine in a novel topical dosage form. Microchem. J. 2025, 216, 114554. [Google Scholar] [CrossRef]
  2. Mayuri, D.; Ravindranath, S. Analytical Method Development and Validation: A review. J. Drug Deliv. Ther. 2019, 9, 563–570. [Google Scholar] [CrossRef]
  3. Grebe, S.K.G.; Singh, R.J. LC-MS/MS in the Clinical Laboratory—Where to from Here? Clin. Biochem. Rev. 2011, 32, 5–31. [Google Scholar]
  4. Gupta, M.K.; Ghuge, A.; Parab, M.; Al-Refaei, Y.; Khandare, A.; Dand, N.; Waghmare, N. A comparative review on High-Performance Liquid Chromatography (HPLC), Ultra Performance Liquid Chromatography (UPLC) & High-Performance Thin Layer Chromatography (HPTLC) with current updates. Curr. Issues Pharm. Med. Sci. 2022, 35, 224–228. [Google Scholar] [CrossRef]
  5. Song, M.; Jiao, H.; Zhao, J.; Wang, X.; Li, H.; Wang, P.; Ma, B.; Sun, S.; Lin, H. Dietary Supplementation of Calcium Propionate and Calcium Butyrate Improves Eggshell Quality of Laying Hens in the Late Phase of Production. J. Poult. Sci. 2022, 59, 64–74. [Google Scholar] [CrossRef] [PubMed]
  6. Celasco, G.; Moro, L.; Aiello, C.; Mangano, K.; Milasi, A.; Quattrocchi, C.; DI Marco, R. Calcium Butyrate: Anti-Inflammatory Effect on Experimental Colitis in Rats and Antitumor Properties. Biomedical Reports. Available online: https://www.spandidos-publications.com/br/2/4/559 (accessed on 23 July 2025).
  7. Cristofori, F.; Calabrese, F.M.; Iacobellis, I.; Santamaria, M.; Celano, G.; Ferrocino, I.; Di Sabato, E.; Pergola, R.; Dargenio, V.N.; Paulucci, L.; et al. Calcium butyrate efficacy in pediatric irritable bowel syndrome: Randomized placebo-controlled multiomics-based clinical trial. J. Pediatr. Gastroenterol. Nutr. 2025, 81, 551–561. [Google Scholar] [CrossRef] [PubMed]
  8. Vital, M.; Howe, A.C.; Tiedje, J.M. Revealing the Bacterial Butyrate Synthesis Pathways by Analyzing (Meta)genomic Data. mBio 2014, 5, e00889-14. [Google Scholar] [CrossRef]
  9. Klucz, E.; Dupont, B.; Mieszkowski, D.; Sikora, A.; Sikora, J.; Rogalla-Ładniak, U. Prebiotic Composition Comprising Calcium Butyrate and Magnesium Butyrate and Use Thereof. WO2019229721A1. 2018. Available online: https://patents.google.com/patent/WO2019229721A1/en (accessed on 2 October 2025).
  10. Engelking, L.E.; Ambrose, D.J.; Oba, M. Effects of dietary butyrate supplementation and oral nonsteroidal anti-inflammatory drug administration on serum inflammatory markers and productivity of dairy cows during the calving transition. J. Dairy Sci. 2022, 105, 4144–4155. [Google Scholar] [CrossRef] [PubMed]
  11. Banasiewicz, T.; Domagalska, D.; Borycka-Kiciak, K.; Rydzewska, G. Determination of butyric acid dosage based on clinical and experimental studies—A literature review. Gastroenterol. Rev. 2020, 15, 119–125. [Google Scholar] [CrossRef]
  12. Dobrowolska-Iwanek, J.; Lauterbach, R.; Huras, H.; Paśko, P.; Prochownik, E.; Woźniakiewicz, M.; Chrząszcz, S.; Zagrodzki, P. HPLC-DAD method for the quantitative determination of short-chain fatty acids in meconium samples. Microchem. J. 2020, 155, 104671. [Google Scholar] [CrossRef]
  13. Calvigioni, M.; Bertolini, A.; Codini, S.; Mazzantini, D.; Panattoni, A.; Massimino, M.; Celandroni, F.; Zucchi, R.; Saba, A.; Ghelardi, E. HPLC-MS-MS quantification of short-chain fatty acids actively secreted by probiotic strains. Front. Microbiol. 2023, 14, 1124144. [Google Scholar] [CrossRef] [PubMed]
  14. Lee, D.; Kerry, M.S. A simple liquid chromatography method running in dual modes for quantification of short and medium chain fatty acids. J. Chromatogr. A 2024, 1714, 464566. [Google Scholar] [CrossRef] [PubMed]
  15. Díaz-Corona, L.R.; Parra-Saavedra, K.J.; Mora-Alonzo, R.S.; Macías-Rodríguez, M.E.; Martínez-Preciado, A.H.; Guevara-Martínez, S.J.; Zamudio-Ojeda, A.; Macias-Lamas, A.M. HPLC-DAD Development and Validation Method for Short-Chain Fatty Acids Quantification from Chicken Feces by Solid-Phase Extraction. Separations 2023, 10, 308. [Google Scholar] [CrossRef]
  16. De Baere, S.; Eeckhaut, V.; Steppe, M.; De Maesschalck, C.; De Backer, P.; Van Immerseel, F.; Croubels, S. Development of a HPLC–UV method for the quantitative determination of four short-chain fatty acids and lactic acid produced by intestinal bacteria during in vitro fermentation. J. Pharm. Biomed. Anal. 2013, 80, 107–115. [Google Scholar] [CrossRef] [PubMed]
  17. ALOthman, Z.A.; ALanazi, A.G.; Ali, I. A comparative and simultaneous analysis of indoxyl sulfate and sodium butyrate in human plasma by SPE and HPLC methods for kidney patients. J. Chromatogr. B 2020, 1159, 122356. [Google Scholar] [CrossRef]
  18. Reddy, B.M.; Ashok Reddy, B.R.; Kumar, A.A.; Kodipyaka, R.; Vooturi, R. A Simple Rp-Hplc Method Development and Verification for the Quantitative Estimation of Sodium Butyrate in Tablets. Asian J. Pharm. Clin. Res. 2024, 17, 45–48. [Google Scholar] [CrossRef]
  19. Hirun, N.; Dokmaisrijan, S.; Tantishaiyakul, V. Experimental FTIR and theoretical studies of gallic acid–acetonitrile clusters. Spectrochim. Acta Part A Mol. Biomol. Spectrosc. 2012, 86, 93–100. [Google Scholar] [CrossRef]
  20. Li, Z.; Yu, R.; An, W.; Chen, Q.; Zhao, W.; Xu, E. Method for Determining Butyric Acid and Sodium Butyrate by HPLC (High Performance Liquid Chromatography). CN201310755483.1A, 31 December 2013. [Google Scholar]
  21. Step. Committee for Medicinal Products for Human Use ICH Q2(R2) Guideline on Validation of Analytical Procedures. 2023. Available online: www.ema.europa.eu/contact (accessed on 24 July 2025).
  22. Koca, N.; Rodriguez-Saona, L.; Harper, W.; Alvarez, V.B. Application of Fourier Transform Infrared Spectroscopy for Monitoring Short-Chain Free Fatty Acids in Swiss Cheese. J. Dairy Sci. 2007, 90, 3596–3603. [Google Scholar] [CrossRef]
  23. Nandiyanto, A.B.D.; Oktiani, R.; Ragadhita, R. How to Read and Interpret FTIR Spectroscope of Organic Material. Indones. J. Sci. Technol. 2019, 4, 97–118. [Google Scholar] [CrossRef]
  24. Hanganu, A.; Chira, N.-A. When detection of dairy food fraud fails: An alternative approach through proton nuclear magnetic resonance spectroscopy. J. Dairy Sci. 2021, 104, 8454–8466. [Google Scholar] [CrossRef]
  25. Gunawan, R.; Nandiyanto, A.B.D. How to Read and Interpret 1H-NMR and 13C-NMR Spectrums. Indones. J. Sci. Technol. 2021, 6, 267–298. [Google Scholar] [CrossRef]
  26. Sacchi, R.; Paduano, A.; Caporaso, N.; Picariello, G.; Romano, R.; Addeo, F. Assessment of milk fat content in fat blends by 13 C NMR spectroscopy analysis of butyrate. Food Control 2018, 91, 231–236. [Google Scholar] [CrossRef]
  27. Low, G.K.C.; Duffield, A.M.; Haddad, P.R. Peak-splitting in reversed-phase, ion-pair high-performance liquid chromatography of sympathomimetic drugs and its probable mechanism. Chromatographia 1982, 15, 289–296. [Google Scholar] [CrossRef]
  28. Jiang, J.; Li, L.; Wang, M.; Xia, J.; Wang, W.; Xie, X. Theoretical Explanation of the Peak Splitting of Tobacco-Specific N-Nitrosamines in HPLC. Bull. Korean Chem. Soc. 2012, 33, 1722–1728. [Google Scholar] [CrossRef]
  29. Sarisaltik Yaşin, D.; Arslantürk Bingül, A.; Karaküçük, A.; Teksïn, Z.Ş. Development and Validation of an HPLC Method Using an Experimental Design for Analysis of Amlodipine Besylate and Enalapril Maleate in a Fixed-dose Combination. Turk. J. Pharm. Sci. 2021, 18, 306–318. [Google Scholar] [CrossRef] [PubMed]
  30. Kumar, R.; Kumar, R.; Khursheed, R.; Awasthi, A.; Khurana, N.; Singh, S.K.; Khurana, S.; Sharma, N.; Gunjal, P.; Kaur, J.; et al. Development and validation of RP-HPLC method for estimation of fisetin in rat plasma. S. Afr. J. Bot. 2021, 140, 284–289. [Google Scholar] [CrossRef]
  31. Povetko, M.I.; Mylnikov, P.Y.; Tranova, Y.; Shchulkin, A.V.; Polupanov, A.S.; Yakusheva, E.N. Development and Validation of a Quantitative Determination Method for Sulfasalazine in Rabbit Blood Plasma and Cell Culture Medium by HPLC-MS/MS. Pharm. Chem. J. 2025, 59, 341–345. [Google Scholar] [CrossRef]
  32. Schmidt, A.H.; Stanic, M.; Molnár, I. In silico robustness testing of a compendial HPLC purity method by using of a multidimensional design space build by chromatography modeling—Case study pramipexole. J. Pharm. Biomed. Anal. 2014, 91, 97–107. [Google Scholar] [CrossRef]
Figure 1. Chemical structure of calcium butyrate.
Analytica 06 00042 g001
Figure 2. FTIR spectrum of calcium butyrate.
Analytica 06 00042 g002
Figure 3. 1H NMR Spectrum of Calcium Butyrate.
Analytica 06 00042 g003
Figure 4. 13C NMR Spectrum of Calcium Butyrate.
Analytica 06 00042 g004
Figure 5. The chromatograms of (A) a sample which does not contain calcium butyrate and (B) calcium butyrate analysis (The bases of the peaks are marked with colored lines to indicate the areas).
Analytica 06 00042 g005
Figure 6. The regression line for calcium butyrate (A) 1st peak at 3.4 min, (B) 2nd peak at 4.5 min, (C) 3rd peak at 7.4 min.
Analytica 06 00042 g006
Table 1. The percentage of recovery, coefficient of variations and SD of 200 µg/mL calcium butyrate solution for precision study.
Test Solution1st Peak Recovery (%)2nd Peak Recovery (%)3rd Peak Recovery (%)
1100.151105.013104.984
299.781107.684105.265
3100.707107.684105.828
4100.707105.681104.984
5100.522105.013105.547
6100.893103.678105.828
7101.078104.346105.547
8100.893104.346106.109
9100.707104.346105.265
10100.893104.346104.984
Average100.633105.214105.434
SD0.3931.4090.402
RSD0.3901.3390.381
Table 2. Interday Precision.
Test
Solution
1st Peak Recovery (%)2nd Peak Recovery (%)3rd Peak Recovery (%)
1st Day2nd Day1st Day2nd Day1st Day2nd Day
1100.430103.733102.996100.952100.679100.953
2103.36699.329102.996100.271100.40599.856
3101.348103.182103.677102.315100.13099.856
4100.063102.265102.996102.315100.405100.404
5102.081101.898103.677100.952100.130100.679
6102.081102.448102.996103.677100.130100.130
Average101.562102.143103.223101.747100.313100.313
SD1.1081.3960.3211.2500.2240.448
RSD1.0911.3670.3111.2280.2230.447
Table 3. The intermediate precision results of the samples.
Test Solution1st Peak Recovery (%)2nd Peak Recovery (%)3rd Peak Recovery (%)
1st Analyst2nd Analyst1st Analyst2nd Analyst1st Analyst2nd Analyst
1100.121100.893101.676103.67897.954104.422
299.595101.078100.340101.008102.172101.047
3100.522100.52299.005103.01198.798103.859
499.03999.96699.673102.34399.641103.578
599.410100.707101.676101.008100.204103.016
6100.707100.522100.340100.340100.766103.016
Average100.121100.615100.452101.89899.922103.156
SD0.9190.3841.0691.3131.4881.163
RSD0.9170.3821.0651.2881.4891.127
Table 4. Recovery of calcium butyrate samples.
Concentration (µg/mL)Test Solution1st Peak Recovery (%)2nd Peak Recovery (%)3rd Peak Recovery (%)
2001102.448101.008100.405
2102.265102.343100.679
3102.005101.008100.953
4101.263102.343100.130
5101.819103.011100.953
Mean101.960101.943100.624
SD0.4100.8010.320
RSD0.4020.7860.318
4001101.225101.238103.814
2101.503105.577102.970
3101.873101.906103.814
4101.132100.571103.111
5101.688101.572105.501
Mean101.484102.173103.842
SD0.2771.7590.900
RSD0.2731.7210.867
10001101.906100.308102.830
2101.498100.575103.674
3101.239100.442102.774
4101.350100.308102.099
5101.757101.243102.380
Mean101.550100.575102.752
SD0.2490.3480.533
RSD0.2450.3460.519
Table 5. Robustness values of 200 µg/mL samples.
Time0 min30 min60 min120 min24 h48 h
1st peak Recovery (%)99.039101.263100.707100.89399.329102.265
100.151100.522100.707100.707101.449101.078
101.008100.522100.522100.893101.228101.502
Mean100.066100.769100.645100.831100.669101.615
SD0.8060.3490.0870.0880.9520.491
RSD0.8060.3470.0870.0870.9450.483
2nd peak Recovery (%)105.681105.681107.684104.346103.677105.721
105.013108.351105.681104.346105.681105.681
104.346108.351105.013104.346104.346104.703
Mean105.013107.461106.126104.346104.568105.368
SD0.5451.2591.13500.8330.471
RSD0.5191.1711.06900.7970.447
3rd peak Recovery (%)104.422105.828105.828106.109104.141104.422
104.984105.265104.984105.265105.013104.346
105.828105.828105.547104.984105.828105.828
Mean105.078105.640105.453105.453104.994104.865
SD0.5780.2650.3510.4780.6890.681
RSD0.5500.2510.3330.4530.6560.650
Table 6. Limits of detection and quantification of calcium butyrate.
1st Peak2nd Peak3rd Peak
Limit of detection (µg/mL)1.2110.6061.816
Limit of quantification (µg/mL)3.6701.8353.676
Disclaimer/Publisher’s Note: The statements, opinions and data contained in all publications are solely those of the individual author(s) and contributor(s) and not of MDPI and/or the editor(s). MDPI and/or the editor(s) disclaim responsibility for any injury to people or property resulting from any ideas, methods, instructions or products referred to in the content.