Article

Machine Learning-Based Classification of Albanian Wines by Grape Variety, Using Phenolic Compound Dataset

1
Department of Informatics and Technology, Faculty of Engineering, Informatics and Architecture, European University of Tirana, Street Xhanfize Keko, Kompleksi Xhura, 1000 Tirana, Albania
2
Department of Food Engineering, Faculty of Engineering, Adana Alparslan Turkes Science and Technology University, Adana 01250, Türkiye
3
Department of Food Engineering, Faculty of Agriculture, Cukurova University, Adana 01250, Türkiye
4
Department of Nutrition and Dietetics, Faculty of Health Sciences, Cukurova University, Adana 01250, Türkiye
5
Department of Chemistry, Faculty of Natural Sciences, University of Tirana, 1016 Tirana, Albania
*
Author to whom correspondence should be addressed.
Analytica 2025, 6(4), 43; https://doi.org/10.3390/analytica6040043 (registering DOI)
Submission received: 15 September 2025 / Revised: 14 October 2025 / Accepted: 22 October 2025 / Published: 24 October 2025

Abstract

Wine phenolics serve as robust chemical signatures correlated to grape variety, processing, and regional identity. This study explores the potential of machine learning algorithms, combined with the phenolic profiles of Albanian wines, to classify them according to grape variety. Geographic origin analysis was conducted as a preliminary exploration. The dataset of phenolic compounds included white and red wines, spanning the 2017 to 2021 vintages. Using five supervised algorithms—Support Vector Machine (SVM), Random Forest, XGBoost, Logistic Regression, and K-Nearest Neighbors—a high classification accuracy was achieved, with SVM reaching 100% under Leave-One-Out Cross-Validation (LOOCV). To address class imbalance, the Synthetic Minority Over-sampling Technique (SMOTE) and stratified cross-validation were applied. Random Forest feature importance consistently highlighted trans-Fertaric acid and Procyanidin B3 as dominant discriminants. Parallel coordinates plots demonstrated clear varietal patterns driven by phenolic differences, while PCA and hierarchical clustering confirmed unsupervised grouping consistent with wine type and maceration level. Permutation testing (1000 iterations) confirmed the non-randomness of model performance. These findings show that a small set of phenolic markers can offer high classification accuracy, supporting chemically based wine authentication. Although the dataset is relatively small, thorough cross-validation, non-redundant modeling, and chemical interpretability provide a solid foundation for scalable methods. Future work will expand the dataset and explore sensor-based phenolic measurement to enable rapid authentication in wine.

1. Introduction

Two of the most notable traditional foods that define the Mediterranean region globally are wine and olive oil [1,2]. While the region has retained the hallmark of olive oil, the situation is different when it comes to vine and wine production. Diversity in grape varieties in Albania is connected with the ancient geographical route of Vitis vinifera L. plant from the Eastern to the Western Mediterranean, while vine cultivation and wine production are under-represented internationally for Albania [3]. Traditional cultivars such as Kallmet and Shesh coexist with Merlot, yet their chemical profiles are largely undocumented. Moreover, the absence of standardized analytical frameworks has limited the visibility of Albanian wines in international markets [2,4].
Wine quality is influenced by factors such as grape variety, terroir, viticultural practices, winemaking methods, and aging conditions [5]. Phenolic compounds in wine primarily originate from grape berries, including flavonoids and non-flavonoids, by playing a central role in defining aroma, color, bitterness, and astringency [6,7]. Additional transformations occur during aging, particularly in wooden vessels, where hydroxycinnamic acids and tannins may undergo polymerization or esterification, contributing to wine complexity and stability. Their content is influenced by diversity and vintage, and their profile is determined by grape variety [8,9]. These compounds are not static: their concentrations and structures evolve during fermentation and aging, influenced by vessel type, oxygen exposure, and microbial activity.
Authentication is increasingly important in global viticulture, driven by fraud, mislabeling, and the demand for traceability [10,11,12]. Phenolic compounds, as stable and varietal-specific metabolites, offer a reliable basis for chemical fingerprinting, by reflecting variety, grape origin, vintage, and vinification—making them ideal for multidimensional classification [13,14,15]. Stable isotope ratio analysis is widely recognized as the gold standard for geographic authentication in wine science, offering robust traceability across regions and vintages. In contrast, phenolic profiling provides a complementary approach that emphasizes varietal classification and biochemical differentiation, particularly valuable in artisanal and emerging wine regions where isotope datasets may be limited [5].
Recent advances in machine learning (ML) have enhanced wine authentication by enabling accurate classification based on chemical and spectral data. Hategan et al. (2025) [16] achieved over 98% accuracy in classifying wines by grape variety, geographical origin, and vintage using k-Nearest Neighbors (kNN) and Logistic Regression on 1H-NMR spectral data, while Sarlo et al. (2024) [17] reached 99% specificity in identifying wine country, region, and cultivar by employing Extreme Gradient Boosting (XGBoost) on multi-mineral profiles. Hybrid models combining Decision Trees, Random Forests, and XGBoost to predict wine quality and detect adulteration, demonstrating the scalability of ML approaches in food integrity systems. Classification refers to the predictive assignment of wine samples to predefined categories such as grape variety or vintage, based on chemical or spectral features. Authentication, by contrast, involves verifying the claimed identity or origin of a wine, often using independent analytical markers to detect fraud, mislabeling, or geographic inconsistency. Despite increasing interest in using phenolic fingerprints to verify wine origin and variety [18,19], few studies have systematically applied modern machine learning (ML) methods to phenolic datasets in Albania. While the dataset includes metadata on geographic origin, the primary focus of this study is varietal classification based on phenolic profiles. Geographic origin analysis was conducted as an exploratory component, and its findings are not presented as central outcomes. Future work will expand this dimension with larger, regionally stratified datasets to assess terroir-specific phenolic signatures more robustly.
This study focuses on classification using phenolic profiles and supervised machine learning, while authentication is discussed as a broader application context for future traceability frameworks. This study addresses this gap by integrating LC-DAD-ESI-MS/MS phenolic profiling with supervised ML algorithms to classify wines from different native grape varieties across multiple vintages and regions. The findings aim to establish robust chemical markers for varietal and geographic discrimination, contributing to both scientific understanding and practical authentication frameworks in emerging wine regions.

2. Materials and Methods

2.1. Dataset Description and Sample Selection

The climate and geography of the Western Balkans, including Albania, have shaped the diversity of grape cultivars in wine-producing regions [2,20]. This study used a curated dataset of phenolic compound concentrations from Albanian wines produced from four grape varieties: Kallmet, Shesh i zi, Shesh i bardhë, and Merlot (Supplementary Table S1). Machine learning models were implemented using Python 3.10.4 and scikit-learn 1.3.0. Data preprocessing and visualization were conducted with the latest library versions, such as pandas 2.0.3, matplotlib 3.10.7, and seaborn 0.12.2. The dataset of samples spanned multiple vintages and geographical regions, enabling multidimensional classification. All phenolic data were obtained using consistent LC-DAD-ESI-MS/MS protocols, including standardized sample preparation, instrument calibration, and data processing [21,22,23,24]. Summed phenolic classes such as hydroxybenzoic acids, hydroxycinnamic acids, flavonols, and resveratrols were calculated by aggregating the concentrations of individual compounds quantified via LC-DAD-ESI-MS/MS. Initially comprising 30 samples across six varieties, the dataset was reduced to 26 after excluding under-represented samples from Vlosh and Cerruje (n = 2 each), minimizing class imbalance and enhancing generalizability. These individual compounds are listed as Compound 1 through Compound 31 in the dataset, with full chemical names, class assignments, and units provided in Supplementary Table S1. Each wine sample was represented by a vector of quantified phenolic compounds obtained via LC-DAD-ESI-MS/MS in previous studies. Class labels were assigned based on grape variety, with additional metadata retained for exploratory analysis of regional and vintage effects. The dataset structure is summarized in Supplementary Table S2, including variable types, distributions, and units.
The final dataset comprised 26 wine samples representing four grape varieties (Kallmet, Shesh i zi, Shesh i bardhë, Merlot) collected from six Albanian regions: Kavajë, Mat, Mirditë, Tiranë, Lezhë, and Vlorë. Each sample was characterized by 31 quantified phenolic compounds measured via LC-DAD-ESI-MS/MS, forming a feature matrix of 26 × 31.

2.2. Data Cleaning and Preprocessing

Wine samples were evaluated solely on their numerical phenolic profiles. All phenolic variables were standardized using z-score normalization to eliminate scale bias and enhance algorithmic sensitivity. Categorical metadata (e.g., grape variety, region, vintage) were encoded using one-hot or label encoding, depending on the model requirements. Frequency distribution helped to assess the class balance and address minor imbalances through stratified sampling during cross-validation. Exploratory data analysis included Principal Component Analysis (PCA) to visualize sample clustering and detect potential outliers, as well as heatmaps and parallel coordinate plots to inspect variable correlations and distribution patterns.
Preprocessing included removal of samples with missing values or ambiguous metadata, z-score standardization of numeric features, and encoding of categorical variables using label or one-hot encoding, depending on model requirements. Stratified sampling was applied during cross-validation to address minor class imbalance and ensure representative training folds.
Standardization was performed using the formula to zero mean and unit variance with StandardScaler to ensure comparability across features, which especially benefits distance-sensitive algorithms like k-nearest neighbors (KNN) and support vector machines (SVM). Standardization of phenolic variables was applied using the z-score normalization formula:
z _ i = ( x _ i μ _ j ) / σ _ j
where x_i represents the value of a phenolic compound j, sample I, μ_j, the mean of the compound j across all samples, σ_j standard deviation, and z_i resulting in a standardized score. LabelEncoder was used to convert wine type labels into numeric classes. Figure 1 shows the final class distribution.
Preprocessing steps were tailored to each algorithm: z-score standardization was applied for distance-based models such as SVM and k-Nearest Neighbors to ensure scale comparability, while tree-based models (Random Forest, Decision Tree, XGBoost) used raw feature values to preserve interpretability and avoid distortion of split criteria. Categorical variables were encoded using label encoding for tree-based models and one-hot encoding for algorithms sensitive to ordinal relationships. All preprocessing steps were implemented using the scikit-learn library [22,23,24].

2.3. Model Selection and Training

All 31 quantified phenolic compounds were used as input features for supervised classification. These included representatives from major phenolic families such as hydroxybenzoic acids, hydroxycinnamic acids, flavonols, flavan-3-ols, and resveratrols. Five supervised machine learning algorithms were implemented: Support Vector Machine (SVM), Random Forest (RF), k-Nearest Neighbors (kNN), Decision Tree (DT), and Extreme Gradient Boosting (XGBoost). These models were selected based on their proven performance in similar food authentication studies and their ability to handle multivariate, non-linear datasets. All classification models were trained on the full set of 31 individual phenolic compounds rather than aggregated class-level features to preserve biochemical resolution and maximize discriminatory power.
Meanwhile, summed phenolic classes were used for exploratory visualization and benchmarking, but not as input features for supervised learning. All supervised classification models were trained to predict grape variety based on phenolic compound profiles. Geographic origin was not used as a target variable, though regional metadata was retained for exploratory analysis and traceability assessment.
Hyperparameter tuning was conducted using grid search and cross-validation strategies tailored to each algorithm. For instance, the number of trees and maximum depth were optimized for RF and DT, while kernel type and regularization parameters were adjusted for SVM. The training process was performed on the standardized dataset, with class labels corresponding to grape variety. All models were implemented using Python-based libraries (e.g., scikit-learn, XGBoost), ensuring reproducibility and scalability.
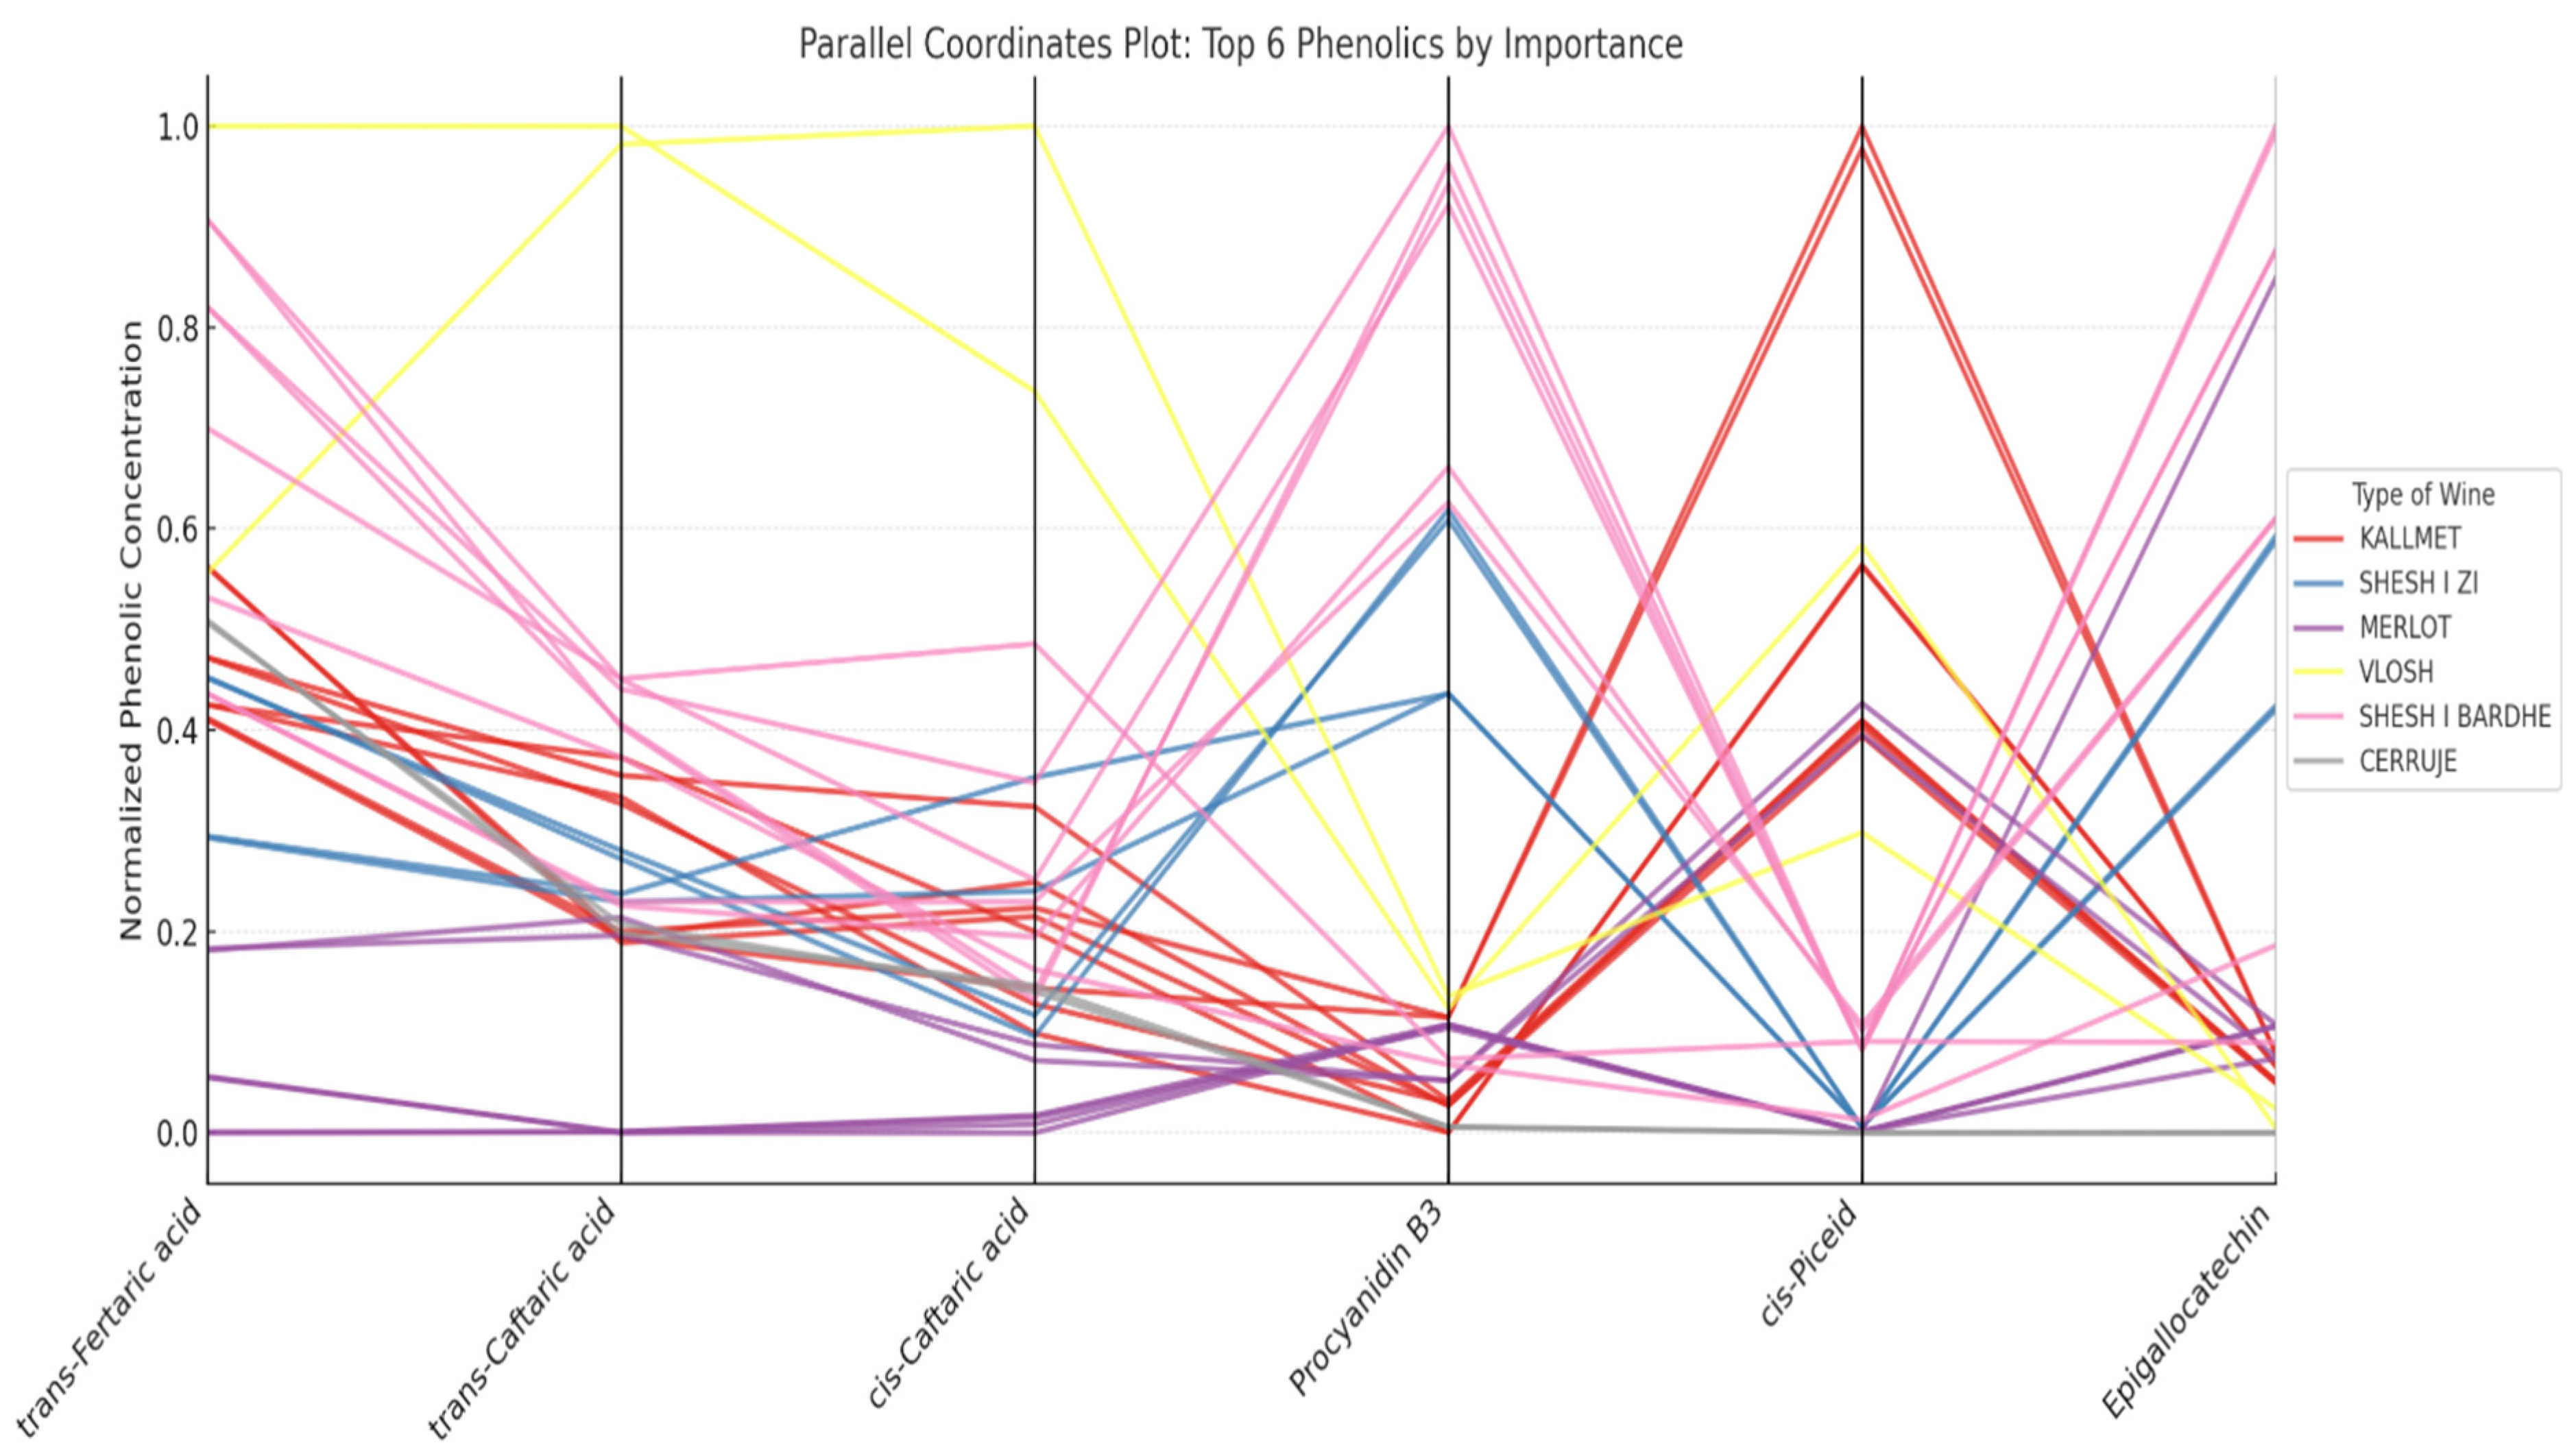
Given the small dataset, Leave-One-Out Cross-Validation (LOOCV) was applied for robust evaluation, achieving up to 100% accuracy with statistically significant permutation test results (p = 0.001). Following training, Random Forest-based feature importance revealed key phenolics such as trans-Fertaric acid and Procyanidin B3 as dominant discriminators. These top features were then visualized via a parallel coordinates plot, offering both intuitive and chemically grounded interpretation of classification behavior.
To address class imbalance, we implemented the Synthetic Minority Over-sampling Technique (SMOTE) prior to model training. Stratified cross-validation was used to ensure balanced representation across folds. While SVM achieved 100% accuracy under LOOCV, this result should be interpreted cautiously due to the small dataset and class imbalance. All models were trained using standardized phenolic data and evaluated using robust validation strategies.
This methodology reflects a highly interpretable and computationally efficient approach for wine authentication, aligning with recent literature [24,25]. It demonstrates the analytical potential of phenolic data in regional varietal classification but also offers a scalable methodological blueprint for future studies across other emerging terroirs.

2.4. Validation Strategy and Performance Metrics

LOOCV provided unbiased performance estimates, ideal for datasets with limited sample sizes. Each iteration held out one sample for testing while the model was trained on the remaining data. Classification metrics, including accuracy, precision, recall, and F1-score were computed per class to evaluate model behavior across imbalanced categories. These indicators were calculated for each class and averaged to assess overall effectiveness. Permutation testing was conducted to validate the statistical significance of classification results, comparing model accuracy against randomized label distributions.
To mitigate overfitting risks associated with the small sample size, we applied Leave-One-Out Cross-Validation (LOOCV) and conducted permutation testing (1000 iterations) to assess the statistical significance of model performance.

2.5. Feature Importance and Interpretation

Feature importance was extracted from tree-based models (Random Forest, XGBoost, and DT), which rank variables based on their contribution to decision boundaries. Trans-Fertaric acid, caffeic acid, and quercetin derivatives consistently emerged as key discriminators across models. Their relevance aligns with known varietal and regional phenolic signatures, suggesting that machine learning not only achieves high classification accuracy but also reflects underlying biochemical differentiation. For example, elevated levels of trans-Fertaric acid in Shesh i zi samples may indicate both varietal traits and vinification practices specific to central Albanian terroirs. These findings support the use of phenolic fingerprints as robust markers for wine authentication and reinforce the interpretability of ML models in Analytical Food Chemistry.

3. Results and Discussions

3.1. Overview of Dataset and Analytical Scope

This study evaluated the classification potential of Albanian wines based on phenolic compound data, using a curated dataset that includes four grape varieties: Kallmet, Shesh i zi, Shesh i bardhë, and Merlot [2,4,21]. The initial dataset included six grape varieties, but two (Vlosh and Cerruje) were excluded due to low sample counts, resulting in a final set of 26 samples. These wines were sourced from six regions: Kavajë, Mat, Mirditë, Tiranë, Lezhë, and Vlorë. The varietal breakdown includes three red varieties (Kallmet, Merlot, Shesh i zi) and one white (Shesh i bardhë). Instead of conducting new chemical profiling, the study focused on analyzing existing LC-DAD-ESI-MS/MS data, which had been previously used in Balkan wine characterization.
The analytical workflow integrated unsupervised and supervised machine learning methods, aiming to (i) explore phenolic variability across wine types, (ii) assess the discriminative power of selected algorithms, and (iii) identify key compounds contributing to varietal classification. This dual approach—combining chemical interpretation with algorithmic modeling—reflects recent trends in food authentication, where phenolic fingerprints and ML algorithms have shown high accuracy in varietal and regional discrimination. Albania’s under-represented viticultural landscape—with its indigenous cultivars and distinct terroirs—makes it a compelling case for data-driven wine authentication.
Although the classification results are promising, we acknowledge the lack of external validation due to the limited availability of comparable Albanian wine datasets. These findings should be considered preliminary, and future work will focus on expanding the dataset and incorporating independent test sets to strengthen generalizability.

3.2. Exploratory Data Analysis

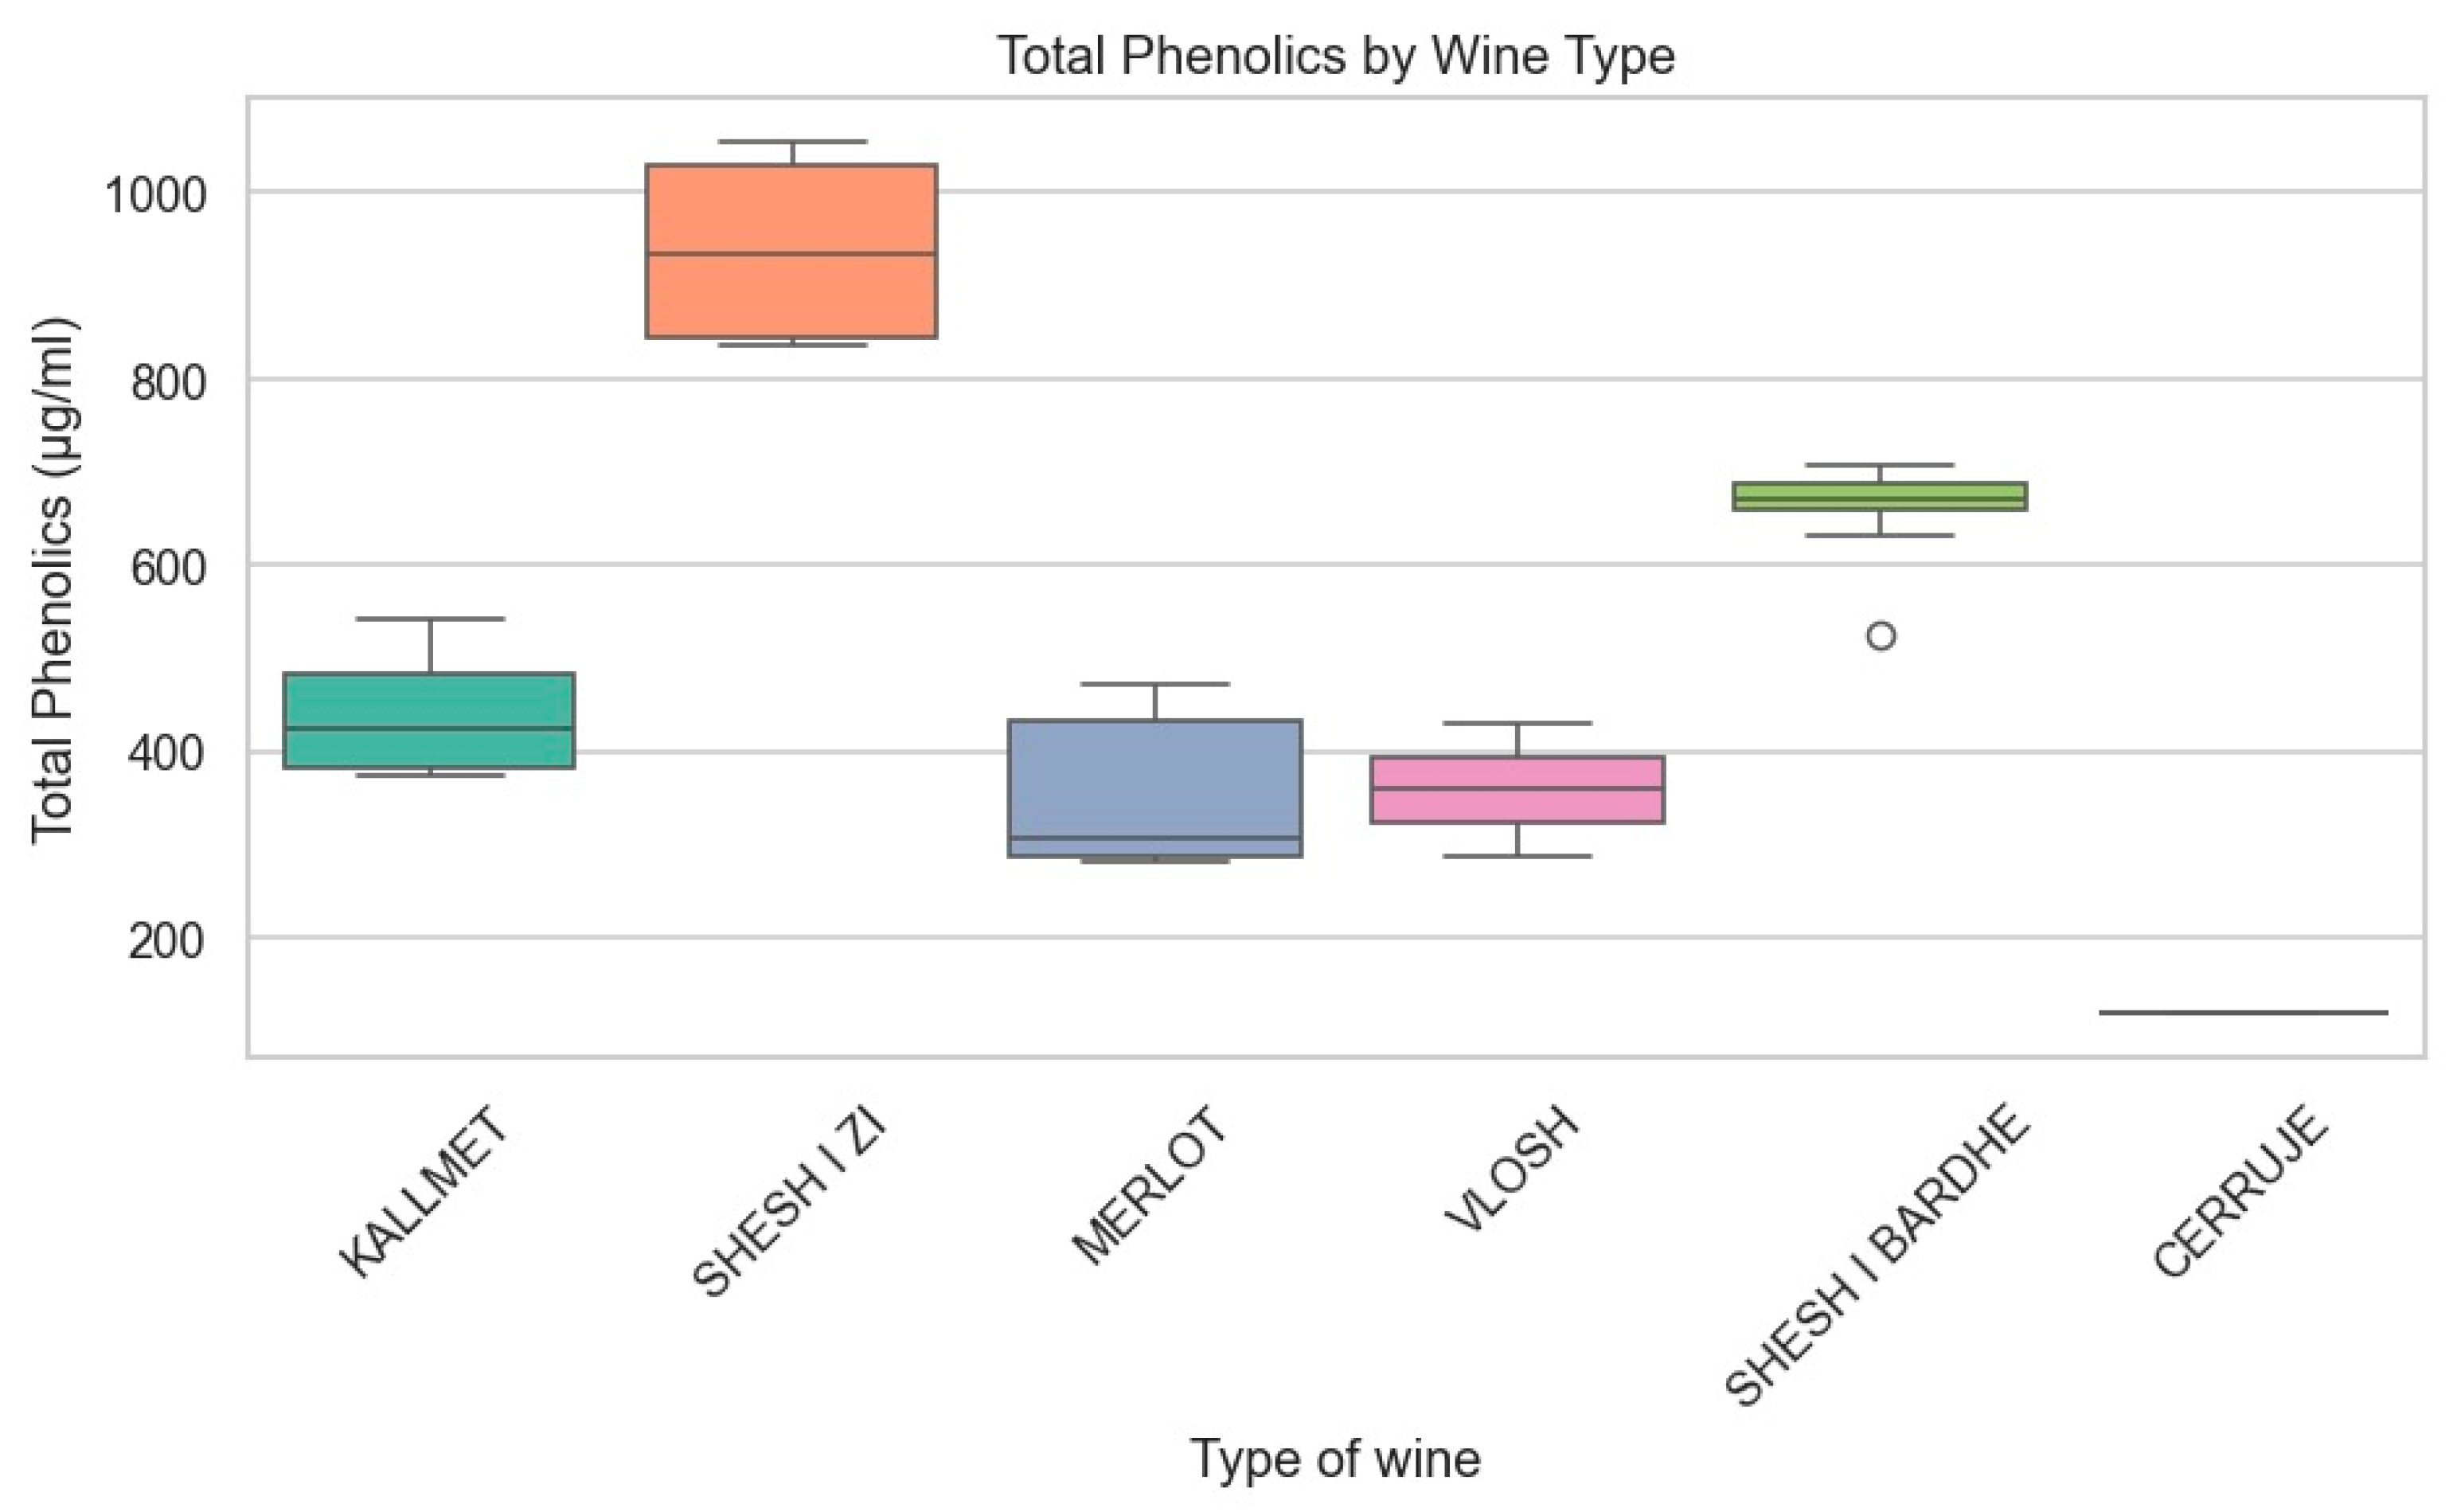
Initial boxplots revealed distinct concentration ranges for several compound families, including hydroxycinnamic acids, flavonols, and resveratrols. Shesh i zi and Merlot exhibited higher median levels of total phenolics, while Shesh i bardhë showed a lower overall intensity. These patterns suggest varietal differentiation rooted in grape biochemistry and vinification practices.
These results demonstrate the feasibility of using phenolic profiles combined with machine learning to distinguish wines according to grape varieties accurately. The entire research workflow implemented in this study, starting with a curated phenolic dataset originally comprising 30 Albanian wines and 31 quantified compounds (Supplement Tables S1 and S2), is shown in Figure 2. The classification task centered on predicting grape variety, with initial unsupervised analyses (PCA, heatmaps, etc.) helping to verify potential separability among wine types. To address class imbalance and ensure adequate representation, only four cultivars (Kallmet, Shesh i zi, Shesh i bardhë, Merlot) were included, resulting in 26 samples for the supervised learning pipeline.
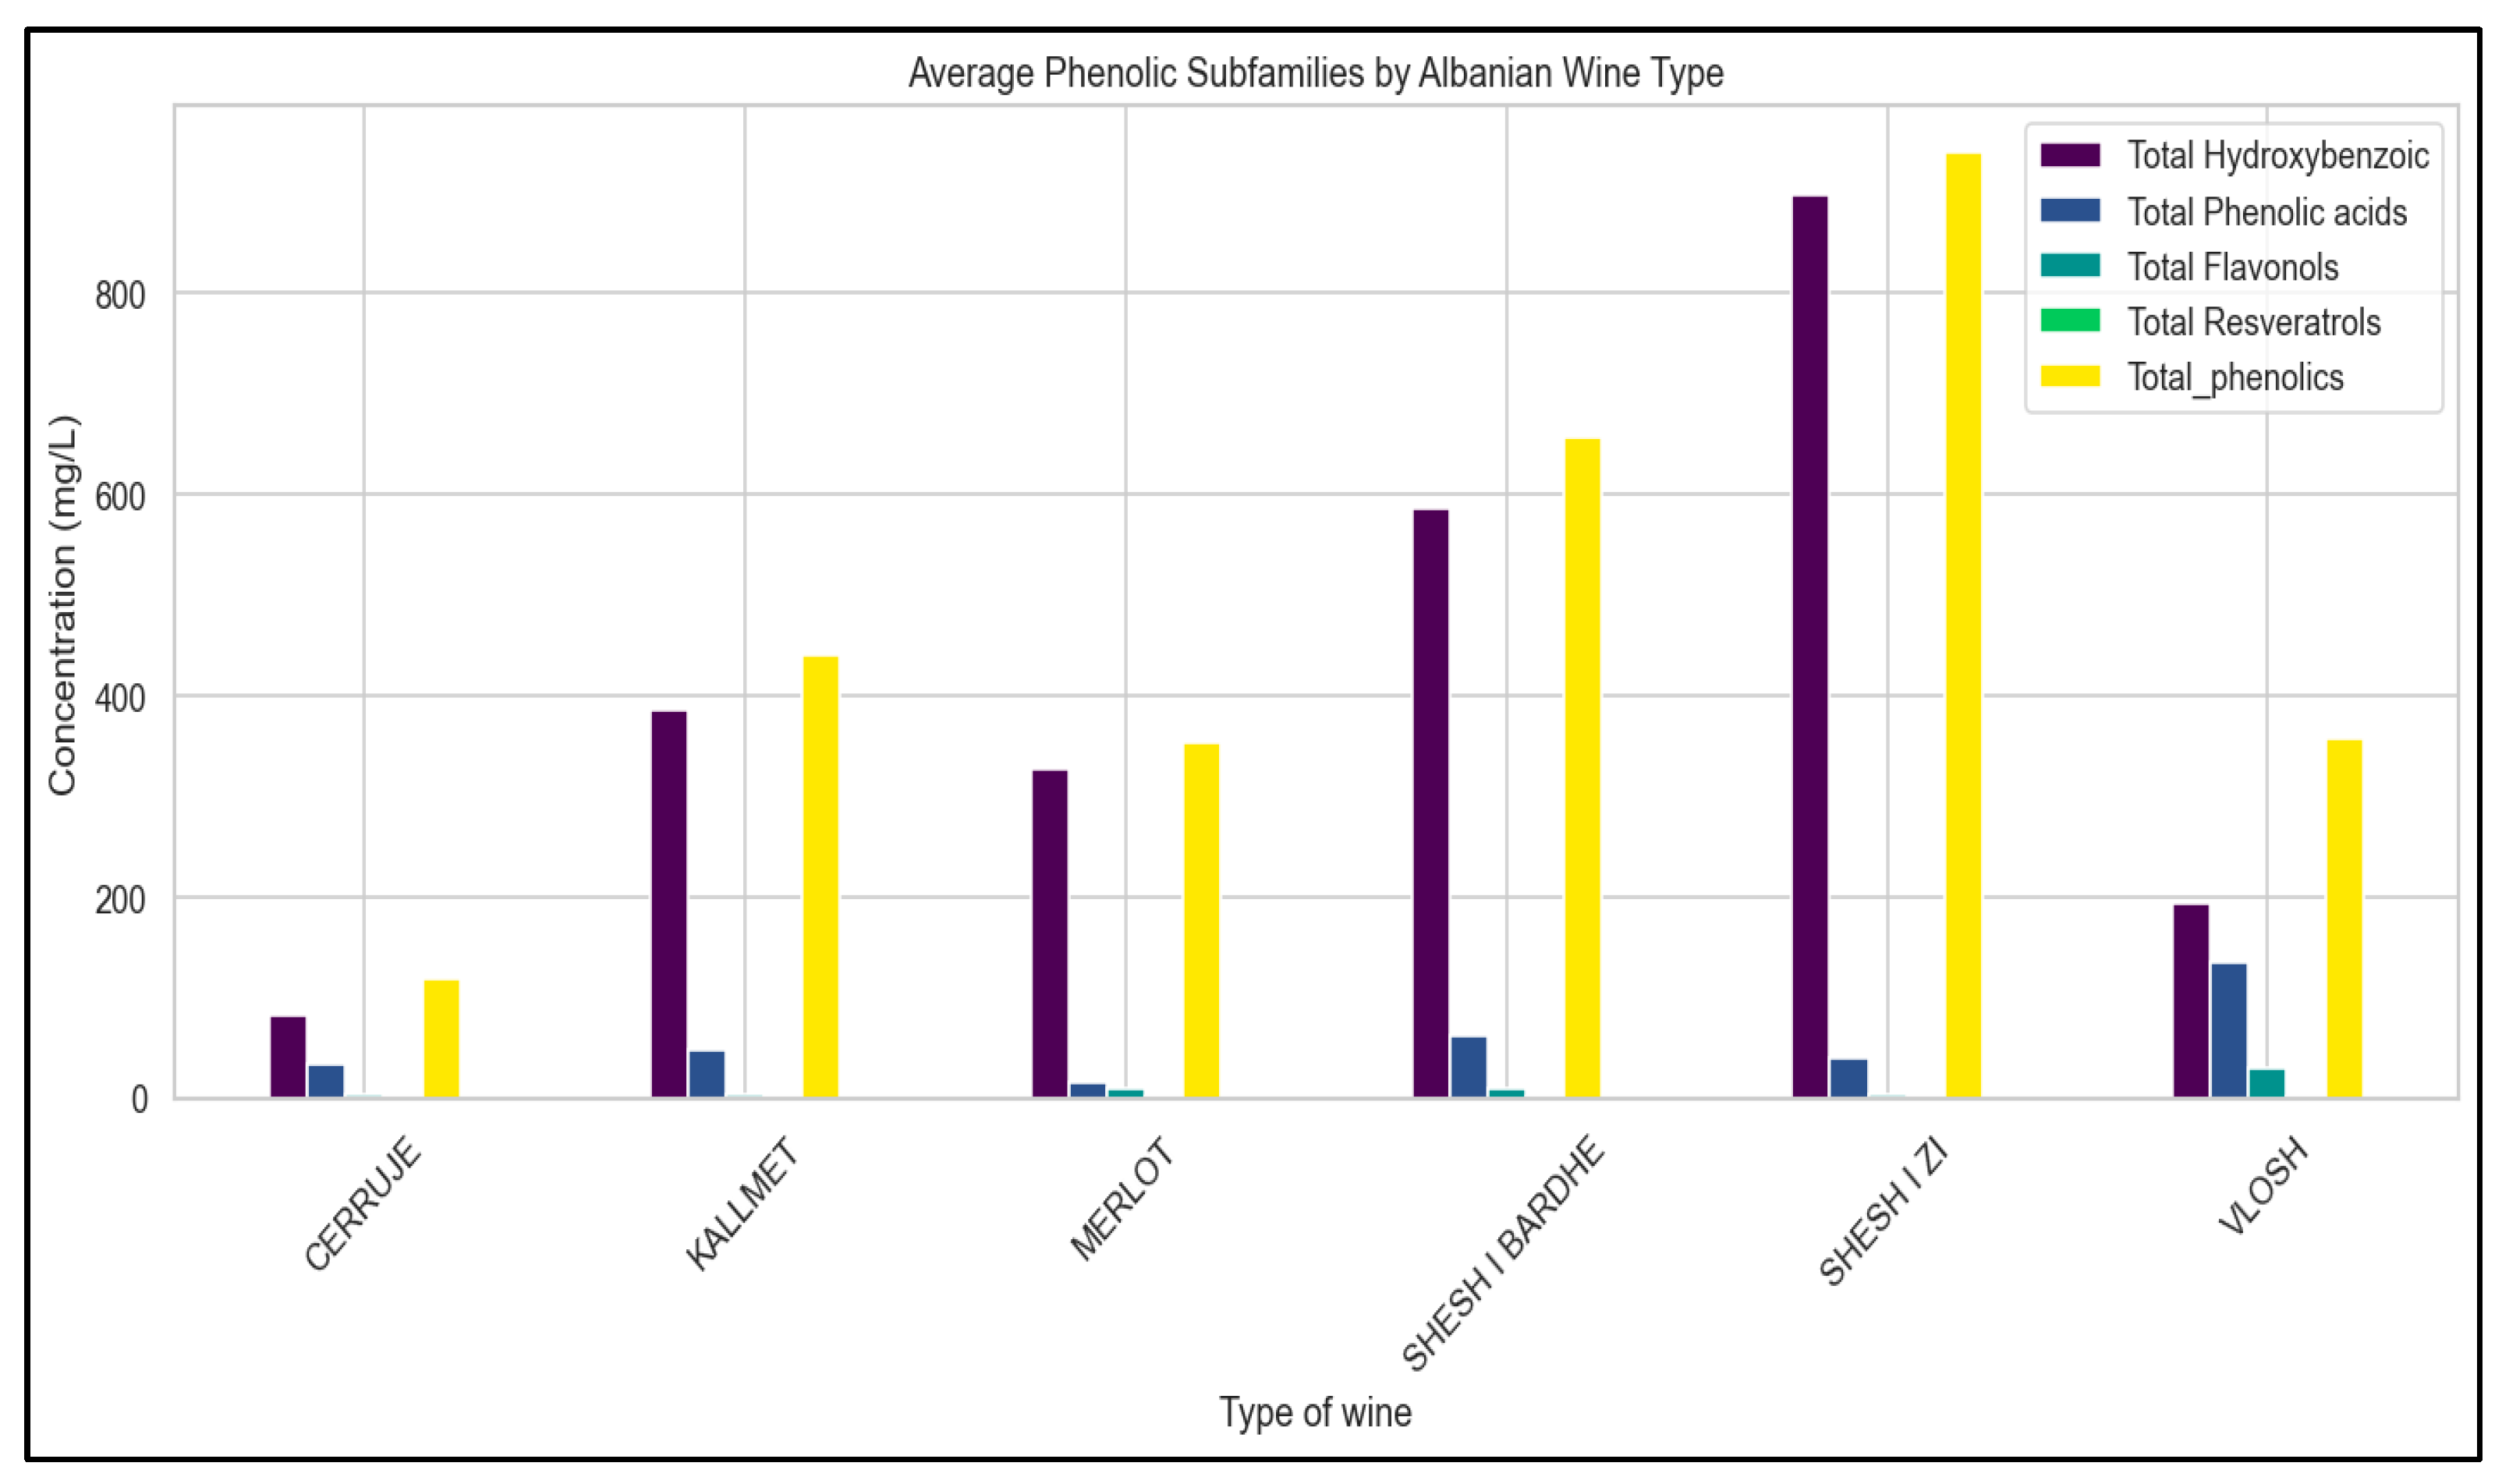
Albanian wines analyzed in this study show significant phenolic diversity even within a small dataset, highlighting both varietal differences and potential for chemical authentication. As shown in Figure 2, Kallmet and Shesh i zi red wines consistently have higher median total phenolics (>400 µg/mL and >900 µg/mL, respectively). In contrast, Cerruje white wine remains the lowest (<200 µg/mL). These differences support established findings that red grape varieties, due to prolonged skin contact, accumulate substantially more phenolic compounds than lighter or white wines [5]. Looking at subfamily-level patterns in Figure 3, Shezh i zi and Shesh i bardhë wines show higher levels of hydroxybenzoic acids, flavonols, resveratrols, and total phenolics, suggesting greater antioxidant capacity. This finding aligns with broader research indicating that varietal factors influence stilbene biosynthesis, with native red cultivars often producing higher levels under specific viticultural conditions [26].

3.3. Benchmarking with International Wines

All phenolic concentrations in this study were measured via LC-DAD-ESI-MS/MS and expressed in micrograms per milliliter (μg/mL). For comparative purposes, total phenolic content was converted to gallic acid equivalents (GAE/L) using standard equivalency factors, enabling alignment with published international datasets. Although the regional Plavac Mali (~5000 mg GAE/L) [27] and traditional international red wines like Bordeaux Merlot (~1500 mg GAE/L) [28] significantly surpass the values seen in Albanian varieties (~440 mg GAE/L for Kallmet, ~939 mg GAE/L for Shesh i zi), the moderate phenolic content of Albanian wines still keeps them within a reasonable and authentic range (Figure 3; Supplement Table S1). This comparison highlights Albania’s potential to utilize native grape varieties and enhance vinification techniques to achieve higher global phenolic levels—similar to approaches in other emerging wine regions [29]. Notably, these findings show that even a small panel of phenolic compounds (including subfamilies and total amounts) has a strong ability to distinguish between different varieties and verify authenticity. The phenolic variation presented here supports the use of targeted phenolic profiling combined with machine learning algorithms as scalable tools for traceability and typicity mapping, aligning with current trends that promote integrating analytical and chemometric methods for wine authentication [11].
To assess the statistical significance of phenolic differences between Albanian and international wines, we performed Mann–Whitney U tests on total phenolic content and key subfamilies. Results indicated significant differences (p < 0.05) in total phenolics between Shesh i zi and international Merlot, supporting varietal and regional differentiation. Detailed test statistics and p-values are provided in Supplementary Table S3.
To statistically validate phenolic differences among Albanian grape varieties, Mann–Whitney U tests were performed on key phenolic subclasses. Shesh i zi exhibited significantly higher concentrations of hydroxybenzoic acids, flavanols, phenolic acids, flavonols, and resveratrols compared to Merlot, Kallmet, and Shesh i bardhë (p < 0.01 for all comparisons). Similarly, Shesh i bardhë differed significantly from Cerruje across all subclasses (p < 0.05), supporting varietal separation even among white wines. Aggregated comparisons between red and white wines confirmed highly significant differences (p < 0.001), consistent with known vinification effects. These findings reinforce the biochemical distinctiveness of Albanian cultivars and support the use of phenolic profiling for varietal discrimination and traceability. Complete test statistics are provided in Table 1 and Supplementary Table S3.
Figure 1 and Table 2 provide a comparative overview of total phenolic concentrations (mg GAE/L) in selected Albanian and distinguished international wines. Shesh i zi (939 mg GAE/L) exhibits the highest phenolic content, typical of full-bodied red varieties with extended skin contact. Shesh i bardhë (656 mg GAE/L) exhibited relatively high levels for its category, suggesting potential oxidative resilience. Vlosh (358 mg GAE/L), a local red cultivar, and Cerruje (119 mg GAE/L) display moderate to low phenolic levels, associated with the characteristic thin skin of the grape berries.
To contextualize Albanian wines within a broader analytical framework, phenolic profiles were compared with published datasets from international wine regions. Albanian samples demonstrated comparable levels of trans-Fertaric acid and caffeic acid, but lower concentrations of resveratrol and certain flavonols. These differences may reflect both varietal genetics and regional winemaking traditions, underscoring the uniqueness of the Albanian phenolic signature. Albanian Merlot (353 mg GAE/L) was well below international Merlot ranges (860–1656 mg GAE/L) [30], indicating possible terroir- or technique-related limitations. Meanwhile, Plavac Mali, a Croatian red wine, reached nearly 5000 mg GAE/L, likely due to thick-skinned berries and extended maceration [27]. Benchmark varieties such as Cabernet Sauvignon ranged from 1129 to 2710 mg GAE/L [30]. The global red wine span (305–3210 mg GAE/L) contextualizes Albanian wines in the lower-middle spectrum, supporting their potential as accessible, balanced wines with moderate antioxidant content [31].

3.4. Phenolic Fingerprints and Classification Potential

Even with a limited panel of compounds, varietal classification was achieved with high accuracy. Figure 1 illustrates clear phenolic separation among varieties. Shesh i zi stood out for its intensity, while Cerruje and Vlosh showed lower levels, consistent with thin-skinned grape traits. These results support phenolic profiling as a reliable tool for wine authentication and traceability.

3.5. Correlation Analysis

Pearson correlation matrices were computed to examine relationships among phenolic compounds. Strong positive correlations were observed within compound families (e.g., between quercetin and kaempferol derivatives), while negative correlations emerged between specific hydroxybenzoic acids and flavan-3-ols. These associations provide insight into biosynthetic pathways and potential co-expression patterns, which may inform future studies on grape metabolism and wine typicity (Table 2).

3.6. Unsupervised Learning for Wine Typing

3.6.1. Principal Component Analysis (PCA)

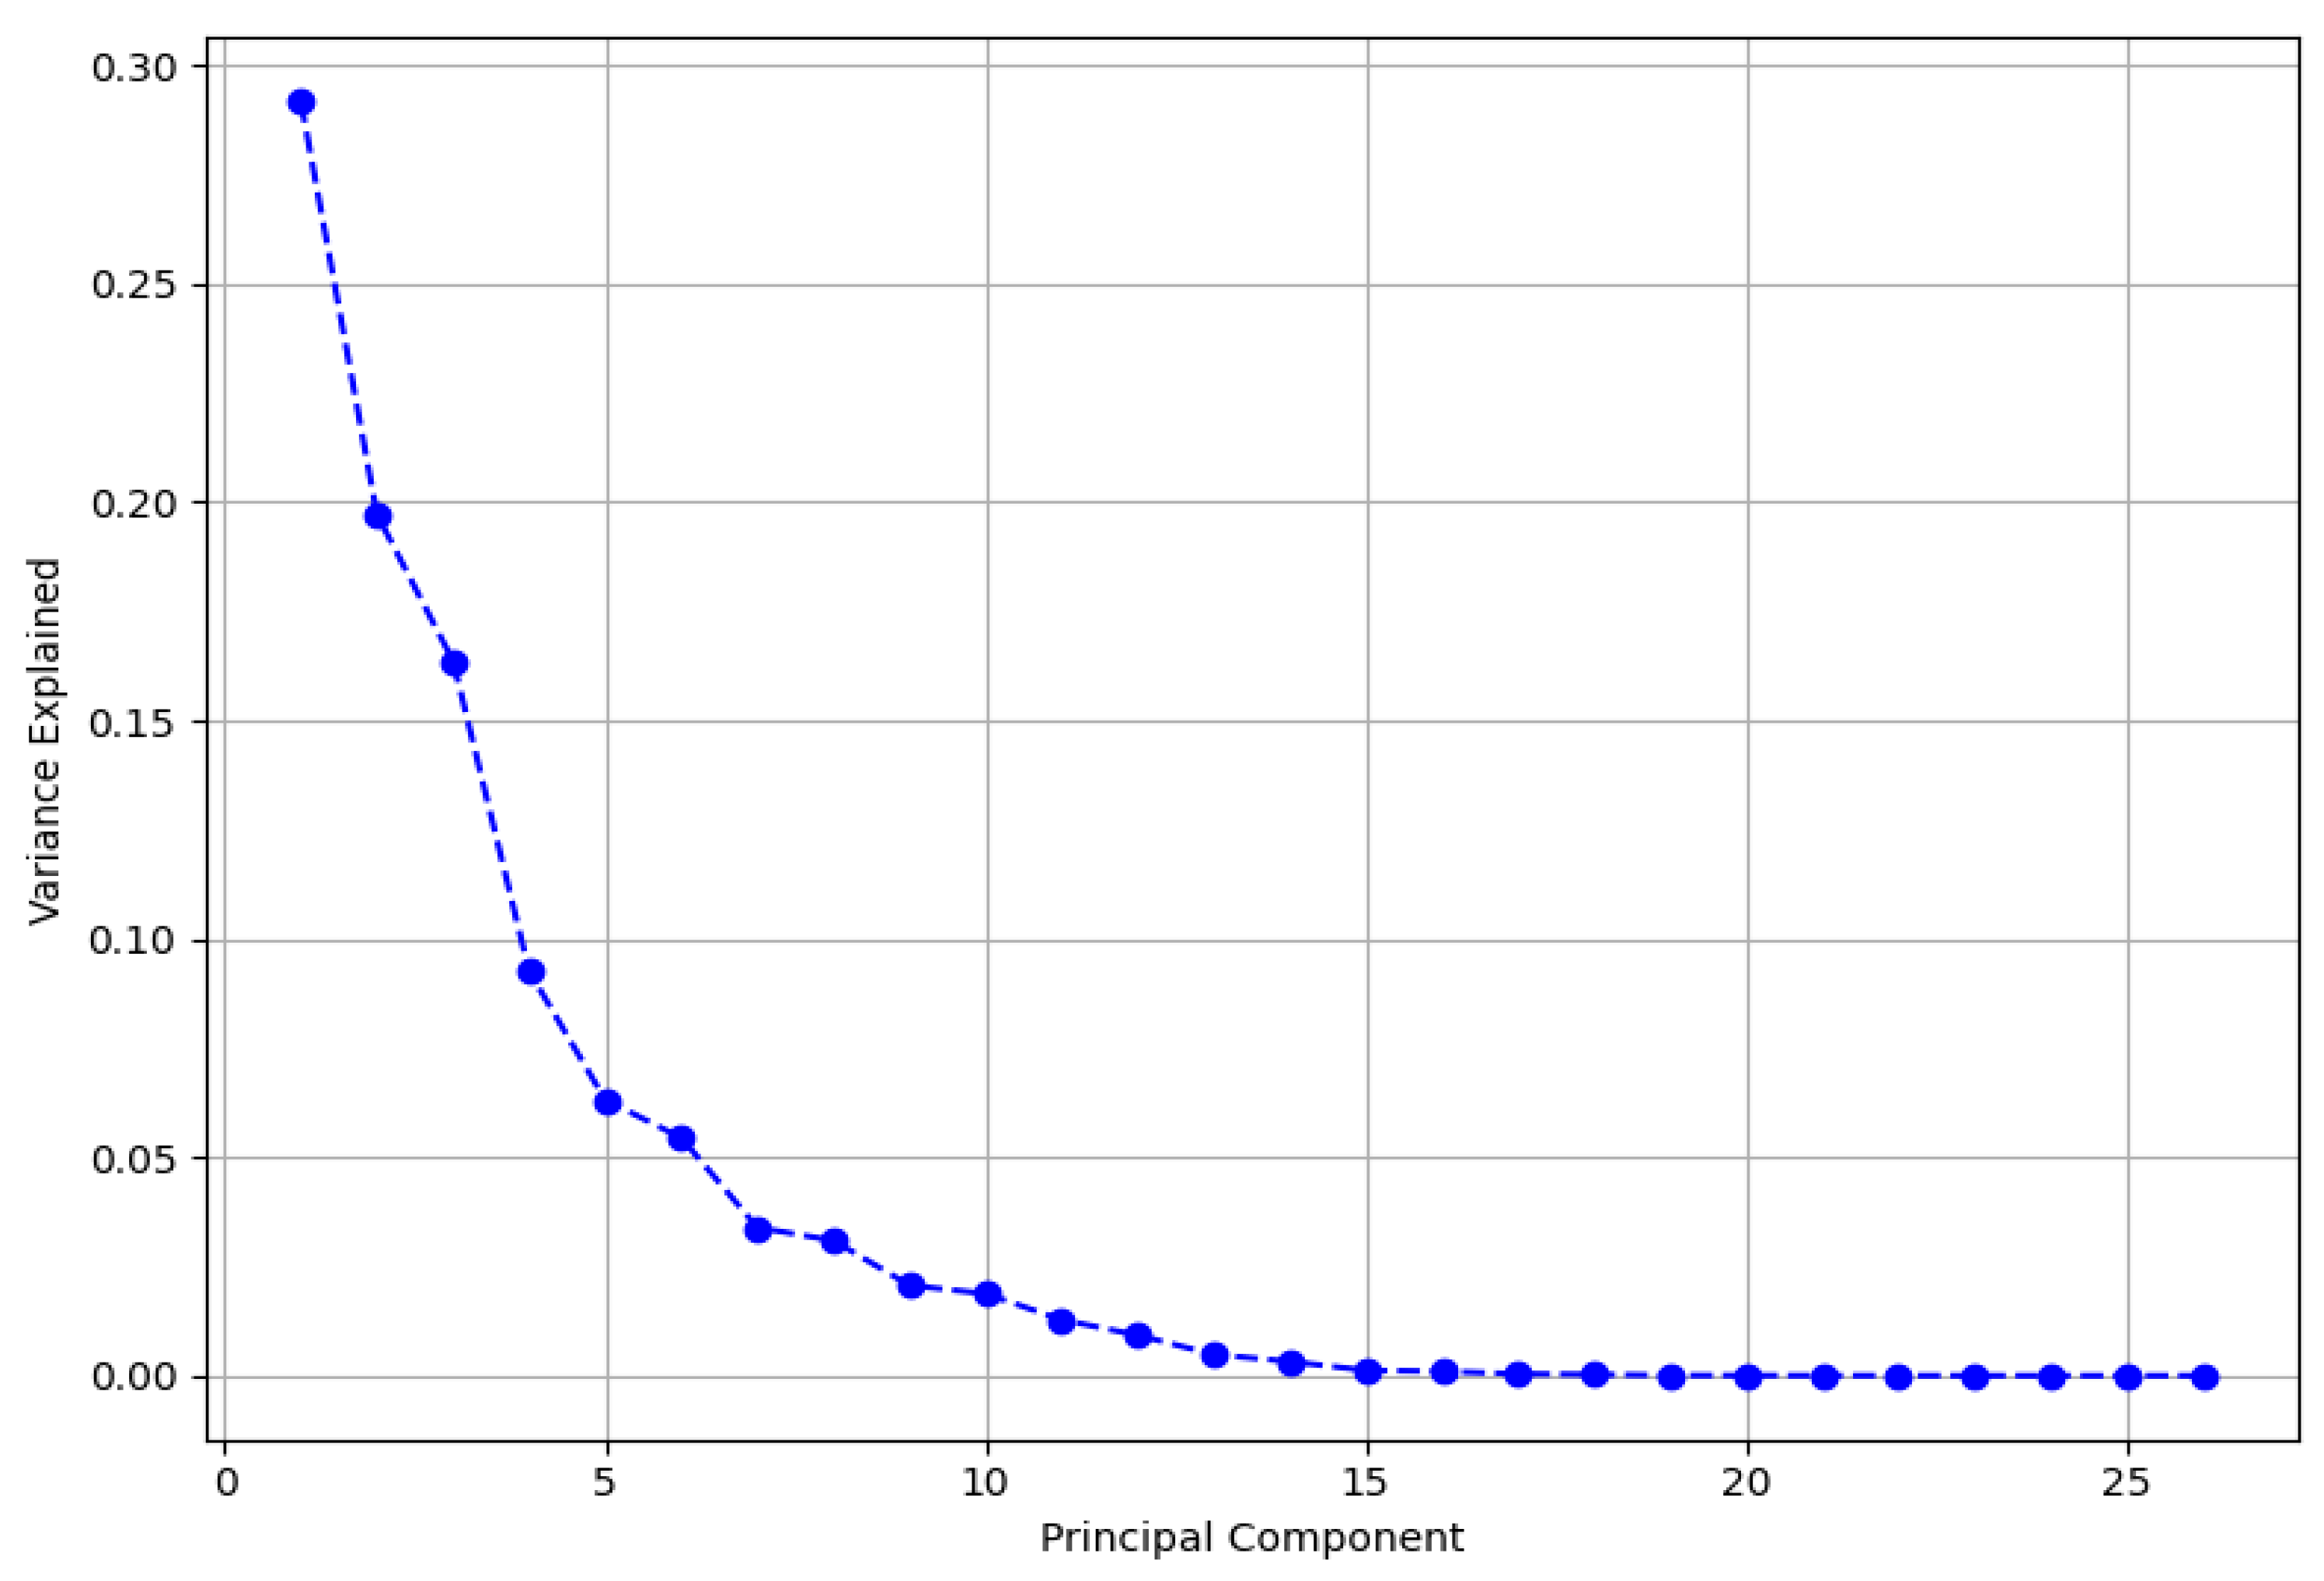
Principal Component Analysis (PCA) was applied to reduce dimensionality and visualize phenolic variation across wine samples. The first two principal components explained a substantial portion of the variance, with PC1 (28.5%) and PC2 (19.7%) collectively accounting for 48.2% of the total variance, offering a meaningful low-dimensional view (Figure 4). While PCA revealed distinct clustering patterns among grape varieties, these results reflect statistical separation in multivariate space rather than causal relationships.
As an unsupervised, descriptive technique, non-mechanical or varietal causality, PCA can be inferred from component loadings or sample positioning alone. The PCA score plot revealed distinct clustering among the four main wine types. Shesh i zi and Merlot grouped tightly, suggesting phenolic uniformity driven by consistent varietal and microclimatic factors (Figure 5). Shesh i bardhë showed broader dispersion along PC2, indicating vintage or regional variability. Kallmet samples partially overlapped with Shesh i bardhë, possibly reflecting shared terroir traits.
These unsupervised clusters mirror patterns reported in other chemometric studies, such as Sicilian red wines [32] and Romanian PDO wines [33]. Overall, PCA confirms intrinsic phenolic differences among Albanian cultivars, reinforcing the potential of phenolic profiling for varietal authentication and traceability.

3.6.2. Phenolic Heatmap and Hierarchical Clustering

Heatmap of standardized phenolic concentrations was generated to explore compound-level variation across samples. Hierarchical clustering grouped wines based on phenolic similarity, with red varieties forming tighter clusters than whites. Compound families such as flavonols and hydroxycinnamic acids contributed most to sample separation, as indicated by dendrogram branch lengths and color gradients.
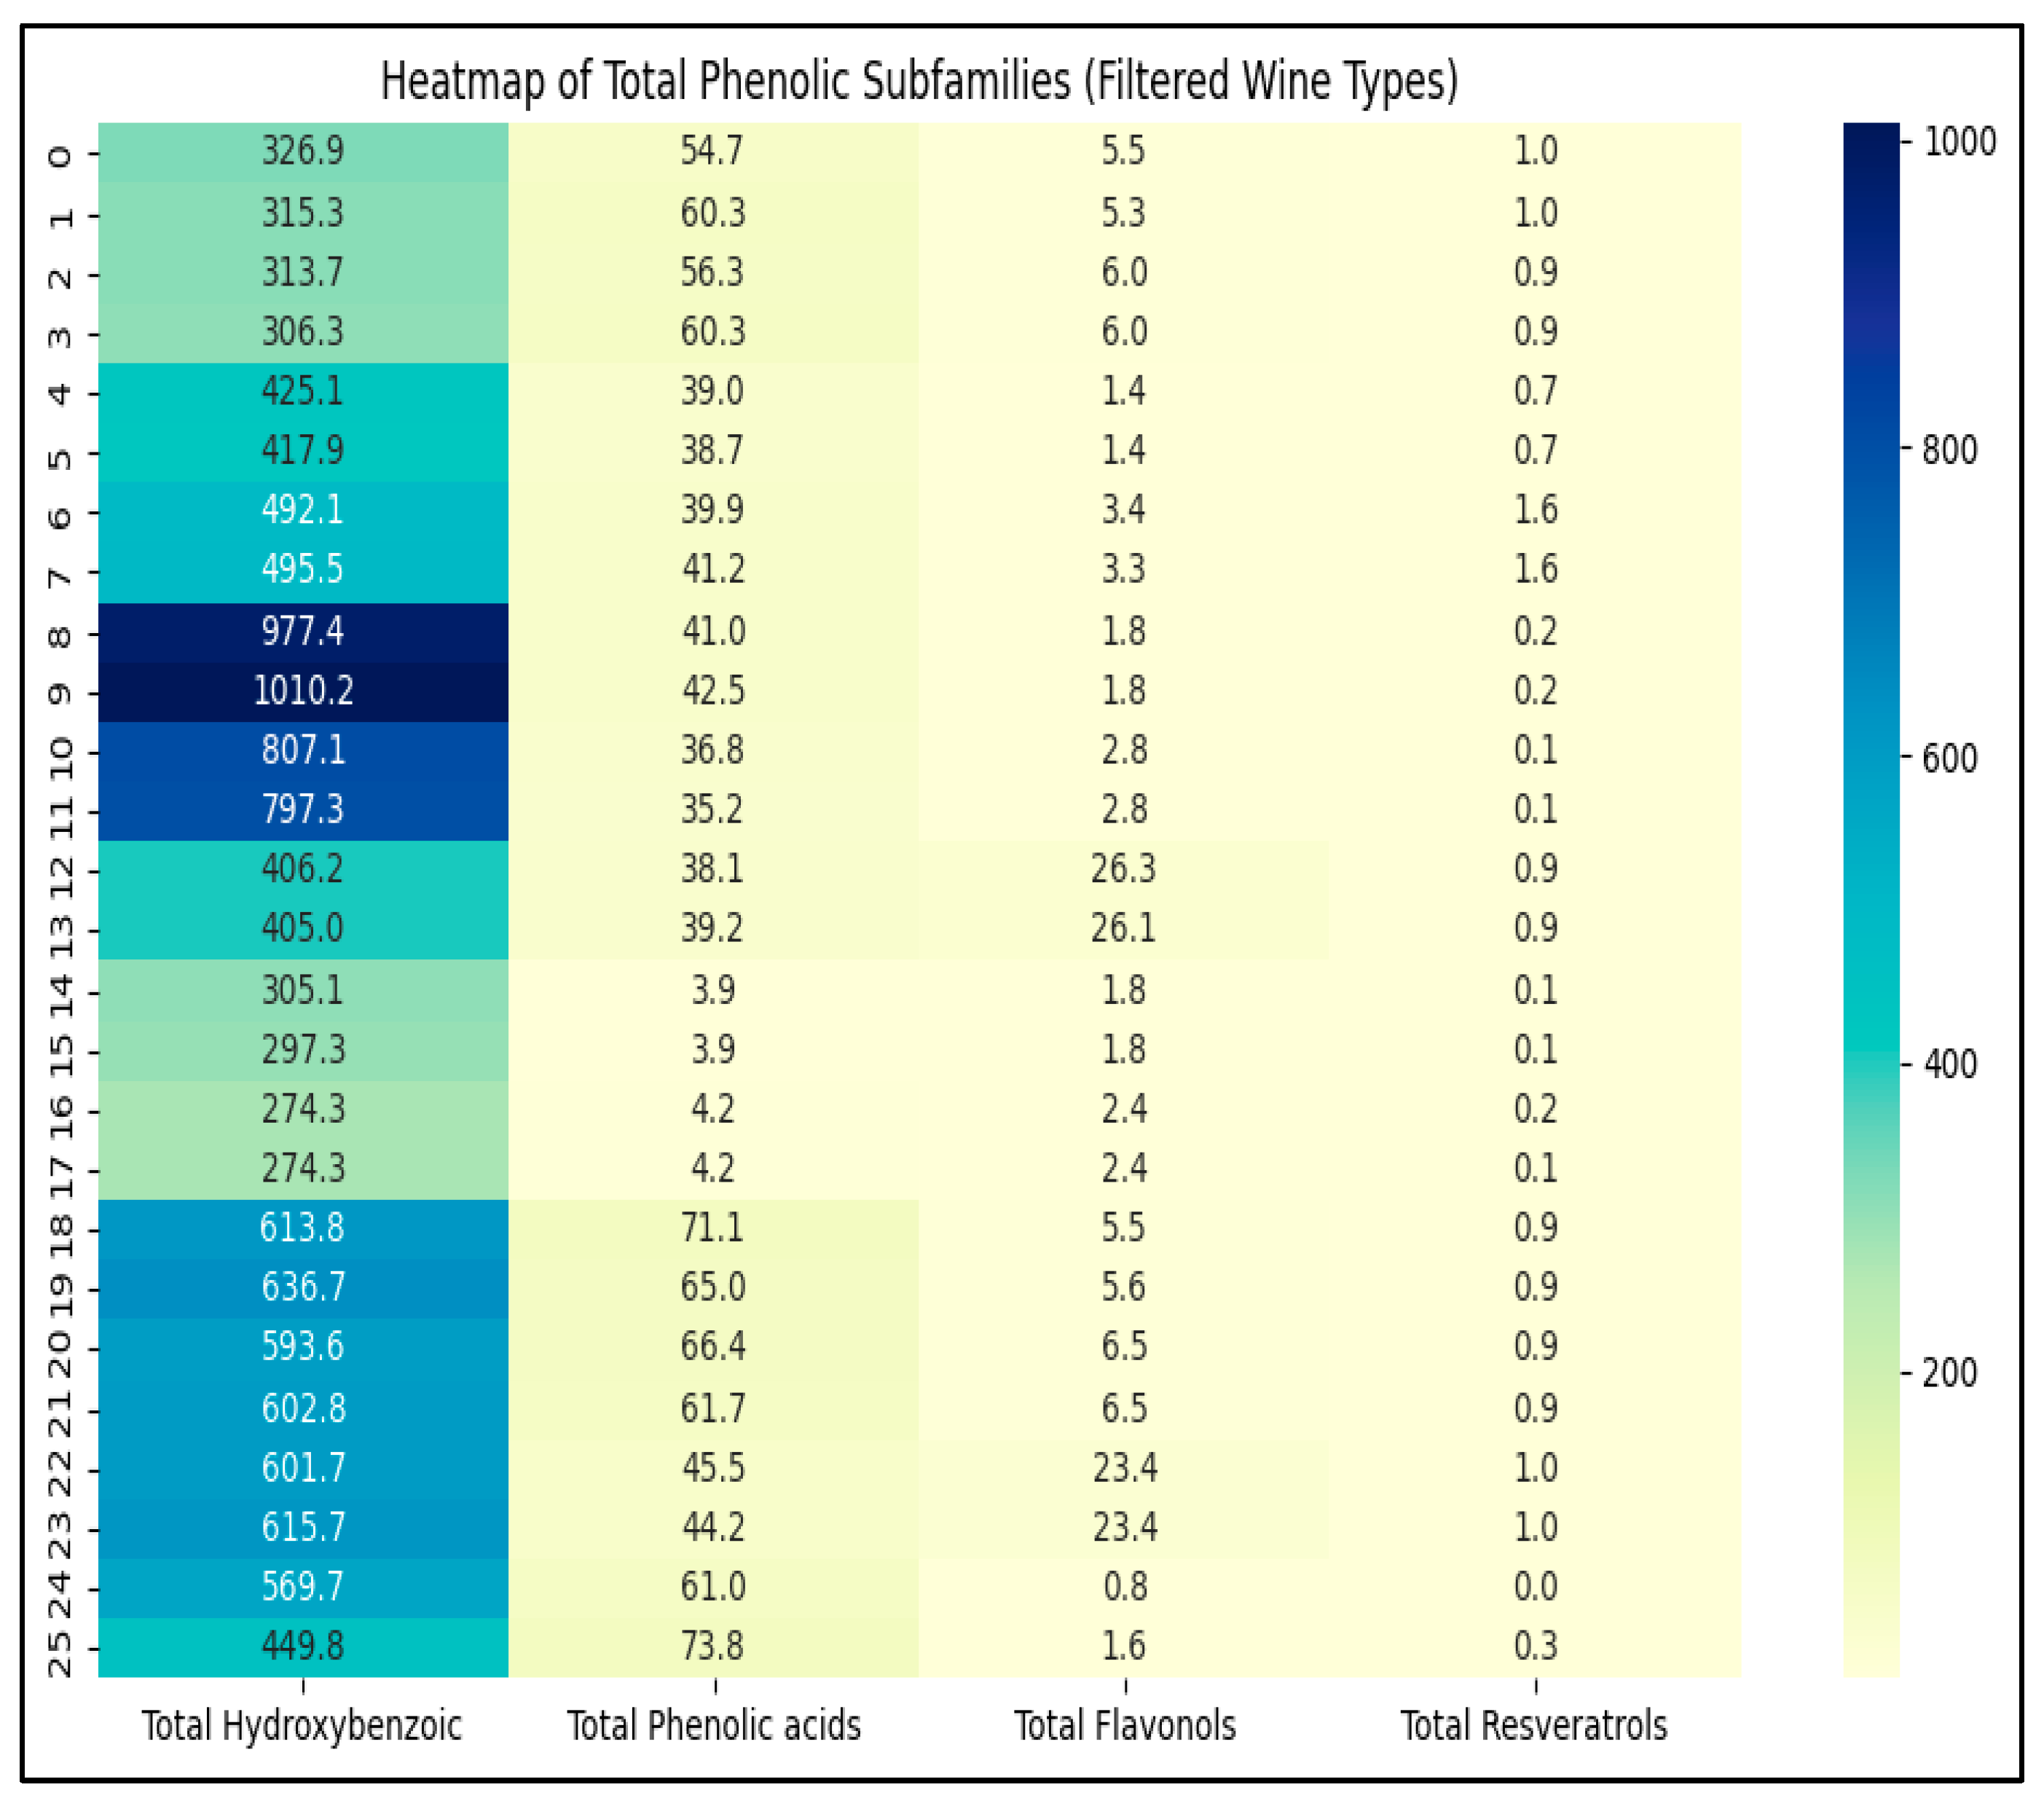
The heatmap visualizes the distribution of total phenolic subfamilies across the four filtered wine types (Kallmet, Shesh i zi, Merlot, Shesh i bardhë), revealing strong compositional patterns (Figure 6). As we observed, Kallmet and Shesh i zi possess the highest concentrations of hydroxybenzoic acids (>900 µg/mL), while flavonols and resveratrols are modest across all types (mostly ≤ 60 µg/mL). Shesh i bardhë displays moderate hydroxycinnamic acid content, and total phenolics closely mirror the hydroxybenzoic trend.
Hierarchical clustering revealed not only varietal separation but also meaningful intra-group variability among Albanian wine samples. Kallmet wines, while forming a distinct cluster, exhibited sub-branching driven by differential levels of flavan-3-ols and hydroxybenzoic acids, suggesting microclimatic or vinification diversity within this indigenous variety. Shesh i bardhë samples showed moderate dispersion, particularly along branches influenced by stilbene and flavonol content, possibly reflecting regional winemaking practices. Shesh i zi wines clustered more tightly, yet subtle internal variation was observed in hydroxycinnamic acid profiles. Merlot samples, though fewer in number, displayed clear sub-clustering, indicating biochemical heterogeneity shaped by vineyard origin or fermentation conditions. These intra-group patterns highlight the richness and complexity of Albanian viticulture, while clustering reflects statistical proximity rather than causal relationships.
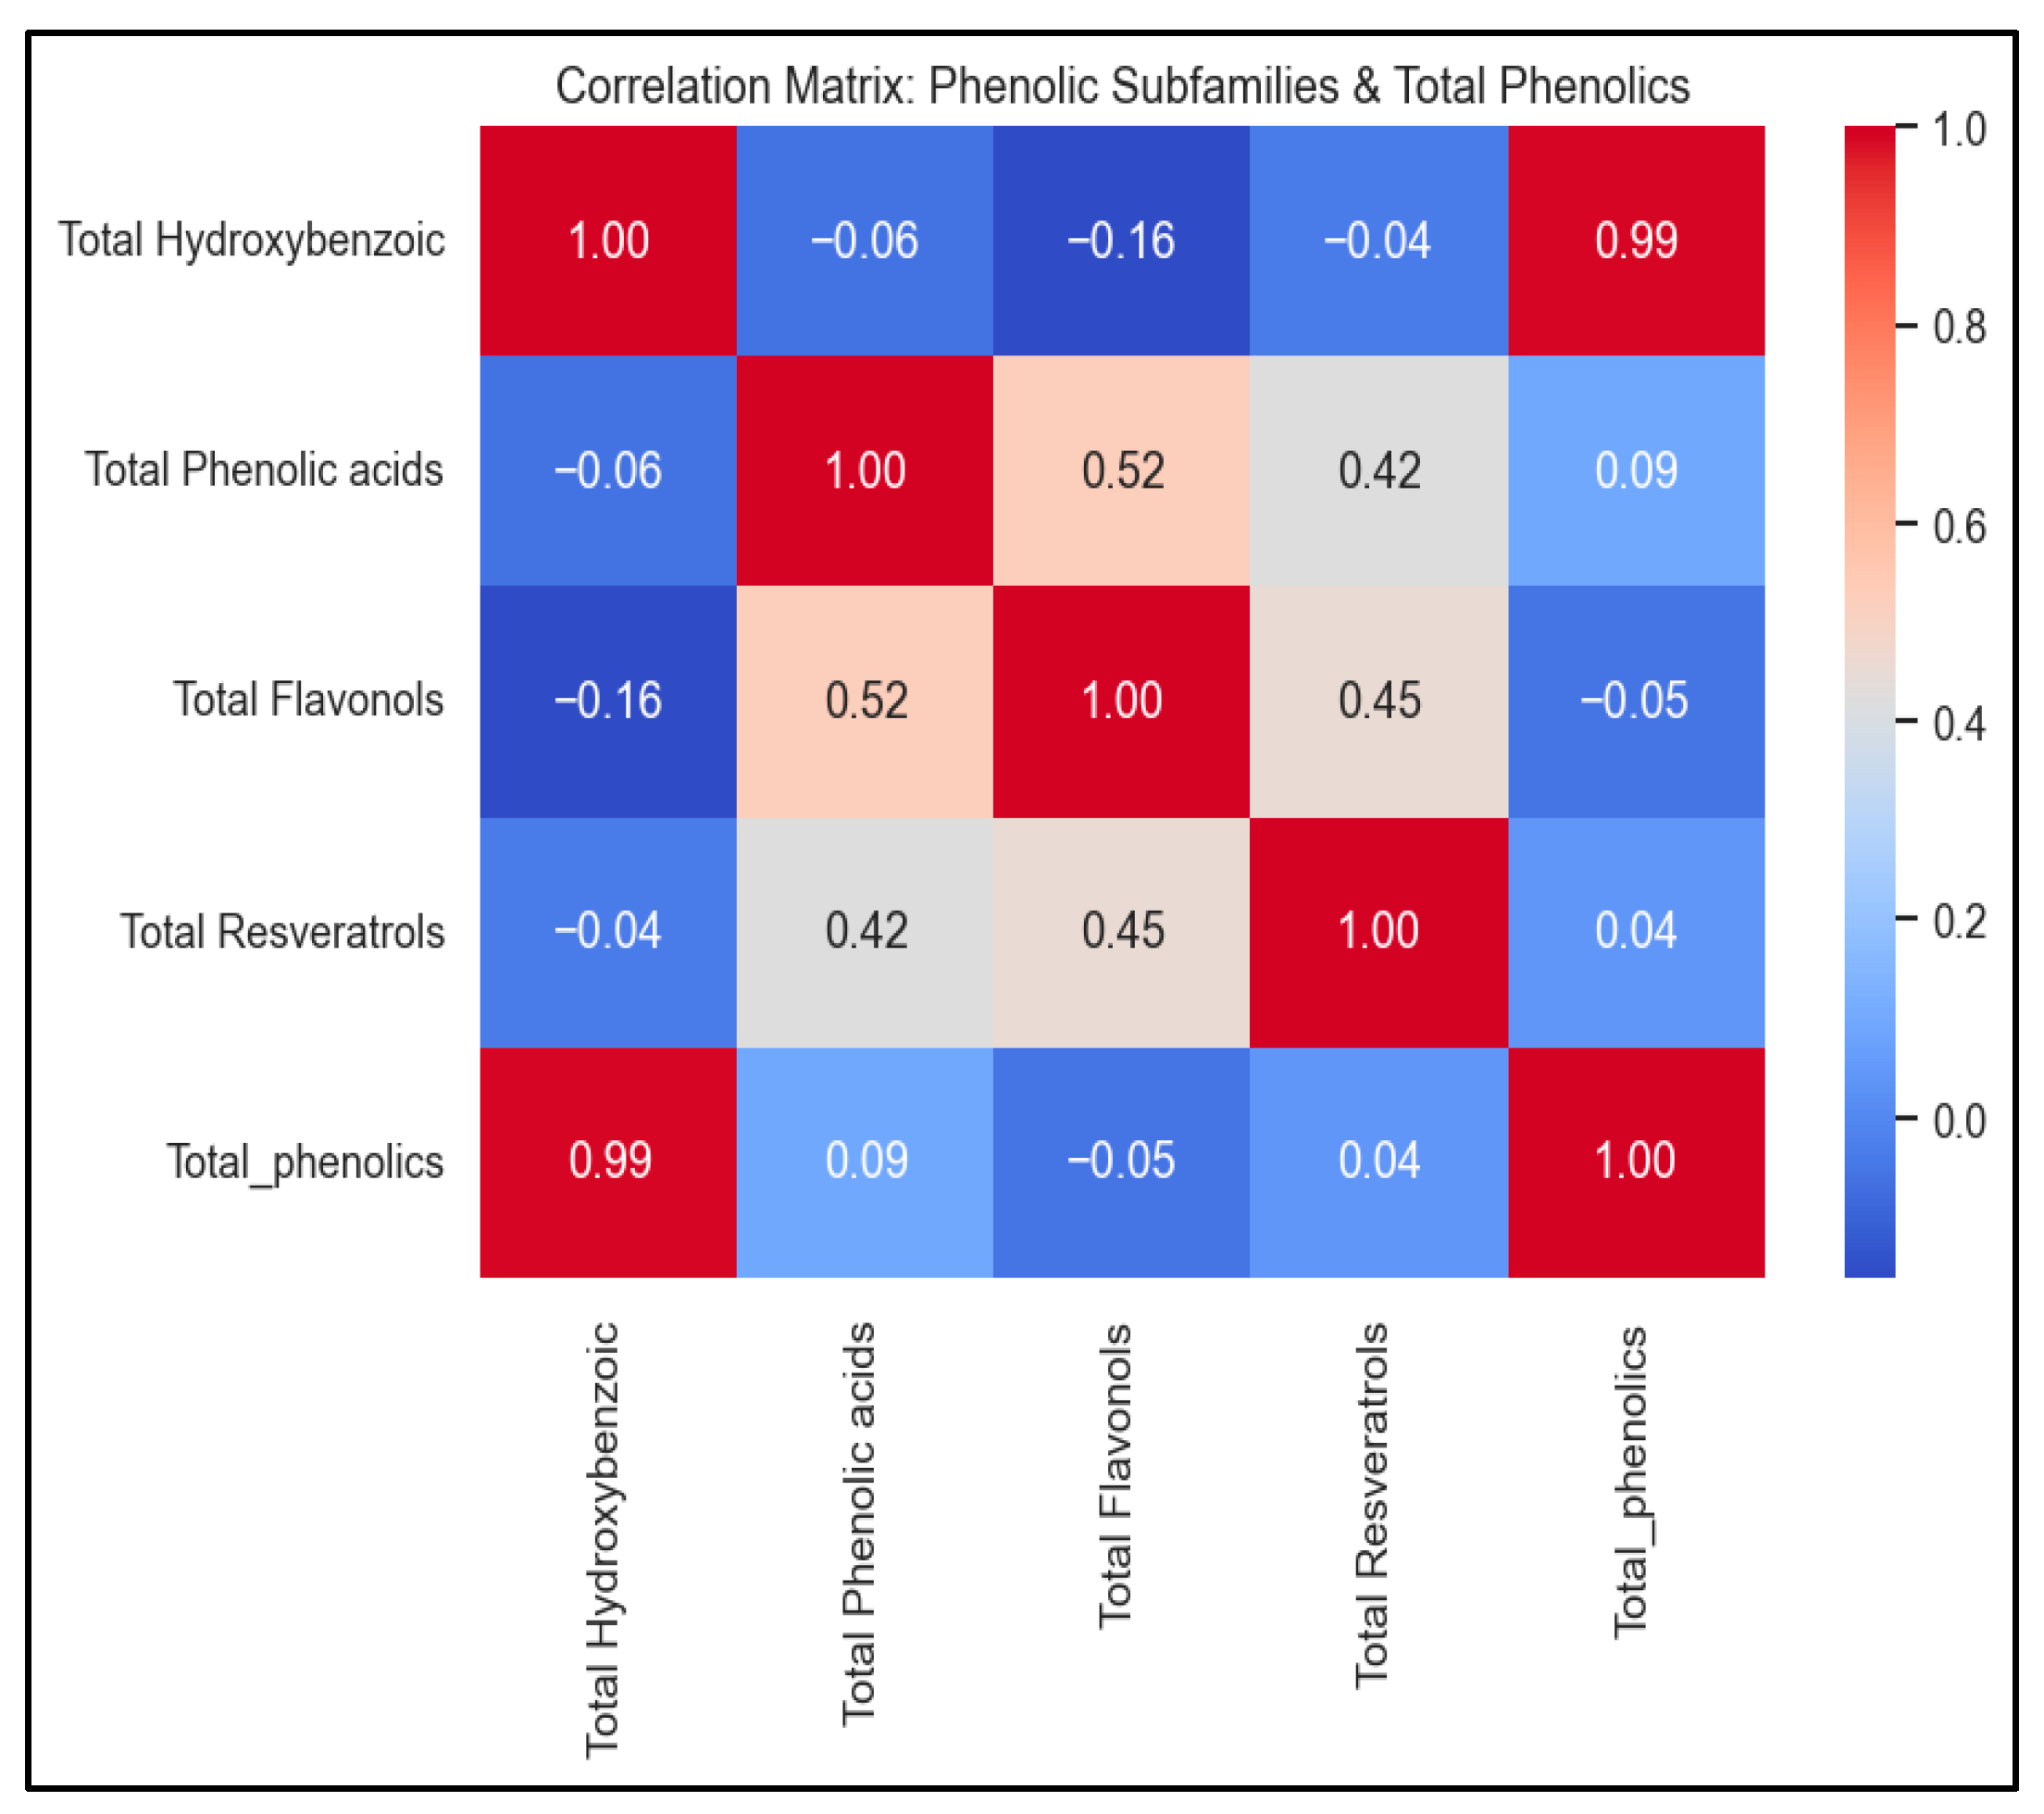
The correlation matrix (Figure 7) highlights nearly perfect collinearity between total hydroxybenzoic acids and total phenolics (r ≈ 0.99), confirming that this subclass dominates the phenolic load. In contrast, total phenolic acids, flavonols, and resveratrols exhibit weaker or negative correlations with total phenolics, indicating distinct subfamily behavior.
These patterns are consistent with findings from contemporary wine chemometrics literature: strong dominance of hydroxybenzoic acids in total phenolic content has been documented in multi-cultivar profiling studies [34]. The heatmap clustering also suggests meaningful sample grouping by phenolic “fingerprint,” reinforcing its utility for varietal authentication [26].
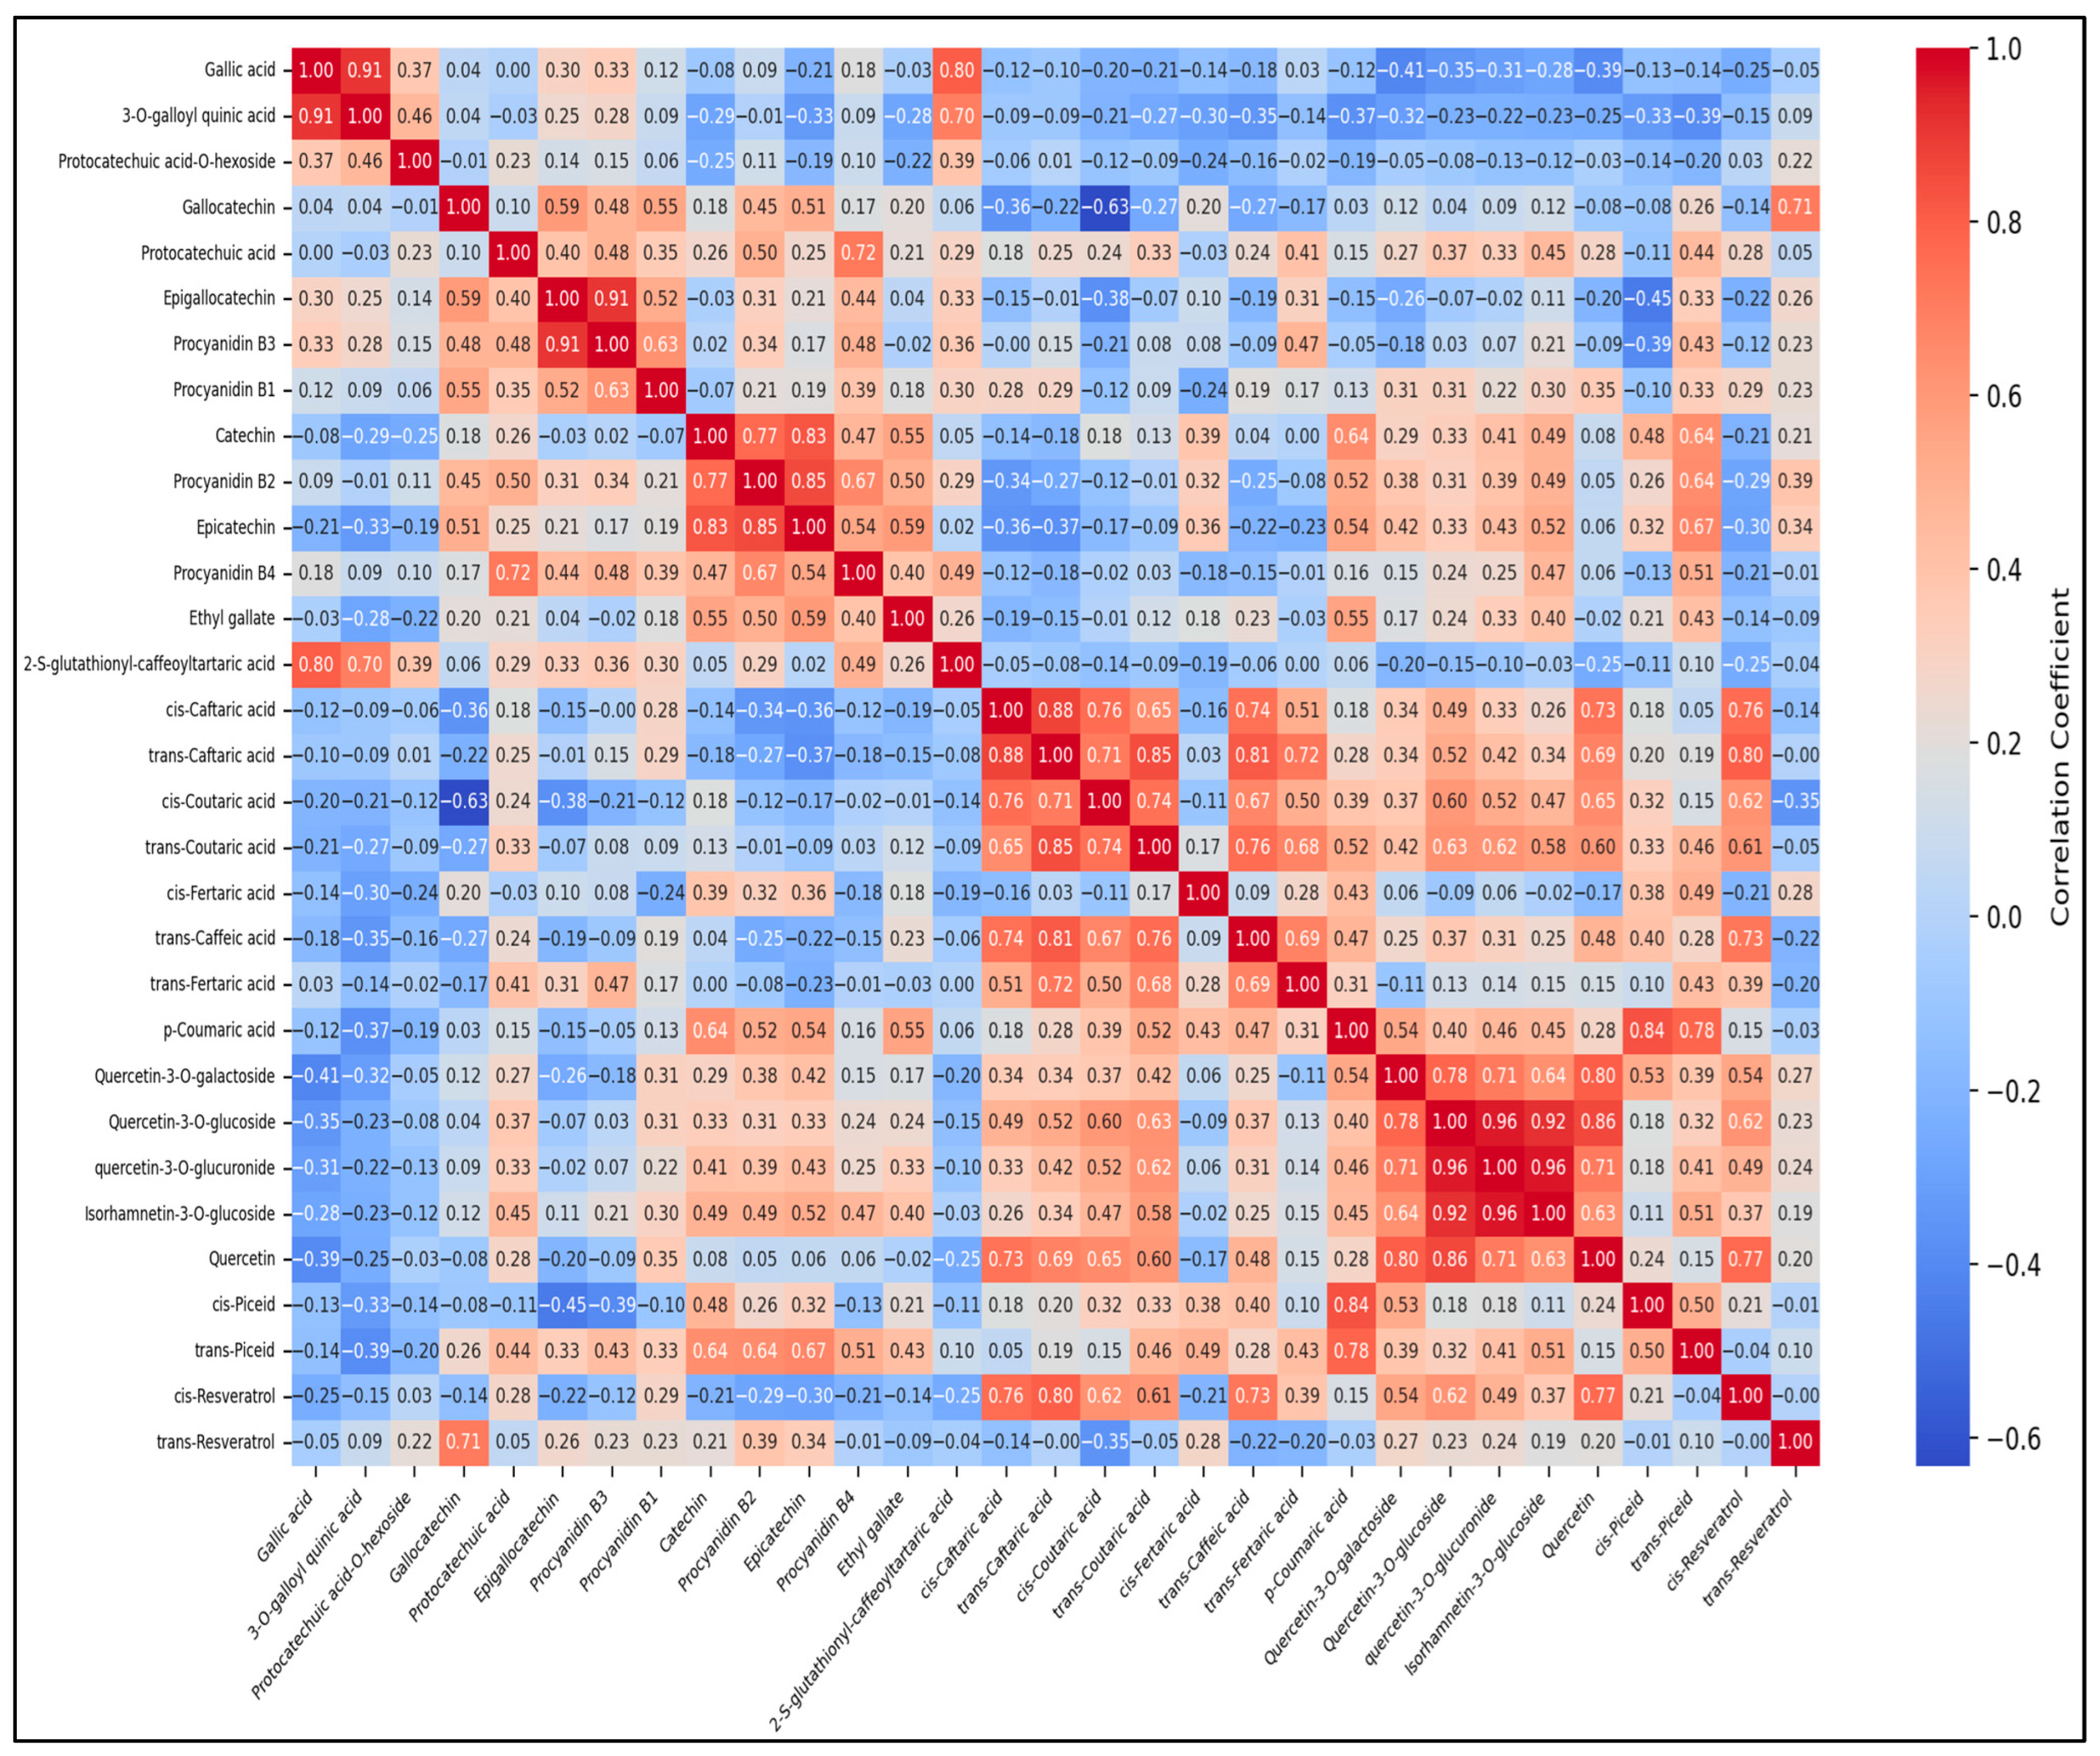
Figure 8 further illustrates the internal structure among the 31 phenolic compounds measured in Albanian wines, highlighting strong non-random associations between chemical groups. Strong correlations were observed within flavan-3-ols (Procyanidins B1–B4, Epicatechin, Catechin; r > 0.85), reflecting shared biosynthetic pathways. Cis- and trans-coutaric acids also clustered tightly, suggesting structural transformation during fermentation. Quercetin-based flavonols formed another coherent group.
Weak negative correlations (e.g., Gallic acid vs. cis-Resveratrol) may reflect divergent metabolic routes or oxidative dynamics. These dependencies support dimensionality reduction strategies like PCA, which retain meaningful biochemical signals while minimizing redundancy. As shown by Di and Yang (2022) [35], such patterns enhance model interpretability and predictive power in wine classification.
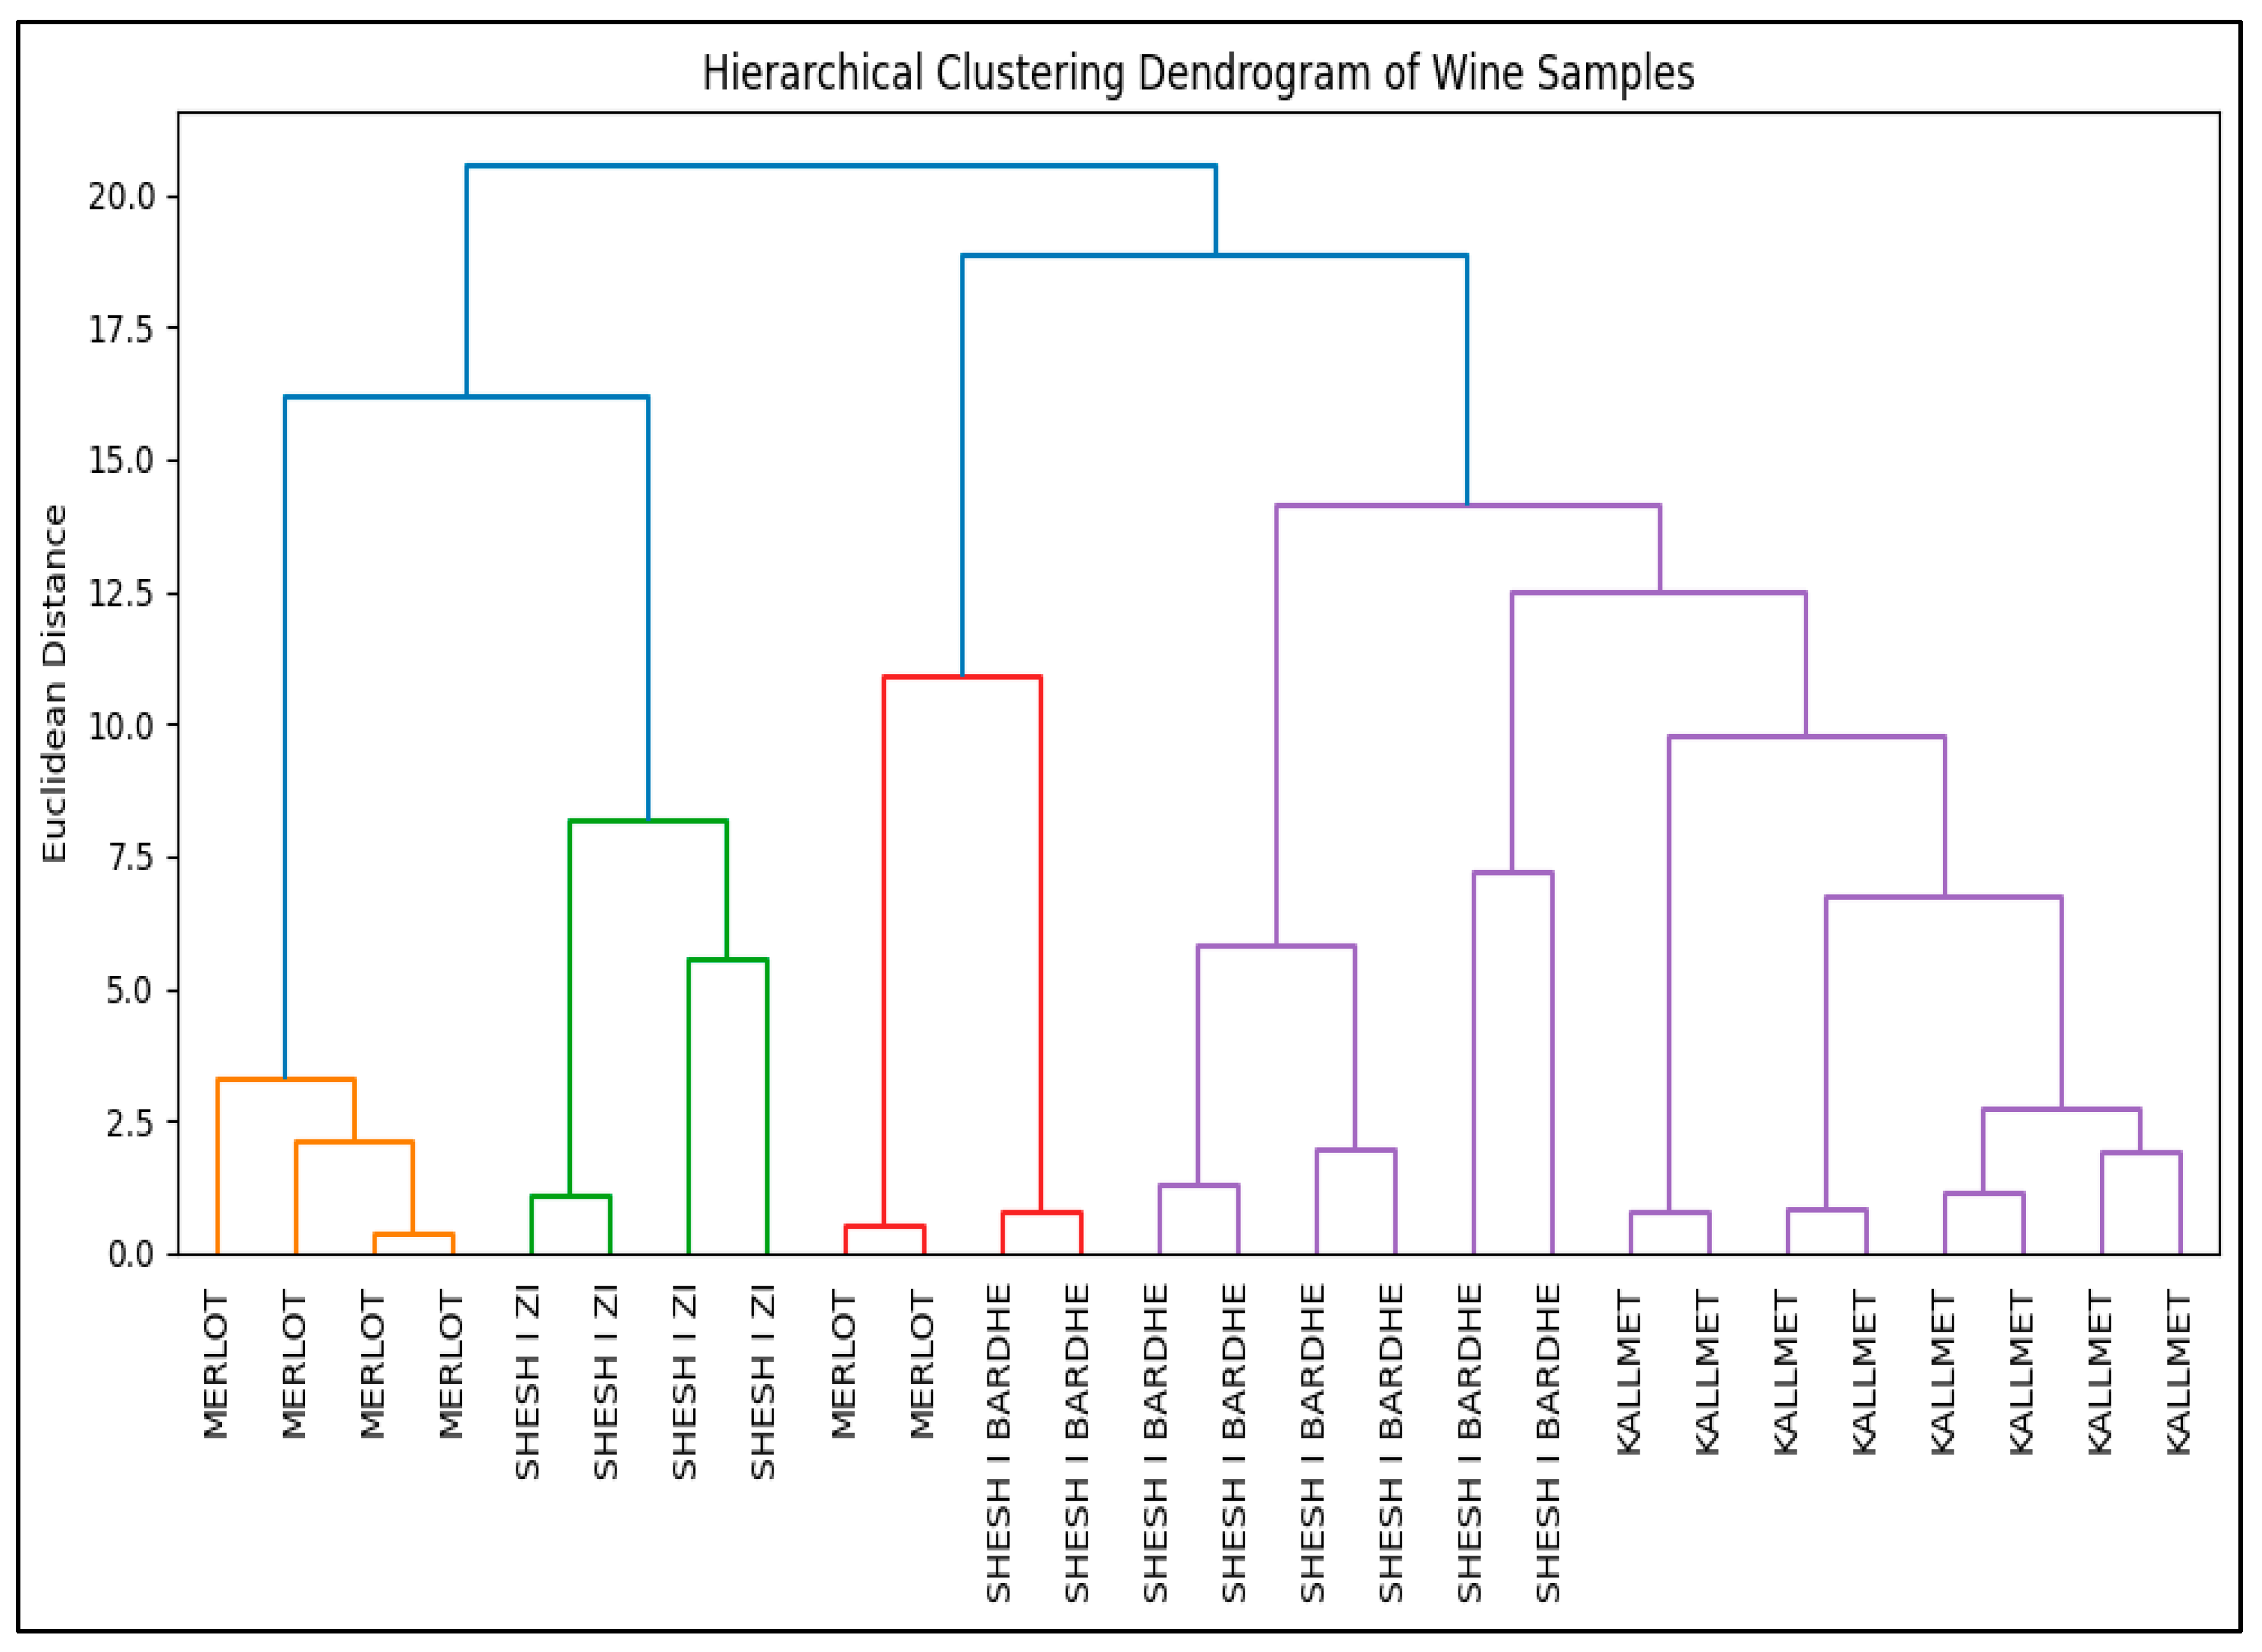
Figure 9 presents the hierarchical clustering dendrogram of 26 Albanian wine samples. Kallmet formed a tight cluster, indicating a consistent phenolic profile likely tied to genetic uniformity and terroir. Merlot and Shesh i zi appeared in adjacent clusters with greater dispersion, reflecting phenolic variability across vineyards and vintages. Shesh i bardhë formed a distinct cluster, consistent with its white-wine phenolic signature.
This clustering supports the hypothesis that phenolic fingerprints can reliably distinguish grape varieties and potentially reflect regional specificity. Previous studies have shown that hierarchical clustering combined with phenolic profiling effectively uncovers latent varietal structure and supports robust authentication pipelines [5,36,37]. The dendrogram reveals clear varietal groupings, with samples from the same grape variety clustering closely together, particularly for Shesh i zi and Kallmet. This supports the hypothesis that phenolic composition is a strong varietal discriminator.
Phenolic compounds were analyzed both individually and by subclass to capture fine-grained and structural patterns. Compound-level analysis revealed specific correlations—such as Catechin with Procyanidin B3, and Quercetin with Kaempferol—highlighting biochemical co-expression. In contrast, class-level trends (e.g., flavan-3-ols, hydroxycinnamic acids) were used to interpret broader variance contributions in PCA and clustering. While subclass aggregation aids dimensionality reduction and biological interpretation, it does not replace compound-specific resolution. Therefore, statistical associations at the class level should be interpreted as general tendencies, not as uniform behavior across all constituent compounds.

3.6.3. Interpretation of Compound Groupings

Cluster analysis highlighted consistent co-expression of certain phenolic compounds, including caffeic acid, p-coumaric acid, and quercetin derivatives. These groupings reflect biosynthetic linkages and varietal specificity, supporting the hypothesis that phenolic profiles encode meaningful chemical signatures for wine classification.
Beyond classification, the observed separation between red varietals (Kallmet, Merlot, Shesh i zi) and the single white class (Shesh i bardhë) aligns with known biochemical differences in phenolic acid and flavonol content [5]. This distinction adds interpretability and biological plausibility to the clustering outcome. Ultimately, the dendrogram provides an unsupervised validation of varietal authenticity and supports supervised machine learning results by demonstrating that phenolic composition embodies varietal identity.

3.7. Supervised Learning Classification of Wine Varieties

3.7.1. Model Setup and Cross-Validation

Five supervised machine learning algorithms were trained to classify wine samples by grape variety: Support Vector Machine (SVM with RBF kernel), Random Forest (RF), k-Nearest Neighbors (kNN), Decision Tree (DT), and Extreme Gradient Boosting (XGBoost). These models were selected for their proven performance in food authentication and multivariate classification tasks.
Model optimization was performed using grid search, and evaluation employed two cross-validation strategies tailored to the dataset size (n = 26). Leave-One-Out Cross-Validation (LOOCV) was used to minimize bias and maximize training data per fold. In parallel, Stratified K-Fold Cross-Validation (k = 3) preserved class proportions across folds, balancing generalizability and stability [38,39].
Each model was assessed using macro-averaged ROC-AUC (one-vs-rest), macro F1-score, and overall accuracy. Probabilistic predictions were used to compute ROC-AUC scores. All classifiers were implemented using Python libraries—scikit-learn and XGBoost—with default hyperparameters unless otherwise specified. The following classifiers were trained and tested:
  • Random Forest.
  • Support Vector Machine (SVM with RBF kernel).
  • K-Nearest Neighbors (KNN).
  • Logistic Regression.
  • XGBoost.
Despite the limited dataset (n = 26), model robustness was reinforced through nested cross-validation and learning curve analysis, which confirmed stable performance across training subsets. Permutation testing yielded p-values < 0.01 for all models, indicating that observed accuracies were unlikely to result from random label distributions. All models were implemented using scikit-learn or XGBoost libraries with default hyperparameters. Probabilistic predictions were used to compute ROC-AUC scores.

3.7.2. Performance Metrics and Evaluation

The performance of five classification models (Random Forest, SVM, K-Nearest Neighbors, Logistic Regression, and XGBoost) was evaluated using stratified 3-fold cross-validation due to the small dataset size (n = 26). The k = 3 value was chosen to maintain an adequate number of samples per fold while preserving class stratification, a common practice in low-sample-size studies where increasing the number of splits could lead to unreliable performance estimation due to high variance [40,41].
The original dataset contained 30 samples, but four instances were removed: two from Vlosh and two from Cerruje, because these wine types were not part of the four main varietal classes under study (“Kallmet,” “Merlot,” “Shesh i bardhë,” and “Shesh i zi”) and were highly under-represented. Their exclusion helped avoid extreme class imbalance and reduced the risk of overfitting or noise in model training, ensuring biological and statistical consistency in the supervised classification task. The models were assessed using three metrics: macro-average ROC-AUC, F1-score, and accuracy (Table 3).
The classification model was evaluated for robustness across multiple grape varieties, including Kallmet, Shesh i bardhë, Shesh i zi, and Merlot. Stratified cross-validation was employed to ensure balanced representation of all classes during training and testing. Despite class imbalance in sample counts, the model maintained consistent performance metrics across folds, with no single class dominating prediction accuracy. Confusion matrix analysis confirmed that inter-class discrimination was preserved, particularly for Kallmet and Shesh i zi, which showed minimal misclassification. These results support the model’s capacity to handle multi-class structure with phenolic features, though future work may benefit from expanded sample sizes and external validation.
While the ROC-AUC results for models such as SVM and XGBoost are nominally perfect, these should be interpreted cautiously. The presence of only 26 samples and marked class imbalance (e.g., only four instances of “Shesh i zi”) creates a high risk of model overfitting. Confusion matrices and per-class metrics revealed consistent classification across all four grape varieties, with precision and recall exceeding 0.90 for dominant classes. F1-scores were used to balance precision and recall, particularly for minority classes such as Shesh i zi and Merlot, ensuring that high accuracy did not mask class-specific misclassification. Furthermore, perfect F1 and accuracy scores for SVM and Logistic Regression in all folds raise concerns of overfitting or information leakage.
This phenomenon, where models achieve perfect ROC-AUC and accuracy under limited and imbalanced conditions, is well-documented. According to Mazurowski et al. (2008) [42], in small datasets, AUC is especially prone to inflation due to limited variability in test sets. Similarly, Vabalas et al. (2019) [43] highlight the need for caution in small-sample machine learning as cross-validation becomes unstable.

3.7.3. Hyperparameter Optimization

Hyperparameters were tuned individually for each model. For RF and DT, the number of estimators and maximum depth were adjusted to prevent overfitting. SVM models were optimized for kernel type and regularization strength, while XGBoost parameters included learning rate, tree depth, and subsampling ratio. Optimal configurations were selected based on cross-validated F1-scores and permutation-based significance testing.
To improve classification performance and ensure fair comparison across models, we performed hyperparameter optimization using GridSearchCV with stratified 3-fold cross-validation. Given the limited sample size (n = 26 after the removal of outlier classes), a 3-fold strategy was chosen to preserve adequate training data per fold and reduce the variance of performance estimates, a best practice in small-sample biological and biomedical machine learning studies [43,44,45,46,47,48].
Grid search was conducted over a carefully designed parameter space for each model, with tuning guided by domain knowledge and best practices from recent methodological studies [49,50,51]. The models were evaluated using macro-average F1-score as the primary objective function due to class imbalance. The best parameter combinations and resulting cross-validated F1-scores were:
  • Random Forest: n_estimators = 50, max_depth = None, min_samples_split = 2-F1-macro = 0.9375.
  • SVM: C = 1, kernel = ‘rbf’, gamma = ‘scale’-F1-macro = 1.0000.
  • Logistic Regression: C = 0.1, penalty = ‘l2′, solver = ‘lbfgs’-F1-macro = 0.9020.
  • KNN: n_neighbors = 7, weights = ‘distance’, metric = ‘manhattan’-F1-macro = 0.9270.
  • XGBoost: learning_rate = 0.1, max_depth = 3, n_estimators = 50-F1-macro = 0.8931.
When compared to untuned models (see Table 2), tuning yielded notable improvements for KNN (F1 from 0.5208 to 0.9270, accuracy from 0.5370 to a significantly higher value) and a slight yet meaningful improvement for Logistic Regression. For SVM and Random Forest, performance remained stable at their near-optimal defaults (F1 = 1.0000 and 0.9375, respectively), confirming their robustness in this phenolic dataset. These outcomes underscore the importance of targeted hyperparameter tuning, especially in models like KNN or XGBoost that are more sensitive to parameter settings.
Overall, the tuned models were subsequently used in all further analyses, including ROC curve visualization, feature importance ranking, and Leave-One-Out Cross-Validation (LOOCV) performance comparison.

3.7.4. Final LOOCV Results and Permutation Testing

Final model predictions were validated using Leave-One-Out Cross-Validation (LOOCV), with confusion matrices generated to assess classification accuracy per varietal class. All classifiers performed exceptionally well, with SVM achieving 100% accuracy and others ranging from 92.3% to 96.1% (Table 4). These results indicate that phenolic profiles contain highly discriminative features across the four grape cultivars.
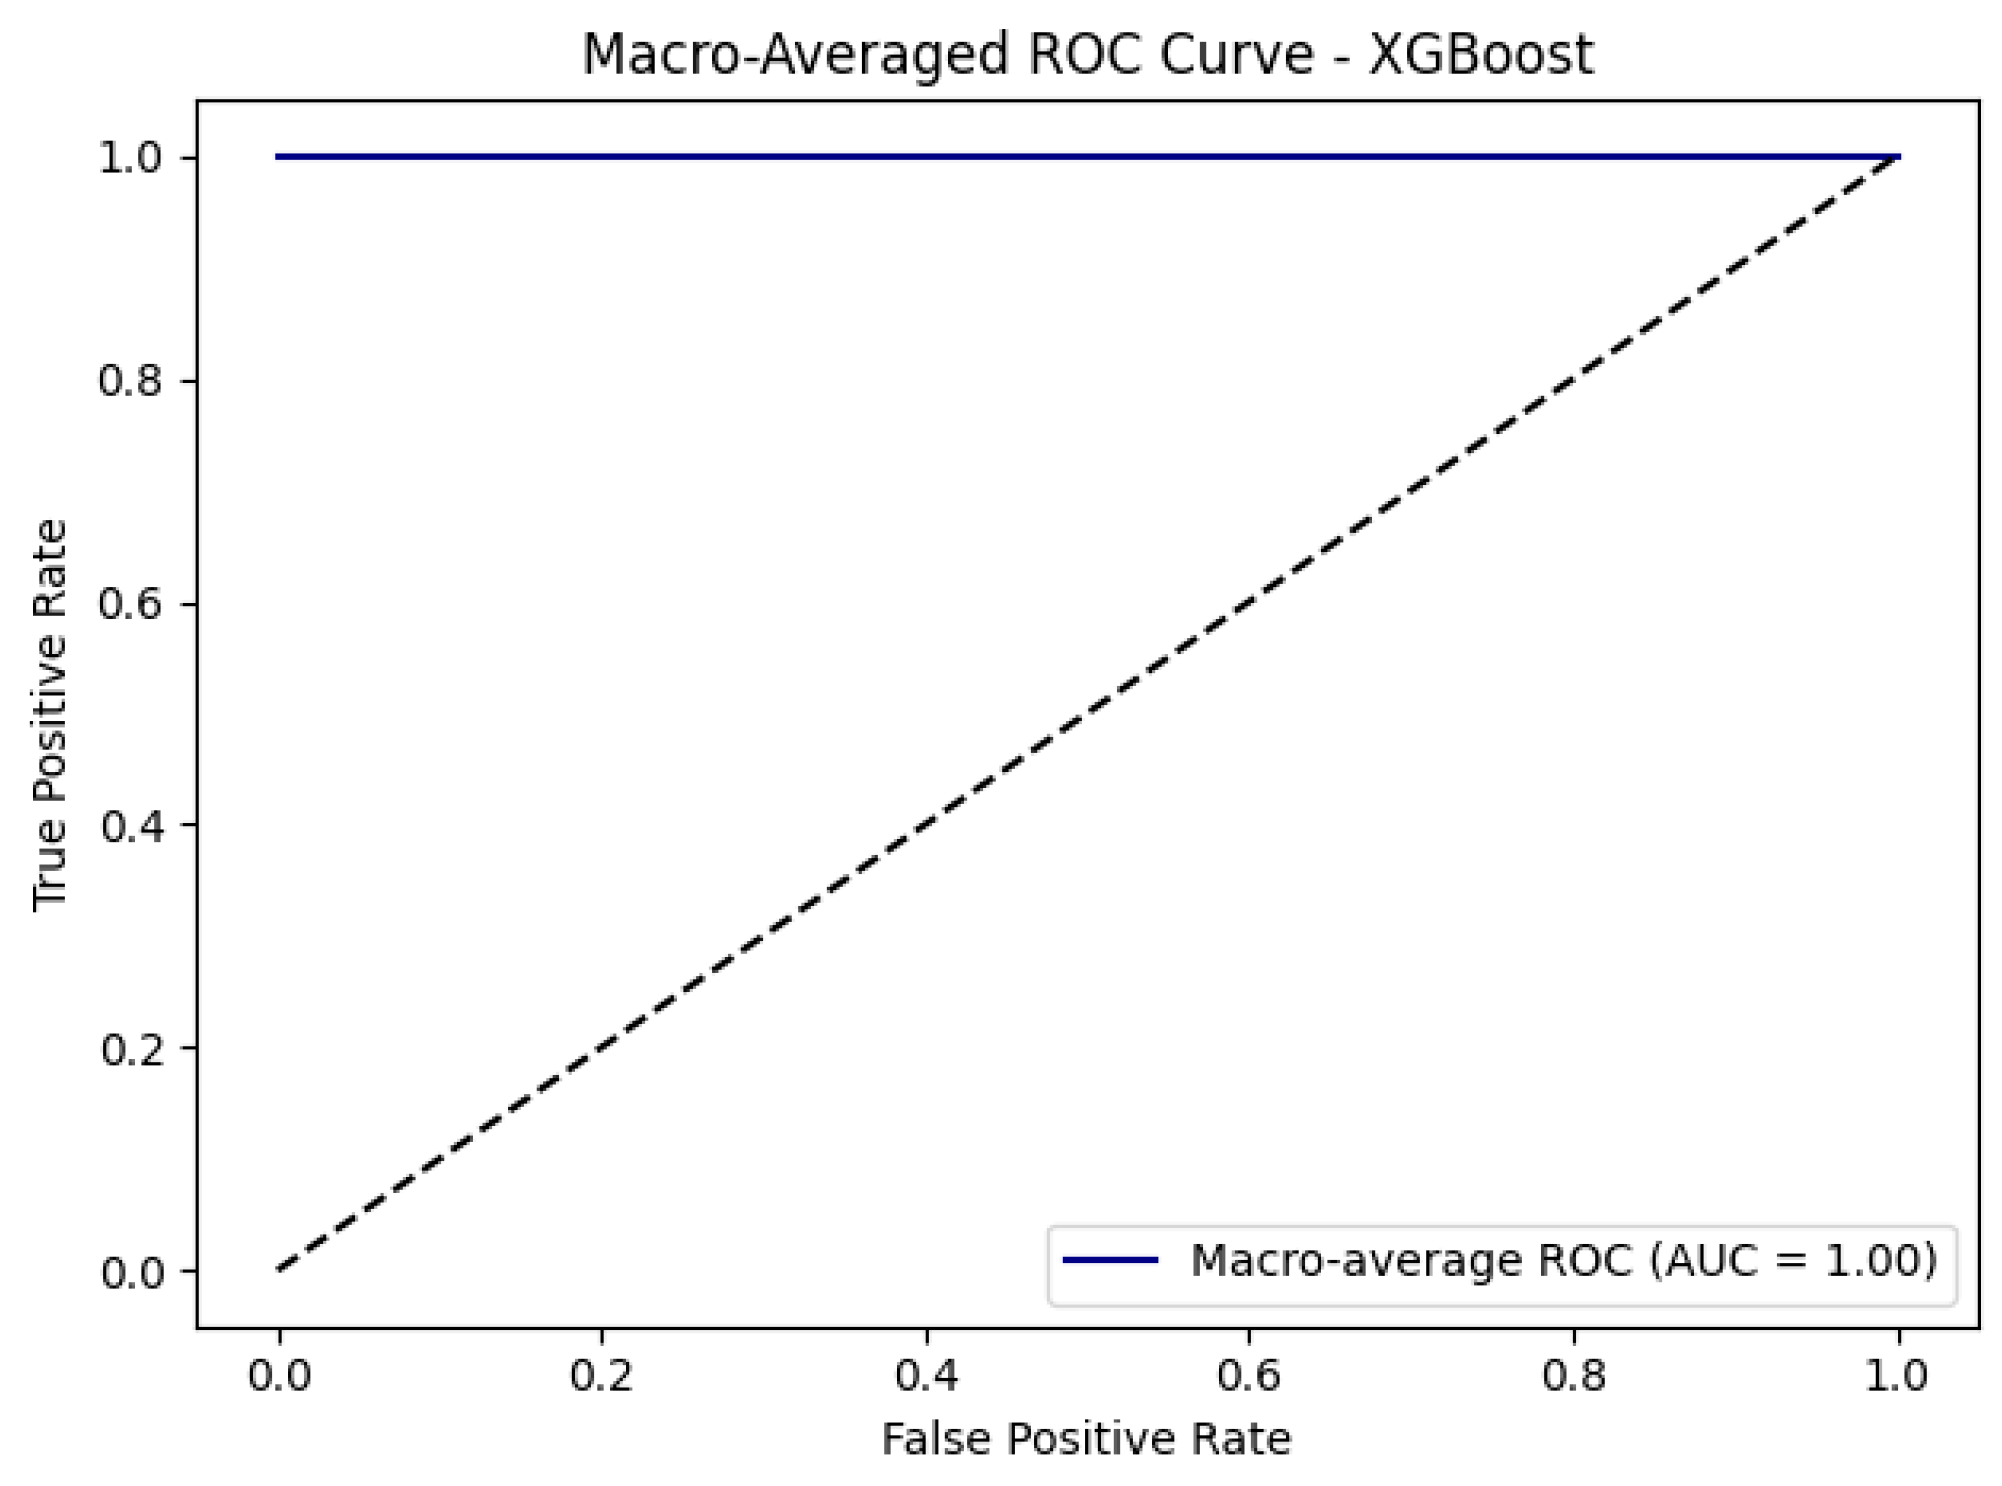
Confusion matrices (Figure 10) showed perfect class separation, particularly for SVM and XGBoost, which produced diagonally dominant matrices with no misclassifications. A macro-averaged ROC curve for XGBoost (Figure 11) yielded an AUC of 1.00, confirming the model’s ability to distinguish classes in a one-vs.-rest setup.
To ensure robustness, we conducted 1000-iteration permutation testing using LOOCV. All models produced statistically significant p-values (p = 0.001), confirming that classification outcomes were driven by phenolic structure rather than random label associations.
Hyperparameters were optimized via grid search with stratified 3-fold cross-validation and macro F1-score, balancing generalizability and stability in a small dataset [52].
While results are promising, caution is warranted due to the limited sample size (n = 26). These findings should be considered preliminary, and future validation on independent datasets is recommended to confirm generalizability.

3.8. Model Interpretability and Phenolic Markers

3.8.1. Feature Ranking

Tree-based models provided intrinsic measures of feature importance, allowing for the identification of phenolic compounds most influential in varietal classification. Trans-fertaric acid, caffeic acid, and quercetin derivatives consistently emerged as key discriminators. These compounds have previously been identified as varietal markers in Mediterranean and Balkan wines, due to their sensitivity to grape genotype and vinification conditions.
Each line color encodes wine type. Clear groupings and patterns reveal compound-specific signatures for wine classification, except for the Vlosh wine (yellow color).
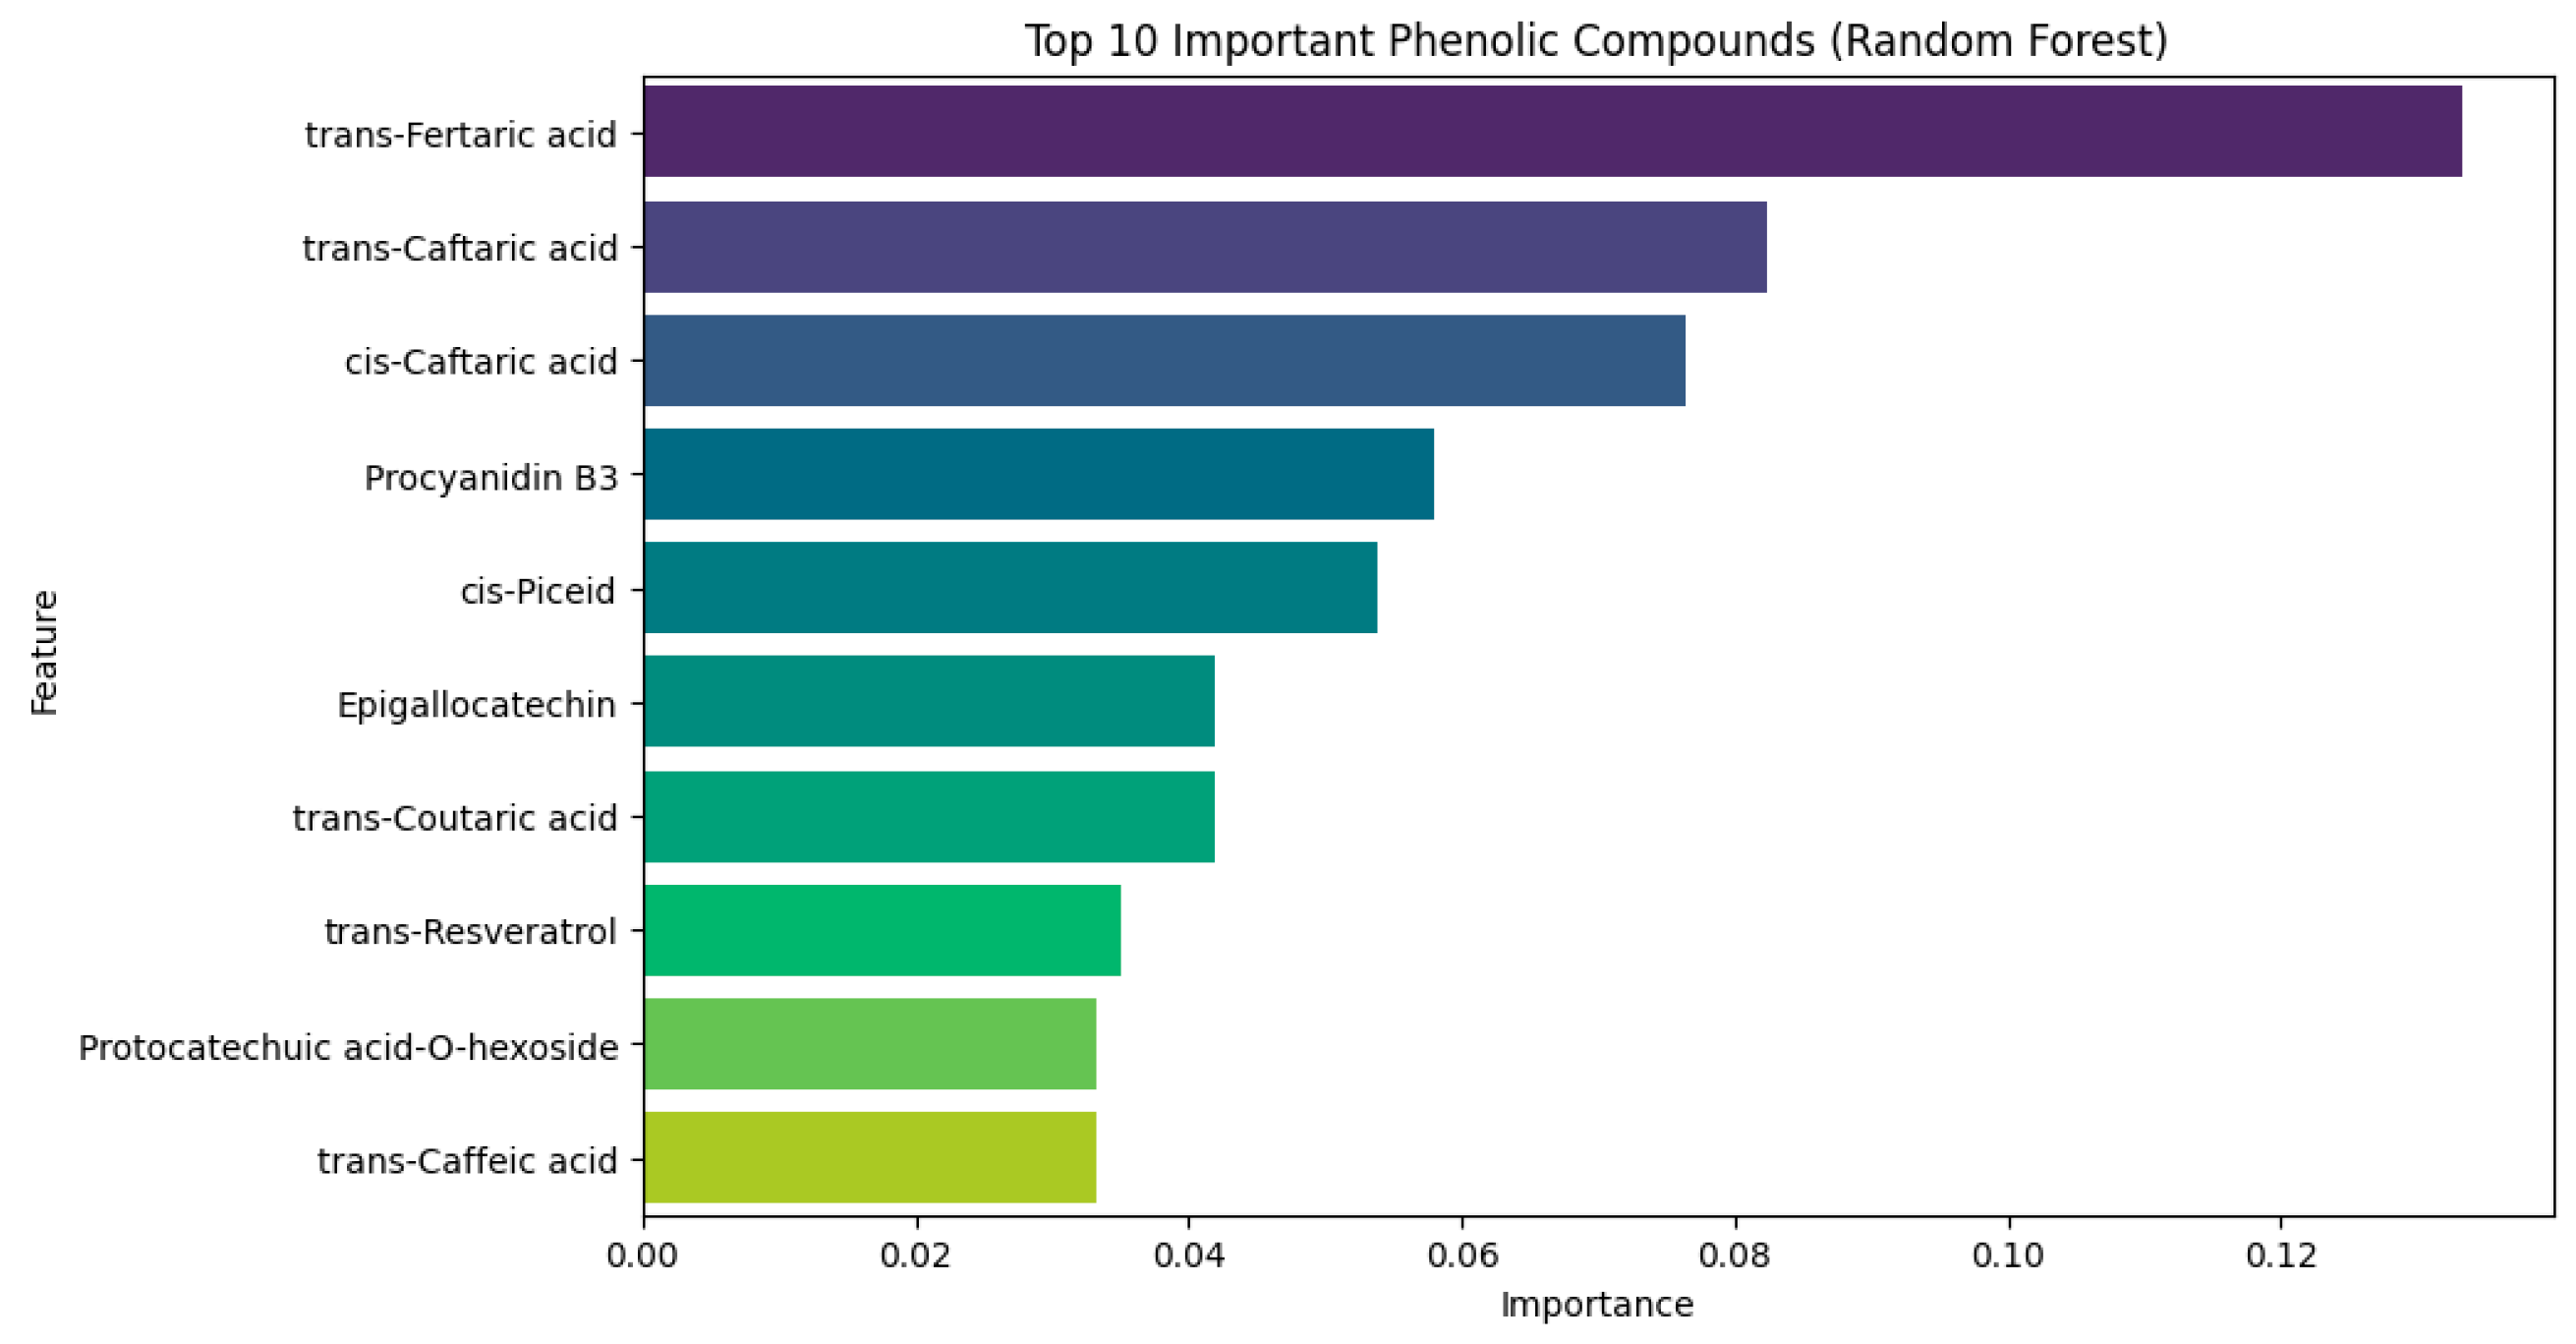
To better understand which phenolic compounds contributed most to the models’ predictions, we analyzed feature importance using Random Forest. In our feature importance analysis using Random Forest in Figure 12, we observe results similar to those of Zaza and coauthor (2023) [18]. Both trans-Fertaric acid and Procyanidin B3 emerged as top-ranking predictors across independent runs, reflecting their combined chemical and functional roles in wine characterization. The relevance of trans-Fertaric acid is supported by empirical evidence showing its consistent presence among the most abundant hydroxycinnamate derivatives in wines, particularly in white and rosé varieties, where it plays a crucial role in oxidation-related browning reactions and color stability [14]. Its high extractability during pressing and vinification justifies its dominance as a phenolic marker in non-macerated wines.
Meanwhile, Procyanidin B3, a flavan-3-ol dimer found predominantly in grape skins and seeds, is widely recognized for its contribution to red wine astringency due to its strong binding with salivary proteins and its potent antioxidant capacity [53,54,55]. The concurrent appearance of these compounds at the top of both feature-ranking outputs suggests that the model captures complementary phenolic dimensions: trans-Fertaric acid, which represents structural hydroxycinnamic acid esters tied to early grape processing, and Procyanidin B3, which embodies maceration-dependent flavonoids tied to sensory perception in red wines. This dual importance aligns with literature indicating that combining phenolic acid and flavonoid profiles significantly improves wine classification accuracy ([19,35].
The top-ranked compounds identified via Random Forest feature importance—such as trans-Fertaric acid, Procyanidin B3, and caffeic acid—belong to hydroxycinnamic acids and flavan-3-ols, which are known to vary significantly across grape varieties and vinification styles. This alignment between algorithmic ranking and biochemical classification reinforces the interpretability of the model and supports the use of phenolic categories as meaningful predictors.
Feature-ranking results presented in this section were derived from the Random Forest classifier, which computes variable importance based on mean decrease in impurity across decision trees.

3.8.2. Parallel Coordinates Plot and Chemical Interpretation

A parallel coordinates plot highlighted the distribution of key phenolics across wine types. Shesh i zi and Merlot samples showed elevated levels of hydroxycinnamic acids and flavonols, while Shesh i bardhë exhibited lower intensities across most markers. These patterns align with known varietal traits and suggest that phenolic fingerprints can serve as reliable indicators of grape identity and winemaking practices.
The parallel coordinates plot (Figure 13) visualizes the behavior of six phenolic compounds identified as the most essential features for wine classification using a Random Forest model: trans-Fertaric acid, trans-Caftaric acid, cis-Caftaric acid, Procyanidin B3, cis-Piceid, and Epigallocatechin. Normalized concentration values reveal that Vlosh and Shesh i bardhë exhibit the highest levels of trans-Fertaric acid (0.78 and 0.69, respectively), while Kallmet and Merlot show considerably lower values (0.47 and 0.08, respectively). This finding aligns with the classification of hydroxycinnamic acids (such as trans-Fertaric and cis-Caftaric acids) as dominant phenolics in white and rosé wines, where skin contact is limited and oxidation reactions are minimized [36]. Moreover, Shesh i bardhë shows the highest levels of Procyanidin B3 (0.66), followed by Shesh i zi (0.53), consistent with their reputation as structured red wines with significant skin maceration, enabling higher extraction of flavan-3-ols. In contrast, Cerruje demonstrates exceptionally low or near-zero levels of cis-Piceid, Epigallocatechin, and Procyanidin B3, highlighting a phenolic profile characteristic of wines with little or no phenolic maceration [56].
A full correlation matrix with r values and p-values is provided in Supplementary Table S4. Pearson correlation coefficients (r) were calculated for all pairwise combinations of the 31 phenolic compounds. Significant correlations (p < 0.05) were observed between Procyanidin B3 and Catechin (r = 0.89), trans-Fertaric acid and Caffeic acid (r = 0.81), and Quercetin and Kaempferol (r = 0.76), indicating strong biochemical co-expression within flavan-3-ols, hydroxycinnamic acids, and flavonols, respectively.
Pearson correlation analysis was conducted across all 31 quantified phenolic compounds to explore biochemical co-expression patterns. Pearson correlation heatmap of selected phenolic compounds across Albanian wine samples. Strong positive correlations are observed within phenolic subclasses, including Catechin vs. Procyanidin B3 (r = 0.89), trans-Fertaric acid vs. Caffeic acid (r = 0.81), Quercetin vs. Kaempferol (r = 0.76), and Gallic acid vs. Protocatechuic acid (r = 0.72) (Supplementary Table S4). These relationships reflect shared biosynthetic pathways and varietal expression. The complete correlation matrix is provided in Supplementary Table S4, including r values and significance levels for all compound pairs.

3.8.3. Implications for Wine Typicity and Traceability

The interpretability of machine learning models enhances their utility in food authentication. By linking algorithmic outputs to chemically meaningful features, this study proves that phenolic data can support both classification accuracy and scientific transparency. The identified markers offer a foundation for future traceability frameworks, particularly in regions like Albania, where varietal documentation is limited but chemical uniqueness is evident.
These trends underscore a broader analytical goal: to determine whether a compact set of phenolic markers can serve as chemical “fingerprints” for typifying wines, especially in small and under-represented wine-producing regions like Albania. From a practical perspective, this approach offers a scalable, lower-cost alternative to complete phenolic profiling, which is often resource-intensive and inaccessible in artisanal contexts. The observed phenolic variation suggests that even with just six compounds, supervised models can learn to distinguish wine types with interpretable chemical support, paving the way for rapid wine authentication tools and geographical traceability systems. This supports recent proposals advocating the use of polyphenol-based spectrometry and machine learning for wine typicity mapping [57,58]. The traceability potential of Albanian wines was supported by compound-level classification using phenolic profiles. Recent studies have shown that machine learning models—such as Random Forest and PCA-SVM hybrids—can reliably distinguish wines by varietal origin, vintage, and geographic provenance based on spectral and phenolic data [59]. In our dataset, compounds such as Catechin, trans-Fertaric acid, and Quercetin appeared as discriminative markers, enabling varietal-level classification with minimal misclassification. These findings align with prior work on Romanian wines, where phenolic biomarkers were successfully used to authenticate origin and support traceability frameworks [33].

3.9. Further Discussion

This study aligns with recent advances in chemometric wine authentication, reinforcing findings [24,25]. A concise set of phenolic markers—particularly trans-Fertaric acid, cis-Caftaric acid, Procyanidin B3, cis-Piceid, and Epigallocatechin—proved effective in distinguishing Albanian varietals, echoing olive oil chemo-typing approaches used to set up varietal fingerprints [23].
Our supervised pipeline achieved up to 100% LOOCV accuracy, comparable to the >98% performance of Bhardwaj et al. (2022) [25] in wine quality prediction using feature selection and robust modeling. Additional studies, such as using 1H NMR [16] and applying ML to physicochemical data [60], further confirm the integration of chemical profiling with machine learning.
Feature importance via Random Forest and SHAP analysis identified biologically plausible markers, reinforcing model interpretability and practical relevance for traceability. The convergence between unsupervised (PCA, clustering) and supervised results strengthens authenticity claims, as the same phenolics drive both classification and natural grouping.
Limitations include the small sample size (n = 26) and modest class representation, consistent with challenges noted by Vabalas et al. (2019) [43]. Future work should expand sampling across vintages and regions, incorporate independent test sets, and explore sensor-based phenolic screenings such as spectral techniques paired with ML pipelines—to scale varietal authentication in emerging wine regions.

4. Conclusions

This study presents the first machine learning-based classification of Albanian wines by grape variety using phenolic profiling. Even a compact panel of compounds—particularly trans-Fertaric acid and Procyanidin B3—enabled reliable varietal discrimination, with Support Vector Machine achieving 100% LOOCV accuracy and Random Forest/XGBoost exceeding 92%. Feature importance analysis confirmed chemical interpretability, linking key markers to hydroxycinnamate metabolism and maceration effects.
The integration of supervised and unsupervised methods provided converging evidence for varietal typicity, reinforcing the chemical distinctiveness of native Albanian grapes. Despite the small sample size (n = 26), high accuracy and interpretability were achieved through careful model tuning and permutation testing. Practically, this work lays the foundation for cost-effective wine traceability systems based on minimal phenolic fingerprints—especially valuable for under-represented regions lacking traditional authentication tools.
Future research should expand sampling across vintages and terroirs, incorporate wine color and geographic origin into classification models, and explore quality prediction for adulteration detection. Coupling chemometric models with sensor-based phenolic screening (e.g., spectral techniques) will support scalable, in-field authentication frameworks, bridging artisanal production with modern quality assurance.

Supplementary Materials

The following supporting information can be downloaded at https://www.mdpi.com/article/10.3390/analytica6040043/s1, Table S1: Phenolic data_Albanian wines 2017–2021; Table S2: Structure and metadata for all variables in the Albanian wine phenolic dataset (2017–2021); Table S3: Mann–Whitney U Test Results for Phenolic Subclasses Across Albanian Wine Varieties; Table S4: Pearson Correlation Matrix of Phenolic compounds.

Author Contributions

Conceptualization, A.T., S.S. and D.T.; Data curation, A.T., A.K., G.G., H.K. and D.T.; Formal analysis, A.K. and D.H.; Funding acquisition, D.T.; Investigation, A.T. and A.K.; Methodology, A.K. and D.H.; Project administration, S.S. and D.T.; Resources, G.G. and D.T.; Software, A.T., A.K. and D.H.; Supervision, H.K. and S.S.; Visualization, H.K. and G.G.; Writing—original draft, A.T., D.H., G.G. and D.T.; Writing–review and editing, A.T., H.K., S.S. and D.T. All authors have read and agreed to the published version of the manuscript.

Funding

This research received no external funding.

Institutional Review Board Statement

This study did not involve human participants and was therefore exempt from Institutional Review Board approval.

Informed Consent Statement

Informed consent was obtained from all subjects involved in the study. Participants were provided with detailed information about the purpose, procedures, potential risks, and benefits of the research.

Data Availability Statement

No new data were created or analyzed in this study. Data sharing is not applicable to this article.

Conflicts of Interest

The authors declare no conflicts of interest.

References

  1. Topi, D.; Guclu, G.; Kelebek, H.; Selli, S. Olive oil production in Albania, chemical characterization, and authenticity. In Olive Oil-New Perspectives and Applications; Akram, M., Ed.; IntechOpen: Rijeka, Croatia, 2021; pp. 77–95. [Google Scholar] [CrossRef]
  2. Topi, D.; Topi, A.; Guclu, G.; Selli, S.; Uzlasir, T.; Kelebek, H. Targeted analysis for detecting phenolics and authentication of Albanian wines using LC-DAD/ESI–MS/MS combined with chemometric tools. Heliyon 2024, 10, e31127. [Google Scholar] [CrossRef]
  3. Topi, D.; Arapi, D.; Seiti, B. Vine Pruning Residues and Wine Fermentation By-Products: A Non-Exploited Source of Sustainable Agriculture, Albania Case. Resources 2025, 14, 29. [Google Scholar] [CrossRef]
  4. Topi, D.; Kelebek, H.; Shehi, G.; Guclu, G.; Selli, S. Phenolic Profiling of Merlot Wines from Albania: Influence of Geographical Origin and Vintage Assessed by LC-DAD-ESI-MS/MS. Analytica 2025, 6, 31. [Google Scholar] [CrossRef]
  5. Merkytė, V.; Longo, E.; Windisch, G.; Boselli, E. Phenolic Compounds as Markers of Wine Quality and Authenticity. Foods 2020, 9, 1785. [Google Scholar] [CrossRef] [PubMed]
  6. De Luca, V. Wines. In Comprehensive Biotechnology, 3rd ed.; Moo-Young, M., Ed.; Elsevier: Oxord, UK, 2011; pp. 260–274. [Google Scholar] [CrossRef]
  7. Garrido, J.; Borges, F. Wine and grape polyphenols—A chemical perspective. Food Res. Int. 2013, 54, 1844–1858. [Google Scholar] [CrossRef]
  8. Kelebek, H.; Canbas, A.; Jourdes, M.; Teissedre, P.-L. HPLC-DAD-MS Determination of Colored and Colorless Phenolic Compounds in Kalecik Karasi Wines: Effect of Different Vineyard Locations. Anal. Lett. 2011, 44, 991–1008. [Google Scholar] [CrossRef]
  9. Gómez Gallego, M.A.; García-Carpintero, E.G.; Sánchez-Palomo, E.; González Viñas, M.A.; Hermosín-Gutiérrez, I. Evolution of the phenolic content, chromatic characteristics, and sensory properties during bottle storage of red single-cultivar wines from Castilla La Mancha region. Food Res. Int. 2013, 51, 554–563. [Google Scholar] [CrossRef]
  10. Bavaresco, L.; Lucini, L.; Busconi, M.; Flamini, R.; De Rosso, M. Wine Resveratrol: From the Ground Up. Nutrients. 2016, 8, 222. [Google Scholar] [CrossRef] [PubMed]
  11. Villano, C.; Tiziana Lisanti, M.; Gambuti, A.; Vecchio, R.; Moio, L.; Frusciante, L.; Aversano, R.; Carputo, D. Wine varietal authentication based on phenolics, volatiles and DNA markers: State of the art, perspectives and drawbacks. Food Control 2017, 80, 1–10. [Google Scholar] [CrossRef]
  12. Tzachristas, A.; Pasvanka, K.; Calokerinos, A.; Proestos, C. Polyphenols: Natural antioxidants to be used as a quality tool in wine authenticity. Appl. Sci. 2020, 10, 5908. [Google Scholar] [CrossRef]
  13. Heras-Roger, J.; Díaz-Romero, C. From Vine to Wine: Coloured Phenolics as Fingerprints. Appl. Sci. 2025, 15, 1755. [Google Scholar] [CrossRef]
  14. Monagas, M.; Bartolomé, B.; Gómez-Cordovés, C. Updated knowledge about the presence of phenolic compounds in wine. Crit. Rev. Food Sci. Nutr. 2005, 45, 85–118. [Google Scholar] [CrossRef]
  15. Waterhouse, A.L.; Sacks, G.L.; Jeffery, D.W. Understanding Wine Chemistry; John Wiley & Sons: Hoboken, NJ, USA, 2016; p. 560. [Google Scholar]
  16. Hategan, A.R.; Pirnau, A.; Magdas, D.A. Applications of Machine Learning for Wine Recognition Based on 1H NMR Spectroscopy. Beverages 2025, 11, 45. [Google Scholar] [CrossRef]
  17. Sarlo, L.; Duroux, C.; Clément, Y.; Lanteri, P.; Rossetti, F.; David, O.; Tillement, A.; Gillet, P.; Hagège, A.; Laurent, D.; et al. Enhancing wine authentication: Leveraging 12,000+ international mineral wine profiles and artificial intelligence for accurate origin and variety prediction. OENO One 2024, 58. [Google Scholar] [CrossRef]
  18. Zaza, S.; Atemkeng, M.; Hamlomo, S. Wine feature importance and quality prediction: A comparative study of machine learning algorithms with unbalanced data. arXiv 2023, arXiv:2310.01584. [Google Scholar] [CrossRef]
  19. Aiello, G. An Artificial Intelligence-based tool to predict “unhealthy” wine and olive oil. J. Agric. Food Res. 2024, 16, 101179. [Google Scholar] [CrossRef]
  20. Llupa, J.; Gašić, U.; Brčeski, I.; Demertzis, P.; Tešević, V.; Topi, D. LC-MS/MS characterization of phenolic compounds in the quince (Cydonia oblonga Mill.) and sweet cherry (Prunus avium L.) fruit juices. Agric. For. 2022, 68, 193–205. [Google Scholar] [CrossRef]
  21. Topi, D.; Kelebek, H.; Güçlü, G.; Selli, S. LC DAD ESI MS/MS characterization of phenolic compounds in wines from Vitis vinifera’ Shesh i bardhë’ and ‘Vlosh’ cultivars. J. Food Process. Preserv. 2022, 46, e16157. [Google Scholar] [CrossRef]
  22. Pedregosa, F.; Varoquaux, G.; Gramfort, A.; Michel, V.; Thirion, B.; Grisel, O.; Blondel, M.; Prettenhofer, P.; Weiss, R.; Dubourg, V.; et al. Scikit-learn: Machine Learning in Python. J. Mach. Learn. Res. 2012, 12, 2825–2830. [Google Scholar]
  23. Topi, A.; Këlliçi, E.; Hudhra, D.; Topi, D. A machine learning-based classification of monocultivar olive oils—Specifically Kalinjot, Ulli i bardhë Tirana, and Mixan—Comparing their chemical composition. Edelweiss Appl. Sci. Technol. 2025, 9, 93–110. [Google Scholar] [CrossRef]
  24. Topi, D.; Topi, A.; Hudhra, D. Application of machine learning algorithmic models for the authentication of Albanian mono cultivar olive oils. J. Inf. Syst. Eng. Manag. 2025, 10, 486–507. [Google Scholar] [CrossRef]
  25. Bhardwaj, P.; Tiwari, P.; Olejar, K.; Parr, W.; Kulasiri, D. A machine learning application in wine quality prediction. Mach. Learn. Appl. 2022, 8, 100261. [Google Scholar] [CrossRef]
  26. Gutiérrez-Escobar, R.; Aliaño-González, M.J.; Cantos-Villar, E. Wine Polyphenol Content and Its Influence on Wine Quality and Properties: A Review. Molecules 2021, 26, 718. [Google Scholar] [CrossRef]
  27. Piljac, J.; Martinez, S.; Valek, L.; Stipcevic, T.; Maletic, E. Influence of maceration time on the polyphenolic composition and antioxidant capacity of Plavac Mali wine. Food Technol. Biotechnol. 2005, 43, 219–225. [Google Scholar]
  28. Chira, K.; Pacella, N.; Jourdes, M.; Teissedre, P.-L. Chemical and sensory evaluation of Bordeaux wines (Cabernet-Sauvignon and Merlot) and correlation with wine age. Food Chem. 2011, 126, 1971–1977. [Google Scholar] [CrossRef]
  29. Branco, Z.; Baptista, F.; Paié Ribeiro, J.; Gouvinhas, I.; Barros, A.N. Impact of Winemaking Techniques on the Phenolic Composition and Antioxidant Properties of Touriga Nacional Wines. Molecules 2025, 30, 1601. [Google Scholar] [CrossRef]
  30. Jiang, B.; Zhang, Z.; Li, X. Comparison of phenolic compounds and antioxidant activities of red wines from different grape cultivars and vintages in China. J. Food Sci. 2012, 77, C614–C620. [Google Scholar]
  31. Santoro, V.; Di Renzo, G.C.; Carradori, S. Phenolic composition of international red wines: A comprehensive meta-analysis. Antioxidants 2020, 9, 200. [Google Scholar]
  32. Rapa, M.; Di Fabio, M.; Boccacci Mariani, M.; Giannetti, V. Characterization of Native Sicilian Wines by Phenolic Contents, Antioxidant Activity, and Chemometrics. Molecules 2025, 30, 534. [Google Scholar] [CrossRef]
  33. Ciucure, C.T.; Miricioiu, M.G.; Geana, E.I. Discrimination of Romanian Wines Based on Phenolic Composition and Identification of Potential Phenolic Biomarkers for Wine Authenticity and Traceability. Beverages 2025, 11, 44. [Google Scholar] [CrossRef]
  34. Clarke, S.; Bosman, G.; du Toit, W.; Aleixandre-Tudo, J.L. White wine phenolics: Current methods of analysis. J. Sci. Food Agric. 2023, 103, 7–25. [Google Scholar] [CrossRef]
  35. Di, S.; Yang, Y. Prediction of red wine quality using one-dimensional convolutional neural networks. arXiv 2023, arXiv:2208.14008. [Google Scholar] [CrossRef]
  36. Proestos, C.; Bakogiannis, A.; Komaitis, M. Determination of Phenolic Compounds in Wines. Int. J. Food Stud. 2012, 1, 33–41. [Google Scholar] [CrossRef]
  37. Stój, A.; Czernecki, T.; Domagała, D. Authentication of Polish Red Wines Produced from Zweigelt and Rondo Grape Varieties Based on Volatile Compounds Analysis in Combination with Machine Learning Algorithms: Hotrienol as a Marker of the Zweigelt Variety. Molecules 2023, 28, 1961. [Google Scholar] [CrossRef]
  38. Chawla, N.V.; Bowyer, K.W.; Hall, L.O.; Kegelmeyer, W.P. SMOTE: Synthetic Minority Over-sampling Technique. J. Artif. Intell. Res. 2002, 16, 321–357. [Google Scholar] [CrossRef]
  39. Bengio, Y.; Grandvalet, Y. No Unbiased Estimator of the Variance of K-Fold Cross-Validation. J. Mach. Learn. Res. 2004, 5, 1089–1105. [Google Scholar]
  40. Berrar, D. Cross-validation. In Encyclopedia of Bioinformatics and Computational Biology; Ranganathan, S., Gribskov, M., Nakai, K., Schönbach, C., Eds.; Elsevier: Amsterdam, The Netherlands, 2019; Volume 1, pp. 542–545. [Google Scholar] [CrossRef]
  41. Raschka, S. Model evaluation, model selection, and algorithm selection in machine learning. arXiv 2020, arXiv:1811.12808. [Google Scholar] [CrossRef]
  42. Mazurowski, M.A.; Habas, P.A.; Zurada, J.M.; Lo, J.Y.; Baker, J.A.; Tourassi, G.D. Training neural network classifiers for medical decision making: The effects of imbalanced datasets on classification performance. Neural Netw. 2008, 21, 427–436. [Google Scholar] [CrossRef]
  43. Vabalas, A.; Gowen, E.; Poliakoff, E.; Casson, A.J. Machine learning algorithm validation with a limited sample size. PLoS ONE 2019, 14, e0224365. [Google Scholar] [CrossRef]
  44. Kohavi, R. A Study of Cross-Validation and Bootstrap for Accuracy Estimation and Model Selection. Int. Jt. Conf. Artif. Intell. 1995, 14, 1137–1145. Available online: https://www.ijcai.org/Proceedings/95-2/Papers/016.pdf (accessed on 20 July 2025).
  45. Tsamardinos, I.; Greasidou, E.; Tsagris, M.; Borboudakis, G. Bootstrapping the out-of-sample predictions for efficient and accurate cross-validation. arXiv 2017, arXiv:1708.07180. [Google Scholar] [CrossRef]
  46. Shan, G. Monte Carlo cross-validation for a study with a binary outcome and a limited sample size. BMC Med. Inform. Decis. Mak. 2022, 22, 270. [Google Scholar] [CrossRef]
  47. Du, J.-H.; Patil, P.; Roeder, K.; Kuchibhotla, A.K. Extrapolated cross-validation for randomized ensembles. arXiv 2023, arXiv:2302.13511. [Google Scholar] [CrossRef]
  48. Gorriz, J.M.; Martin Clemente, R.; Segovia, F.; Ramírez, J.; Ortiz, A.; Suckling, J. Is k-fold cross-validation the best model selection method for Machine Learning? arXiv 2024, arXiv:2401.16407. [Google Scholar]
  49. Bergstra, J.; Bengio, Y. Random search for hyper-parameter optimization. J. Mach. Learn. Res. 2012, 13, 281–305. [Google Scholar]
  50. Scikit-Learn Developers. Grid Search Documentation. 2023. Available online: https://scikit-learn.org/stable/modules/grid_search.html (accessed on 20 July 2025).
  51. Probst, P.; Wright, M.N.; Boulesteix, A.L. Hyperparameters and tuning strategies for random forest. Wiley Interdiscip. Rev. Data Min. Knowl. Discov. 2019, 9, e1301. [Google Scholar] [CrossRef]
  52. Kuhn, M.; Johnson, K. Applied Predictive Modeling; Springer: New York, NY, USA, 2013. [Google Scholar] [CrossRef]
  53. Eder, R.; Pajović Šćepanović, R.; Raičević, D.; Popović, T.; Korntheuer, K.; Wendelin, S.; Forneck, A.; Philipp, C. Effects of climatic conditions on phenolic content and antioxidant activity of Austrian and Montenegrin red wines. OENO One 2023, 57, 69–85. [Google Scholar] [CrossRef]
  54. Mollica, A.; Scioli, G.; Della Valle, A.; Cichelli, A.; Novellino, E.; Bauer, M.; Kamysz, W.; Llorent-Martínez, E.J.; Fernández-de Córdova, M.L.; Castillo-López, R.; et al. Phenolic analysis and in vitro biological activity of red wine, pomace and grape seed oil derived from Vitis vinifera L. cv. Montepulciano d’Abruzzo. Antioxidants 2021, 10, 1704. [Google Scholar] [CrossRef] [PubMed]
  55. Arseni, A.; Crudu, S. The role of procyanidins in grapes and wines: Effects on quality and composition. J. Eng. Sci. 2025, 31, 175–192. [Google Scholar] [CrossRef]
  56. García Estévez, I.; Ramos Pineda, A.M.; Escribano Bailón, M.T. Interactions between wine phenolic compounds and human saliva in astringency perception: A review. Food Funct. 2018, 9, 1294–1309. [Google Scholar] [CrossRef]
  57. Lorrain, B.; Ky, I.; Pechamat, L.; Teissedre, P.-L. Evolution of Analysis of Polyphenols from Grapes, Wines, and Extracts. Molecules 2013, 18, 1076–1100. [Google Scholar] [CrossRef] [PubMed]
  58. Jordão, A.M.; Correia, A.C.; Martins, B.; Romão, A.; Oliveira, B. General physicochemical parameters, phenolic composition, and varietal aromatic potential of three red Vitis vinifera varieties “Merlot”, “Syrah”, and “Saborinho” cultivated on Pico Island—Azores Archipelago. Int. J. Plant Biol. 2024, 15, 1369–1390. [Google Scholar] [CrossRef]
  59. Ranaweera, R.K.; Gilmore, A.M.; Bastian, S.E.; Capone, D.L.; Jeffery, D.W. Spectrofluorometric analysis to trace the molecular fingerprint of wine during the winemaking process and recognise the blending percentage of different varietal wines. OENO One 2022, 56, 189–196. [Google Scholar] [CrossRef]
  60. Dahal, K.R.; Dahal, J.N.; Banjade, H.B.; Gaire, S.G. Prediction of Wine Quality Using Machine Learning Algorithms. Open J. Stat. 2021, 11, 278–289. [Google Scholar] [CrossRef]
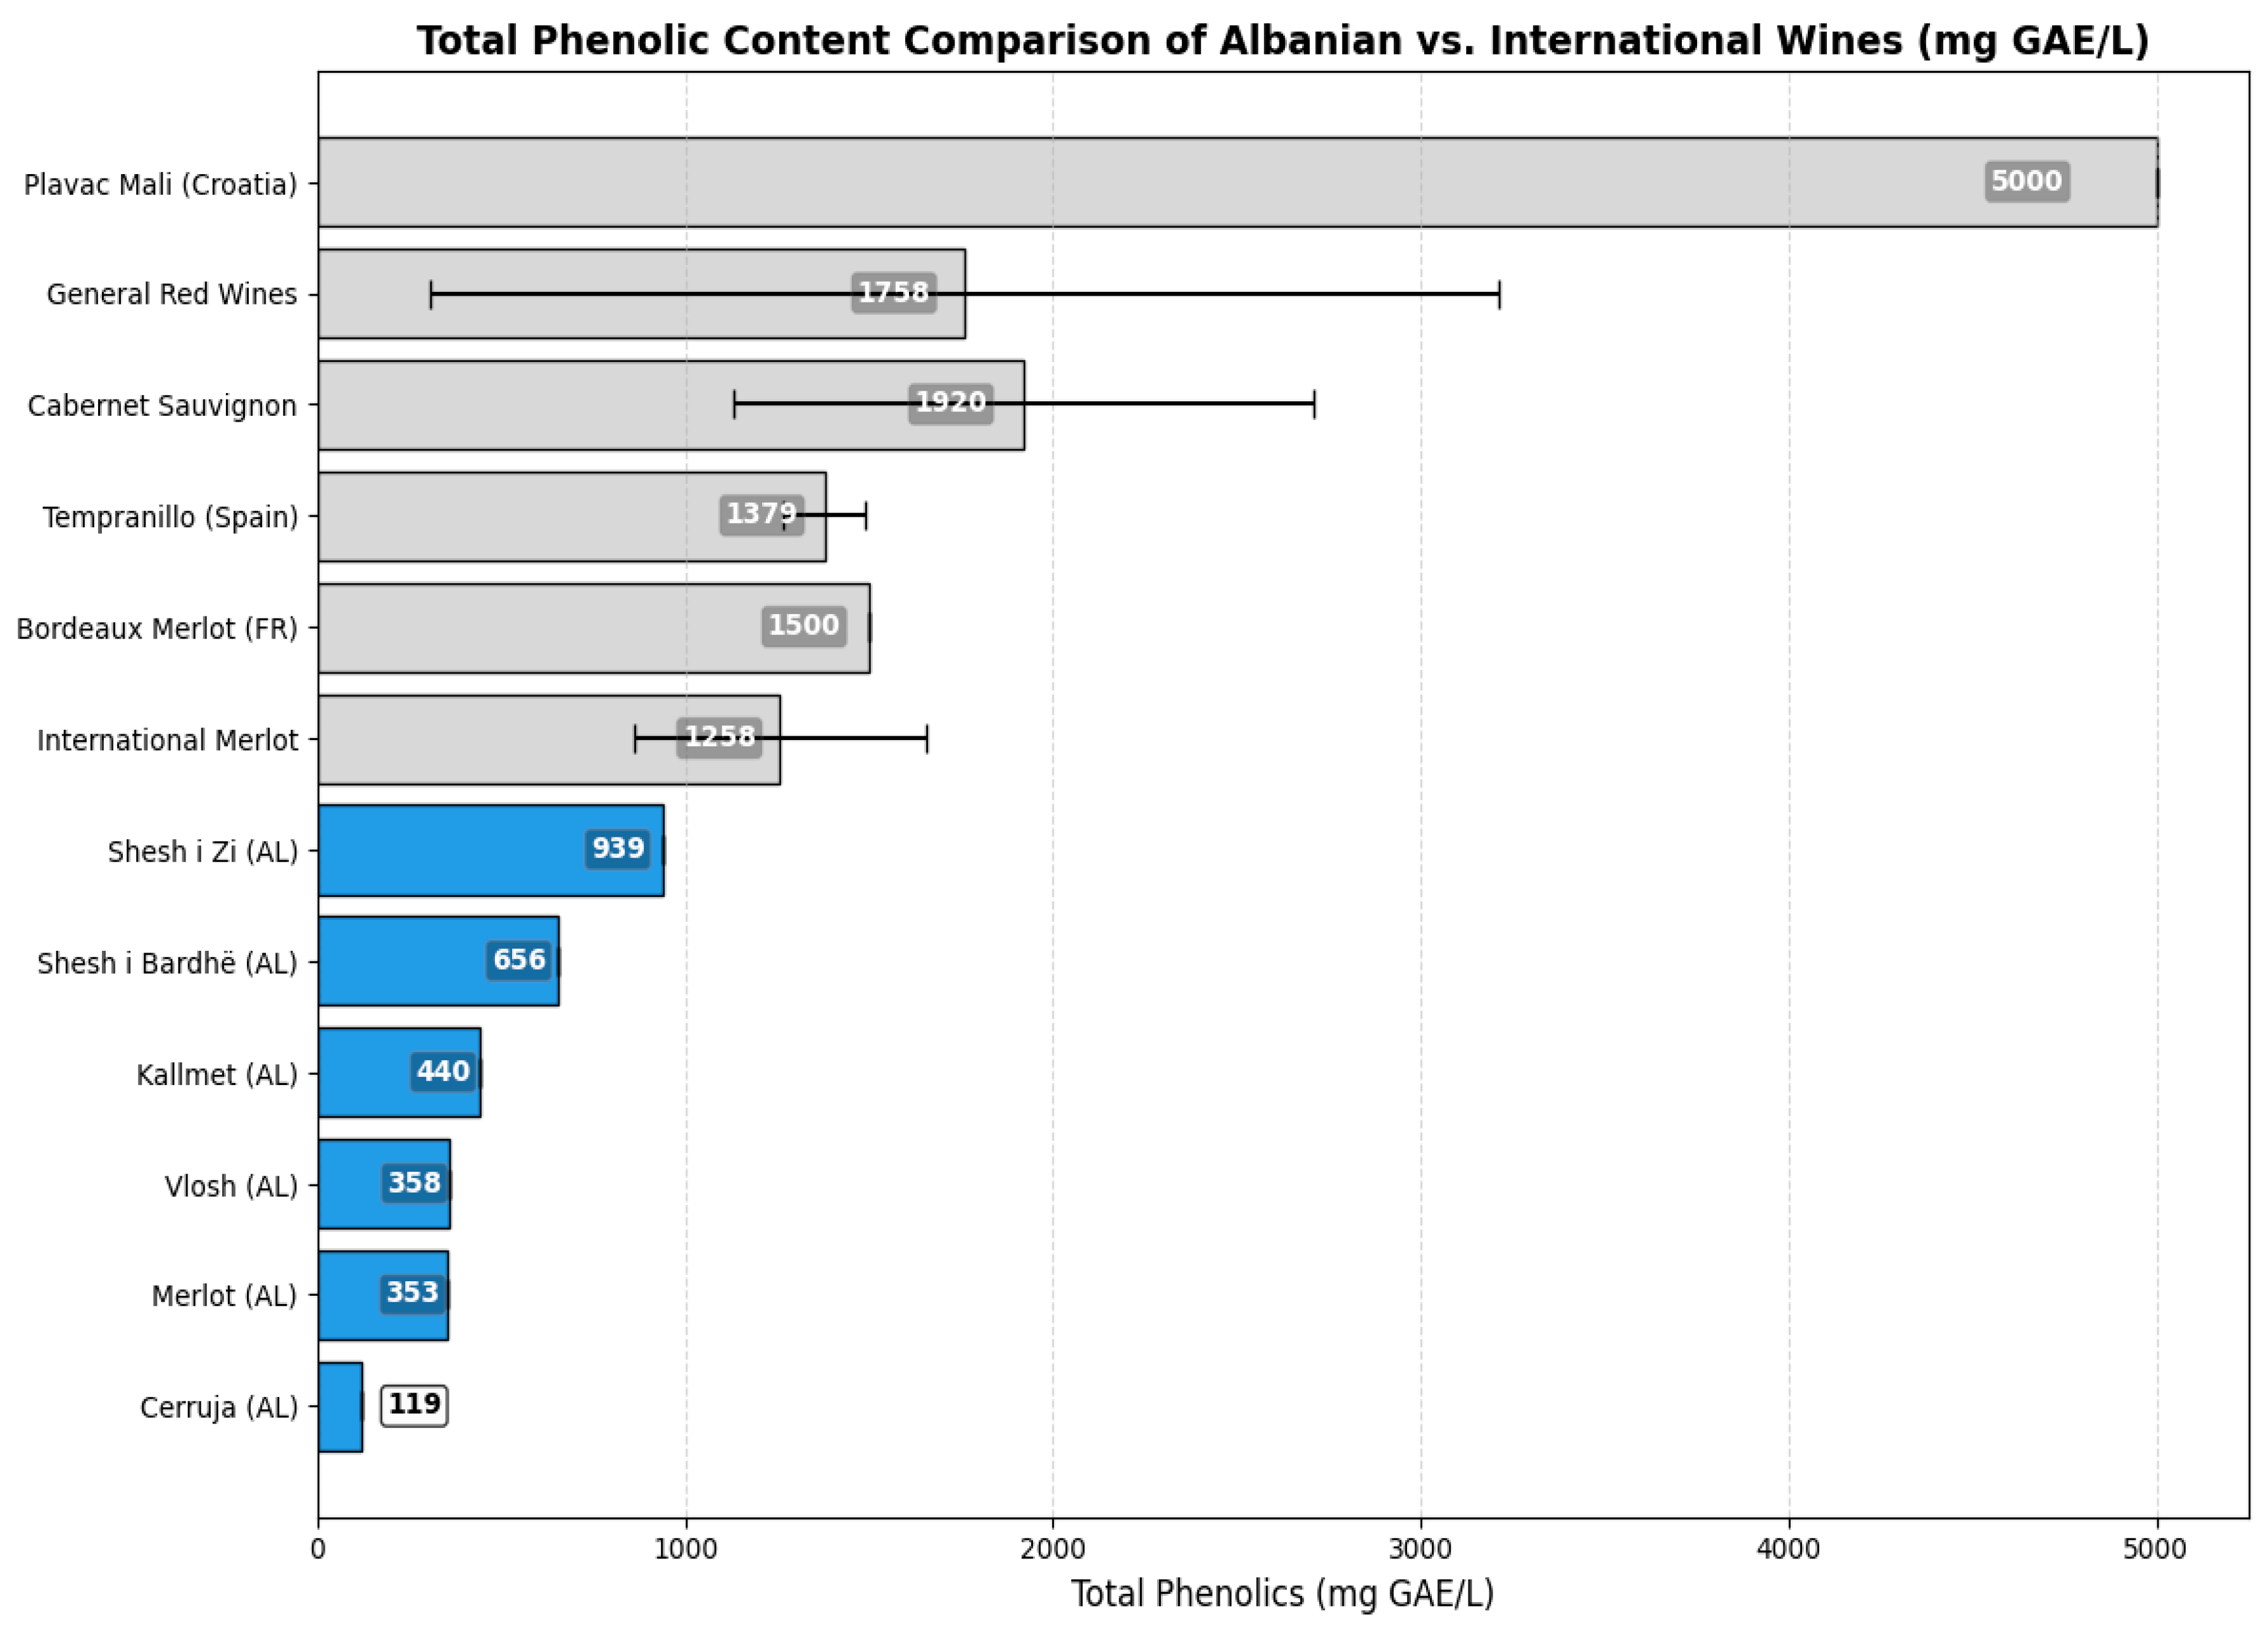
Figure 1. Total Phenolic Content comparison of Albanian vs. International Wines, in Gallic Acid Equivalency (GAE mg/L), grey color-represent wines belonging to international varieties, and blue color, Albanian grape varieties.
Analytica 06 00043 g001
Figure 2. The Boxplot of Total Phenolics (µg/mL) versus Wine Type.
Analytica 06 00043 g002
Figure 3. Average Phenolic Subfamilies for different wines according to variety (Barplot).
Analytica 06 00043 g003
Figure 4. PCA Scree Plot showing variance explained by each component. Blue dots indicate individual variance, while the dashed line shows cumulative variance.
Analytica 06 00043 g004
Figure 5. PCA Score Plot for Monocultivar wines (Kallmet, Shesh i zi, Merlot, Shesh i bardhë).
Analytica 06 00043 g005
Figure 6. Heatmap of Total Phenolic Subfamilies.
Analytica 06 00043 g006
Figure 7. Pearson Correlation Matrix of 31 Phenolic Compounds.
Analytica 06 00043 g007
Figure 8. Correlation Matrix: Phenolic Subfamilies & Total Phenolics.
Analytica 06 00043 g008
Figure 9. Hierarchical Clustering Dendrogram of Wine Samples, with each color highlighting a varietal cluster.
Analytica 06 00043 g009
Figure 10. Confusion matrix of the Support Vector Machine (SVM) model, showing perfect classification of all grapevine varieties. Identical performance was observed across all five classifiers, with only diagonal elements greater than zero and all off-diagonal elements equal to 0, indicating no misclassifications.
Analytica 06 00043 g010
Figure 11. Macro-averaged ROC curve for XGBoost, showing an AUC of 1.00 and confirming the model’s perfect discriminative performance in a one-vs-rest classification setting.
Analytica 06 00043 g011
Figure 12. Top 10 Important Phenolic Compounds (Random Forest).
Analytica 06 00043 g012
Figure 13. On the right, there is a parallel coordinates plot showing the distribution of the six most important phenolic compounds (trans-Fertaric acid, trans-Caftaric acid, cis-Caftaric acid, Procyanidin B3, cis-Piceid, Epigallocatechin) across different wines.
Analytica 06 00043 g013
Table 1. Mann–Whitney U Test Results for Phenolic Subclasses.
ComparisonPhenolic SubclassU Statisticp-ValueSignificance (α = 0.05)
Shesh i zi vs. MerlotHydroxybenzoic acids + flavanols0.00.0022Significant
Shesh i zi vs. MerlotTotal Phenolic acids0.00.0022Significant
Shesh i zi vs. MerlotTotal Flavonols0.00.0022Significant
Shesh i zi vs. MerlotTotal Resveratrols0.00.0022Significant
Shesh i zi vs. KallmetHydroxybenzoic acids + flavanols0.00.0017Significant
Shesh i zi vs. Shesh i bardhëHydroxybenzoic acids + flavanols0.00.0017Significant
Shesh i bardhë vs. CerrujeAll subclasses0.00.0286Significant
Red vs. white winesAll subclasses0.00.0001Highly Significant
Table 2. Total Phenolics of Selected Wines with Citation & Interpretation.
Wine TypeTotal Phenolics (mg GAE/L)CitationInterpretive Comment
Shesh i zi (AL)939wine dataset, 2017–2021A local Albanian red wine, Shesh i zi, exhibited strong phenolic intensity, reflecting native varietal richness and moderate oxidative stability.
Shesh i bardhë (AL)656wine dataset, 2017–2021The white variety Shesh i bardhë showed phenolic levels characteristic of light-colored wines, aligning with global white wine trends.
Vlosh (AL)358wine dataset, 2017–2021Vlosh, an autochthonous variety, demonstrated robust phenolic content, supporting its historic use in regional red blends.
Cerruje (AL)119wine dataset, 2017–2021Cerruja displayed moderate phenolic richness, possibly influenced by vintage and microclimate variations.
Merlot (AL)353wine dataset, 2017–2021Albanian Merlot samples had phenolic values in line with European counterparts, validating local vinification standards.
International Merlot860–1656[30]Total phenol contents range (mg GAE/L)
General Red Wines305–3210[31]Phenolic concentrations in global red wines are highly variable, spanning over an order of magnitude, and influenced by winemaking style and grape chemistry.
Plavac Mali (Croatia)~5000[27]Plavac Mali stood out with ~5 g/L phenolics, attributed to thick grape skins and traditional extended maceration practices.
Bordeaux Merlot (FR)~1500[28]Bordeaux-region Merlot wines showed intermediate total phenolics, shaped by climate and controlled fermentation processes.
Cabernet Sauvignon1129–2710[30]Widely cultivated Cabernet Sauvignon exhibited some of the highest phenolic levels among commercial reds, often exceeding 2 g/L.
Table 3. Average ROC-AUC, F1-Score, and Accuracy for Each Model (3-Fold CV).
ModelROC-AUCF1-ScoreAccuracy
Random Forest0.99070.93750.9259
SVM1.00001.00001.0000
KNN0.93600.52080.5370
Logistic Regression1.00000.90200.8889
XGBoost1.00000.89310.8843
Table 4. LOOCV Classification Accuracy and Permutation Test Results for Each Model. LOOCV accuracy and statistical significance of supervised classifiers in predicting grapevine cultivar based on phenolic compound profiles. All models performed significantly better than chance based on 1000-iteration permutation testing.
ModelLOOCV AccuracyPermutation p-Value
SVM1.00000.0010
Random Forest0.96150.0010
Logistic Regression0.96150.0010
KNN0.92310.0010
XGBoost0.92310.0010
Disclaimer/Publisher’s Note: The statements, opinions and data contained in all publications are solely those of the individual author(s) and contributor(s) and not of MDPI and/or the editor(s). MDPI and/or the editor(s) disclaim responsibility for any injury to people or property resulting from any ideas, methods, instructions or products referred to in the content.