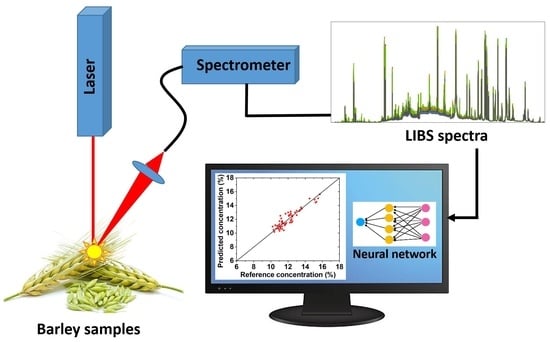
Rapid Spectroscopic Analysis for Food and Feed Quality Control: Prediction of Protein and Nutrient Content in Barley Forage Using LIBS and Chemometrics
Abstract
1. Introduction
2. Materials and Methods
2.1. Sample Preparation
2.2. Chemical Composition
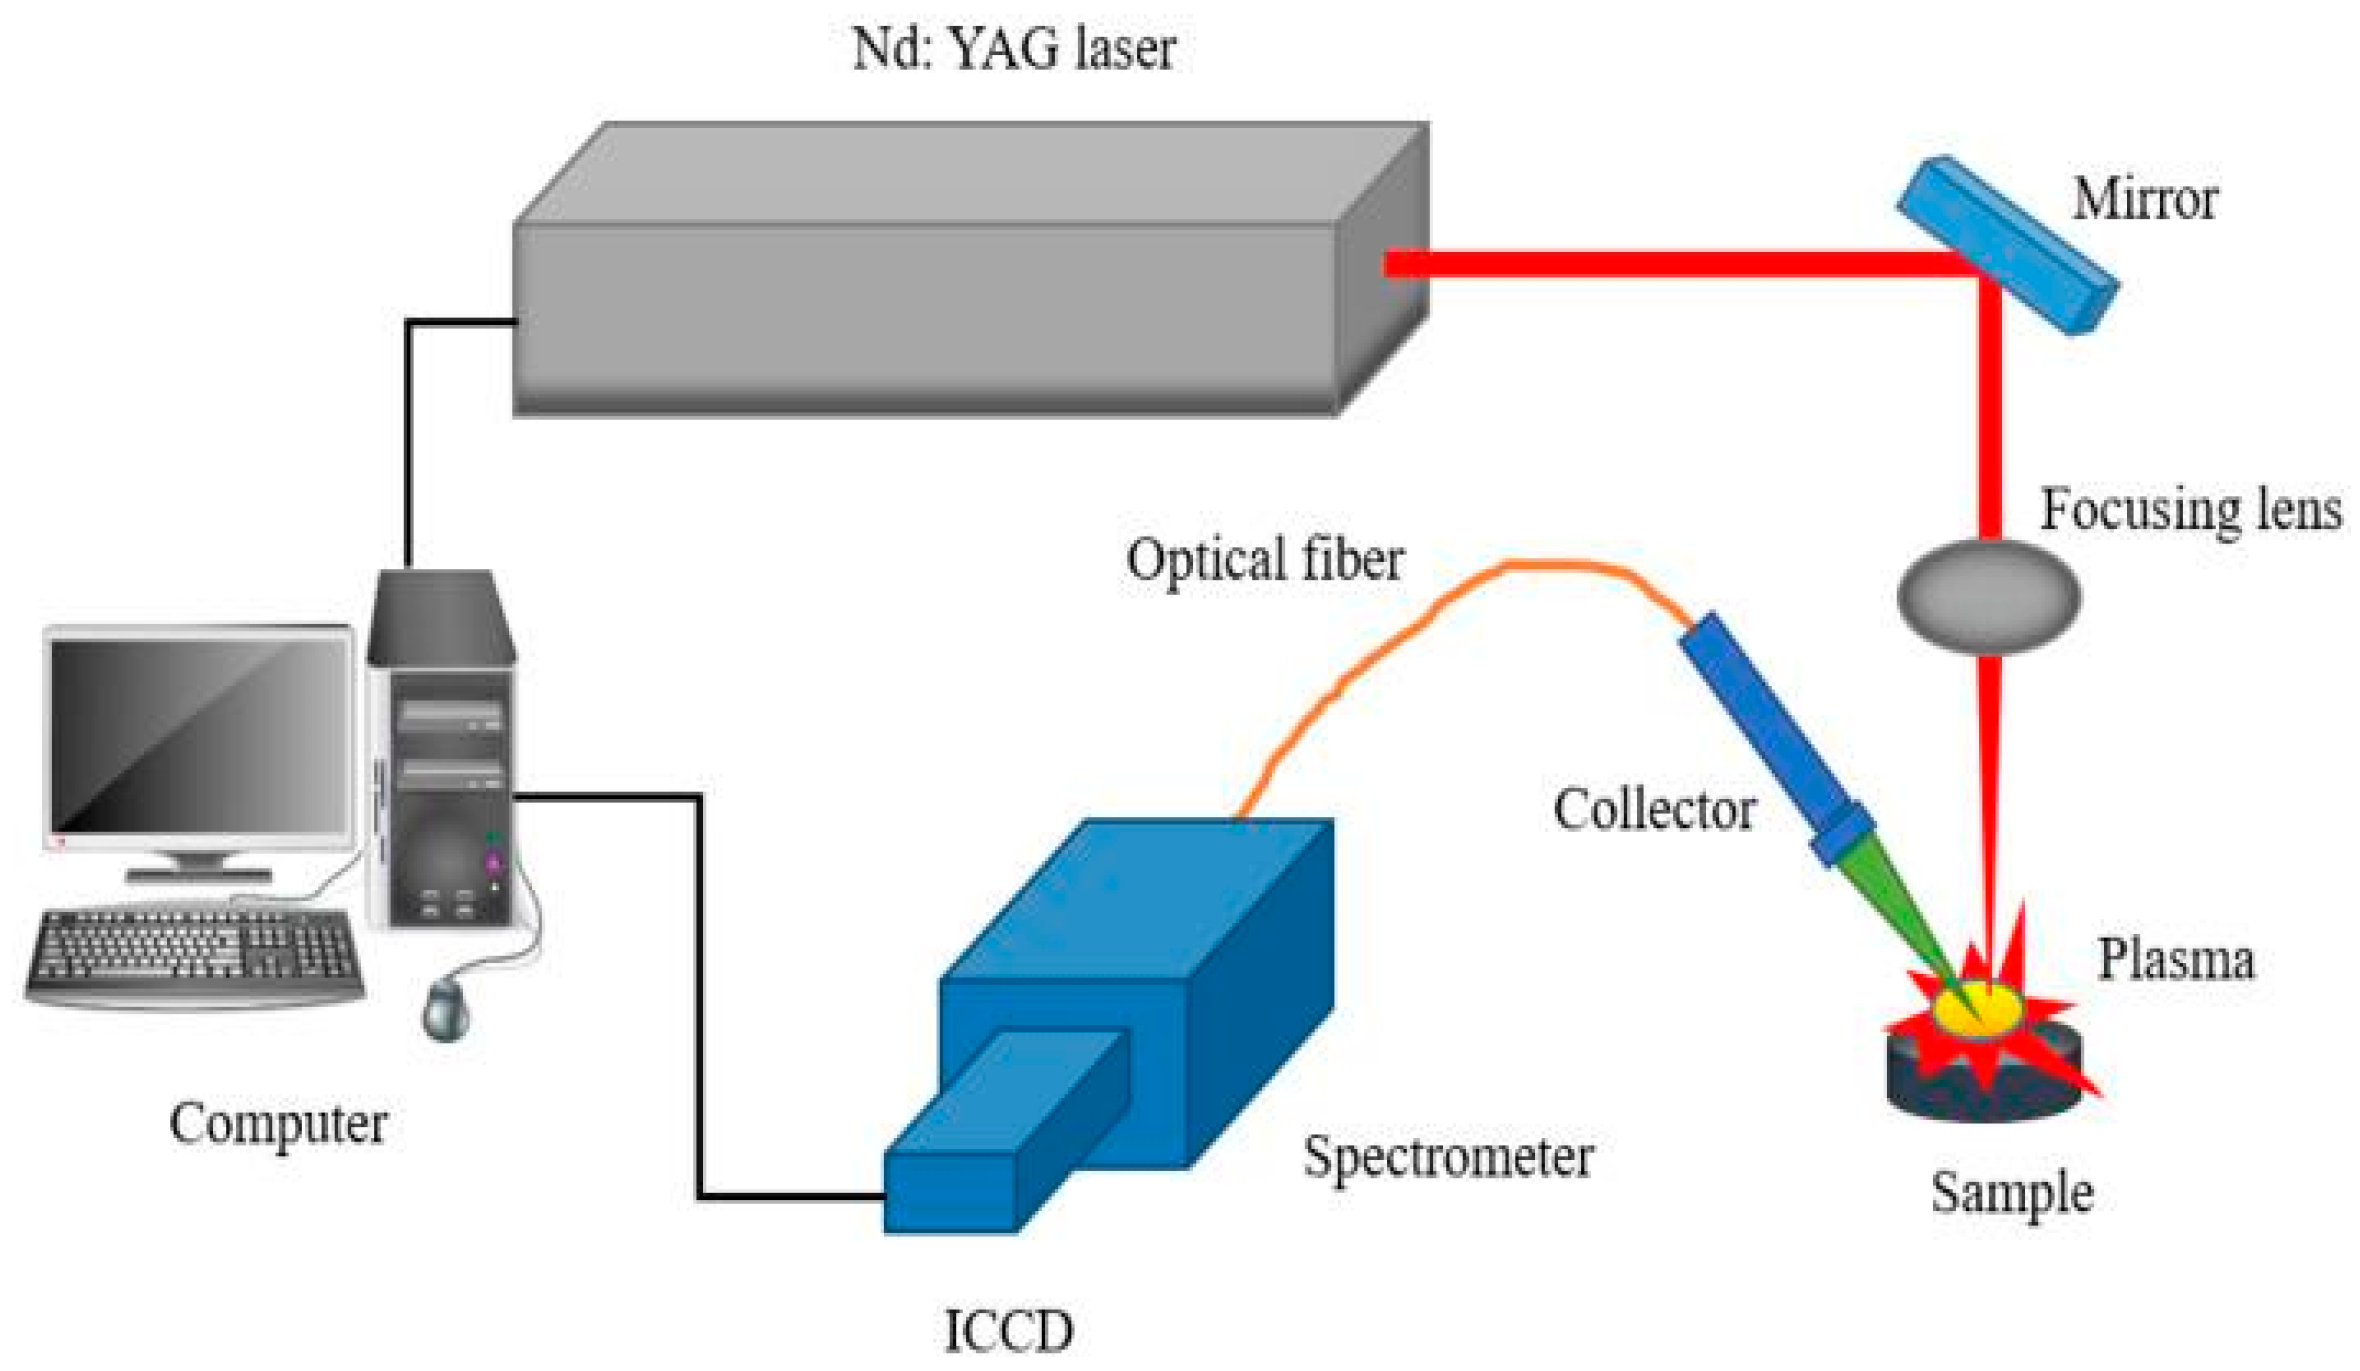
2.3. LIBS Experimental Setup
2.4. Spectral Preprocessing and Variable Selection
2.5. Quantitative Analysis: PLS and ELM Modeling
2.5.1. Partial Least Squares (PLS) Regression
2.5.2. Extreme Learning Machine (ELM)
2.6. Model Evaluation
- RPD < 1.5: Not usable for analysis;
- 1.5 ≤ RPD < 2.0: Fair, can distinguish high/low values;
- 2.0 ≤ RPD < 2.5: Acceptable for rough screening;
- 2.5 ≤ RPD < 3.0: Good, suitable for approximate prediction;
- RPD ≥ 3.0: Excellent, reliable for quantitative use.
3. Results
3.1. LIBS Spectra Processing and PCA Analysis
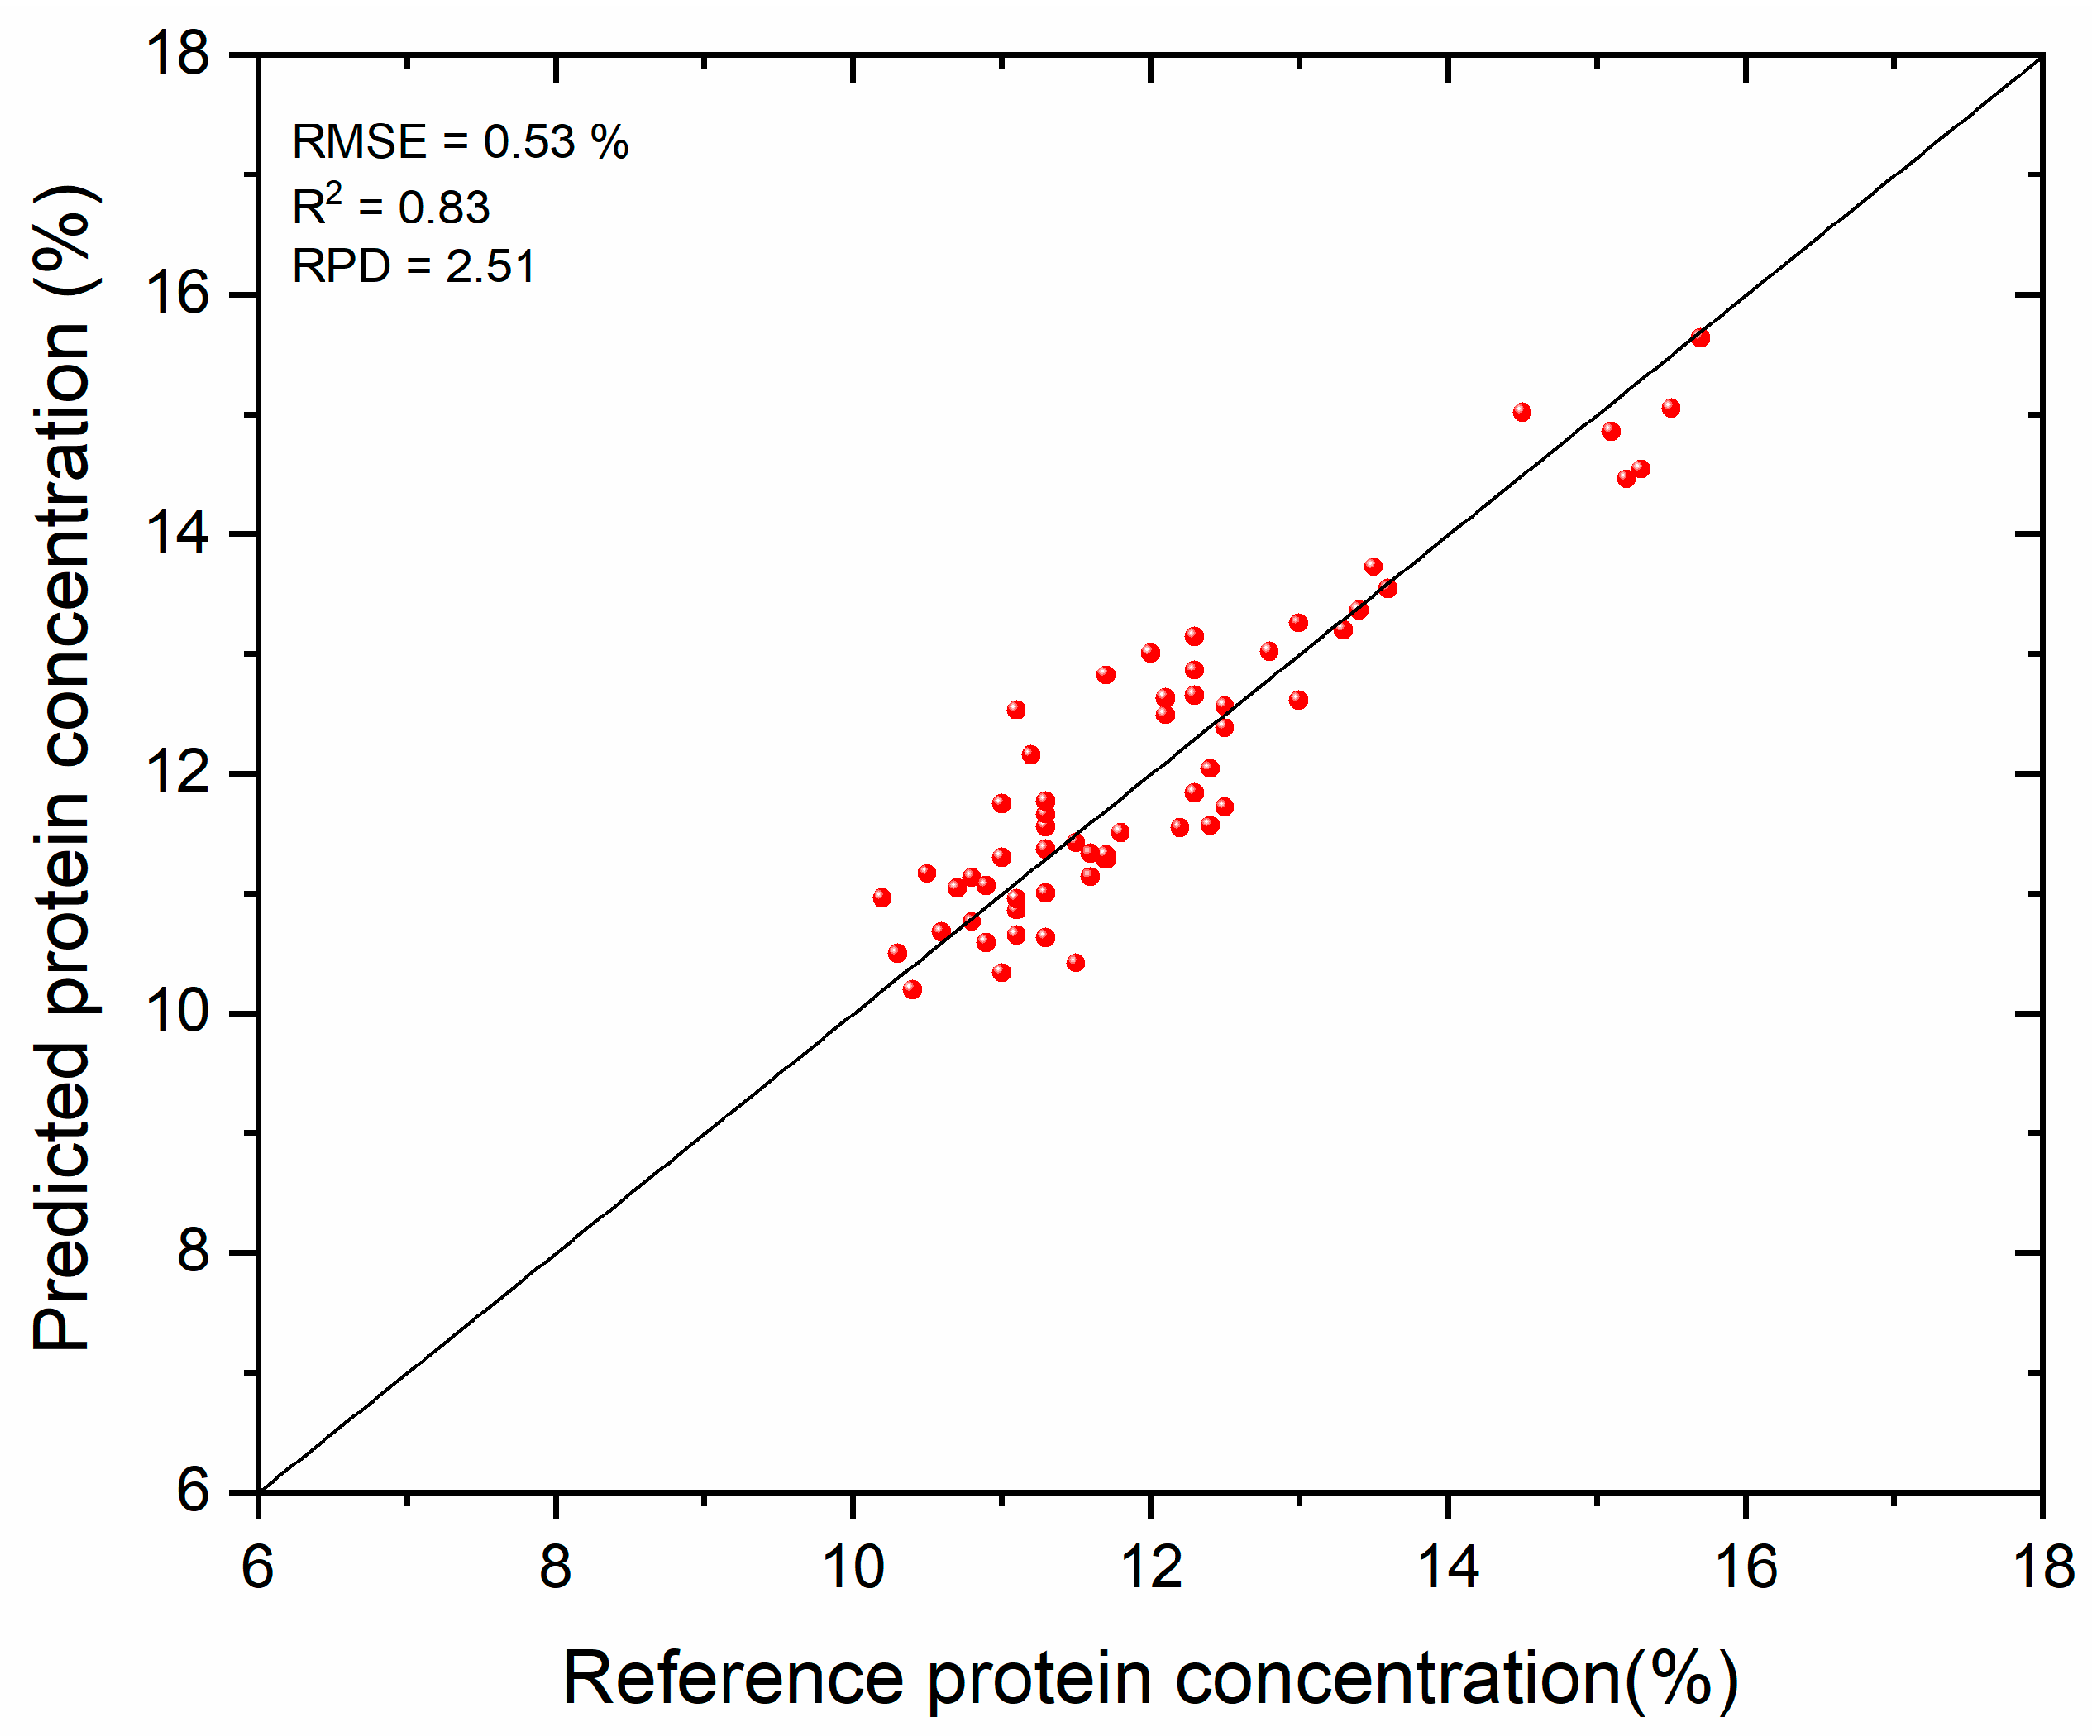
3.2. Protein Prediction Results
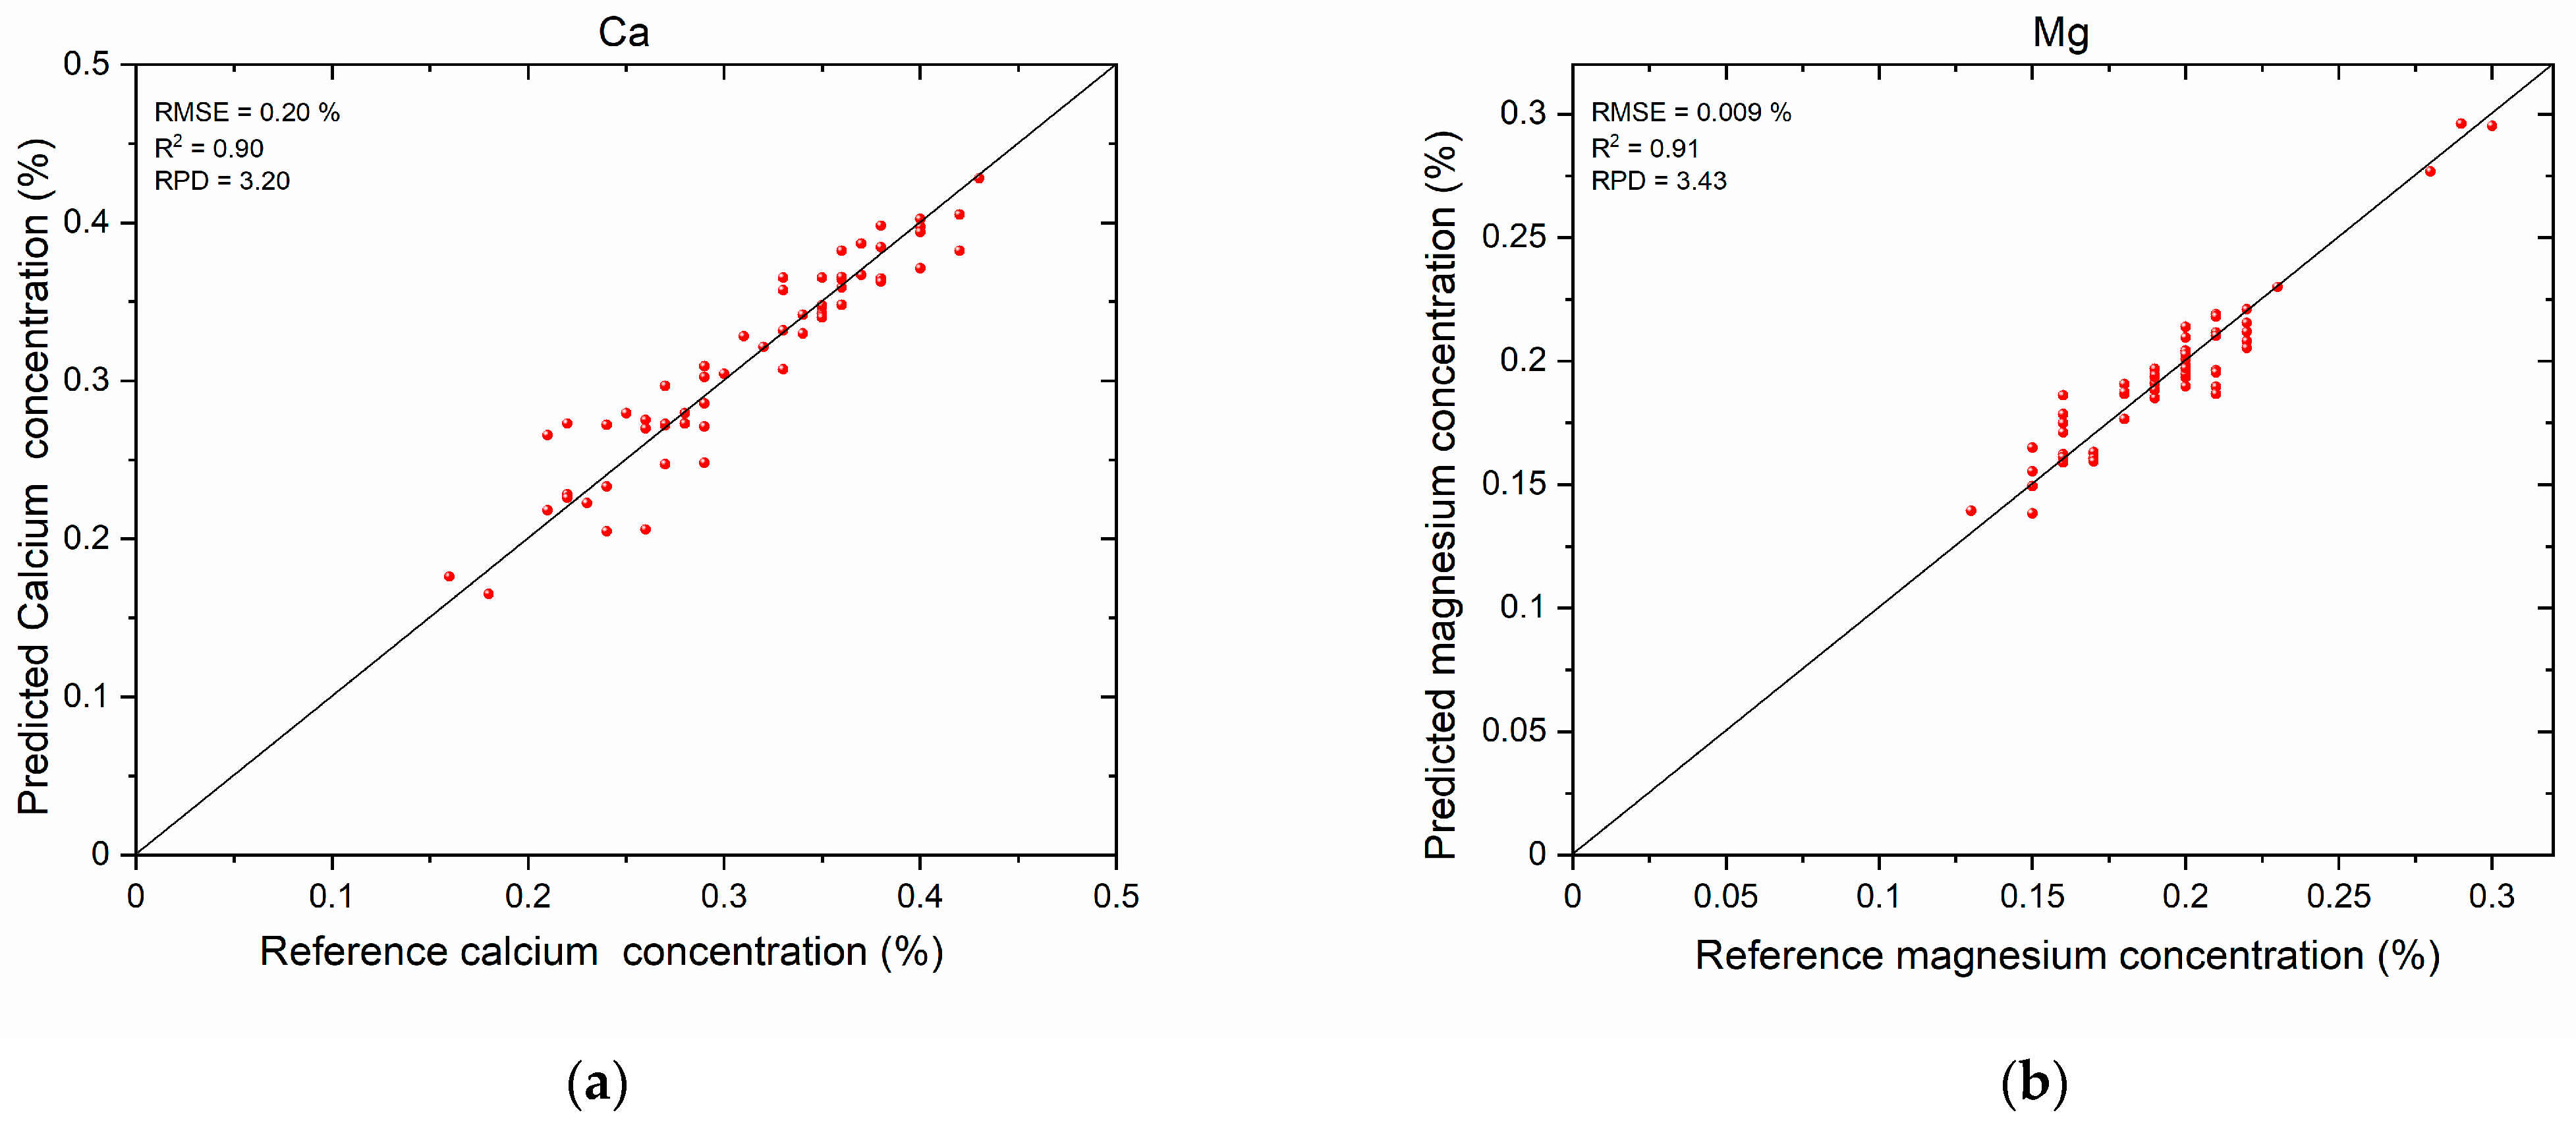
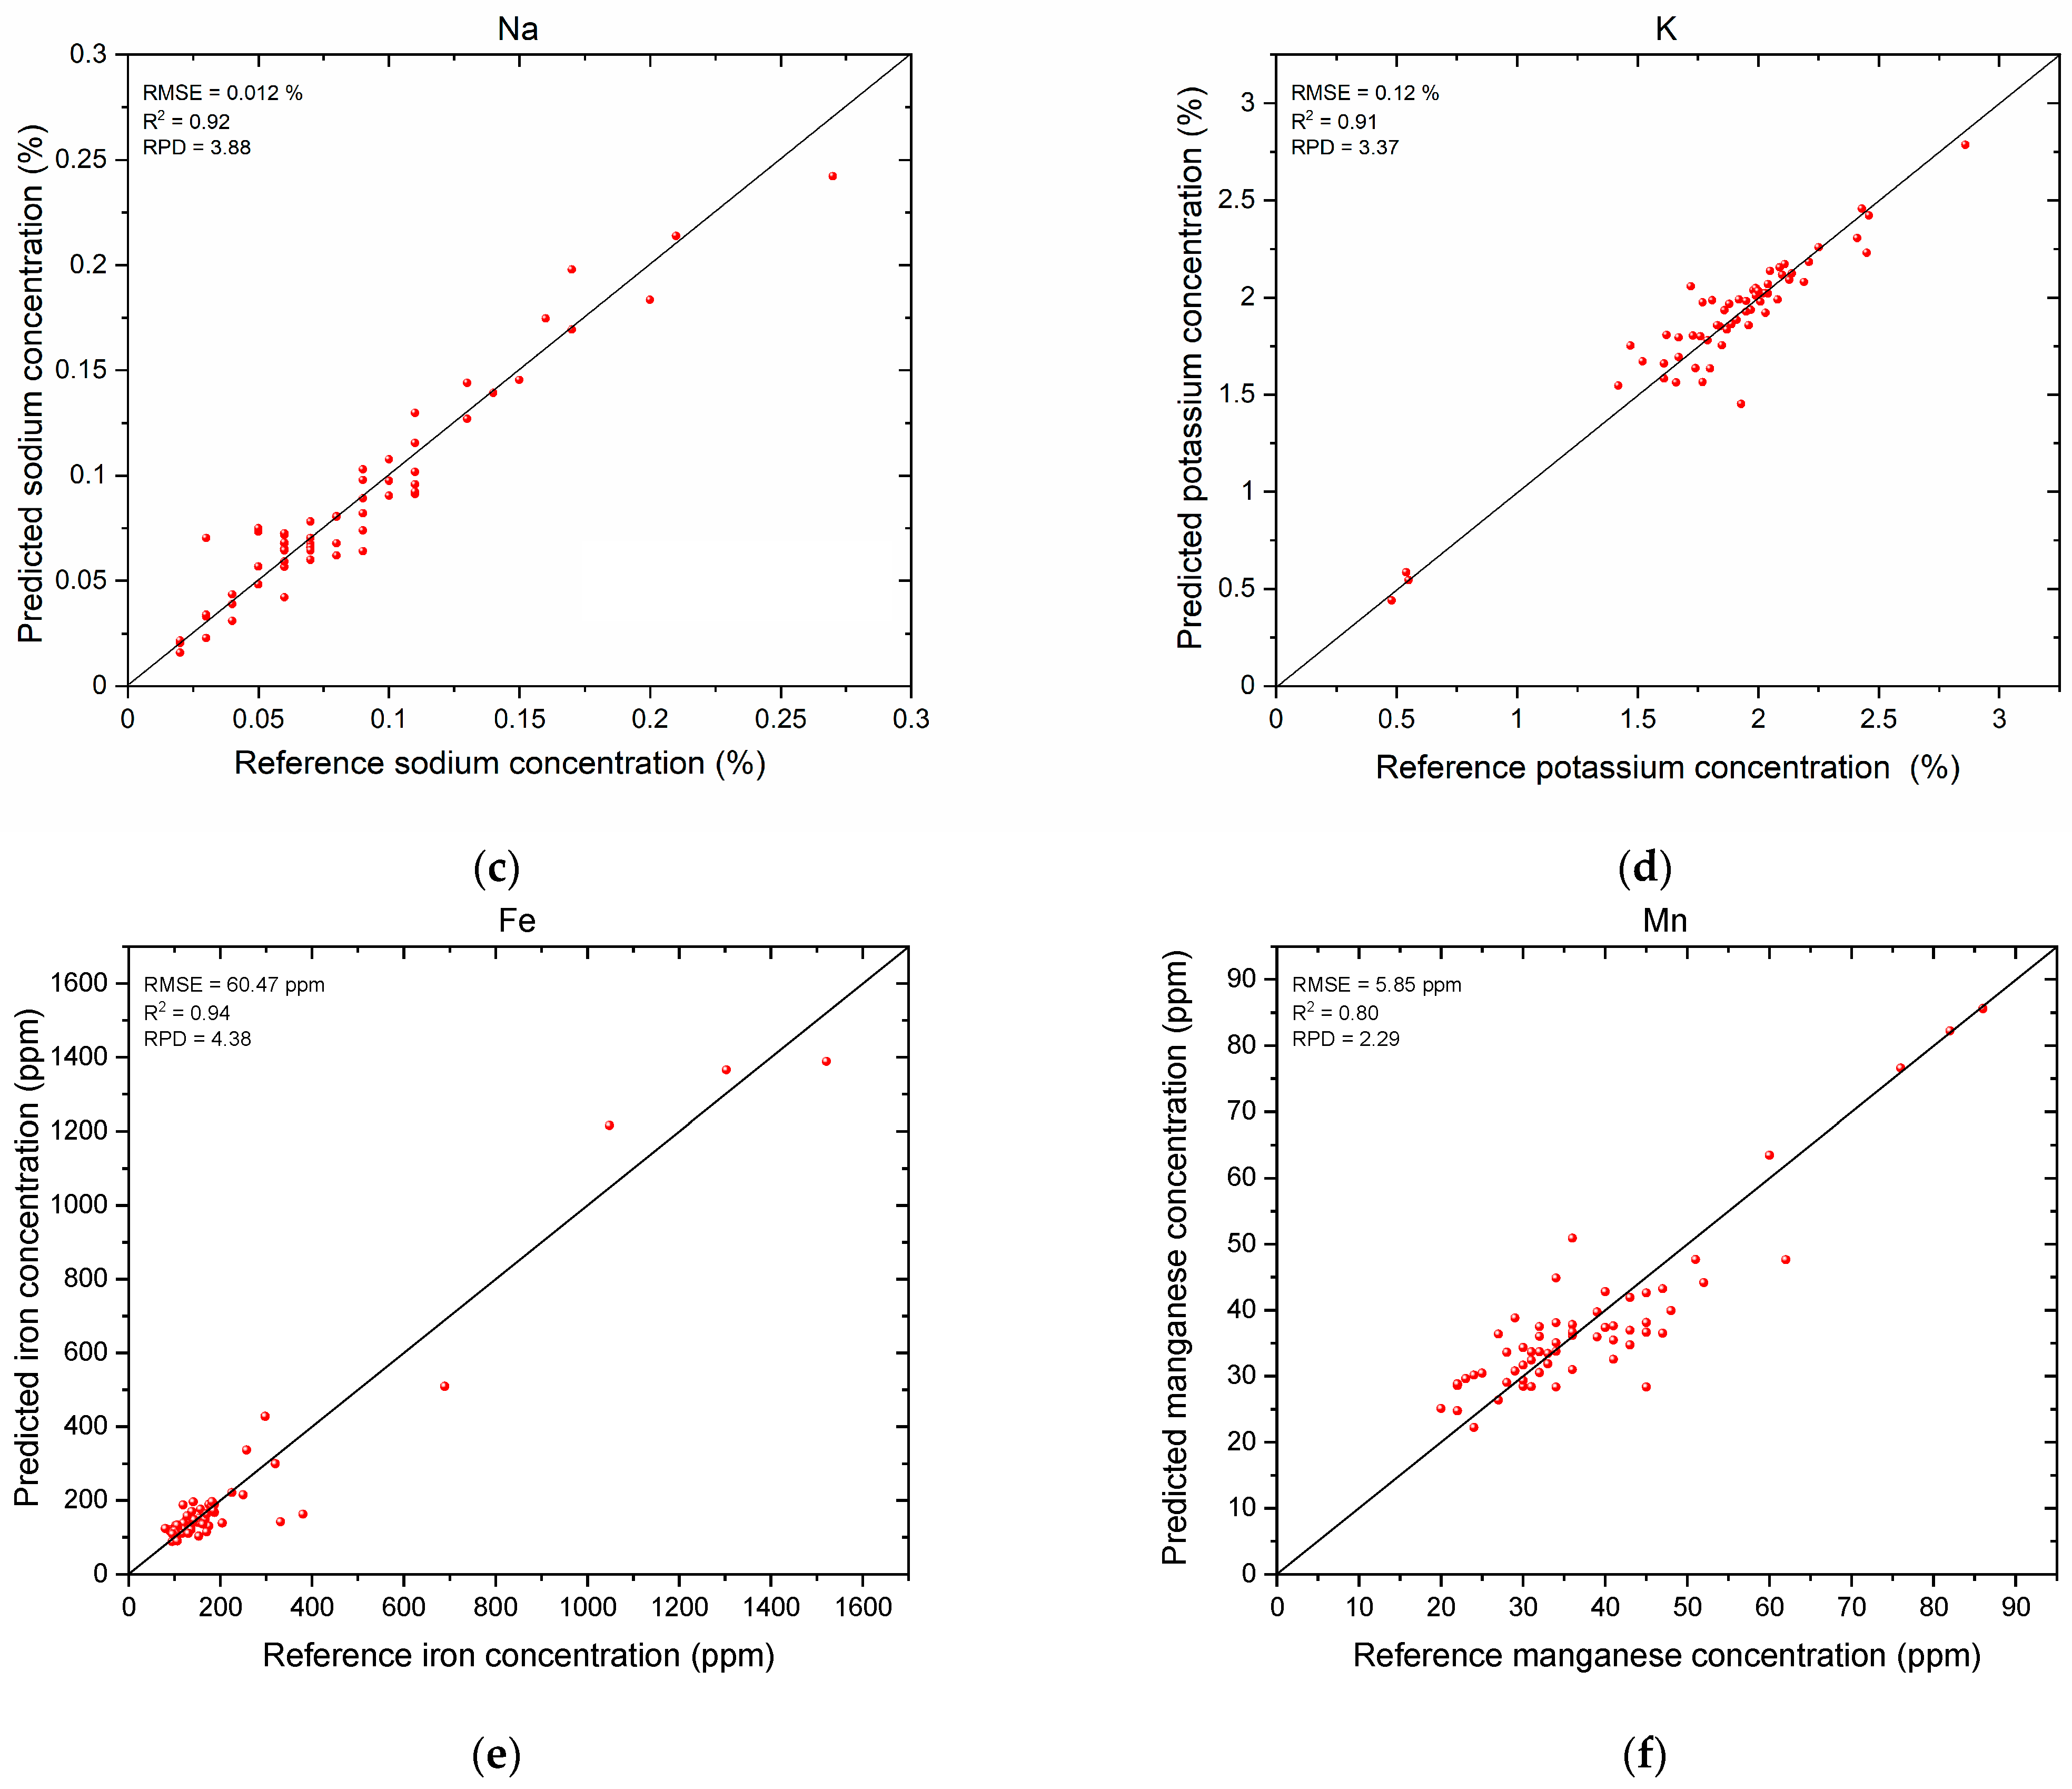
3.3. Mineral Nutrient Prediction Results
4. Discussion and Conclusions
Author Contributions
Funding
Data Availability Statement
Acknowledgments
Conflicts of Interest
Abbreviations
| Cov | Covariance |
| ELM | Extreme Learning Machine |
| LIBS | Laser-induced breakdown spectroscopy |
| LTB | Lasertechnik Berlin |
| PLS | Partial Least Squares |
| PC | Principal Component |
| Coefficient of determination | |
| RMSE | Root Mean Square Error |
| RPD | Ratio of Performance to Deviation |
| SNV | Standard Normal Variate |
| Var | Variance |
Appendix A
| Samples | Protein (%) | Ca (%) | Mg (%) | K (%) | P (%) | Na (%) | Fe (ppm) | Mn (ppm) | Zn (ppm) |
|---|---|---|---|---|---|---|---|---|---|
| 1 | 10.5 | 0.28 | 0.19 | 1.66 | 0.28 | 0.07 | 204 | 30 | 31 |
| 2 | 11.1 | 0.29 | 0.20 | 1.73 | 0.27 | 0.06 | 136 | 32 | 27 |
| 3 | 12.4 | 0.35 | 0.23 | 2.21 | 0.32 | 0.07 | 154 | 36 | 31 |
| 4 | 11.1 | 0.29 | 0.20 | 1.91 | 0.27 | 0.09 | 106 | 30 | 28 |
| 5 | 11.3 | 0.26 | 0.19 | 1.79 | 0.28 | 0.07 | 124 | 28 | 28 |
| 6 | 11.5 | 0.31 | 0.21 | 1.93 | 0.29 | 0.06 | 153 | 33 | 33 |
| 7 | 11.2 | 0.29 | 0.20 | 1.97 | 0.27 | 0.08 | 125 | 32 | 27 |
| 8 | 11.8 | 0.28 | 0.22 | 2.02 | 0.28 | 0.11 | 95 | 31 | 28 |
| 9 | 13.0 | 0.30 | 0.20 | 1.67 | 0.29 | 0.11 | 170 | 25 | 33 |
| 10 | 12.5 | 0.29 | 0.20 | 1.72 | 0.28 | 0.13 | 128 | 22 | 31 |
| 11 | 12.1 | 0.27 | 0.22 | 1.87 | 0.28 | 0.20 | 129 | 22 | 28 |
| 12 | 11.7 | 0.35 | 0.20 | 2.10 | 0.38 | 0.15 | 157 | 27 | 32 |
| 13 | 11.1 | 0.38 | 0.21 | 2.25 | 0.4 | 0.16 | 257 | 31 | 34 |
| 14 | 15.2 | 0.35 | 0.21 | 2.41 | 0.26 | 0.10 | 152 | 45 | 25 |
| 15 | 14.5 | 0.32 | 0.19 | 2.43 | 0.25 | 0.09 | 141 | 47 | 22 |
| 16 | 15.5 | 0.33 | 0.20 | 2.45 | 0.25 | 0.11 | 128 | 45 | 23 |
| 17 | 15.3 | 0.33 | 0.20 | 2.46 | 0.25 | 0.09 | 175 | 48 | 21 |
| 18 | 19.3 | 0.23 | 0.15 | 1.61 | 0.18 | 0.05 | 167 | 34 | 13 |
| 19 | 12.3 | 0.22 | 0.16 | 1.76 | 0.2 | 0.06 | 186 | 45 | 13 |
| 20 | 12.3 | 0.21 | 0.16 | 1.77 | 0.2 | 0.05 | 138 | 41 | 14 |
| 21 | 11.0 | 0.25 | 0.16 | 1.74 | 0.19 | 0.06 | 175 | 30 | 14 |
| 22 | 10.3 | 0.22 | 0.17 | 1.42 | 0.23 | 0.06 | 250 | 24 | 16 |
| 23 | 10.2 | 0.27 | 0.18 | 1.47 | 0.24 | 0.07 | 187 | 23 | 18 |
| 24 | 11.7 | 0.37 | 0.20 | 1.98 | 0.22 | 0.10 | 103 | 34 | 17 |
| 25 | 11.0 | 0.38 | 0.20 | 1.99 | 0.23 | 0.08 | 380 | 31 | 14 |
| 26 | 11.5 | 0.40 | 0.22 | 2.11 | 0.24 | 0.11 | 120 | 36 | 17 |
| 27 | 10.9 | 0.38 | 0.21 | 1.95 | 0.25 | 0.07 | 119 | 32 | 14 |
| 28 | 12.3 | 0.40 | 0.22 | 2.04 | 0.25 | 0.11 | 127 | 39 | 17 |
| 29 | 10.8 | 0.36 | 0.20 | 1.88 | 0.25 | 0.06 | 91 | 27 | 14 |
| 30 | 12.2 | 0.40 | 0.21 | 2.09 | 0.24 | 0.10 | 120 | 34 | 17 |
| 31 | 10.7 | 0.36 | 0.20 | 2.03 | 0.24 | 0.06 | 109 | 28 | 15 |
| 32 | 11.7 | 0.40 | 0.21 | 1.99 | 0.24 | 0.08 | 143 | 32 | 16 |
| 33 | 10.6 | 0.42 | 0.20 | 2.01 | 0.24 | 0.06 | 120 | 34 | 14 |
| 34 | 12.5 | 0.36 | 0.20 | 1.86 | 0.23 | 0.08 | 91 | 30 | 15 |
| 35 | 11.3 | 0.42 | 0.20 | 1.92 | 0.23 | 0.09 | 162 | 33 | 14 |
| 36 | 12.0 | 0.38 | 0.19 | 2.13 | 0.24 | 0.09 | 331 | 52 | 27 |
| 37 | 11.1 | 0.35 | 0.18 | 1.96 | 0.24 | 0.06 | 170 | 40 | 23 |
| 38 | 12.3 | 0.36 | 0.19 | 2.03 | 0.24 | 0.07 | 107 | 41 | 24 |
| 39 | 11.0 | 0.35 | 0.19 | 2.00 | 0.26 | 0.06 | 117 | 41 | 22 |
| 40 | 12.3 | 0.36 | 0.21 | 2.19 | 0.25 | 0.06 | 106 | 40 | 24 |
| 41 | 11.3 | 0.33 | 0.18 | 2.04 | 0.25 | 0.03 | 101 | 36 | 22 |
| 42 | 12.4 | 0.35 | 0.21 | 2.14 | 0.25 | 0.07 | 104 | 43 | 23 |
| 43 | 12.1 | 0.18 | 0.10 | 1.09 | 0.14 | 0.03 | 80 | 24 | 11 |
| 44 | 10.4 | 0.24 | 0.16 | 1.62 | 0.22 | 0.05 | 225 | 36 | 31 |
| 45 | 10.8 | 0.24 | 0.16 | 1.67 | 0.22 | 0.04 | 187 | 34 | 26 |
| 46 | 11.3 | 0.26 | 0.16 | 1.85 | 0.24 | 0.04 | 181 | 62 | 24 |
| 47 | 11.6 | 0.24 | 0.15 | 1.81 | 0.24 | 0.03 | 182 | 51 | 22 |
| 48 | 15.7 | 0.33 | 0.22 | 2.86 | 0.28 | 0.17 | 170 | 47 | 25 |
| 49 | 12.8 | 0.34 | 0.19 | 1.84 | 0.29 | 0.05 | 136 | 39 | 27 |
| 50 | 11.3 | 0.27 | 0.16 | 1.77 | 0.3 | 0.21 | 130 | 20 | 21 |
| 51 | 12.1 | 0.26 | 0.18 | 1.89 | 0.32 | 0.27 | 96 | 22 | 24 |
| 52 | 13.4 | 0.16 | 0.17 | 1.52 | 0.3 | 0.11 | 128 | 29 | 20 |
| 53 | 12.5 | 0.18 | 0.15 | 1.61 | 0.25 | 0.09 | 119 | 36 | 19 |
| 54 | 13.0 | 0.21 | 0.16 | 1.83 | 0.28 | 0.03 | 106 | 29 | 18 |
| 55 | 11.3 | 0.34 | 0.15 | 0.48 | 0.19 | 0.02 | 689 | 60 | 16 |
| 56 | 11.6 | 0.29 | 0.13 | 0.54 | 0.2 | 0.02 | 298 | 43 | 16 |
| 57 | 15.1 | 0.27 | 0.17 | 0.55 | 0.31 | 0.02 | 320 | 43 | 23 |
| 58 | 13.6 | 0.43 | 0.3 | 2.08 | 0.2 | 0.14 | 1521 | 86 | 27 |
| 59 | 13.5 | 0.35 | 0.28 | 2.05 | 0.2 | 0.13 | 1048 | 76 | 25 |
| 60 | 13.3 | 0.37 | 0.29 | 1.95 | 0.2 | 0.13 | 1303 | 82 | 24 |
| 61 | 10.9 | 0.22 | 0.17 | 1.8 | 0.25 | 0.04 | 185 | 45 | 23 |
| Nutrient | Selected Spectral Variables |
|---|---|
| Protein | Ca, Mn, K, Na, Fe |
| Ca | Ca, Mn, Mg, K, Na, O, C, Fe |
| Mg | Mg, Ca, Mn, K, Na, C2, Fe, C |
| K | K, Ca, Mg, Si, H, C, Mn |
| Na | Na, Mg, C, Mg, Ca I, C2 |
| Fe | Fe, Mn |
| Mn | Mn, Fe |
| Element Excluded | ELM | PLS | ||||
|---|---|---|---|---|---|---|
| (%) | (%) | (%) | (%) | |||
| Ca | 0.93 | 0.45 | 1.36 | 1.1 | 0.3 | 1.14 |
| K | 0.77 | 0.66 | 1.73 | 0.87 | 0.52 | 1.45 |
| Na | 0.73 | 0.69 | 1.81 | 0.82 | 0.54 | 1.62 |
| Fe | 0.99 | 0.43 | 1.34 | 1.11 | 0.32 | 1.1 |
| Mn | 0.88 | 0.56 | 1.52 | 0.98 | 0.43 | 1.4 |
Appendix B
References
- Carvalho, G.G.A.; Guerra, M.B.B.; Adame, A.; Nomura, C.S.; Oliveira, P.V.; Pereira de Carvalho, H.W.; Santos, D., Jr.; Nunes, L.C.; Krug, F.J. Recent advances in LIBS and XRF for the analysis of plants. J. Anal. At. Spectrom. 2018, 33, 919–944. [Google Scholar] [CrossRef]
- Albro, J.D.; Weber, D.W.; DelCurto, T. Comparison of whole, raw soybeans, extruded soybeans, or soybean meal and barley on digestive characteristics and performance of weaned beef steers consuming mature grass hay. J. Anim. Sci. 1993, 71, 26–32. [Google Scholar] [CrossRef]
- Nielsen, S.S. Food Analysis Laboratory Manual, 3rd ed.; Springer International Publishing: Cham, Switzerland, 2017. [Google Scholar] [CrossRef]
- Miralbés, C. Prediction of chemical composition and alveograph parameters on wheat by near-infrared transmittance spectroscopy. J. Agric. Food Chem. 2003, 51, 6335–6339. [Google Scholar] [CrossRef]
- Shao, Y.; Cen, Y.; He, Y.; Liu, F. Infrared spectroscopy and chemometrics for the starch and protein prediction in irradiated rice. Food Chem. 2011, 126, 1856–1861. [Google Scholar] [CrossRef]
- Petisco, C.; García-Criado, B.; Vázquez de Aldana, B.R.; Zabalgogeazcoa, I.; Mediavilla, S.; García-Ciudad, A. Use of near-infrared reflectance spectroscopy in predicting nitrogen, phosphorus and calcium contents in heterogeneous woody plant species. Anal. Bioanal. Chem. 2005, 382, 458–465. [Google Scholar] [CrossRef]
- Adams, M.J. Chemometrics in Analytical Spectroscopy, 2nd ed.; Royal Society of Chemistry: Cambridge, UK, 2004. [Google Scholar]
- Fortes, F.J.; Moros, J.; Lucena, P.; Cabalín, L.M.; Laserna, J.J. Laser-induced breakdown spectroscopy. Anal. Chem. 2013, 85, 640–669. [Google Scholar] [CrossRef]
- Zhang, Y.; Zhang, T.; Li, H. Application of laser-induced breakdown spectroscopy (LIBS) in environmental monitoring. Spectrochim. Acta Part B At. Spectrosc. 2021, 181, 106218. [Google Scholar] [CrossRef]
- Singh, V.K.; Sharma, N.; Verma, O.N.; Singh, V.K.; Tripathi, D.K.; Lee, Y.; Kumar, S.; Rai, P.K.; Gondal, M.A. Application of LIBS to elemental analysis and mapping of plant samples. At. Spectrosc. 2021, 42, 99–113. [Google Scholar] [CrossRef]
- Busser, B.; Moncayo, S.; Coll, J.-L.; Sancey, L.; Motto-Ros, V. Elemental imaging using laser-induced breakdown spectroscopy: A new and promising approach for biological and medical applications. Coord. Chem. Rev. 2018, 358, 70–79. [Google Scholar] [CrossRef]
- Ren, J.; Zhao, Y.; Yu, K. LIBS in agriculture: A review focusing on revealing nutritional and toxic elements in soil, water, and crops. Comput. Electron. Agric. 2022, 197, 106986. [Google Scholar] [CrossRef]
- Santos, D., Jr.; Nunes, L.C.; Carvalho, G.G.A.d.; Gomes, M.S.; Souza, P.F.d.; Leme, F.O.; dos Santos, L.G.C.; Krug, F.J. Laser-induced breakdown spectroscopy for analysis of plant materials: A review. Spectrochim. Acta Part B At. Spectrosc. 2012, 71–72, 3–13. [Google Scholar] [CrossRef]
- Sharma, N.; Singh, V.K.; Lee, Y.; Kumar, S.; Rai, P.K.; Pathak, A.K.; Singh, V.K. Analysis of mineral elements in medicinal plant samples using LIBS and ICP-OES. At. Spectrosc. 2020, 41, 234–241. [Google Scholar] [CrossRef]
- Shukla, P.; Kumar, R.; Rai, A.K. Detection of minerals in green leafy vegetables using laser induced breakdown spectroscopy. J. Appl. Spectrosc. 2016, 83, 872–877. [Google Scholar] [CrossRef]
- Trevizan, L.C.; Santos, D., Jr.; Samad, R.E.; Vieira, N.D., Jr.; Nunes, L.C.; Rufini, I.A.; Krug, F.J. Evaluation of laser induced breakdown spectroscopy for the determination of micronutrients in plant materials. Spectrochim. Acta Part B At. Spectrosc. 2009, 64, 369–377. [Google Scholar] [CrossRef]
- Peng, J.; Liu, F.; Shen, T.; Ye, L.; Kong, W.; Wang, W.; Liu, X.; He, Y. Comparative study of the detection of chromium content in rice leaves by 532 nm and 1064 nm laser-induced breakdown spectroscopy. Sensors 2018, 18, 621. [Google Scholar] [CrossRef]
- Galiová, M.; Kaiser, J.; Novotný, K.; Novotný, J.; Vaculovič, T.; Liška, M.; Malina, R.; Stejskal, K.; Adam, V.; Kizek, R. Investigation of heavy-metal accumulation in selected plant samples using laser induced breakdown spectroscopy and laser ablation inductively coupled plasma mass spectrometry. Appl. Phys. A 2008, 93, 917–922. [Google Scholar] [CrossRef]
- Wang, W.; Man, Z.; Li, X.; Zhao, Y.; Chen, R.; Pan, T.; Wang, L.; Dai, X.; Xiao, H.; Liu, F. Multi-phenotype response and cadmium detection of rice stem under toxic cadmium exposure. Sci. Total Environ. 2024, 917, 170585. [Google Scholar] [CrossRef]
- Pereira, F.M.V.; Milori, D.M.B.P.; Venâncio, A.L.; Russo, M.S.T.; Martins, P.K.; Freitas-Astúa, J. Evaluation of the effects of Candidatus Liberibacter asiaticus on inoculated citrus plants using laser-induced breakdown spectroscopy (LIBS) and chemometrics tools. Talanta 2010, 83, 351–356. [Google Scholar] [CrossRef]
- Keerthi, K.; Antony, M.M.; Matham, M.V. Single-shot LIBS: A rapid method for in situ and precise nutritional evaluation of hydroponic lettuce. Chem. Biol. Technol. Agric. 2024, 11, 138. [Google Scholar] [CrossRef]
- Ercioglu, E.; Velioglu, H.M.; Boyaci, I.H. Chemometric evaluation of discrimination of aromatic plants by using NIRS, LIBS. Food Anal. Methods 2018, 11, 1656–1667. [Google Scholar] [CrossRef]
- Pouzar, M.; Černohorský, T.; Průšová, M.; Prokopčáková, P.; Krejčová, A. LIBS analysis of crop plants. J. Anal. At. Spectrom. 2009, 24, 487–496. [Google Scholar] [CrossRef]
- Martin, M.Z.; Stewart, A.J.; Gwinn, K.D.; Waller, J.C. Laser-induced breakdown spectroscopy used to detect endophyte-mediated accumulation of metals by tall fescue. Appl. Opt. 2010, 49, C161–C167. [Google Scholar] [CrossRef]
- Zhang, J.; Wang, S.; Zhao, L.; Liu, L.; Wang, D. Feasibility of trace alcohol congener detection and identification using laser-induced breakdown spectroscopy. Chin. Phys. Lett. 2017, 34, 014208. [Google Scholar] [CrossRef]
- Kang, M.; Shin, W.; Choi, J.; Kim, K.; Rhee, H.; Do, H. Identification of hydrocarbon molecules using emission spectra of femtosecond laser-induced plasma. Opt. Express 2025, 33, 24969–24981. [Google Scholar] [CrossRef] [PubMed]
- Ding, J.; Zhang, T.; Li, H. Recent advances in laser-induced breakdown spectroscopy for explosive analysis. TrAC Trends Anal. Chem. 2023, 166, 117197. [Google Scholar] [CrossRef]
- Abdel-Salam, Z.A.; Abdel-Salam, S.A.M.; Abdel-Mageed, I.I.; Harith, M.A. Evaluation of proteins in sheep colostrum via laser-induced breakdown spectroscopy and multivariate analysis. J. Adv. Res. 2019, 15, 19–25. [Google Scholar] [CrossRef]
- Abdel-Salam, Z.A.; Abdel-Salam, S.A.M.; Harith, M.A. Application of laser spectrochemical analytical techniques to follow up spoilage of white meat in chicken. Food Anal. Methods 2017, 10, 1225–1232. [Google Scholar] [CrossRef]
- Abdel-Salam, Z.; Alexeree, S.M.I.; Harith, M.A. Utilizing biosynthesized nano-enhanced laser-induced breakdown spectroscopy for proteins estimation in canned tuna. Spectrochim. Acta Part B At. Spectrosc. 2018, 149, 112–117. [Google Scholar] [CrossRef]
- Abdel-Salam, Z.; Al Sharnoubi, J.; Harith, M.A. Qualitative evaluation of maternal milk and commercial infant formulas via LIBS. Talanta 2013, 115, 422–426. [Google Scholar] [CrossRef]
- Sezer, B.; Bjelak, A.; Velioglu, H.M.; Boyaci, I.H. Identification of meat species in processed meat products by using protein based laser induced breakdown spectroscopy assay. Food Chem. 2022, 372, 131245. [Google Scholar] [CrossRef]
- Wang, M.; Han, L.; Yang, Z.; Liu, X. Species discrimination of terrestrial processed animal proteins by laser-induced breakdown spectroscopy (LIBS) based on elemental characteristics. Biotechnol. Agron. Soc. Environ. 2019, 23, 137–146. [Google Scholar] [CrossRef]
- Pokrajac, D.; Lazarevic, A.; Melikechi, N. Automatic classification of laser-induced breakdown spectroscopy (LIBS) data of protein biomarker solutions. Appl. Spectrosc. 2014, 68, 999–1006. [Google Scholar] [CrossRef] [PubMed]
- Karunanithy, R.; Ratnasingam, S.; Holland, T.; Sivakumar, P. Sensitive detection of the Human Epididymis Protein-4 (HE4) ovarian cancer biomarker through a sandwich-type immunoassay method with laser-induced breakdown spectroscopy. Bioconjug. Chem. 2023, 34, 501–509. [Google Scholar] [CrossRef]
- Zhu, M.; Song, W.; Tang, X.; Kong, X. Detection of whey protein concentrate adulteration using laser-induced breakdown spectroscopy combined with machine learning. Food Addit. Contam. Part A 2025, 42, 570–579. [Google Scholar] [CrossRef]
- Zhang, D.; Xiao, S.; Shi, S.; Ma, H.; Nie, J.; Niu, X.; Zheng, W.; Guo, L. Precise qualitative analysis of foreign protein adulteration in milk powder by fully exploring the spectral information in laser-induced breakdown spectroscopy. J. Laser Appl. 2023, 35, 022027. [Google Scholar] [CrossRef]
- Huang, W.; Guo, L.; Kou, W.; Zhang, D.; Hu, Z.; Chen, F.; Chu, Y.; Cheng, W. Identification of adulterated milk powder based on convolutional neural network and laser-induced breakdown spectroscopy. Microchem. J. 2022, 176, 107190. [Google Scholar] [CrossRef]
- Sezer, B.; Bilge, G.; Boyaci, I.H. Laser-induced breakdown spectroscopy-based protein assay for cereal samples. J. Agric. Food Chem. 2016, 64, 9459–9463. [Google Scholar] [CrossRef]
- Zhang, T.-L.; Wu, S.; Tang, H.-S.; Wang, K.; Duan, Y.-X.; Li, H. Progress of chemometrics in laser-induced breakdown spectroscopy analysis. Chin. J. Anal. Chem. 2015, 43, 939–948. [Google Scholar] [CrossRef]
- Huang, G.-B.; Zhu, Q.-Y.; Siew, C.-K. Extreme learning machine: Theory and applications. Neurocomputing 2006, 70, 489–501. [Google Scholar] [CrossRef]
- Yao, S.; Lu, J.; Li, J.; Chen, K.; Li, J.; Dong, M. Multi-elemental analysis of fertilizer using laser-induced breakdown spectroscopy coupled with partial least squares regression. J. Anal. At. Spectrom. 2010, 25, 1733–1738. [Google Scholar] [CrossRef]
- Mishra, P.; Rai, A.K. Spectroscopic Evaluation of Contents Present in a Therapeutic Plant: Cannabis sativa. J. Opt. 2024; in press. [Google Scholar] [CrossRef]
- Sharma, N.; Kumar, S.; Lee, Y.; Singh, V.K.; Singh, V.K. Spectroscopic investigations of healthy and diseased ber (Ziziphus mauritiana) fruits using laser-induced breakdown spectroscopy in combination with partial least squares-discriminant analysis. Arab. J. Sci. Eng. 2022, 47, 7519–7529. [Google Scholar] [CrossRef]
- Awasthi, S.; Kumar, R.; Devanathan, A.; Acharya, R.; Rai, A.K. Multivariate methods for analysis of environmental reference materials using laser-induced breakdown spectroscopy. Anal. Chem. Res. 2017, 12, 10–16. [Google Scholar] [CrossRef]
- Khosravi, V.; Doulati Ardejani, F.; Yousefi, S.; Aryafar, A. Monitoring soil lead and zinc contents via combination of spectroscopy with extreme learning machine and other data mining methods. Geoderma 2018, 318, 29–41. [Google Scholar] [CrossRef]
- Ding, Y.; Wang, Y.; Chen, J.; Chen, W.; Hu, A.; Shu, Y.; Zhao, M. Substrate-assisted laser-induced breakdown spectroscopy combined with variable selection and extreme learning machine for quantitative determination of fenthion in soybean oil. Photonics 2024, 11, 129. [Google Scholar] [CrossRef]
- Liu, Y.; Pan, K.; Liu, Z.; Dai, Y.; Duan, X.; Wang, M.; Shen, Q. Simultaneous determination of four catechins in black tea via NIR spectroscopy and feature wavelength selection: A novel approach. Sensors 2024, 24, 3362. [Google Scholar] [CrossRef]
- Hahn, D.W.; Omenetto, N. Laser-induced breakdown spectroscopy (LIBS), Part I: Review of basic diagnostics and plasma—Particle interactions: Still-challenging issues within the analytical plasma community. Appl. Spectrosc. 2010, 64, 335A–366A. [Google Scholar] [CrossRef]
- Forage Laboratory. Available online: https://www.foragelab.com/Resources/Lab-Procedures (accessed on 30 April 2025).
- Beljkaš, B.; Matić, J.; Milovanović, I.; Jovanov, P.; Mišan, A.; Šarić, L. Rapid method for determination of protein content in cereals and oilseeds: Validation, measurement uncertainty and comparison with the Kjeldahl method. Accredit. Qual. Assur. 2010, 15, 555–561. [Google Scholar] [CrossRef]
- Nascimento, A.C.; Motta, C.; Rego, A.; Delgado, I.; Santiago, S.; Assunção, R.; Matos, A.S.; Santos, M.; Castanheira, I. Measuring Minerals in Pseudocereals Using Inductively Coupled Plasma Optical Emission Spectrometry: What Is the Optimal Digestion Method? Foods 2025, 14, 565. [Google Scholar] [CrossRef]
- Hahn, D.W.; Omenetto, N. Laser-induced breakdown spectroscopy (LIBS), Part II: Review of instrumental and methodological approaches to material analysis and applications to different fields. Appl. Spectrosc. 2012, 66, 347–419. [Google Scholar] [CrossRef]
- Brunnbauer, L.; Gajarska, Z.; Lohninger, H.; Limbeck, A. A critical review of recent trends in sample classification using laser-induced breakdown spectroscopy (LIBS). TrAC Trends Anal. Chem. 2023, 159, 116859. [Google Scholar] [CrossRef]
- Sun, L.; Yu, H. Automatic estimation of varying continuum background emission in laser-induced breakdown spectroscopy. Spectrochim. Acta Part B At. Spectrosc. 2009, 64, 278–287. [Google Scholar] [CrossRef]
- Castro, J.P.; Pereira-Filho, E.R. Twelve different types of data normalization for the proposition of classification, univariate and multivariate regression models for the direct analyses of alloys by laser-induced breakdown spectroscopy (LIBS). J. Anal. At. Spectrom. 2016, 31, 2005–2014. [Google Scholar] [CrossRef]
- Syvilay, D.; Wilkie-Chancellier, N.; Trichereau, B.; Texier, A.; Martinez, L.; Serfaty, S.; Detalle, V. Evaluation of the standard normal variate method for Laser-Induced Breakdown Spectroscopy data treatment applied to the discrimination of painting layers. Spectrochim. Acta Part B At. Spectrosc. 2015, 114, 38–45. [Google Scholar] [CrossRef]
- National Institute of Standards and Technology (NIST), Atomic Spectra Database (ASD), Lines Data. Available online: https://physics.nist.gov/PhysRefData/ASD/lines_form.html (accessed on 30 April 2025).
- Suchoňová, M.; Krištof, J.; Pribula, M.; Veis, M.; Tabarés, F.L.; Veis, P. Analysis of LiSn alloy at several depths using LIBS. Fusion Eng. Des. 2017, 117, 175–179. [Google Scholar] [CrossRef]
- Adler, J.; Parmryd, I. Quantifying colocalization by correlation: The Pearson correlation coefficient is superior to the Mander’s overlap coefficient. Cytom. Part A 2010, 77, 733–742. [Google Scholar] [CrossRef]
- Zhang, S.; He, M.; Yin, Z.; Zhu, E.; Hang, W.; Huang, B. Elemental fractionation and matrix effects in laser sampling-based spectrometry. J. Anal. At. Spectrom. 2016, 31, 358–382. [Google Scholar] [CrossRef]
- Wang, Z.; Feng, J.; Li, L.; Ni, W.; Li, Z. A multivariate model based on dominant factor for laser-induced breakdown spectroscopy measurements. J. Anal. At. Spectrom. 2011, 26, 2289–2299. [Google Scholar] [CrossRef]
- Huang, G.; Huang, G.-B.; Song, S.; You, K. Trends in extreme learning machines: A review. Neural Netw. 2015, 61, 32–48. [Google Scholar] [CrossRef]
- Tenenhaus, M.; Gauchi, J.-P.; Ménardo, C. Régression PLS et applications. Rev. Stat. Appl. 1995, 43, 7–63. [Google Scholar]
- Huang, G.-B.; Zhu, Q.-Y.; Siew, C.-K. Extreme learning machine: A new learning scheme of feedforward neural networks. In Proceedings of the 2004 IEEE International Joint Conference on Neural Networks, Budapest, Hungary, 25–29 July 2004; IEEE: Piscataway, NJ, USA, 2004; Volume 2, pp. 985–990. [Google Scholar] [CrossRef]
- El Haddad, J. Chimiométrie appliquée à la spectroscopie de plasma induit par laser (LIBS) et à la spectroscopie terahertz. Ph.D. Thesis, Université Bordeaux, Bordeaux, France, 2013. Available online: https://tel.archives-ouvertes.fr/tel-00959288 (accessed on 30 April 2025).
- Saeys, W.; Mouazen, A.M.; Ramon, H. Potential for onsite and online analysis of pig manure using visible and near infrared reflectance spectroscopy. Biosyst. Eng. 2005, 91, 393–402. [Google Scholar] [CrossRef]
- Permyakov, E.A. Metal Binding Proteins. Encyclopedia 2021, 1, 261–292. [Google Scholar] [CrossRef]
- Tripathi, D.K.; Singh, S.; Singh, S.; Mishra, S.; Chauhan, D.K.; Dubey, N.K. Micronutrients and their diverse role in agricultural crops: Advances and future prospective. Acta Physiol. Plant 2015, 37, 139. [Google Scholar] [CrossRef]
- Morris, V.S.; Richards, E.M.B.; Morris, R.; Dart, C.; Helassa, N. Structure-Function Diversity of Calcium-Binding Proteins (CaBPs): Key Roles in Cell Signalling and Disease. Cells 2024, 14, 152. [Google Scholar] [CrossRef] [PubMed]
- Braga, J.W.B.; Trevizan, L.C.; Nunes, L.C.; Rufini, I.A.; Santos, D., Jr.; Krug, F.J. Comparison of univariate and multivariate calibration for the determination of micronutrients in pellets of plant materials by laser-induced breakdown spectrometry. Spectrochim. Acta Part B At. Spectrosc. 2010, 65, 66–74. [Google Scholar] [CrossRef]
- Deguchi, Y.; Wang, Z. Industrial applications of laser-induced breakdown spectroscopy. In Plasma Science and Technology—Progress in Physical States and Chemical Reactions; Mieto, T., Ed.; IntechOpen: London, UK, 2016; Chapter 14. [Google Scholar] [CrossRef][Green Version]
- Bouchard, P.; Sabsabi, M.; Blouin, A.; Padioleau, C. Hybrid Laser-Induced Breakdown Spectroscopy System. U.S. Patent 11,385,182, 12 July 2022. [Google Scholar][Green Version]
- Bouchard, P.; Sabsabi, M.; Padioleau, C. High Resolution and High Throughput Spectrometer. U.S. Patent 11,385,101, 12 July 2022. [Google Scholar][Green Version]
- Zhu, Q.-Y.; Qin, A.K.; Suganthan, P.N.; Huang, G.-B. Evolutionary extreme learning machine. Pattern Recognit. 2005, 38, 1759–1763. [Google Scholar] [CrossRef]



| Nutrients | Min | Max | Mean |
|---|---|---|---|
| Proteins (%) | 10.2 | 19.3 | 12.4 |
| Macronutrients (%) | |||
| Ca | 0.16 | 0.43 | 0.31 |
| P | 0.14 | 0.32 | 0.25 |
| Mg | 0.13 | 0.29 | 0.21 |
| K | 0.48 | 2.86 | 1.87 |
| Na | 0.02 | 0.21 | 0.09 |
| Micronutrients (ppm) | |||
| Fe | 80 | 1521 | 180 |
| Mn | 20 | 86 | 35 |
| Zn | 11 | 34 | 23 |
| PLS | ELM | |||||||||||
|---|---|---|---|---|---|---|---|---|---|---|---|---|
| (%) | (%) | (%) | (%) | |||||||||
| Echelle | 0.75 | 1.18 | 0.67 | 0.44 | 1.63 | 1.50 | 0.62 | 0.81 | 0.74 | 0.58 | 1.87 | 1.76 |
| Modular | 0.43 | 1.06 | 0.82 | 0.53 | 2.51 | 1.62 | 0.50 | 0.56 | 0.84 | 0.74 | 2.80 | 2.01 |
| Elements | Wavelength (nm) | 2 | |
|---|---|---|---|
| Ca | 428.936 | 0.53 | 1.47 |
| Mg | 285.212 | 0.42 | 1.18 |
| K | 769.896 | 0.64 | 1.68 |
| Na | 819.481 | 0.8 | 1.56 |
| Fe II | 275.573 | 0.93 | 3.46 |
| Mn II | 257.610 | 0.66 | 1.56 |
| P | 213.618 | 0.16 | 1.1 |
| Zn | 213.856 | 0.004 | 1.07 |
| Macronutrients | PLS | ELM | ||||||||||
|---|---|---|---|---|---|---|---|---|---|---|---|---|
| (%) | (%) | (%) | (%) | |||||||||
| Ca | 0.02 | 0.034 | 0.89 | 0.75 | 3.12 | 2.21 | 0.017 | 0.021 | 0.92 | 0.87 | 3.7 | 2.79 |
| Mg | 0.014 | 0.02 | 0.75 | 0.74 | 2.34 | 2.26 | 0.008 | 0.009 | 0.93 | 0.89 | 3.87 | 3.48 |
| K | 0.11 | 0.19 | 0.89 | 0.85 | 3.14 | 2.94 | 0.09 | 0.1 | 0.94 | 0.88 | 4.38 | 3.44 |
| P | 0.025 | 0.042 | 0.63 | 0.4 | 1.86 | 1.46 | 0.022 | 0.026 | 0.61 | 0.57 | 1.85 | 1.67 |
| Na | 0.014 | 0.024 | 0.89 | 0.84 | 3.13 | 2.85 | 0.01 | 0.012 | 0.93 | 0.92 | 4.68 | 4.64 |
| Micronutrients | (ppm) | (ppm) | (ppm) | (ppm) | ||||||||
| Fe | 53.99 | 60.72 | 0.93 | 0.92 | 4.07 | 4.05 | 39.29 | 51.69 | 0.95 | 0.92 | 6.02 | 5.8 |
| Mn | 6.31 | 10.31 | 0.71 | 0.65 | 1.91 | 1.83 | 5.37 | 5.79 | 0.83 | 0.8 | 2.53 | 2.29 |
| Zn | 4.26 | 5.34 | 0.49 | 0.36 | 1.42 | 1.3 | 3.69 | 3.51 | 0.63 | 0.59 | 1.67 | 1.66 |
| Macronutrients | ELM | ||
|---|---|---|---|
| (%) | (%) | ||
| Ca | 0.05 | 0.41 | 1.32 |
| Mg | 0.025 | 0.43 | 1.34 |
| K | 0.3 | 0.41 | 1.32 |
| Na | 0.042 | 0.23 | 1.15 |
| Micronutrients | (ppm) | (ppm) | |
| Fe | 236.7 | 0.18 | 1.12 |
| Mn | 10.67 | 0.35 | 1.26 |
Disclaimer/Publisher’s Note: The statements, opinions and data contained in all publications are solely those of the individual author(s) and contributor(s) and not of MDPI and/or the editor(s). MDPI and/or the editor(s) disclaim responsibility for any injury to people or property resulting from any ideas, methods, instructions or products referred to in the content. |
© 2025 by the authors. Licensee MDPI, Basel, Switzerland. This article is an open access article distributed under the terms and conditions of the Creative Commons Attribution (CC BY) license (https://creativecommons.org/licenses/by/4.0/).
Share and Cite
Sabsabi, J.; Adame, A.; Vanier, F.; Patterson, N.; Feurtado, A.; Harhira, A.; Sabsabi, M.; Vidal, F. Rapid Spectroscopic Analysis for Food and Feed Quality Control: Prediction of Protein and Nutrient Content in Barley Forage Using LIBS and Chemometrics. Analytica 2025, 6, 29. https://doi.org/10.3390/analytica6030029
Sabsabi J, Adame A, Vanier F, Patterson N, Feurtado A, Harhira A, Sabsabi M, Vidal F. Rapid Spectroscopic Analysis for Food and Feed Quality Control: Prediction of Protein and Nutrient Content in Barley Forage Using LIBS and Chemometrics. Analytica. 2025; 6(3):29. https://doi.org/10.3390/analytica6030029
Chicago/Turabian StyleSabsabi, Jinan, Andressa Adame, Francis Vanier, Nii Patterson, Allan Feurtado, Aïssa Harhira, Mohamad Sabsabi, and François Vidal. 2025. "Rapid Spectroscopic Analysis for Food and Feed Quality Control: Prediction of Protein and Nutrient Content in Barley Forage Using LIBS and Chemometrics" Analytica 6, no. 3: 29. https://doi.org/10.3390/analytica6030029
APA StyleSabsabi, J., Adame, A., Vanier, F., Patterson, N., Feurtado, A., Harhira, A., Sabsabi, M., & Vidal, F. (2025). Rapid Spectroscopic Analysis for Food and Feed Quality Control: Prediction of Protein and Nutrient Content in Barley Forage Using LIBS and Chemometrics. Analytica, 6(3), 29. https://doi.org/10.3390/analytica6030029


