Article

Study of Sorption of Chlortetracycline Hydrochloride on Zirconium-Based Metal–Organic Framework Followed by Determination by UV-Vis Detection

by
Julia D. Bryantseva
1,
Marina O. Gorbunova
1,2,
Vladimir A. Zhinzhilo
1 and
Igor E. Uflyand
1,*
1
Chemistry Department, Southern Federal University, Rostov-on-Don 344006, Russia
2
Chemistry Department, Rostov State Medical University of the Ministry of Healthcare of Russian Federation, Rostov-on-Don 344022, Russia
*
Author to whom correspondence should be addressed.
Analytica 2025, 6(3), 28; https://doi.org/10.3390/analytica6030028
Submission received: 14 July 2025 / Revised: 16 August 2025 / Accepted: 16 August 2025 / Published: 20 August 2025
(This article belongs to the Section Sample Pretreatment and Extraction)

Abstract

The reaction of zirconium tetrachloride with 2-amino-1,4-benzenedicarboxylic acid in N,N-dimethylformamide with the addition of HCl leads to the formation of zirconium 2-amino-1,4-benzenedicarboxylate. Zirconium 2-amino-1,4-benzenedicarboxylate was characterized by elemental analysis, infrared spectrometry, X-ray diffraction, scanning electron microscopy, and volumetric nitrogen adsorption/desorption. The sample has a constant porosity with an average pore diameter of 7.97 nm and both microporous and mesoporous structure with a large surface area (820 m2/g) corresponding to the type IV adsorption. Zirconium 2-amino-1,4-benzenedicarboxylate was used for solid-phase extraction (SPE) of chlortetracycline hydrochloride from the aqueous solution. The obtained results confirmed the possibility of using the proposed analytical technique as a new, convenient approach to the extraction of chlortetracycline hydrochloride from industrial or other wastewaters, where such substance is contained in insignificant concentrations and its determination requires expensive and complex equipment. In the future, this method can be used not only for the effective removal of pollutants from industrial wastewater with subsequent regeneration of the sorbent, but also as a sample-preparation method for concentrating chlortetracycline hydrochloride from dilute solutions with its subsequent elution and analysis by available methods, for example, spectrophotometry, since the limit of detection is 0.06 mg/L. Experimental data are described by the isotherm of SPE (R2 = 0.998–0.999) and show the ability of zirconium 2-amino-1,4-benzenedicarboxylate to extract up to 578 mg/g of sorbent at 5 °C under optimal conditions.

1. Introduction

Pollution of the global water environment by organic compounds is the second most common pollution after pollution by salt compounds. However, from the point of view of sustainable development issues, it is natural and anthropogenic organic substances in the water cycle that have posed the greatest threat to humanity since the beginning of the 20th century.
Among the numerous organic pollutants of the hydrosphere, pharmaceuticals stand out as the most common class that have a toxic effect on human health [1,2,3,4]. Modern drugs are characterized by high consumption, fairly good solubility in water and, as a result, high mobility, which increases their toxic effect on the ecosystem. Pharmaceuticals and their metabolites have several main routes of entry into the human environment: industrial wastewater, emergency discharges, wastewater from medical institutions, etc. [5,6]. Some of these compounds are decomposed during wastewater treatment, while others can only be removed by chemical or biological treatment.
A certain portion of pharmaceuticals and their metabolites have toxic, carcinogenic and teratogenic properties, which explains the close attention of scientists to this global problem. Tetracycline antibiotics, widely used throughout the world, pose a special problem in this regard, primarily due to the fact that their low concentration in the environment promotes the adaption of pathogenic microorganisms, the formation of resistance to antibiotics, and, as a consequence, the ineffectiveness of the treatment of infectious diseases [7]. Drugs of this pharmaceutical group represent a new class of micropollutants entering the environment not only from point sources, such as industrial effluents and household waste, but mainly from diffuse sources, such as field runoff and wastewater from livestock farms [8]. Existing treatment facilities are not always able to effectively decompose complex organic molecules, which increases their toxicity and complicates biodegradation. In this regard, new technologies for more efficient removal of antibiotics from the environment are being actively developed [9], and currently there are many strategies for the efficient removal of pollutants of this class from water bodies. One of the most important problems is the development of new and adaptation of existing methods for detecting antibiotics in the environmental objects, taking into account their low concentration, but at the same time the technique should be simple and inexpensive, not requiring complex equipment and special qualifications of personnel. In this regard, extraction–photometric methods deserve attention, in particular solid-phase extraction (SPE) in combination with UV-Vis spectrophotometry, which is considered one of the most competitive methods due to its high efficiency and ease of implementation [10,11,12,13,14].
It should be noted that other methods of analysis are also being improved, among which high-performance liquid chromatography (HPLC) [15] stands out. However, such methods are associated with the use of expensive equipment and scarce consumables. For colored compounds, many methods are known based on determination by intrinsic absorption, but such methods have very limited application since they work in the range of high concentrations. The use of SPE at the sample-preparation stage can help solve the problem of determining low concentrations of tetracycline in both natural objects and food products, avoiding the methods of multi-hour vacuum concentration, which ultimately allows scientists to significantly reduce the limit of detection (LOD), as well as reduce the interfering effect of the multicomponent matrix of the analyzed object [16,17,18,19]. Achieving this at the sample-preparation stage will allow analytical determination of tetracycline by a simple spectrophotometric method by intrinsic absorption in the UV-region using the calibration graph method.
In recent years, a new class of solid sorbents has been developed—metal–organic frameworks (MOFs), which have shown high efficiency in extracting various compounds. Therefore, the search for new sorbents for determining the content of tetracycline in environmental objects using these compounds is of great scientific interest. This determines the growing scientific interest in the search for new sorbents for removing organic pollutants from the aquatic environment [20].
Zirconium-based metal–organic frameworks (Zr-MOFs) have rapidly gained popularity in analytical chemistry due to their unique properties: high selectivity, efficiency, availability, and reducibility [21,22]. This success is due to the high chemical and mechanical stability of zirconium MOFs, achieved due to the strong bonds of zirconium with carboxyl groups.
The aim of this study is to develop a method for spectrophotometric determination of chlortetracycline hydrochloride (CTC) by its own absorption with preliminary SPE at the sample preparation stage. Zirconium 2-amino-1,4-benzenedicarboxylate (Zr-MOF) synthesized under experimental conditions was used as a solid-phase sorbent.

2. Materials and Methods

2.1. Reagents and Materials

The following commercially available reagents and materials were used to conduct this study: 2-amino-1,4-benzenedicarboxylic acid (NH2-H2BDC, 99%), ZrCl4 (98%) (Acros Organics, Tokyo, Japan), dimethylformamide (DMF), ethyl acetate, ethanol and dichloromethane (98%) (Reaktiv Torg, Moscow, Russia). Ethanol, ethyl acetate and dichloromethane were additionally dehydrated according to standard methods; the remaining reagents were used without additional preparation. The water-soluble pharmaceutical substance CTC, manufactured by Clearsynth (Mumbai, India), was used as the object of study; its structure is shown in Figure 1 [23].
The working solution of CTC with a concentration of 100 mg/L was prepared directly on the day of the experiment. Experimental solutions of CTC were obtained by diluting the working solution to the required concentrations.

2.2. Apparatus

X-ray diffraction (XRD) analysis was performed on a Phywe XR 4.0 instrument (Phywe, CuKα, λ = 0.15418 nm, scan rate 2°/min, step size 0.02°). Fourier transform infrared (FTIR) spectra were recorded on a PerkinElmer Spectrum 100 FTIR spectrometer (PerkinElmer) using KBr tablets and Spectrum 10 Softspectra data analysis software (Shelton, CT, USA). Scanning electron microscopy (SEM) was performed on a ZEISS Crossbeam 340 instrument (Carl Zeiss, Oberkochen, Baden-Württemberg, Germany) with an accelerating voltage of 3 kV using an Everhart–Thornley secondary electron detector (SE2) at magnifications ranging from 1.92 to 50,000 times. Elemental analysis was performed on a Vario EL cube CHNOS analyzer (Elementar Analysensysteme GmbH, Langenselbold, Germany). Zirconium was determined on an AAS-3 atomic absorption spectrometer (Carl Zeiss, Germany) after transferring the solid sample into a solution using mineral acids and subsequent ultrasonic spraying. Atomization was carried out in an acetylene–air flame.
An AUTOSORB-1 instrument (Quantachrome, Boynton Beach, FL, USA) was used to study nitrogen adsorption/desorption isotherms at 77 K using the static volumetric method. Before the experiments, the samples were degassed by heating to 150 °C for 12 h in a vacuum. The specific surface area was calculated by the Brunauer–Emmett–Teller (BET) method from the volume of physically adsorbed nitrogen at different P/P0 ratios using the linear section of the six-point graph.
The pH of the medium was monitored using a pH-150M pH meter. LOD of CTC was calculated using the 3σ criterion [24].

2.3. Synthesis of Sorbent

The sorbent was synthesized as described previously [25,26] with minor modifications. A total of 0.724 g (4 mmol) of NH2-H2BDC was placed in a 250 mL beaker, and a mixture containing 90 mL of DMF and 10 mL of HCl (37%) was added as a solvent. In another beaker of the same volume, 0.233 g (1 mmol) of zirconium tetrachloride (ZrCl4) was dissolved in a mixture consisting of 90 mL of DMF and 10 mL of HCl (37%). Both solutions were poured into a 250 mL round-bottomed flask. After a few minutes of stirring, opalescence was observed. The flask was equipped with a reflux condenser and heated while stirring on a magnetic stirrer. Heating was carried out at the boiling point of the solvent for 3 h, protecting the reactor from moisture from the air. After heating was complete, the flask was left to cool to room temperature. The reaction resultedin the formation of a finely crystalline yellowish-brown powder. The precipitate was separated by centrifugation at 8000 rpm for 10 min and washed three times with 20 mL of DMF. The precipitate separated by centrifugation wasdried in a vacuum desiccator for 12 h, then additionally washed with absolute ethanol and separated by centrifugation. The precipitate wasbriefly dried in air at room temperature and then in a dynamic vacuum at 140 °C for 8 h. A total of 0.632 g of light-brown powder wasobtained, which is 78.3% of the yield in terms of zirconium chloride.
The final stage of sorbent preparation included conditioning of the synthesized complex. For this purpose, the vacuum-dried compound was subjected to successive treatment in anhydrous solvents: ethanol, ethyl acetate, and chloroform. In each solvent, the treatment was carried out for 6 h with constant stirring, protecting against the ingress of atmospheric moisture. After completion of the treatment, the sorbent was briefly dried in air at a temperature of 50 °C and then in a dynamic vacuum at a temperature of 90 °C for 8 h.

2.4. Sorption Experiments

The obtained sorbent was studied in a series of experiments on the sorption of CTC from aqueous solutions. A standard solution of CTC was prepared by dissolving a 0.100 g sample of the pharmaceutical substance in 100 mL of distilled water. After complete dissolution of the substance, the resulting solution was quantitatively transferred to a 1000 mL measuring flask and brought to the mark with distilled water, obtaining a solution with a CTC concentration of 100.00 mg/L. Working solutions were prepared from the standard solution by diluting with distilled water to the required concentrations. The sorption capacity of the material was studied by periodic and dynamic methods
The studied solution (200 mL) was placed in a 250 mL beaker and stirred on a magnetic stirrer. The calculated mass of the sorbent was added to the solution, and the timer was turned on. Periodically, after 5, 10, 15, 30, 45, 60, 75, 90, and 180 min, 10 mL of the sorbent suspension in the CTC solution were collected. The collected samples were centrifuged at 5000 rpm for 5 min, then the fugates were carefully poured off and left for 10 min in a dark place. After the specified time, the optical density of the solution was determined with a spectrophotometer relative to distilled water at λ = 356 nm; the optical path length is 1 cm. The values from five parallel measurements were averaged.
To determine the dependence of SPE on the initial concentration of the solution, solutions of CTC with concentrations of 100, 50, 25, 12.5 and 6.25 mg/L were used. The mass of the sorbent was constant and amounted to 80 mg.
To determine the dependence of SPE on the sorbent dose, a constant solution concentration of 100 mg/L was used.The mass of the sorbent varied: 80, 40, 20, 10 and 5 mg.
To determine the dependence of SPE on temperature, the experiment was carried out in a thermostat at 5, 20 and 35 °C.
When studying the effect of pH of the medium on the SPE process, the pH of the initial solution was adjusted with a 0.1 N HCl solution, introducing it into the initial CTC solution under the control of a pH meter. An alkaline medium was created in a similar manner, using a 0.01 N sodium hydroxide solution.
Dynamic experiments on sorption and elution were carried out in a sorption column with a height of 100 mm and an internal diameter of 13 mm, with a sorbent layer thickness of 40–50 mm. The flow rate of the solution through the column was adjusted within 1.0 ± 0.5 mL/min. Elution of the target products was carried out on the same columns with a methanol: HCl mixture in a ratio of 60:10.
The efficiency of solid-phase extraction R (%) [27], which is the degree of extraction of the extracted substance from the volume of the solution into the sorbent, was calculated using Formula (1):
R = ( C 0 C τ ) C 0 × 100 %  
The enrichment factor EF, which is the ratio of the final concentration to the initial one, was calculated using Formula (2) [27]:
E F = C f C i =   V i V f R  
The dynamic capacity of the sorbent qτ at a specific point in time was calculated using Equation (3):
q τ = C 0 C τ V m
The sorption capacity of the sorbent in the equilibrium state qe was calculated using Formula (4):
q e = C 0 C e V m
The distribution coefficient was determined using Formula (5):
K d = C i C f V C f m
The degree of concentration was determined as the ratio of the mass of the analyte solution to the mass of the sorbent taken for sorption, according to Formula (6):
K =   m a m
The degree of desorption was determined using Formula (7):
R d e s =   m f m i · 100 %

3. Results and Discussion

3.1. Synthesis and Characterization of Sorbent

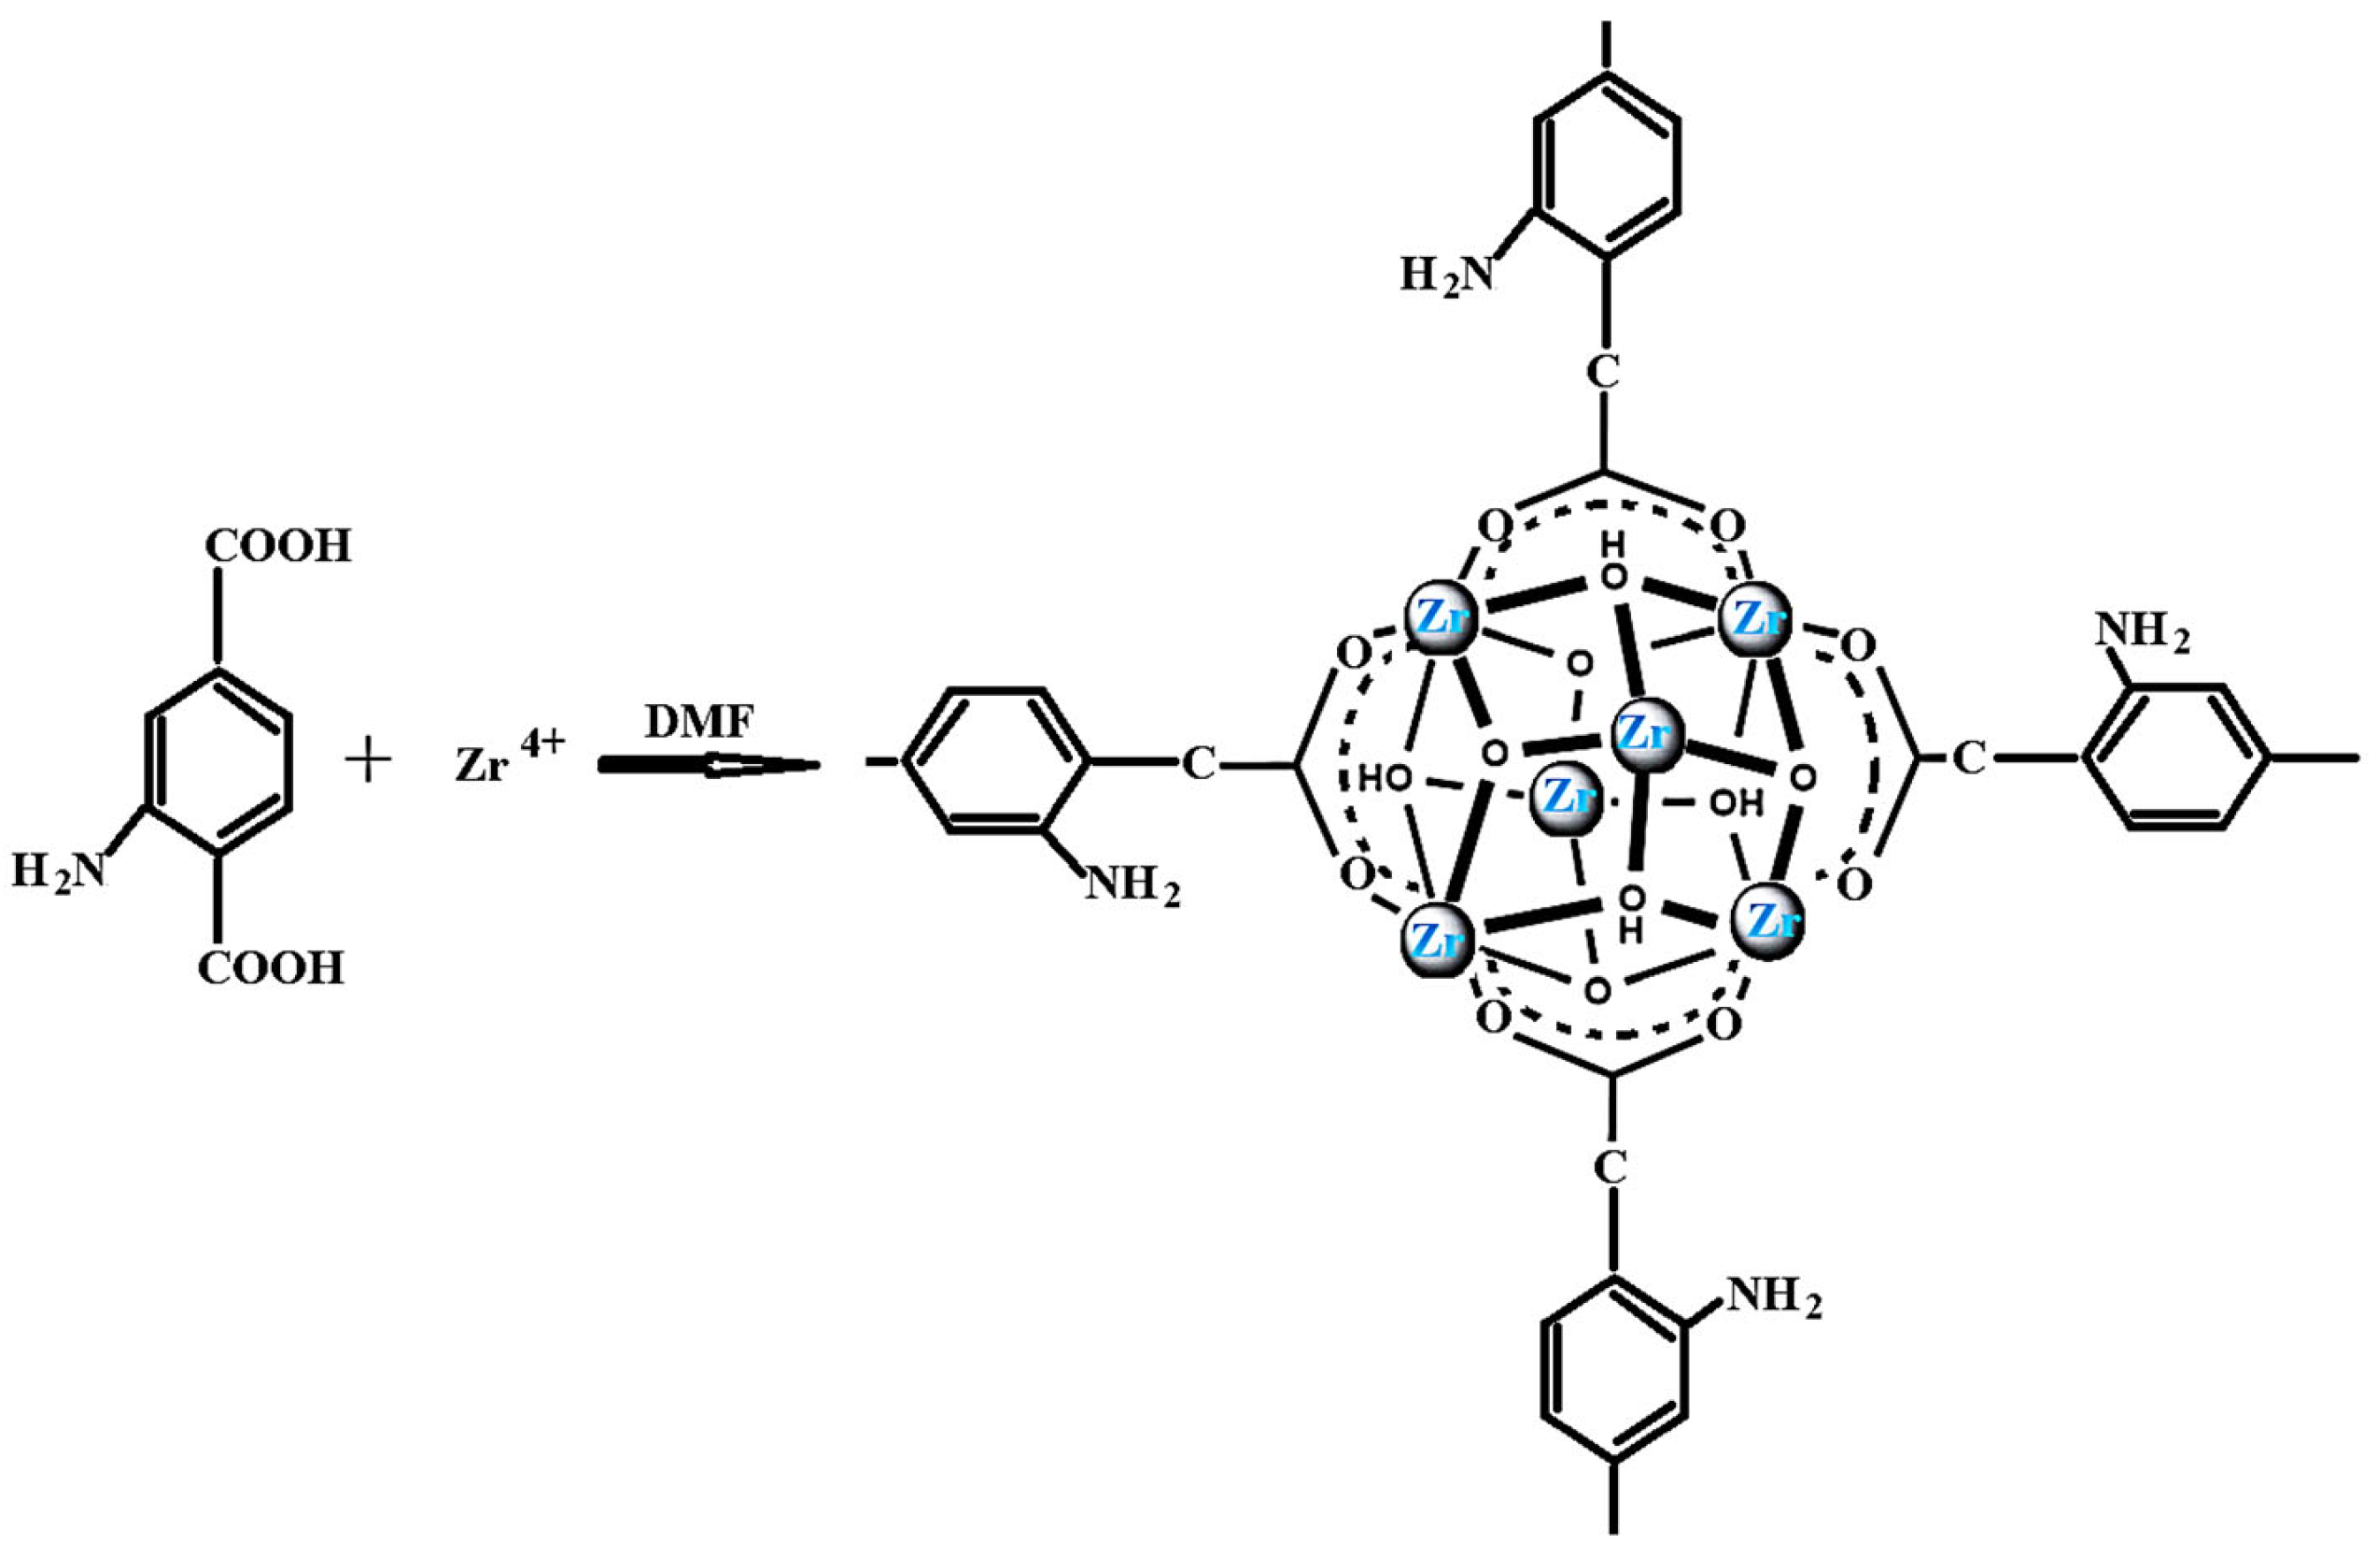
The synthesis scheme is shown in Figure 2. The structural formula of the product is presented by analogy with the work of Katz et al. [28], who demonstrated a 20-fold increase in the hydrolysis of phosphate ester using UiO-66-NH2.
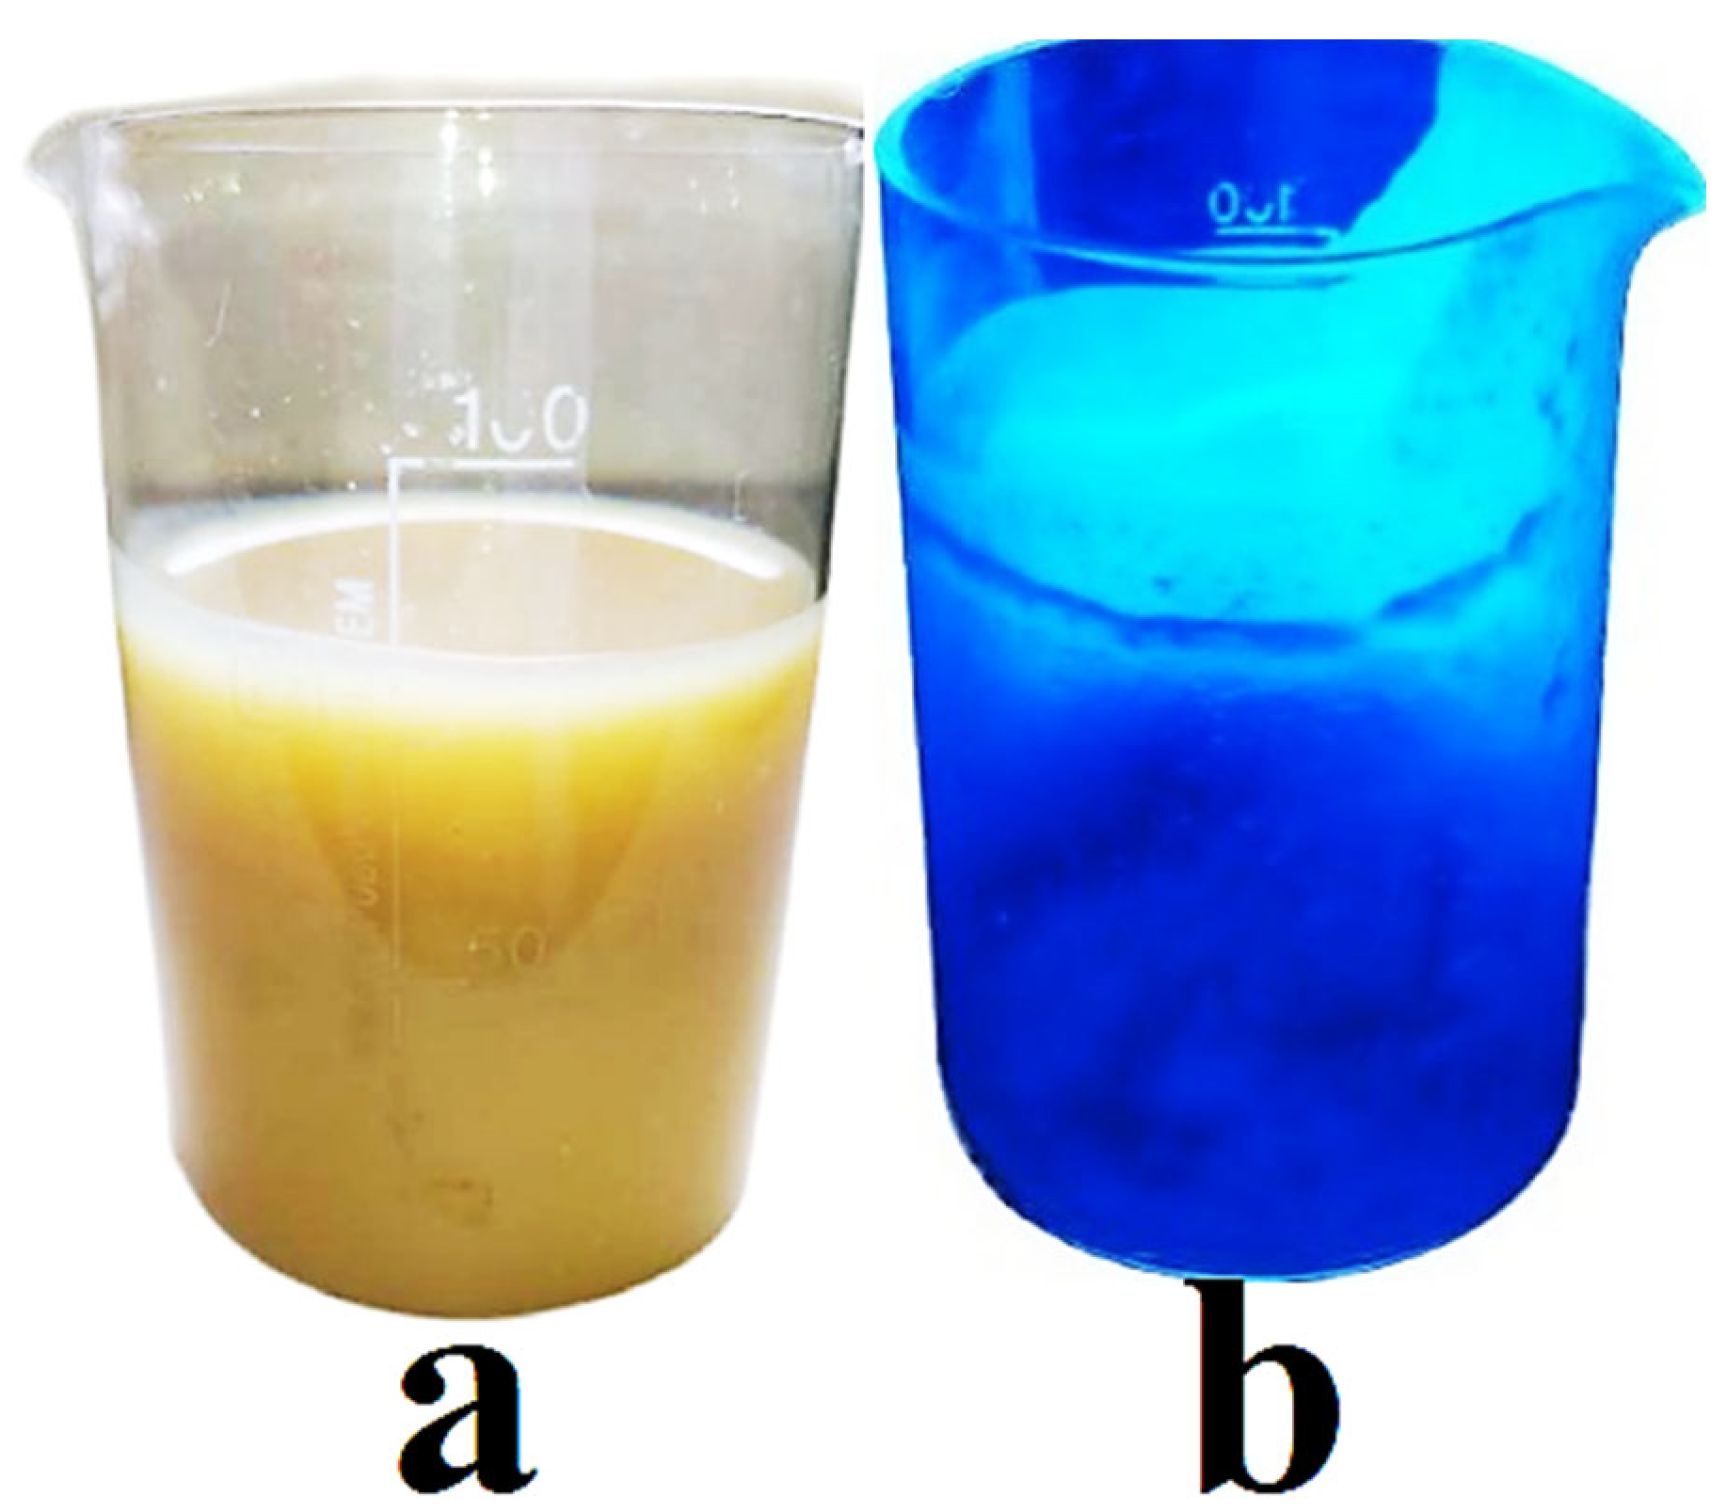
A suspension of the obtained compound in DMF when irradiated with UV light at a wavelength of 350 nm gives a bright blue color (Figure 3).
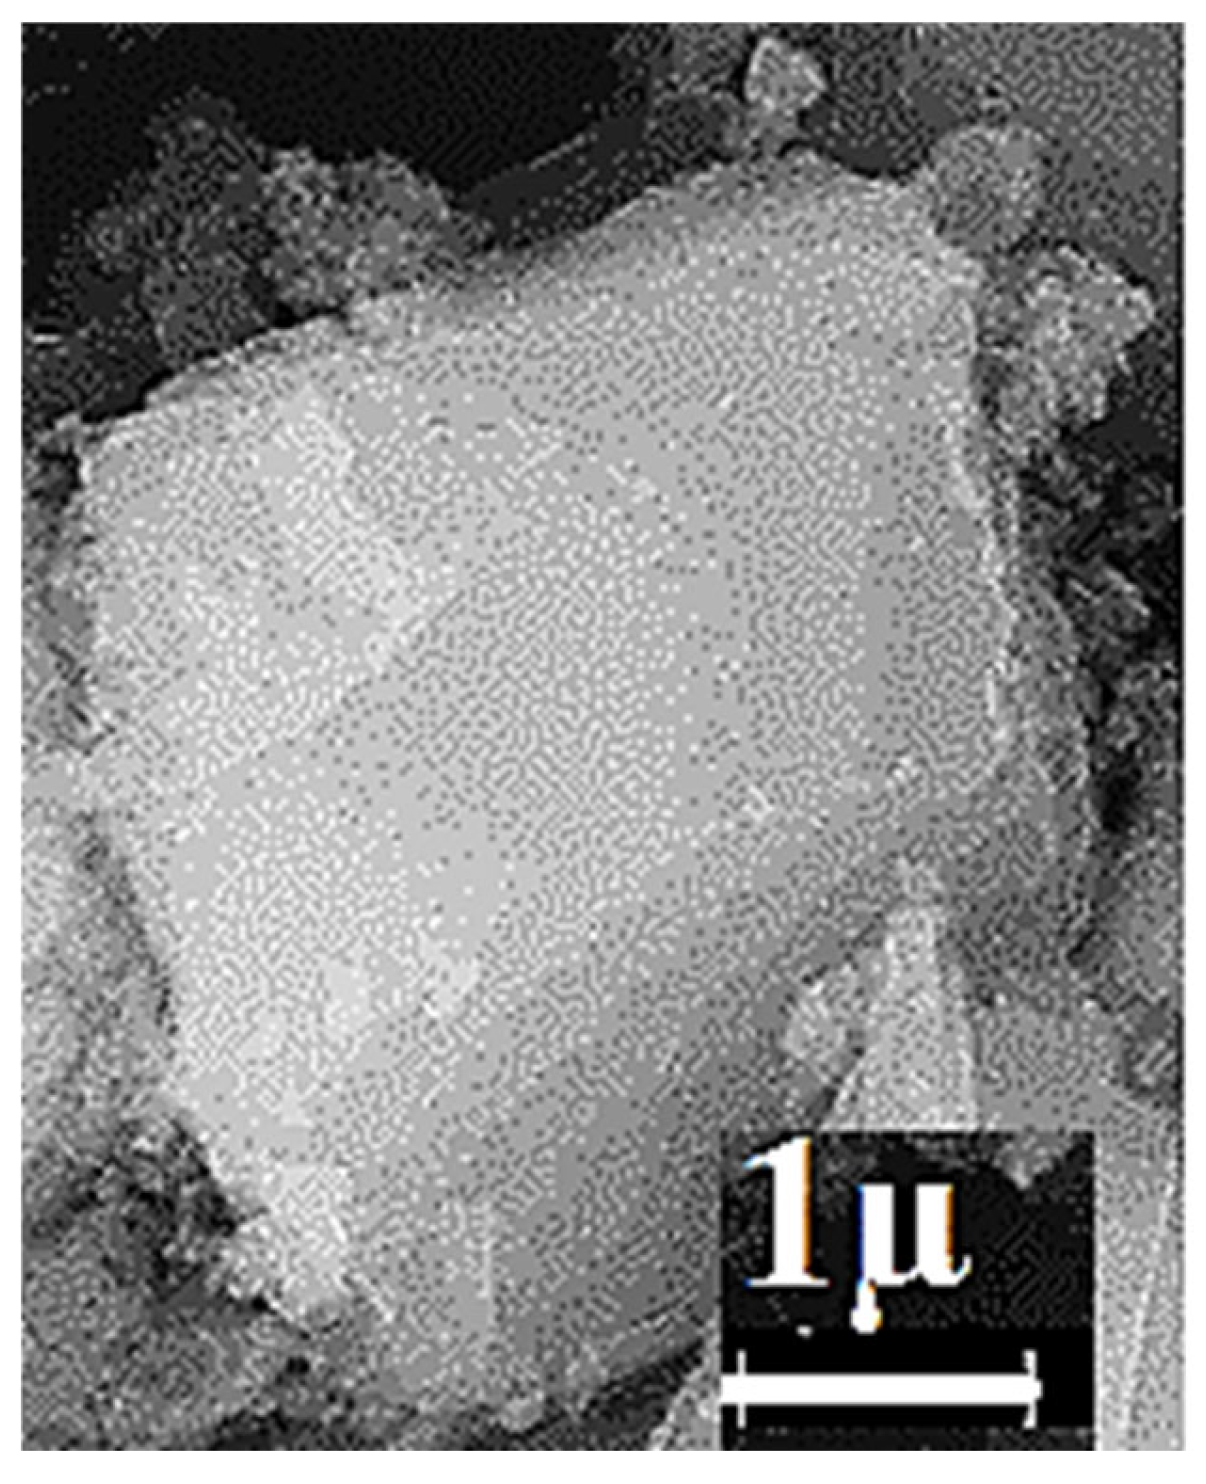
The morphology of the obtained sorbent was studied using SEM. Thisstudy showed that the compound is characterized by a well-defined crystalline structure. The crystals have a cubic shape and a monolithic texture, which indicates phase purity and a high degree of crystallinity. The crystal size is estimated at 2.5 × 1.4 × 1.4 μm (Figure 4).
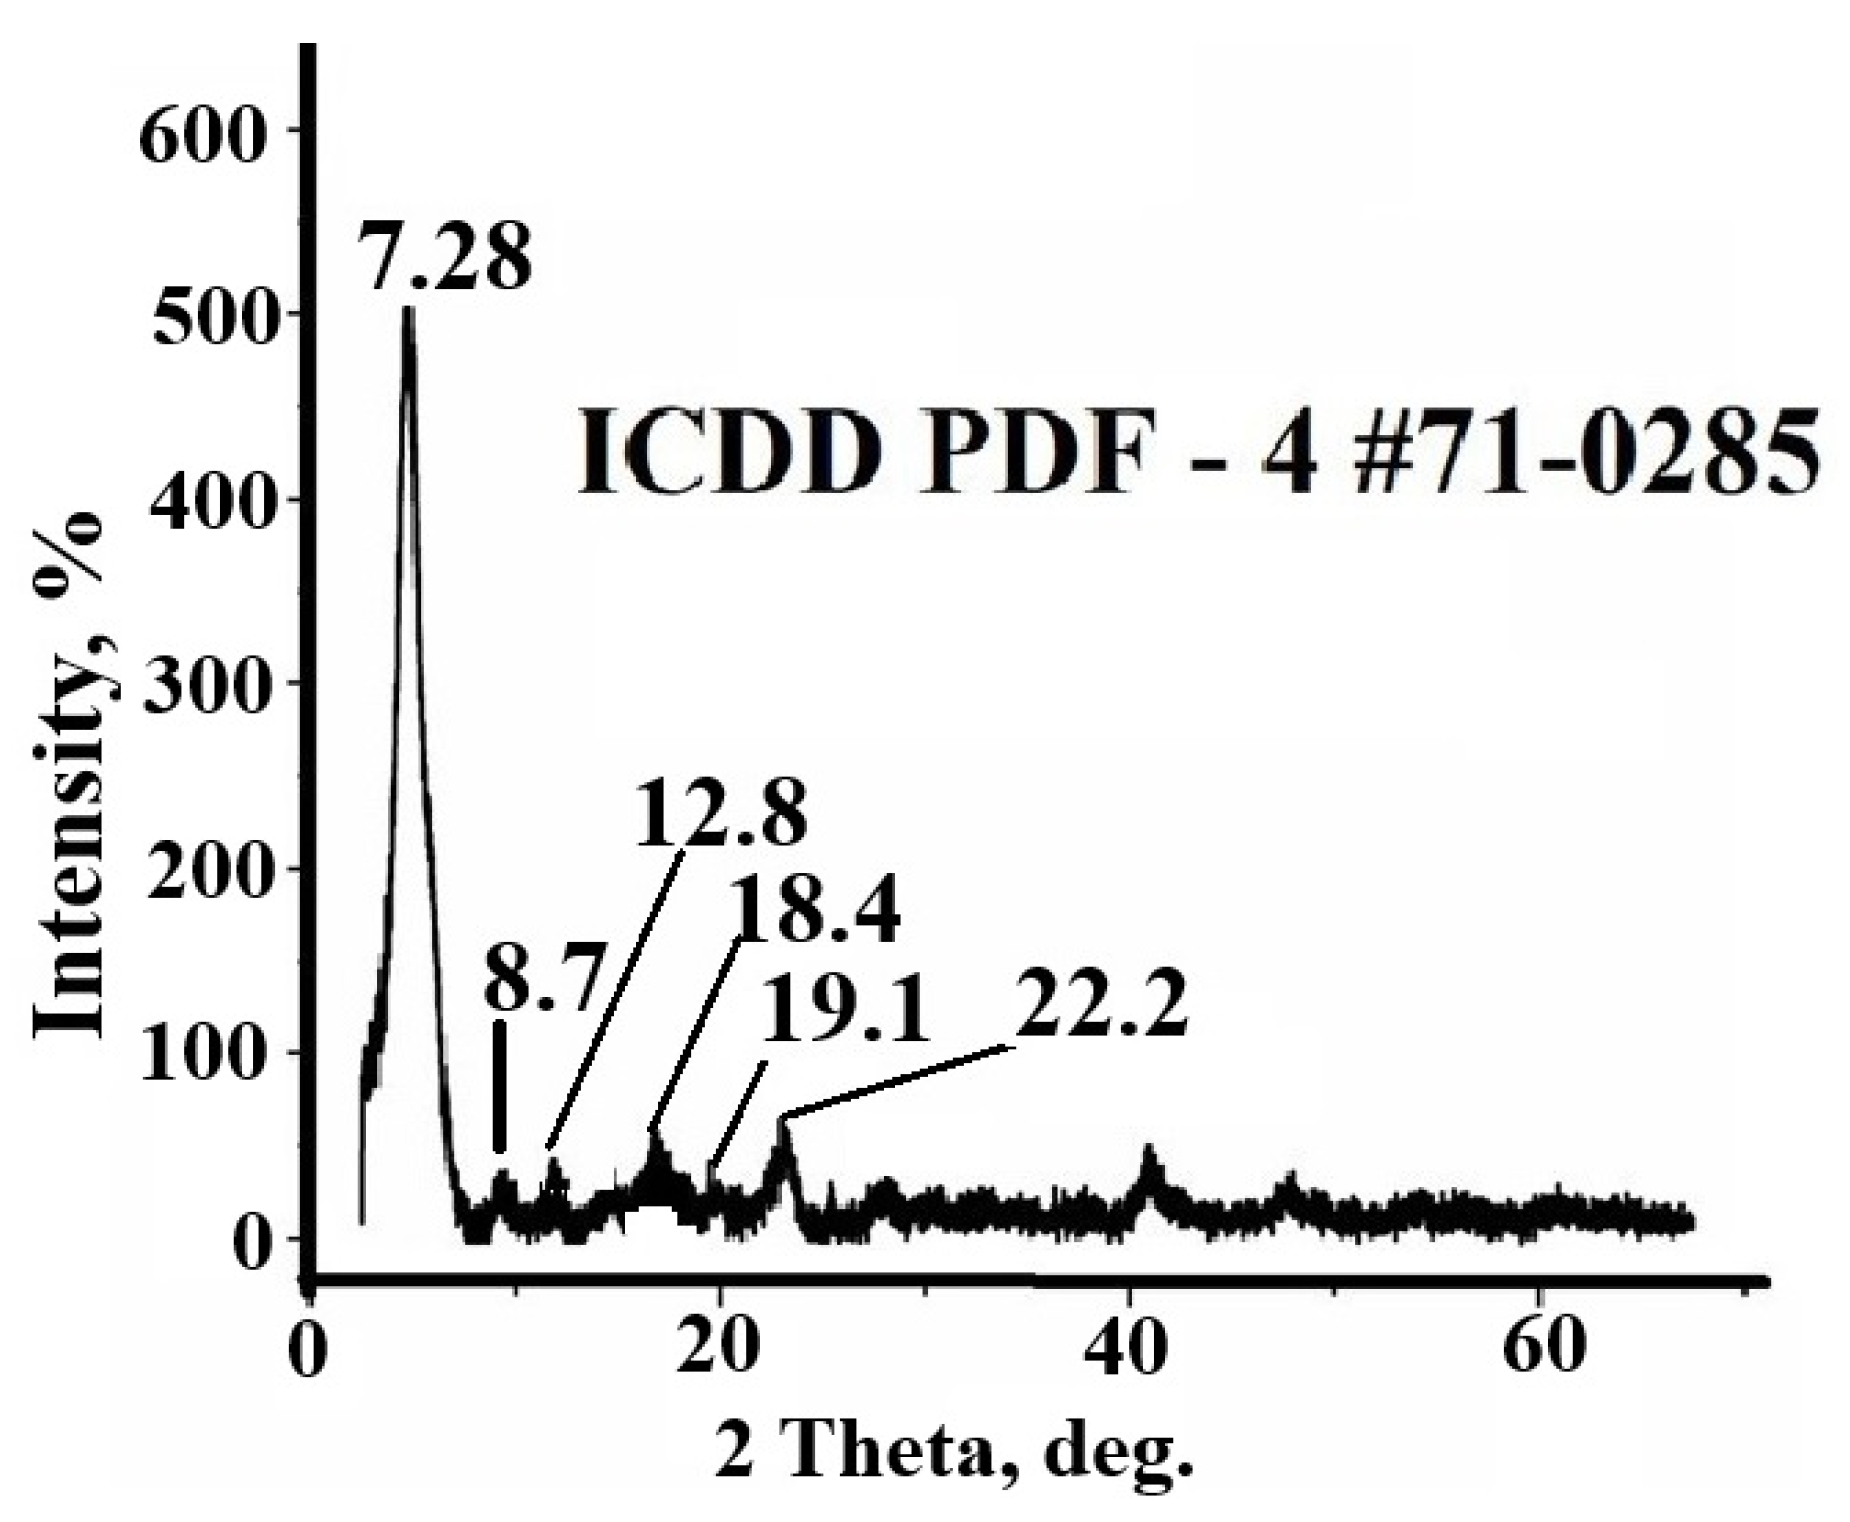
The synthesized compound was characterized by XRD (Figure 5). The analysis of the diffraction pattern revealed clear peaks at 7.28°, 8.7°, 12.8°, 18.4°, 19.1° and 22.2°. The obtained results are in good agreement with the data given in the literature and databases, which confirms the identity of the synthesized compound [26,29]. Calculation of the crystallite size using the Debye–Scherer formula showed an average size of about 150 nm.
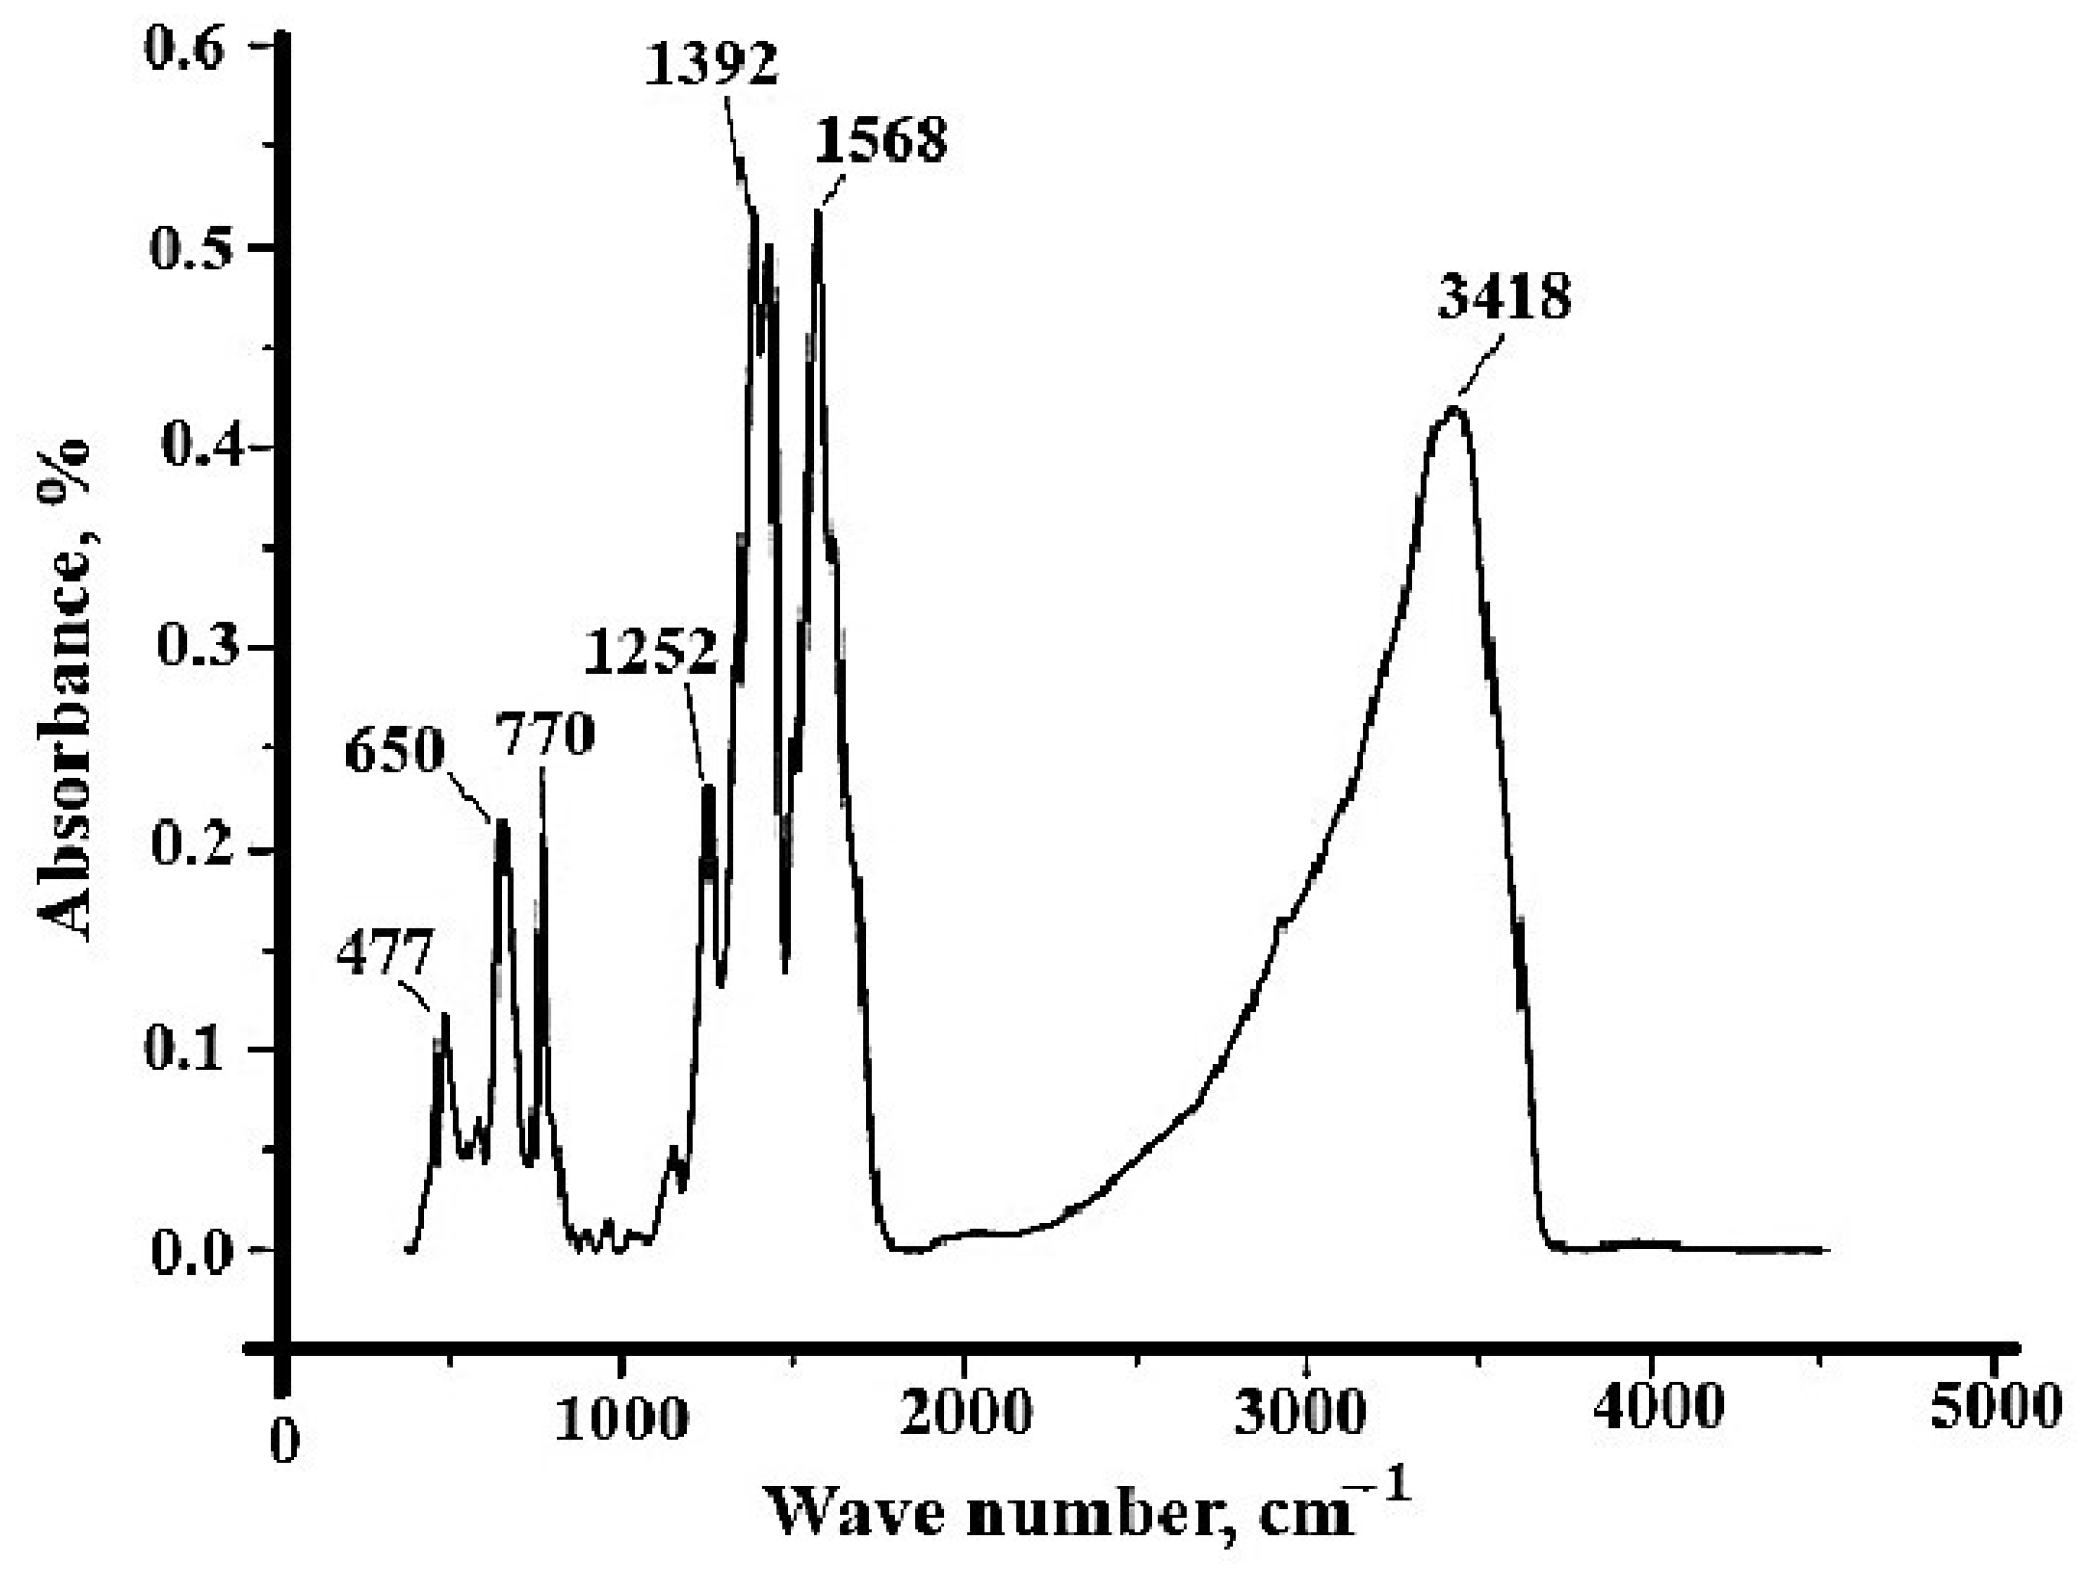
The obtained compound was characterized by IR spectroscopy in the frequency range from 4000 to 400 cm−1 (Figure 6). The obtained spectrum contains a broad and strongly pronounced band in the region of 3418 cm−1, characteristic of vibrations of the primary amino group [26]. Since the substance was thoroughly dried in a vacuum, the presence of water in the product, which could also cause vibrations in this region, can be excluded. The spectrum also contains intense absorption bands in the regions of 1568 and 1392 cm−1, characteristic of symmetric and asymmetric vibrations of the carboxylate ion. The difference between these frequencies is Δν = 176 cm−1, which is less than 220 cm−1;therefore, the carboxylate ion has C2V symmetry and can be coordinated both mono- and bidentately [30]. The absence of a band in the region of 1720 cm−1 indicates that 2-aminoterephthalic acid taken as a precursor is completely deprotonated and does not contaminate the obtained compound. In addition, the spectrum contains absorption bands at 770 cm−1 and 489 cm−1, characteristic of the Me-O bond and vibrations of the C-H bonds of the aromatic rings, respectively. This confirms the formation of Zr–O bonds in the sorbent. In general, the obtained absorption spectrum in the IR region agrees well with previously published data [26].
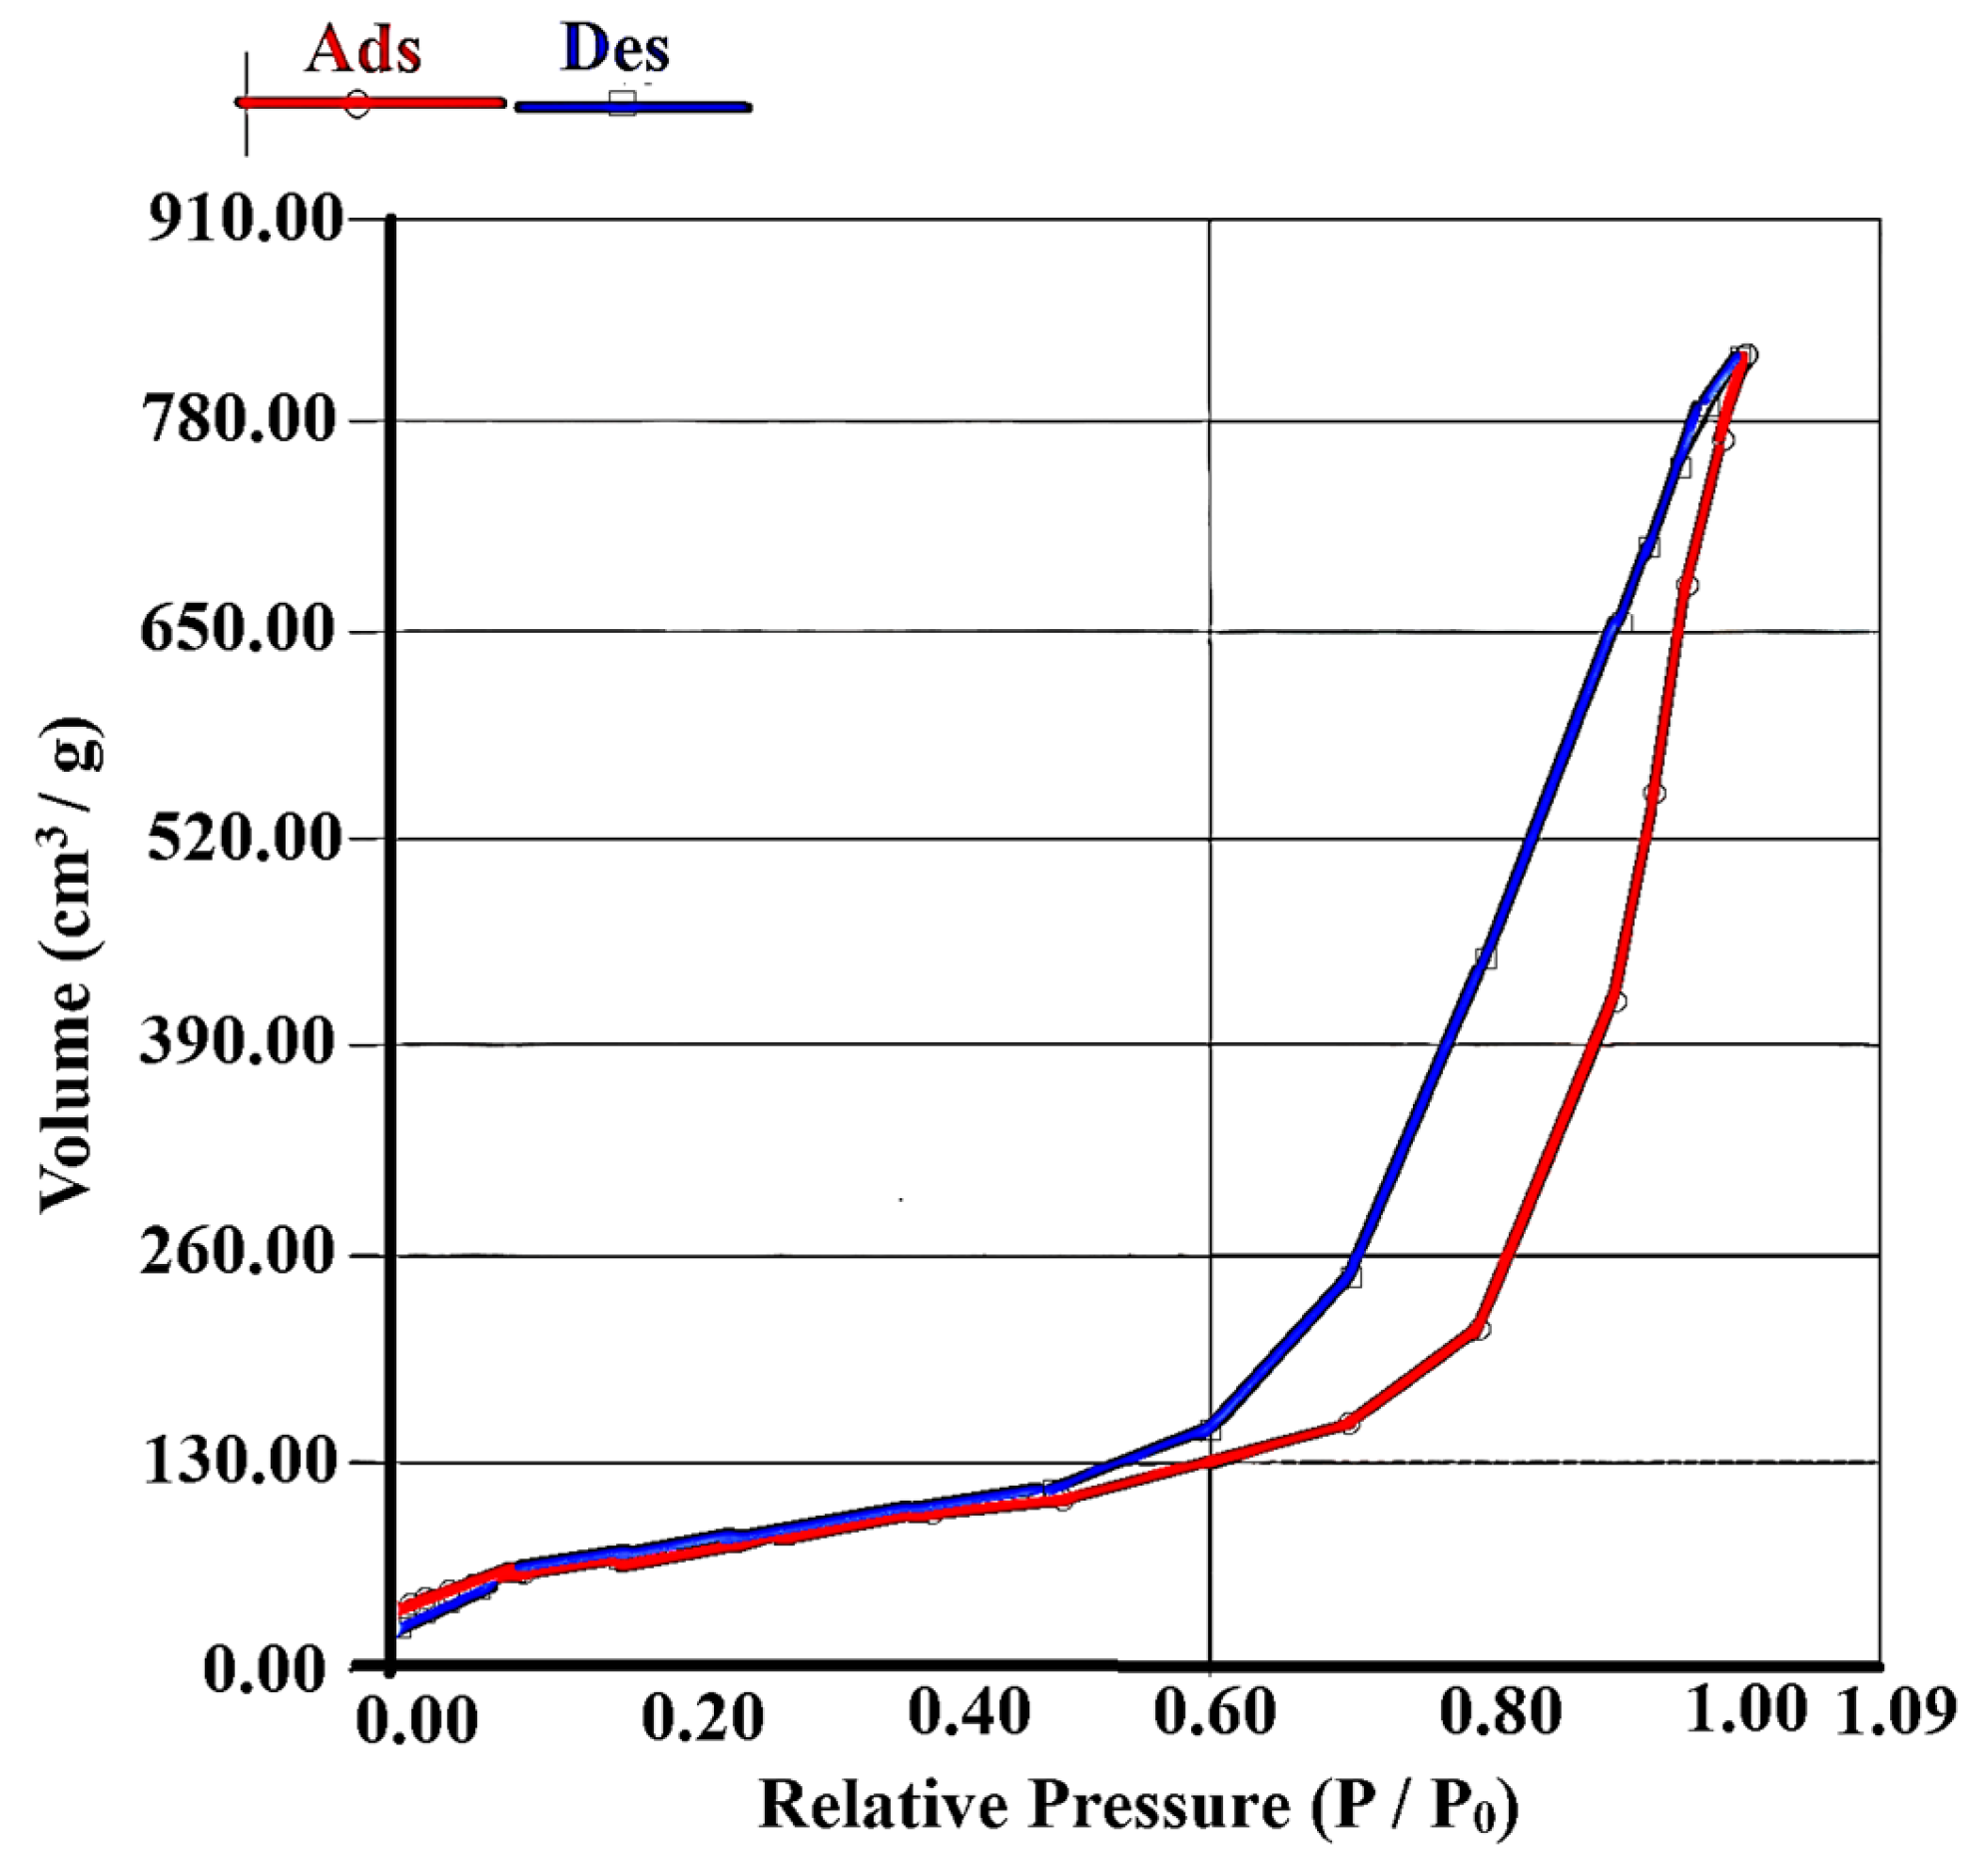
The area of the inner surface of the obtained sorbent was estimated by the BET method [25]. The nitrogen adsorption–desorption isotherms at 77 K, as well as the pore size distribution for the synthesized Zr-MOF, are shown in Figure 7. Analysis of the nitrogen adsorption isotherms shows that Zr-MOF is characterized by constant porosity and has a pronounced hysteresis loop. It should be noted that the initial section of the adsorption isotherm is linear up to relative pressure values of 0.62 P/P0. Above the linearity region, the shape of the isotherm is characterized by a pronounced steepness, which may indicate a narrow mesopore size distribution. The significant expression of the hysteresis loop reflects the process of capillary condensation of gas in the mesopores. These circumstances allow us to classify the adsorption as type IV according to the IUPAC classification, which corresponds to a material with both a microporous and mesoporous structure. The general characteristics of the sorbent are presented in Table 1.

3.2. Solid-Phase Extraction of Chlortetracycline Hydrochloridefrom the Aqueous Solution

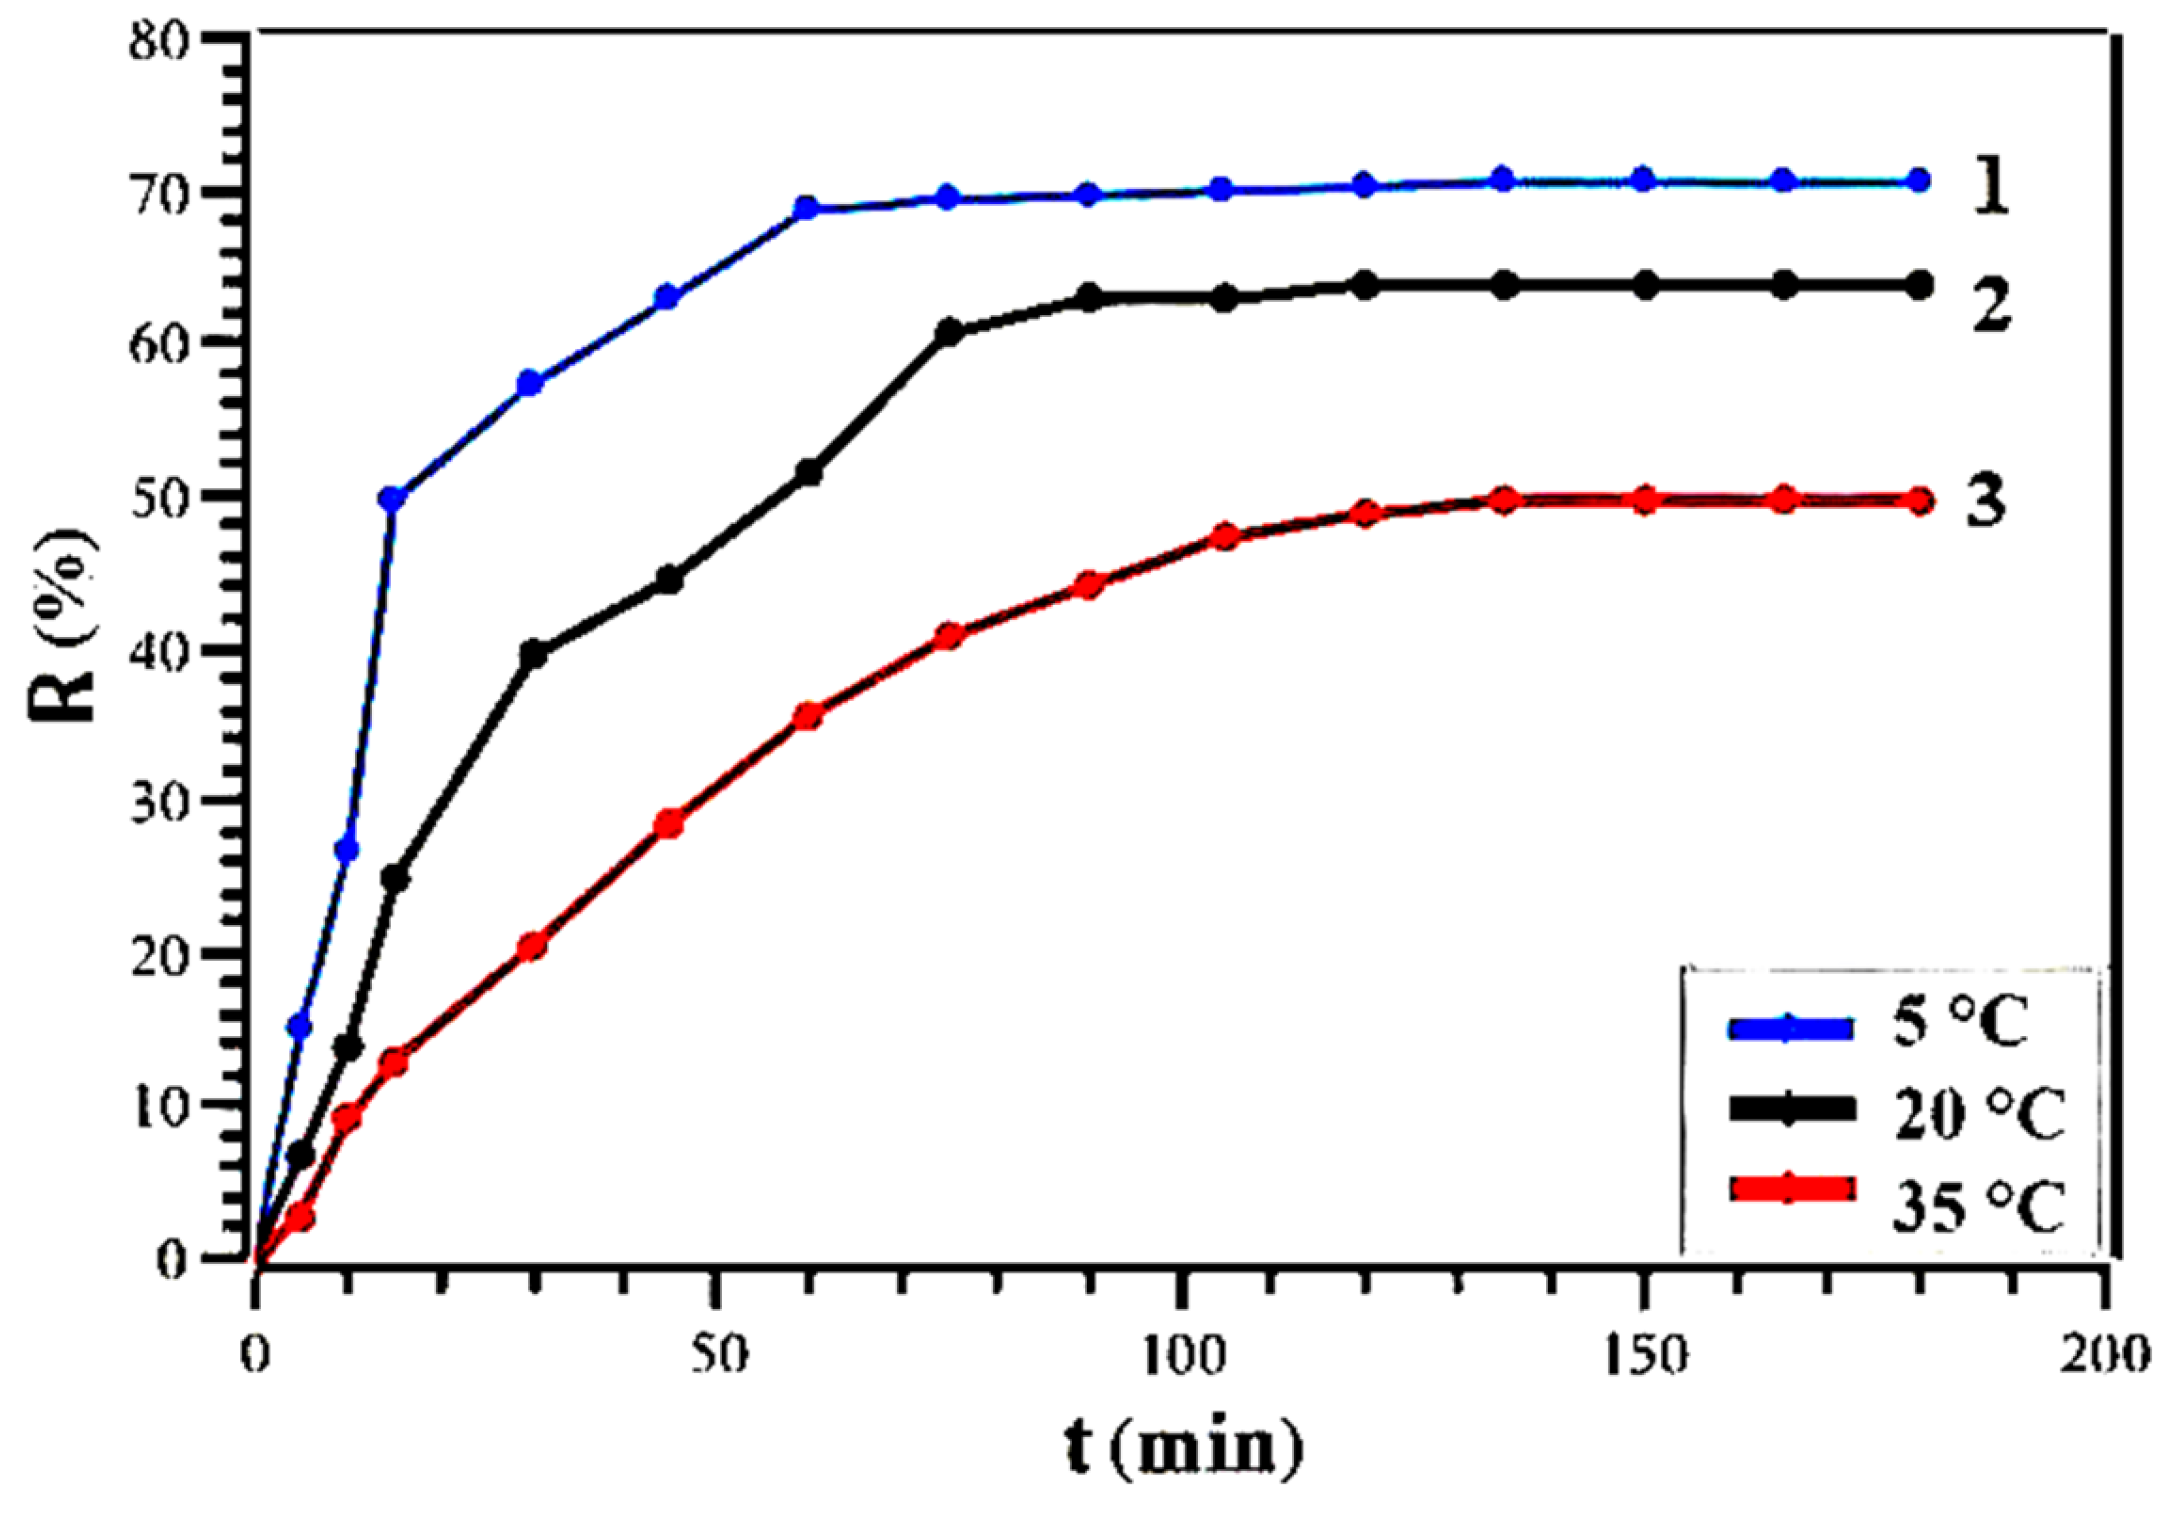
To assess the efficiency of sorption of the obtained sorbent, model experiments were conducted to study the sorption properties of Zr-MOF using a periodic method. The degree of extraction was calculated using Formula (1). Average values from fiveparallel measurements were taken. The results of the experiment are presented in Figure 8.
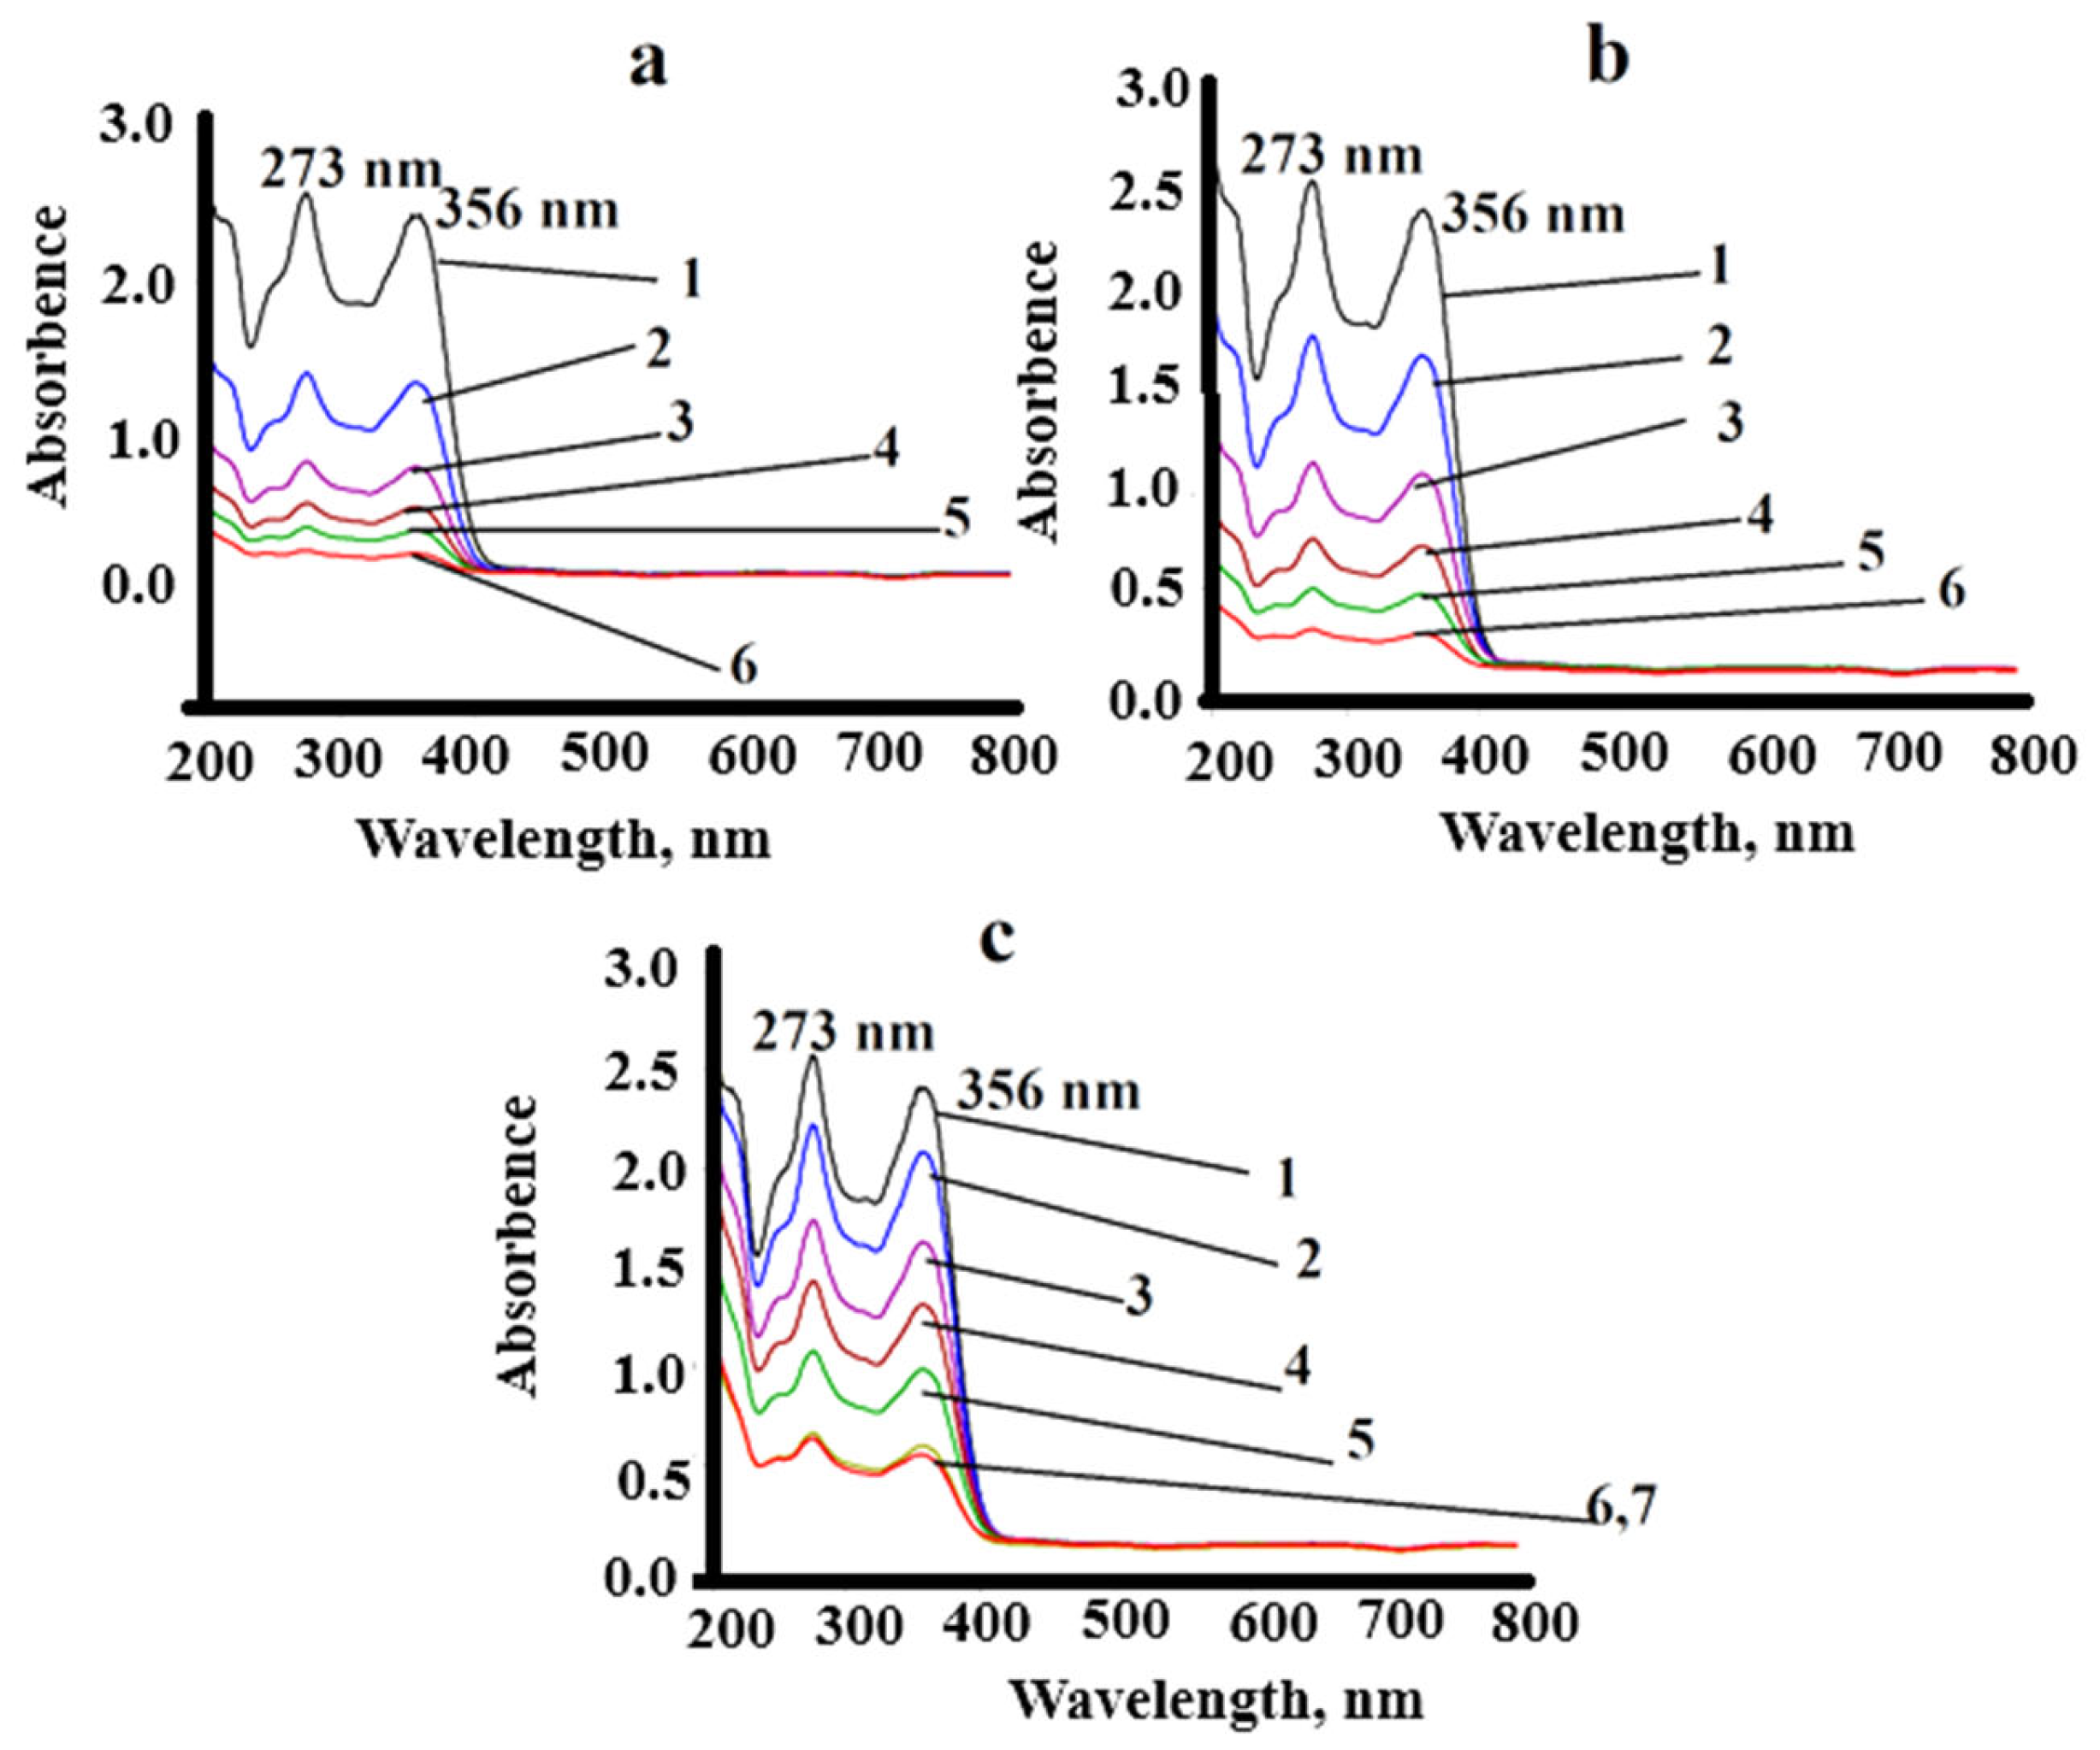
The dependence of the degree of sorption on the phase contact time is quite clearly expressed in the initial period of thisstudy and depends very significantly on the temperature. The maximum degree of sorption of CTC at 5 °C under the experimental conditions reaches 71.4%, and at 35 °C it slightly exceeds 40%. This fact is confirmed by the electronic absorption spectra presented in Figure 9.
The figure shows a regular decrease in the optical density of the solution and the establishment of an equilibrium concentration after 90 min, since the subsequent determination of the optical density showed that it did not change, and, therefore, no further decrease in concentration was observed. The figure also clearly shows a trend depending on temperature;at 5 °C, the concentration changed quite intensively, while at 20 °C, the decrease in concentration was less pronounced.
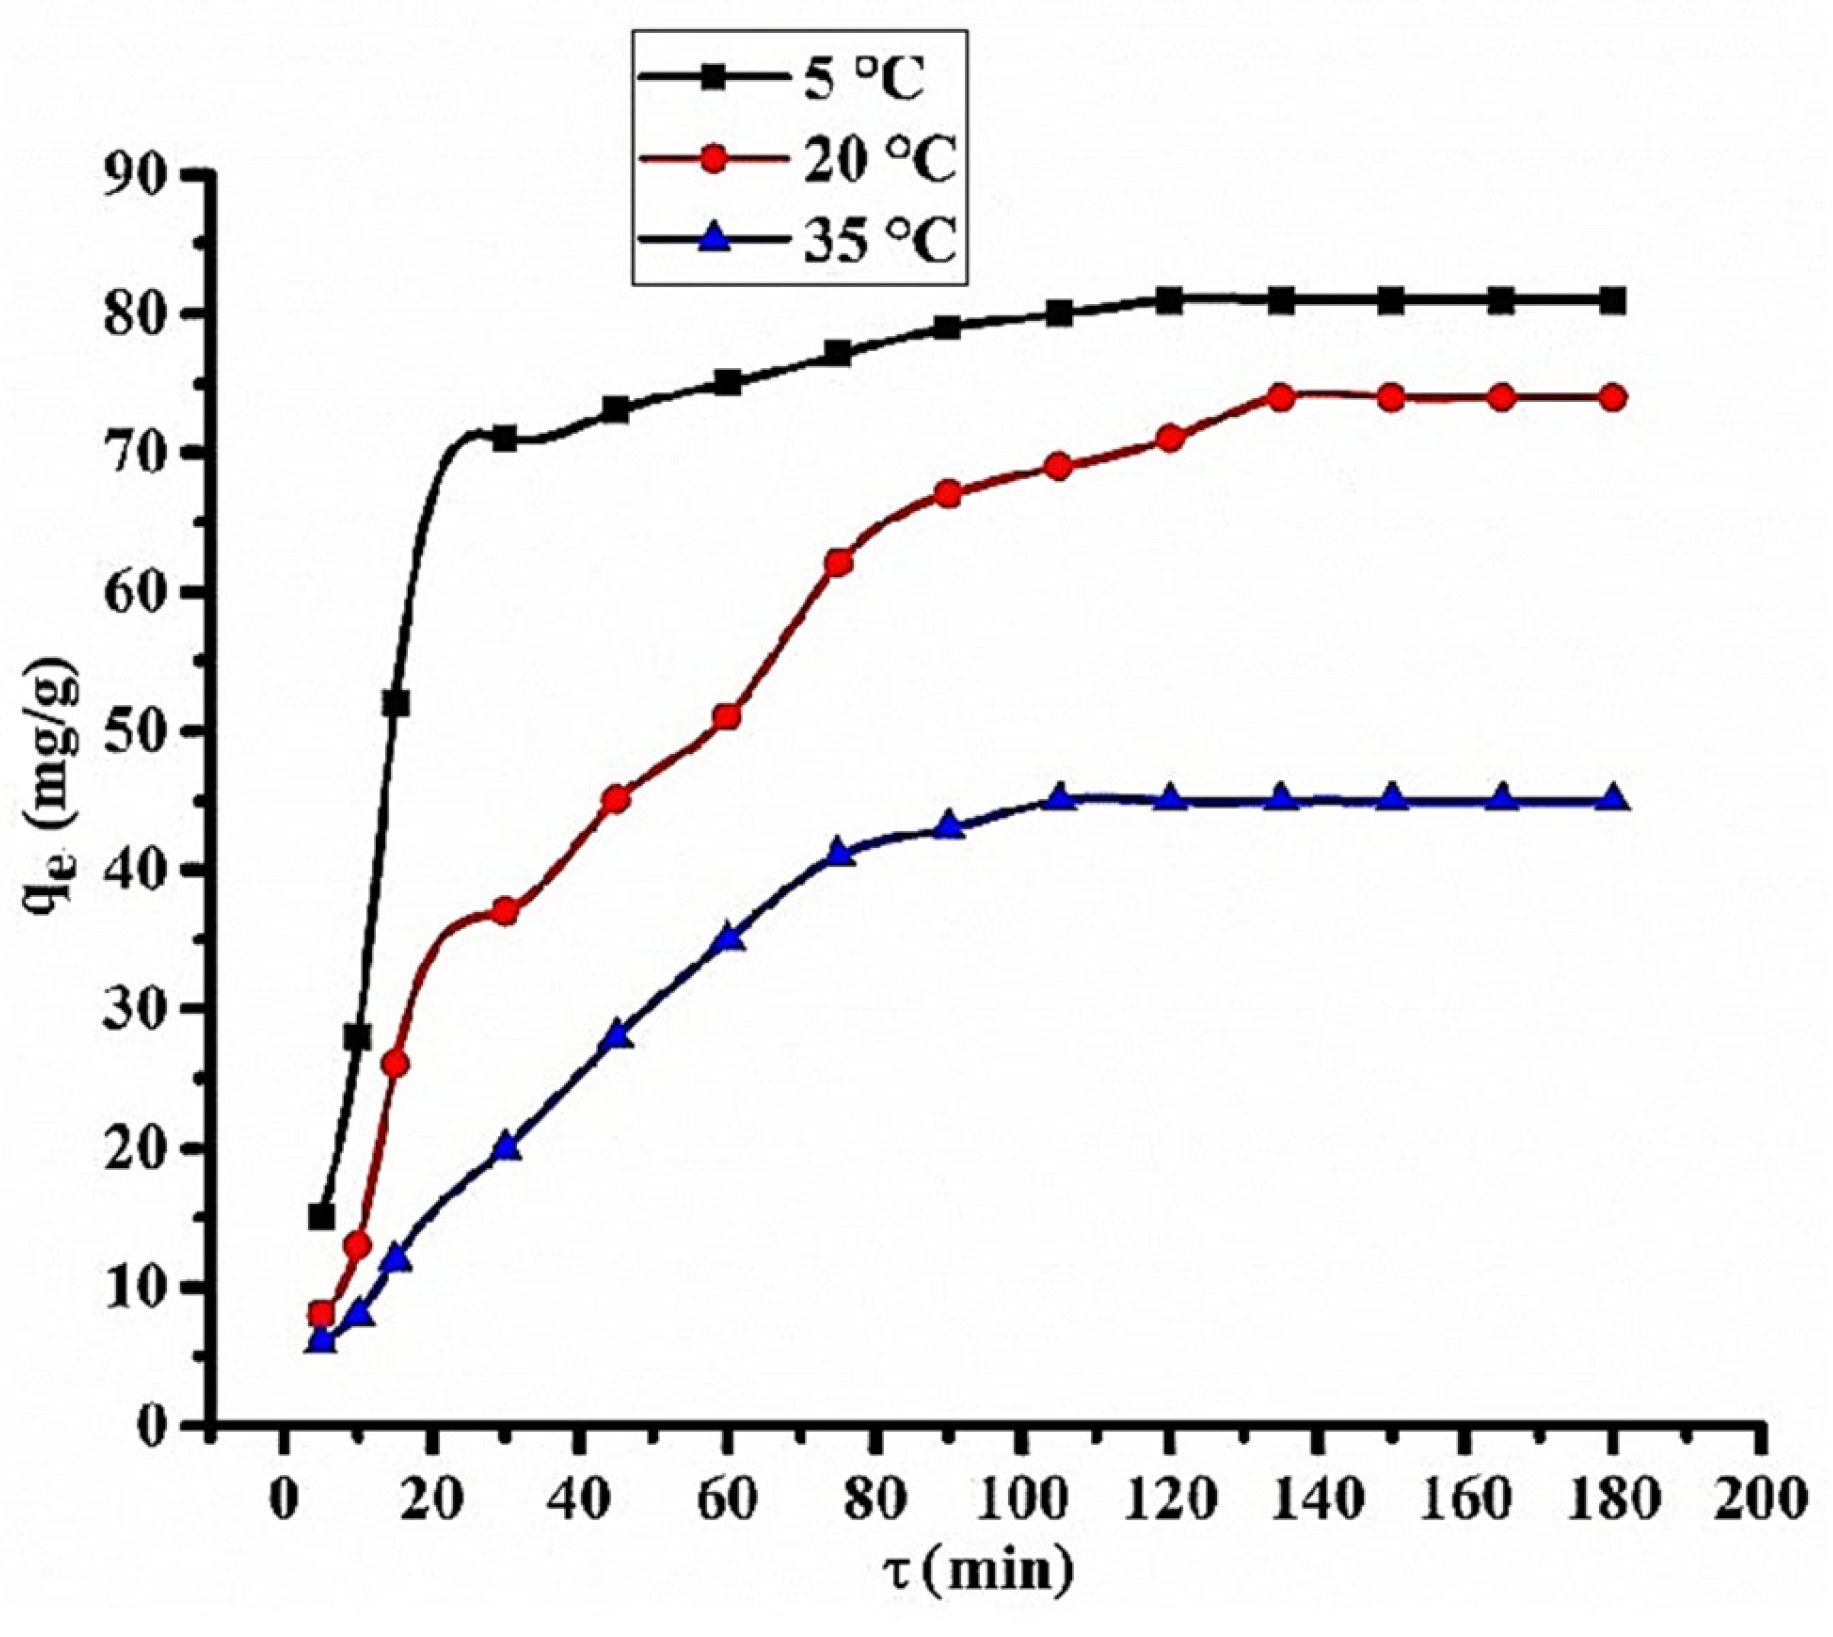
The kinetic curves of sorption of CTC are shown in Figure 10.
It is evident from the figure that the sorption rate of CTC depends significantly on temperature. At 5 °C, the sorption process begins quickly, but after 25 min, the sorption rate drops significantly and reaches a plateau by 120 min. At 20 °C, the process proceeds in such a way that three sections can be distinguished: from 0 to 30 min, the kinetics of the process is similar to the kinetics at 5 °C, namely, the concentration changes quickly. In the range from 40 to 140 min, the sorption rate decreases and reaches the third section at 140 min, i.e., it reaches a plateau. SPE conducted at 35 °C is very different from the previous cases. The sorption capacity is insignificant, and the sorption rate increases uniformly up to 70 min, after which it reaches a clearly defined plateau.
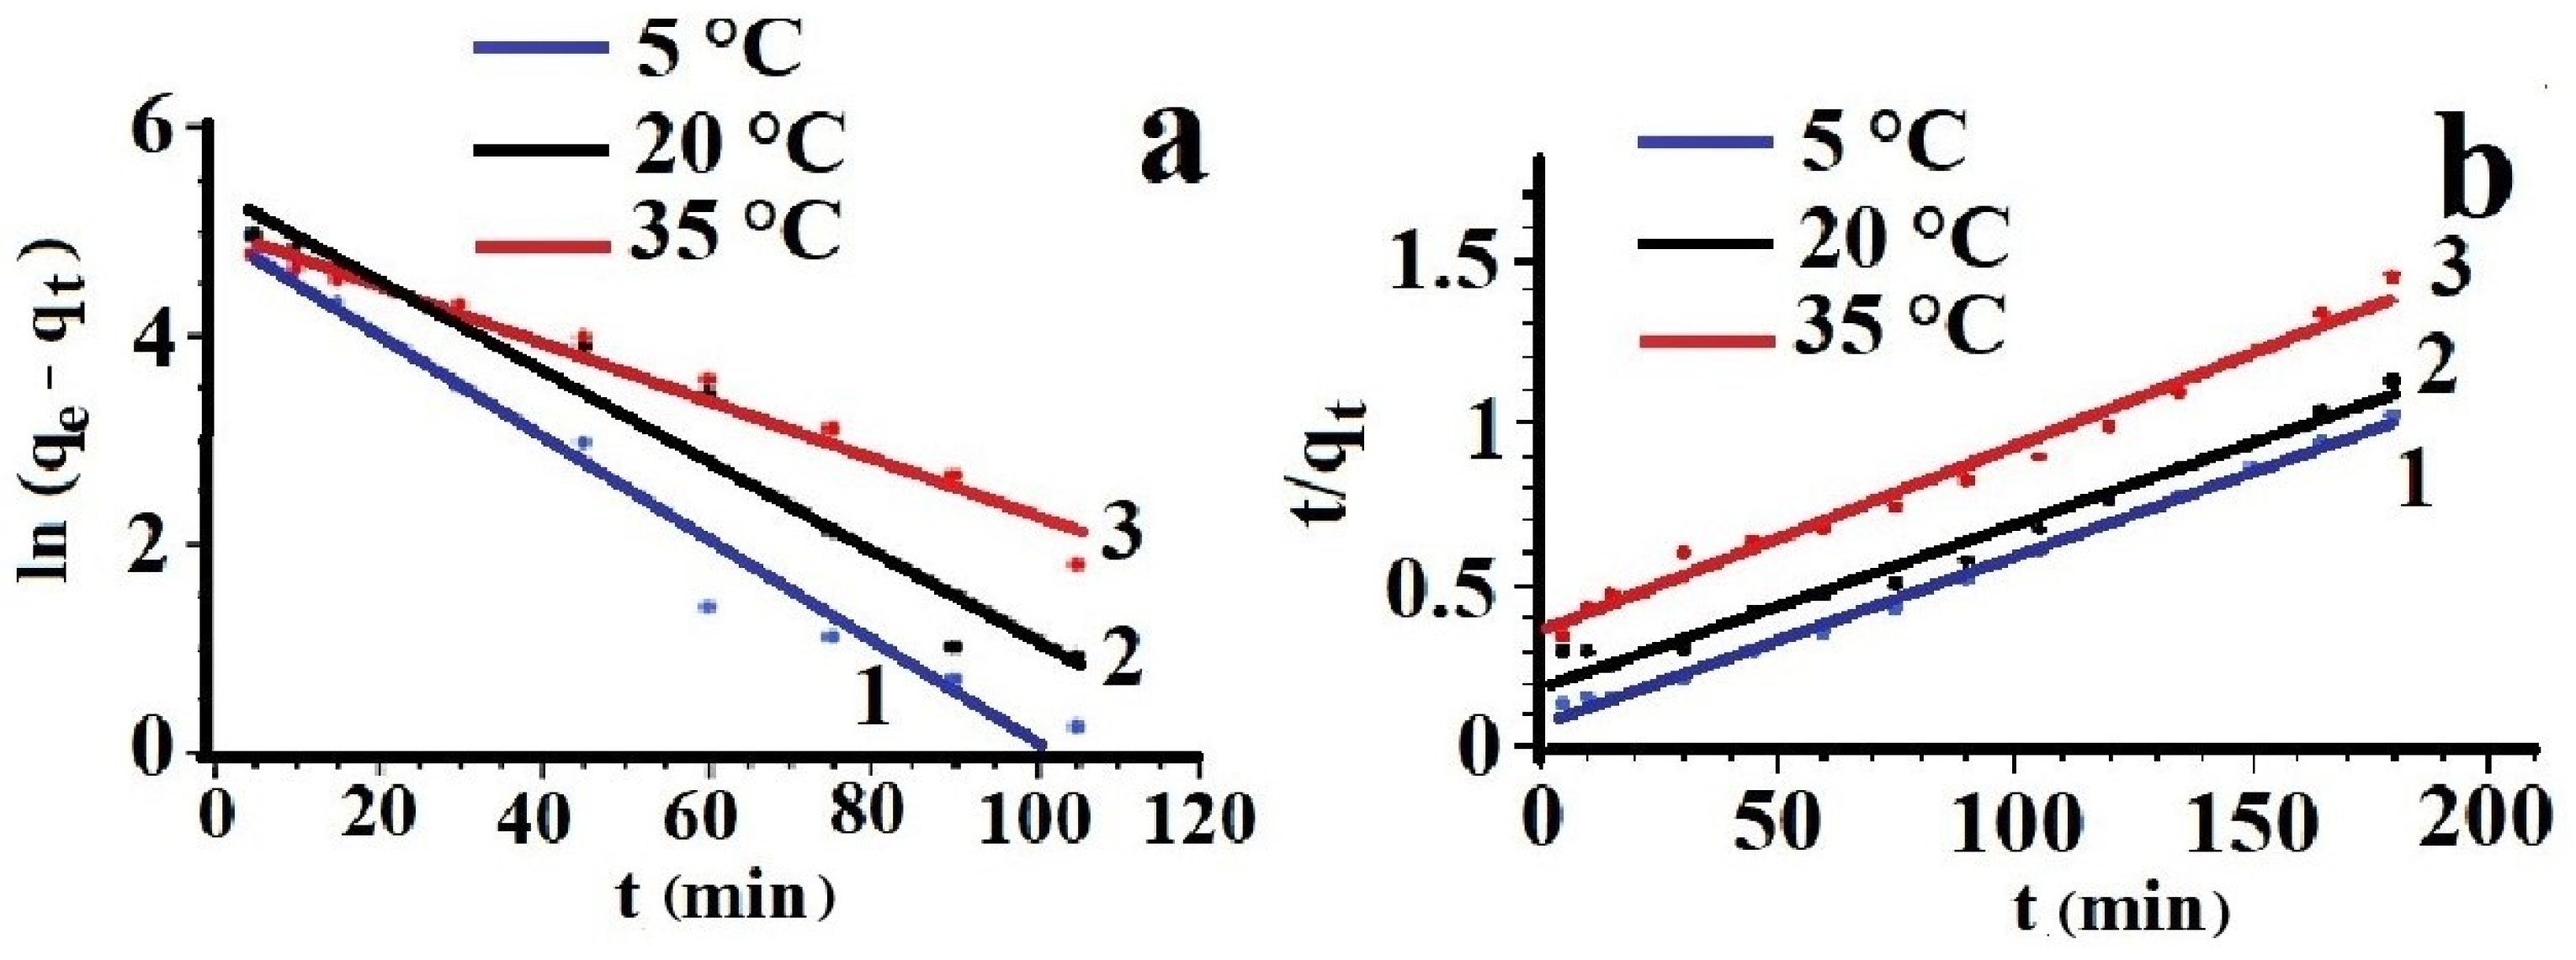
The obtained data were analyzed using kinetic models of pseudo-first and pseudo-second order reactions for sorption processes. It is important to take into account the features of analyte sorption into the solid phase, since sorbent saturation differs from the general sorption mode described by a linear dependence. It should be noted that this process is affected by a number of factors that must be taken into account. These include the following:
The time required to achieveequilibrium between the analyte already sorbed in the solid phase and the residual analyte in the solution depends on its concentration in the volume being studied. This is explained by the fact that at the equivalence point (this state can be defined as the saturation mode), only a certain part of the total amount of analyte can be sorbed. The final distribution of concentrations and, accordingly, the mass of the sorbed analyte are determined mainly by the sorption capacity of the sorbent and not by the concentration of the analyte in the analyzed solution.
The transition of the analyte from a free form to a form fixed in the sorbent, where it loses the ability to move freely through the sorbent layer, ultimately leads to a slowdown in diffusion.
The conditions created during sorption are determined by mass transfer across the interface formed by the boundary layers of the sorbent in the solid phase. This process affects the establishment of equilibrium, which is ultimately determined by the degree of mixing or the height of the sorbent layer if the sorption is carried out in a column.
In this study, we applied the pseudo-first and pseudo-second order kinetic models of sorption, taking into account the above conditions and based on the Harouna-Oumarou sorption model [30]. This expression allows us to analyze the values of Ae and Ea, which can be calculated graphically from the plot of ln k versus 1/T. The activation energy (Ea) can be calculated as the slope of the obtained straight line, and the Arrhenius constant (Ae) can be calculated as the intercept on the ordinate axis. Using this method to analyze the kinetics of CTC sorption from an aqueous solution, we established the patterns shown in Figure 11.
The results of the analysis of the studied processes showed that the pseudo-first-order equation describes the sorption process well at the initial stages, when diffusion in the film plays a significant role. At the beginning of the process, the pollutant molecules quickly move into the sorbent pores due to an increase in the concentration of molecules on the sorbent surface. However, over time, this process slows down and other mechanisms begin to operate, which limits the application of this model as a whole for the entire process.
Based on the calculated values of the determination coefficient, it can be judged that the pseudo-first-order kinetic model of sorption (R2 = 0.874) (Figure 11a) describes the process less accurately. Thus, the pseudo-second-order kinetic model (R2 = 0.992) (Figure 11b) is more preferable for describing the CTC sorption process.
Based on the revealed regularities, the reaction rate constant was calculated using a graphical method. Knowing the rate constant, it is possible to determine the activation energy and thermodynamic characteristics of the reaction. The obtained characteristics are presented in Table 2.
It is evident from the data presented in the table that with increasing temperature, there is a regular increase in the sorption rate constant. Based on the obtained data, the dependence of the logarithm of the sorption rate constant on the inverse temperature was investigated, shown in Figure 12.
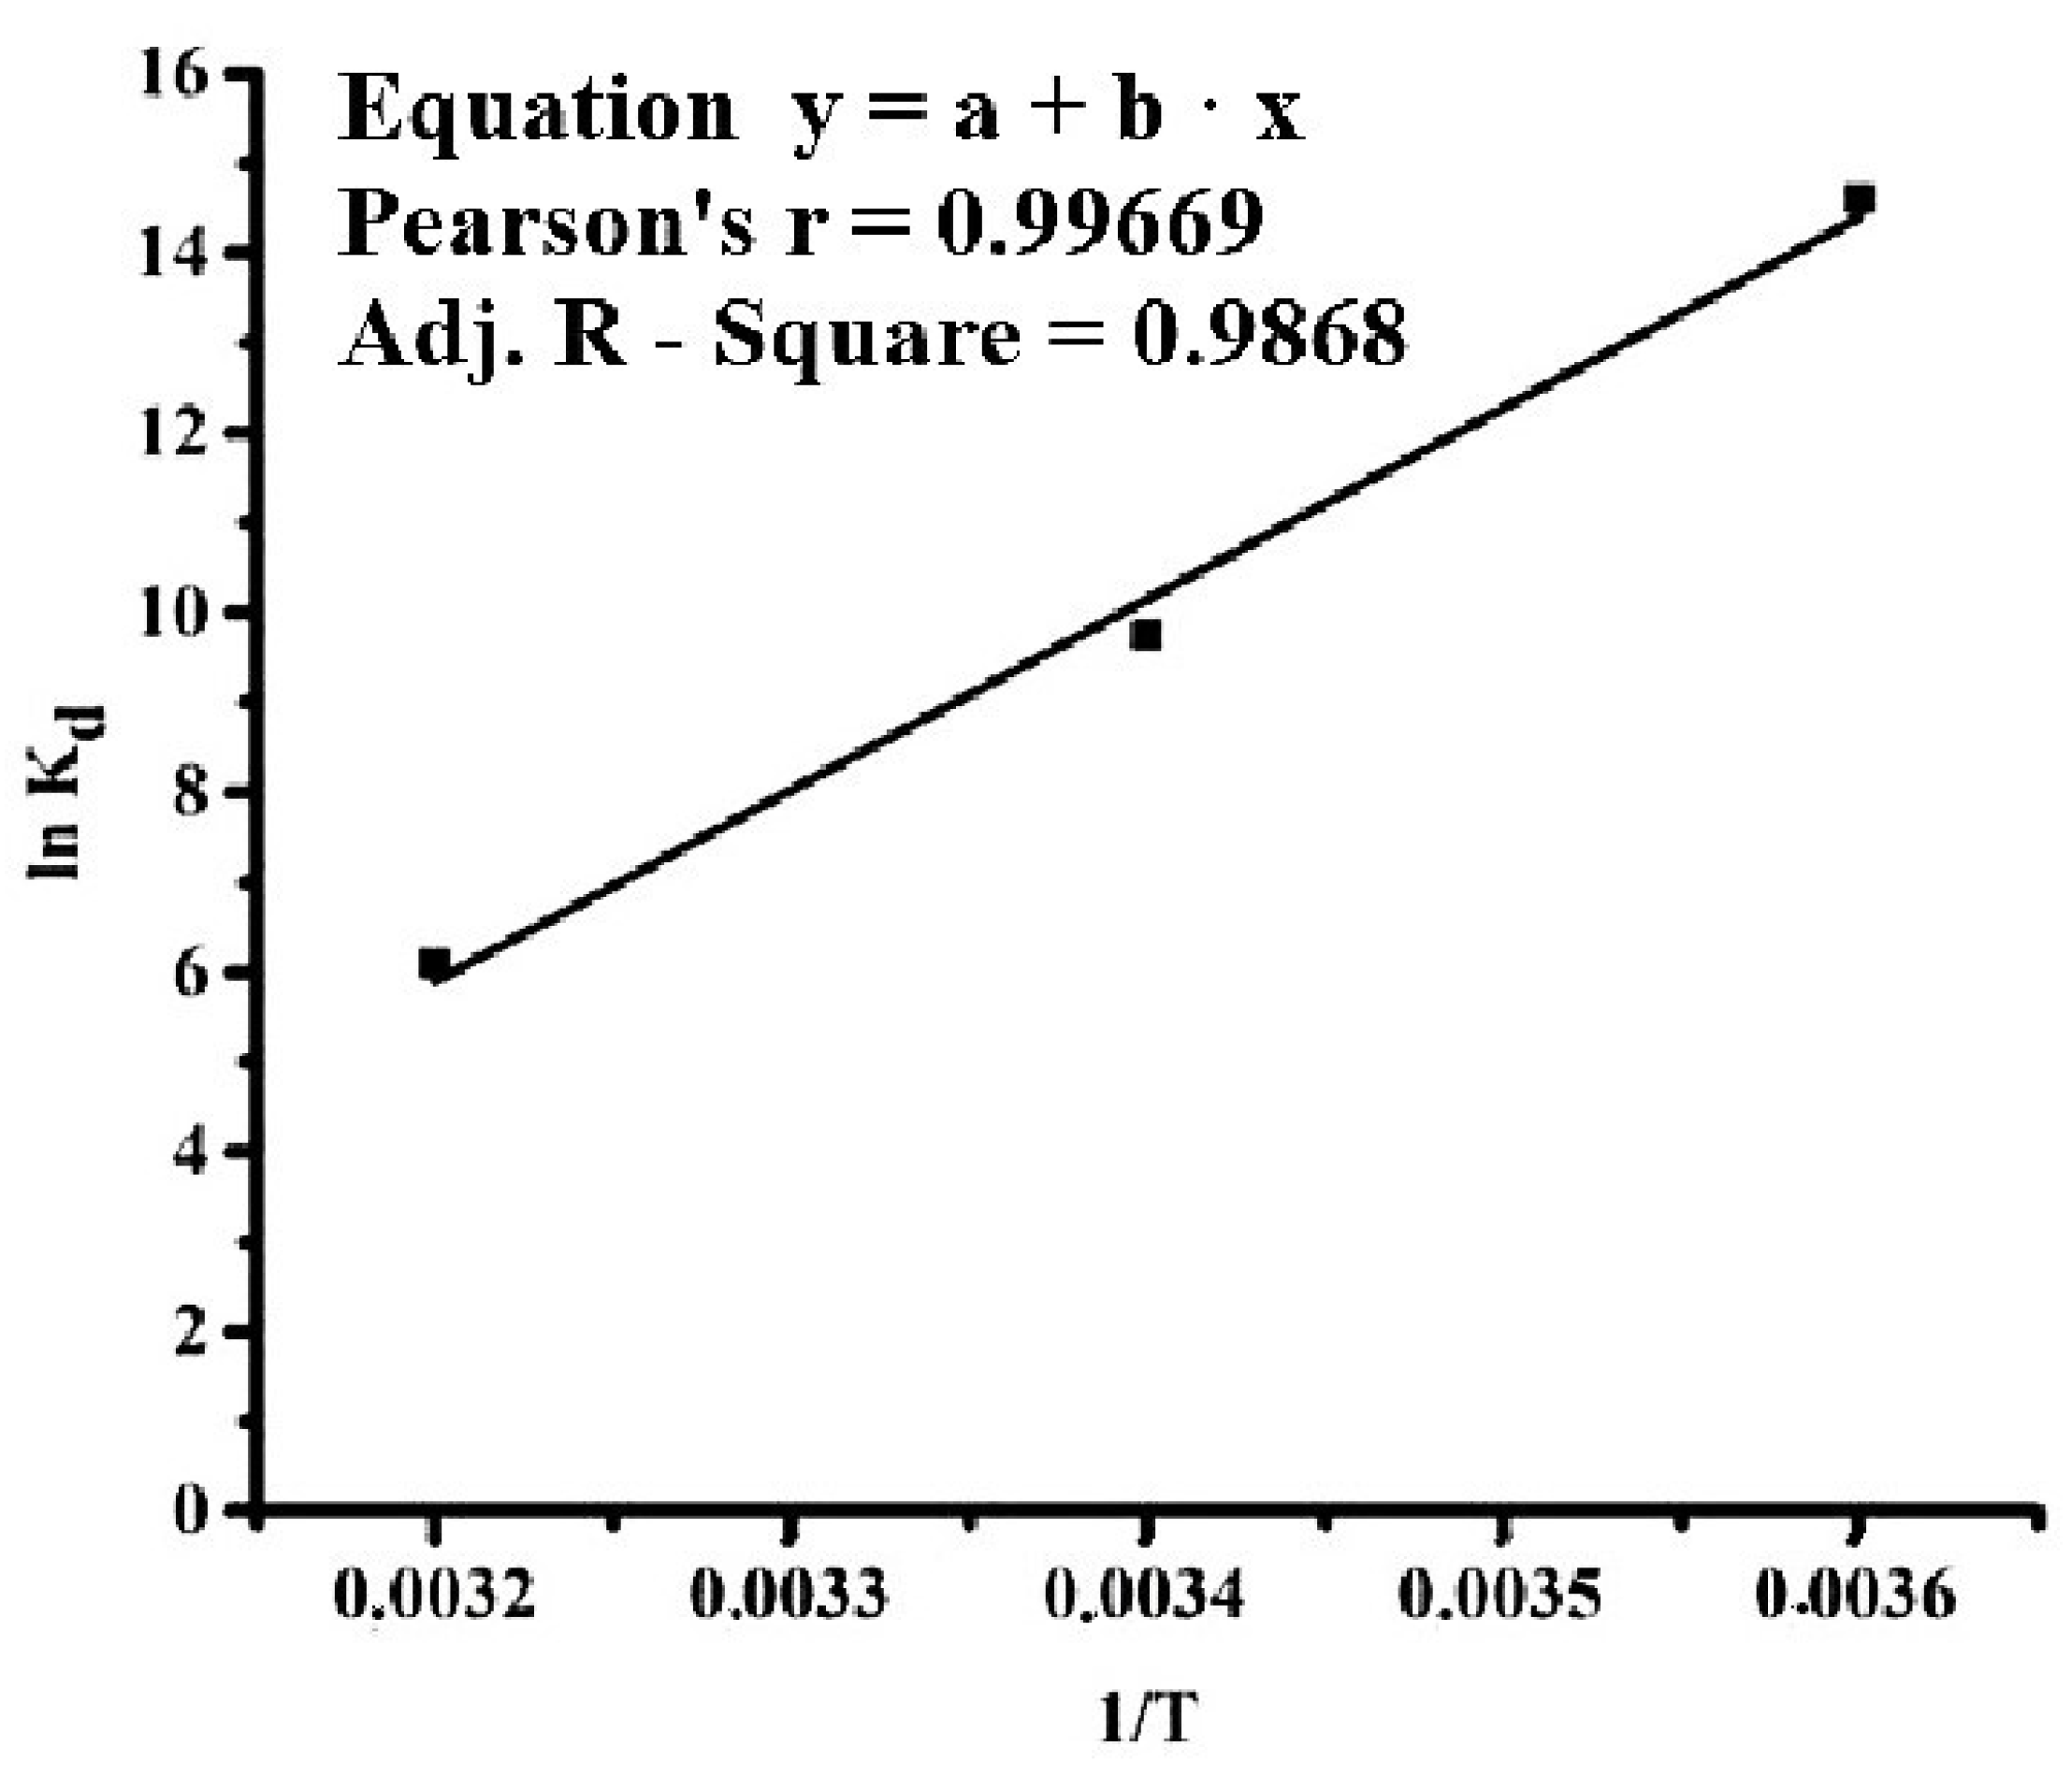
Based on Figure 12, the activation energy of the sorption process was calculated to be 6.48 kJ/mol. To calculate the thermodynamic parameters, the thermodynamic distribution constant was used, on the basis of which the Gibbs free energy was determined, and based on the dependence of the logarithm of the distribution constant on the inverse temperature (Figure 13), the enthalpy of the process and the entropy value were graphically determined.
The obtained thermodynamic parameters are given in Table 3.
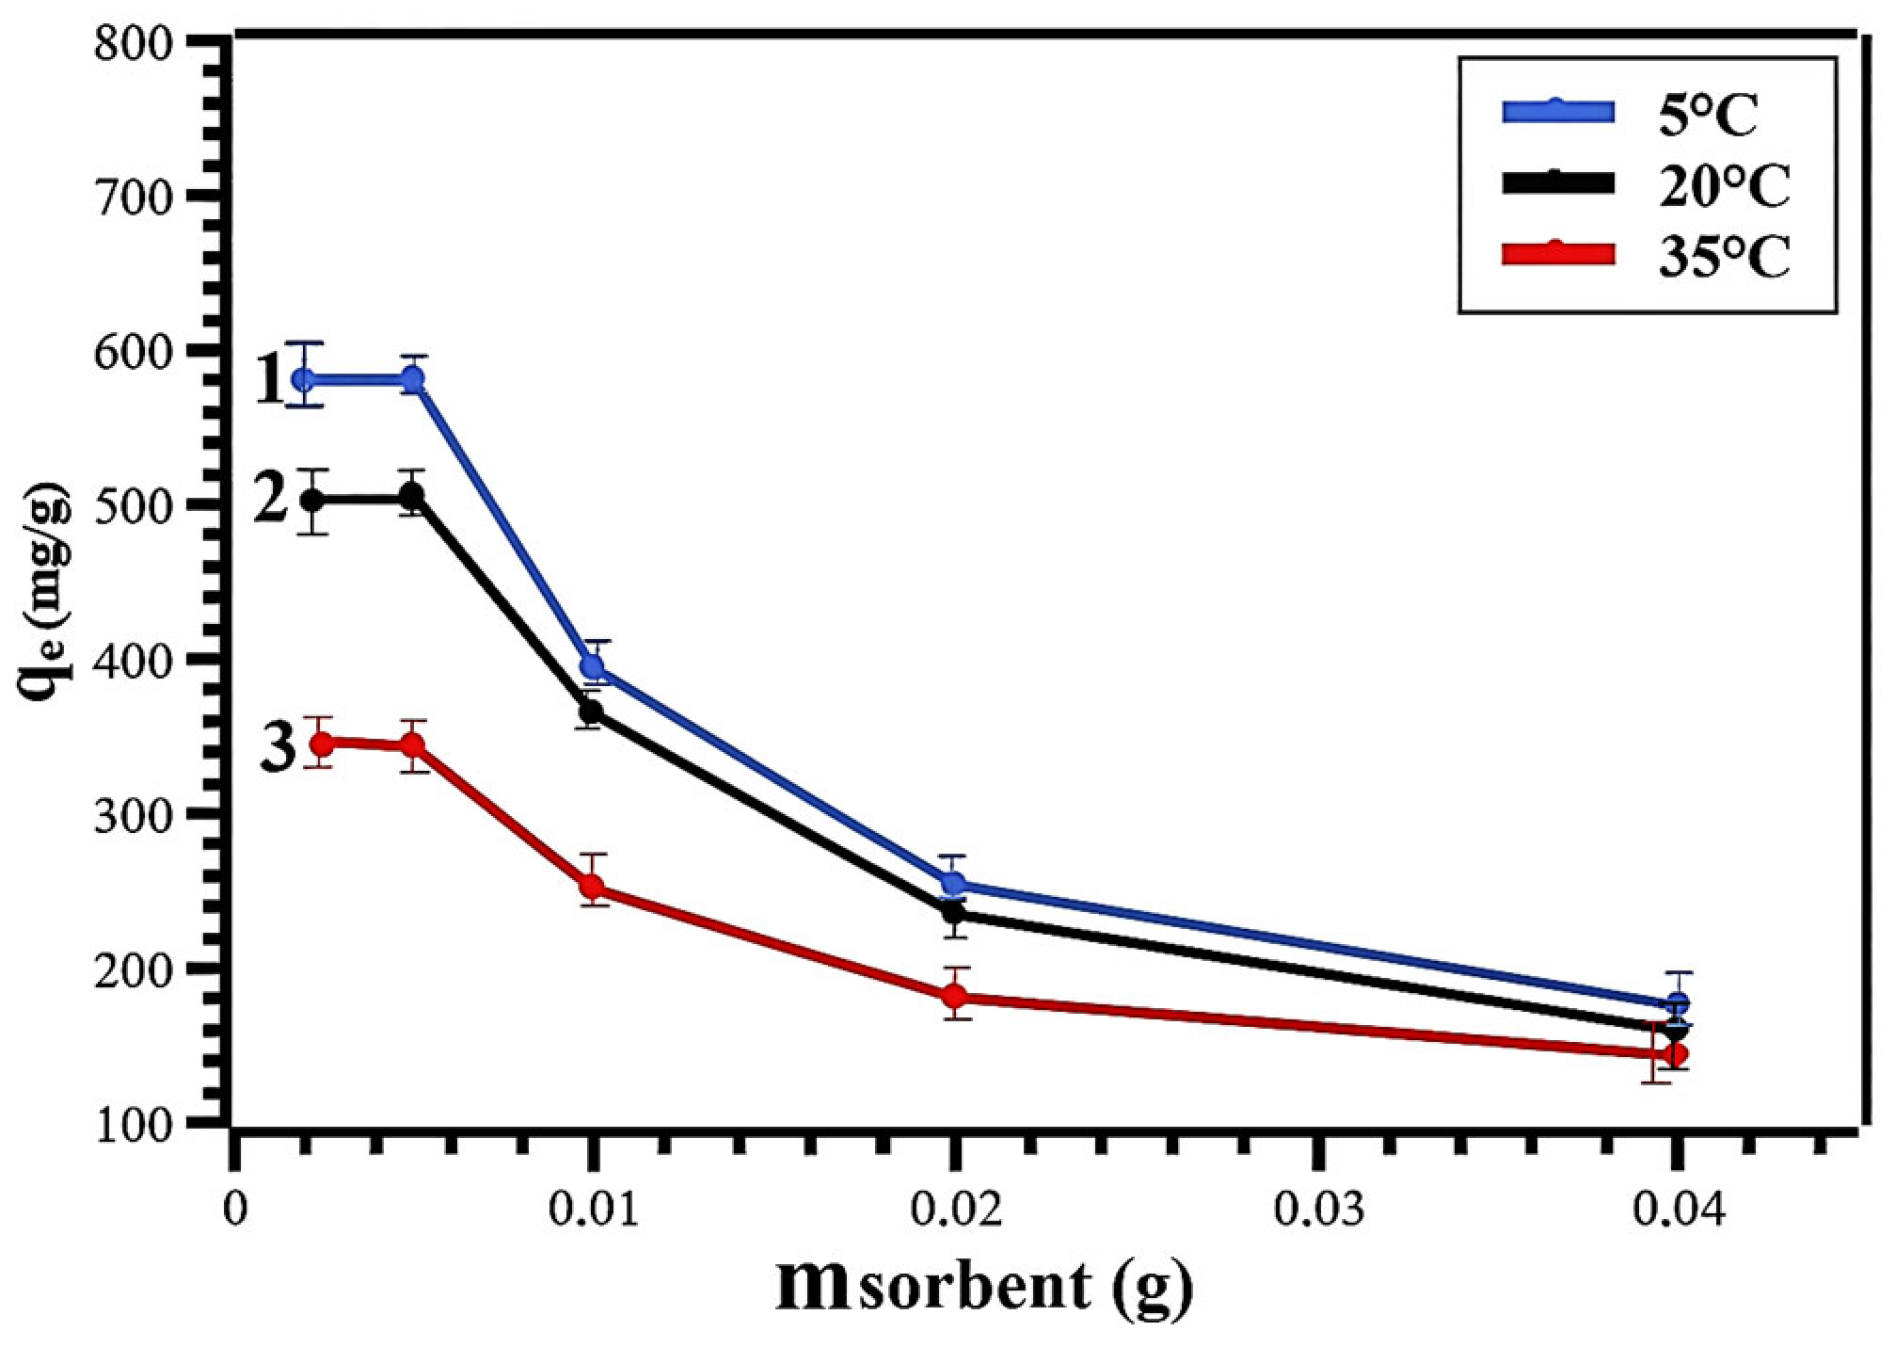
During the adsorption experiments, the effect of the sorbent mass on the efficiency of CTC sorption from an aqueous solution at a constant sorbate concentration was studied. At the same time, the maximum sorption capacity of the sorbent under these conditions was determined. The concentration of CTC in the solution was 100 mg/L, and the solution volume was 100 mL. The sorbent mass varied within 40, 20, 10, 5 and 2.5 mg. After 180 min of sorption, the solution sample was centrifuged for 5 min at 5000 rpm. The experimental results are shown in Figure 14.
The figure shows that the sorbent under study exhibits satisfactory sorption activity with respect to CTC even at low doses. It should be noted that at a sorbent dose of 2.5 mg, the curve reaches a plateau, which indicates that the maximum sorption capacity of the sorbent has been achieved. The values of the maximum sorption capacity of the sorbent at different temperatures are presented in Table 4.
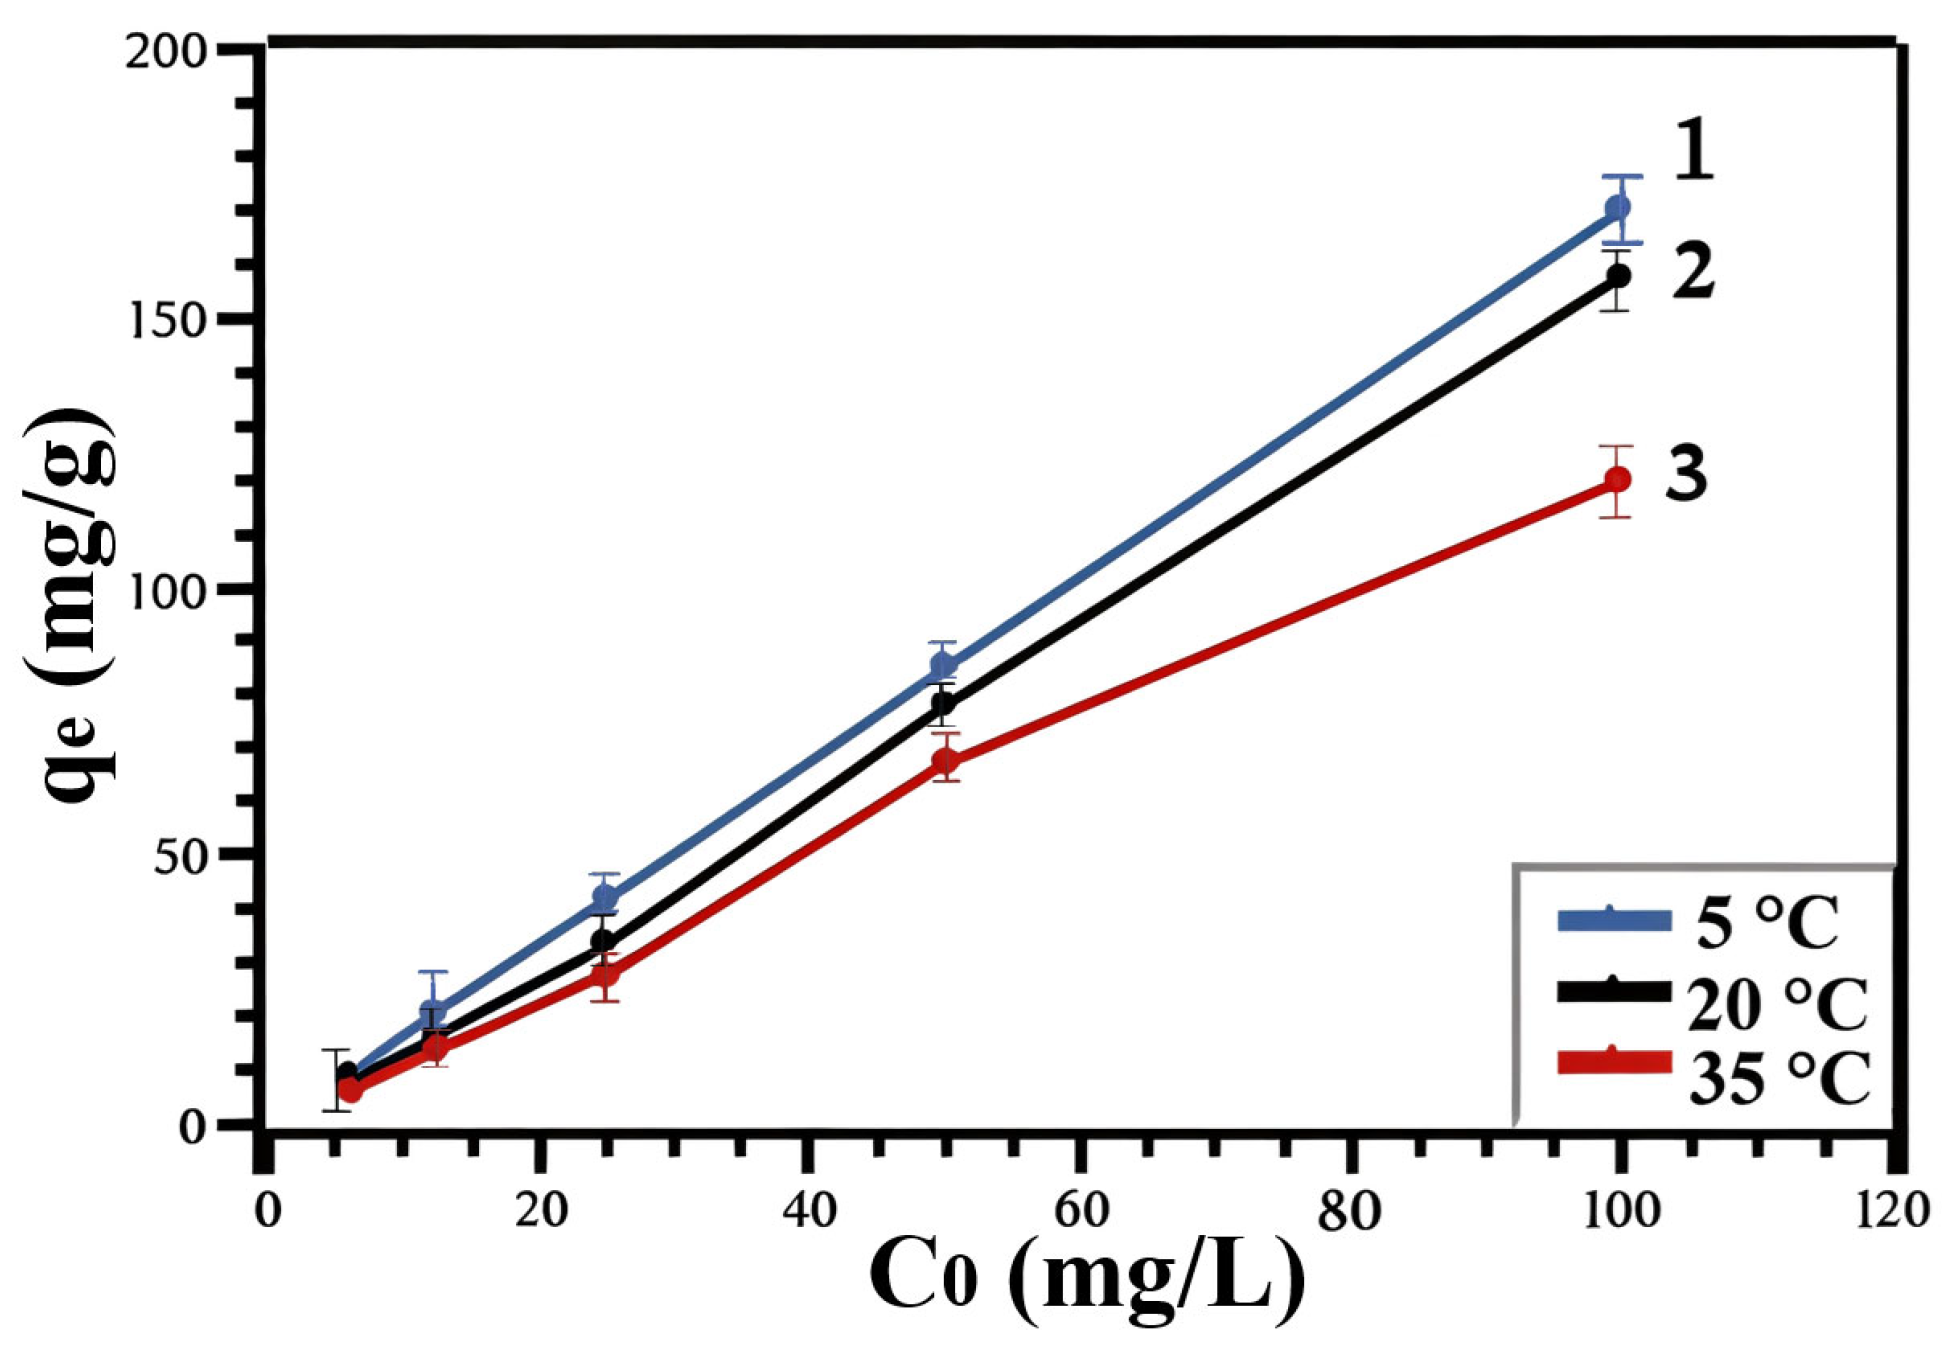
To study the dependence of CTC sorption on the initial pollutant concentration, 200 mL of CTC solutions with concentrations of 100, 50, 25, 12.5 and 6.25 mg/L were placed in a beaker thermostatted at a certain temperature. After the solutions reached the specified temperature, 80 mg of sorbent were added. After 180 min, 10 mL of the suspension were collected and centrifuged for 5 min at 5000 rpm. The experimental results are shown in Figure 15.
It is evident from the presented figure that the sorption capacity of the sorbent increases with the increase inthe initial concentration of the sorbate, and the sorbent also exhibits its activity in a wide range of CTC concentrations.
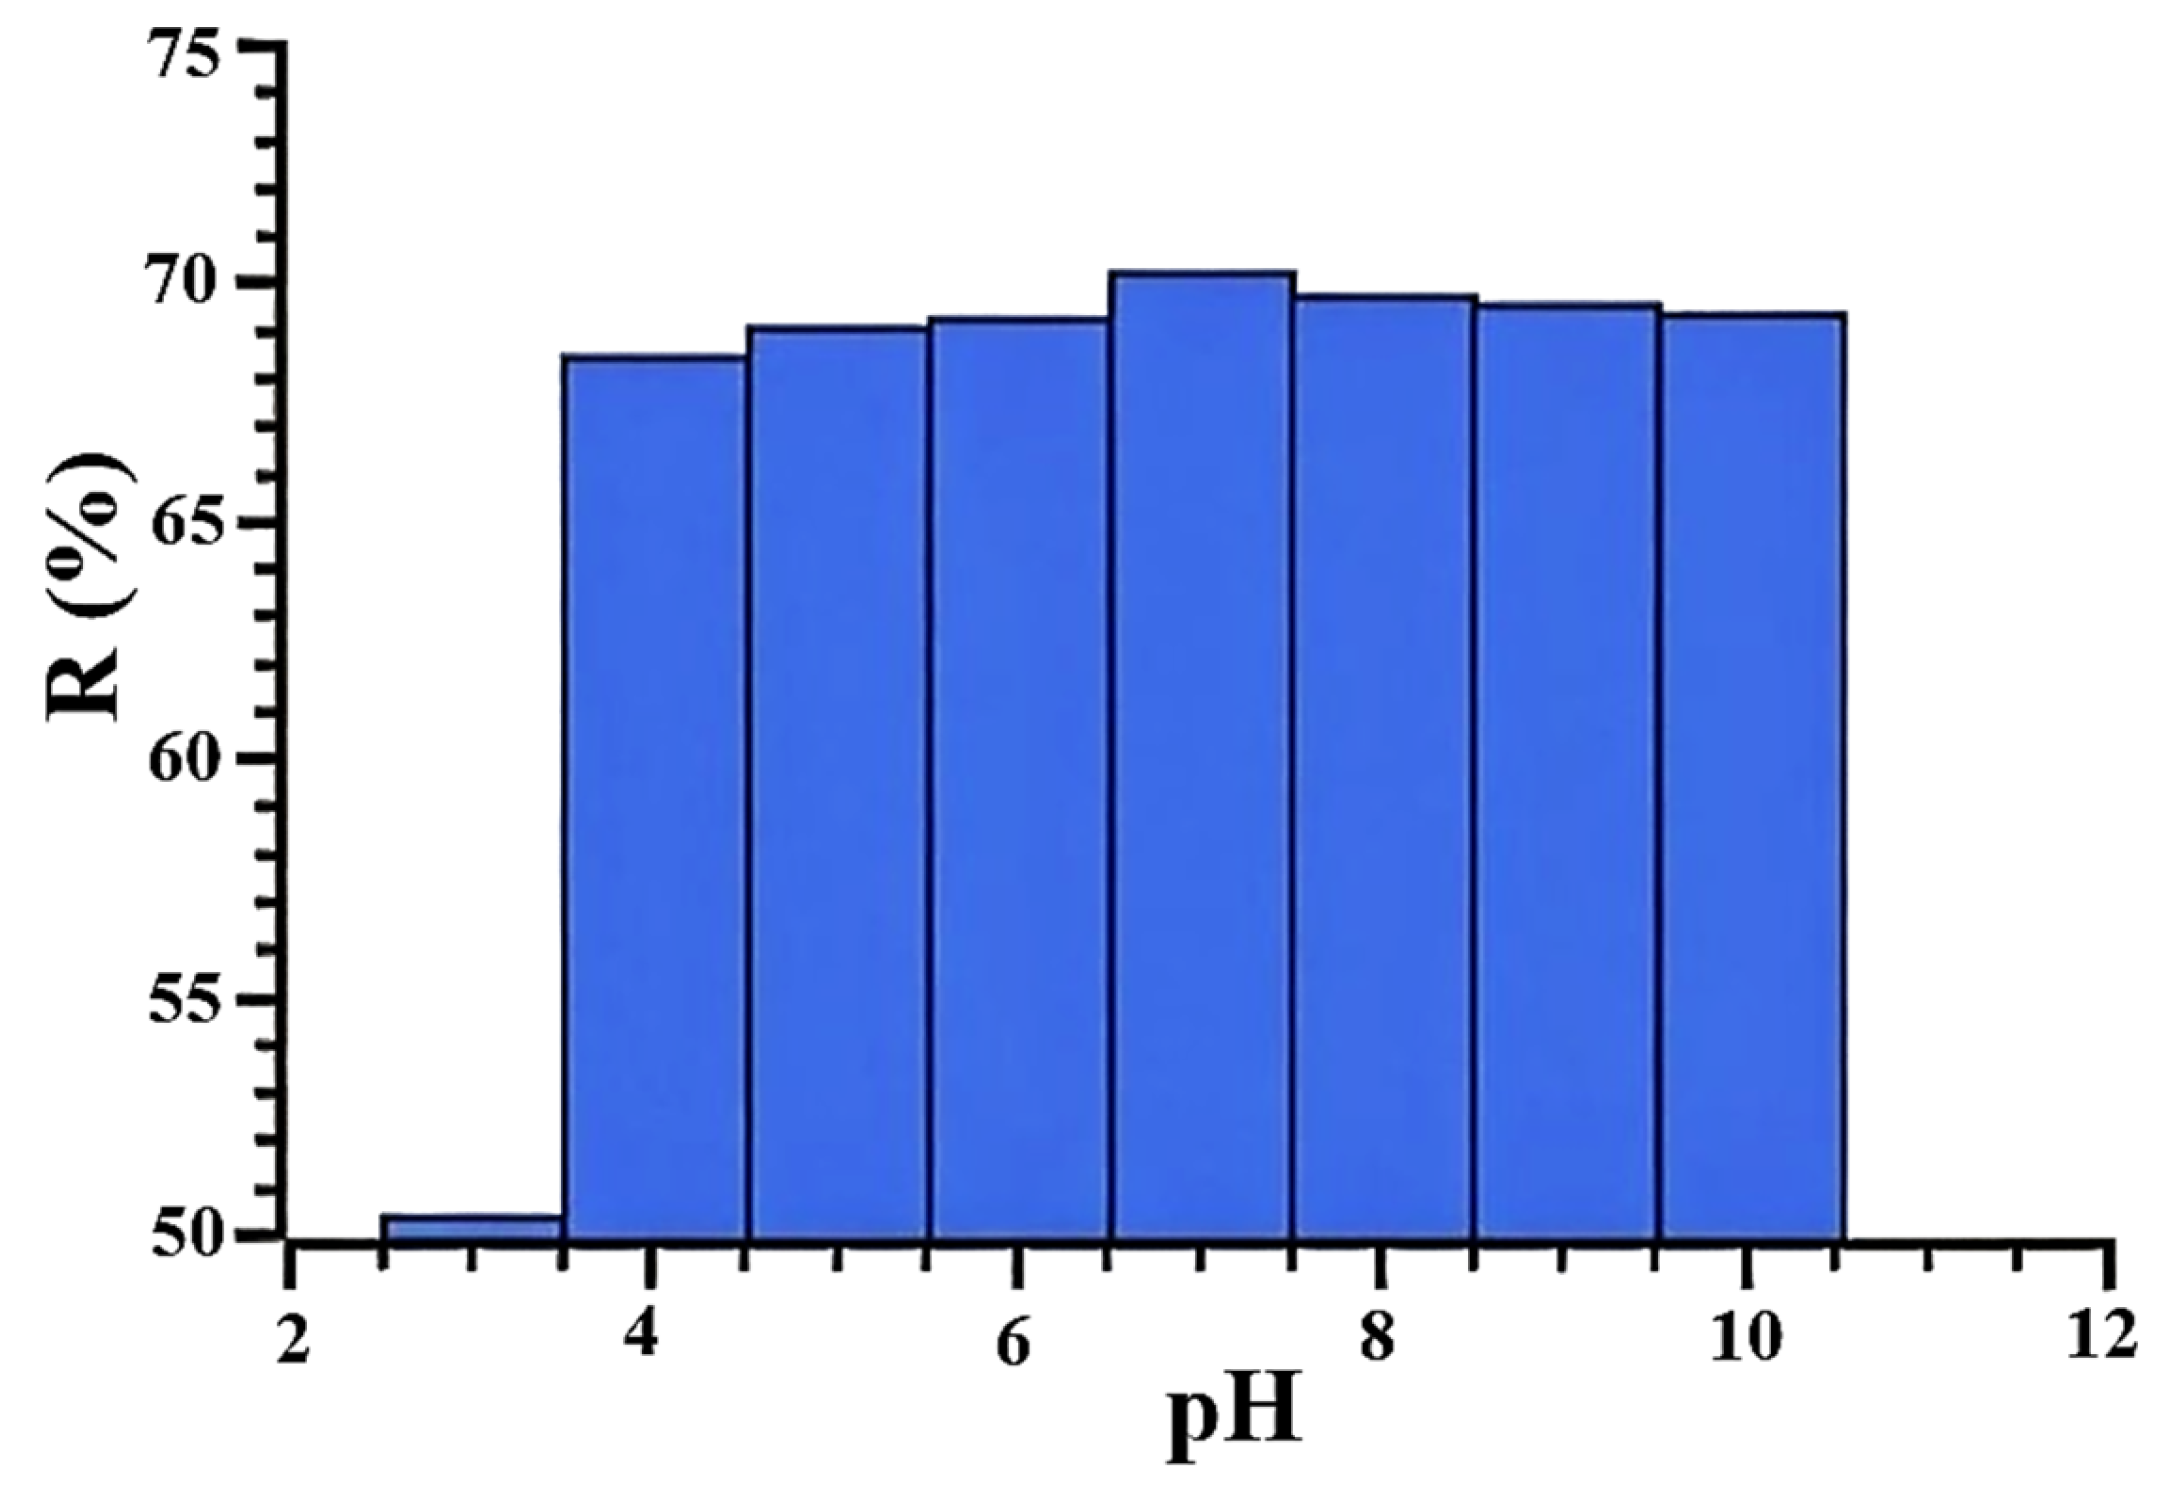
The dependence of sorption on the pH of the CTC solution was studied in a wide range from 3 to 10. It was noted that in the pH range from 3 to 7, the maximum CTC adsorption remains in the region of 356 nm, and above 8 it shifts somewhat to a longer-wave region of 368 nm, and the color of the solution deepens somewhat. This is obviously due to the fact that isomerization of CTC is possible in an alkaline medium (Figure 16) [31].
The sorption behavior as a function of pH is shown in Figure 17. The data show three distinct regimes: (1) Under strongly acidic conditions (pH ≤ 3), the sorption efficiency decreases sharply, which we attribute to competitive protonation of both the MOF active sites and the CTC functional groups, combined with electrostatic repulsion between positively charged species. (2) In the pH range of 4–10, optimal sorption occurs due to favorable electrostatic interactions. (3) At pH > 10, the experiment was not performed, since under these conditions the chlortetracycline base is formed, which is characterized by very low solubility.
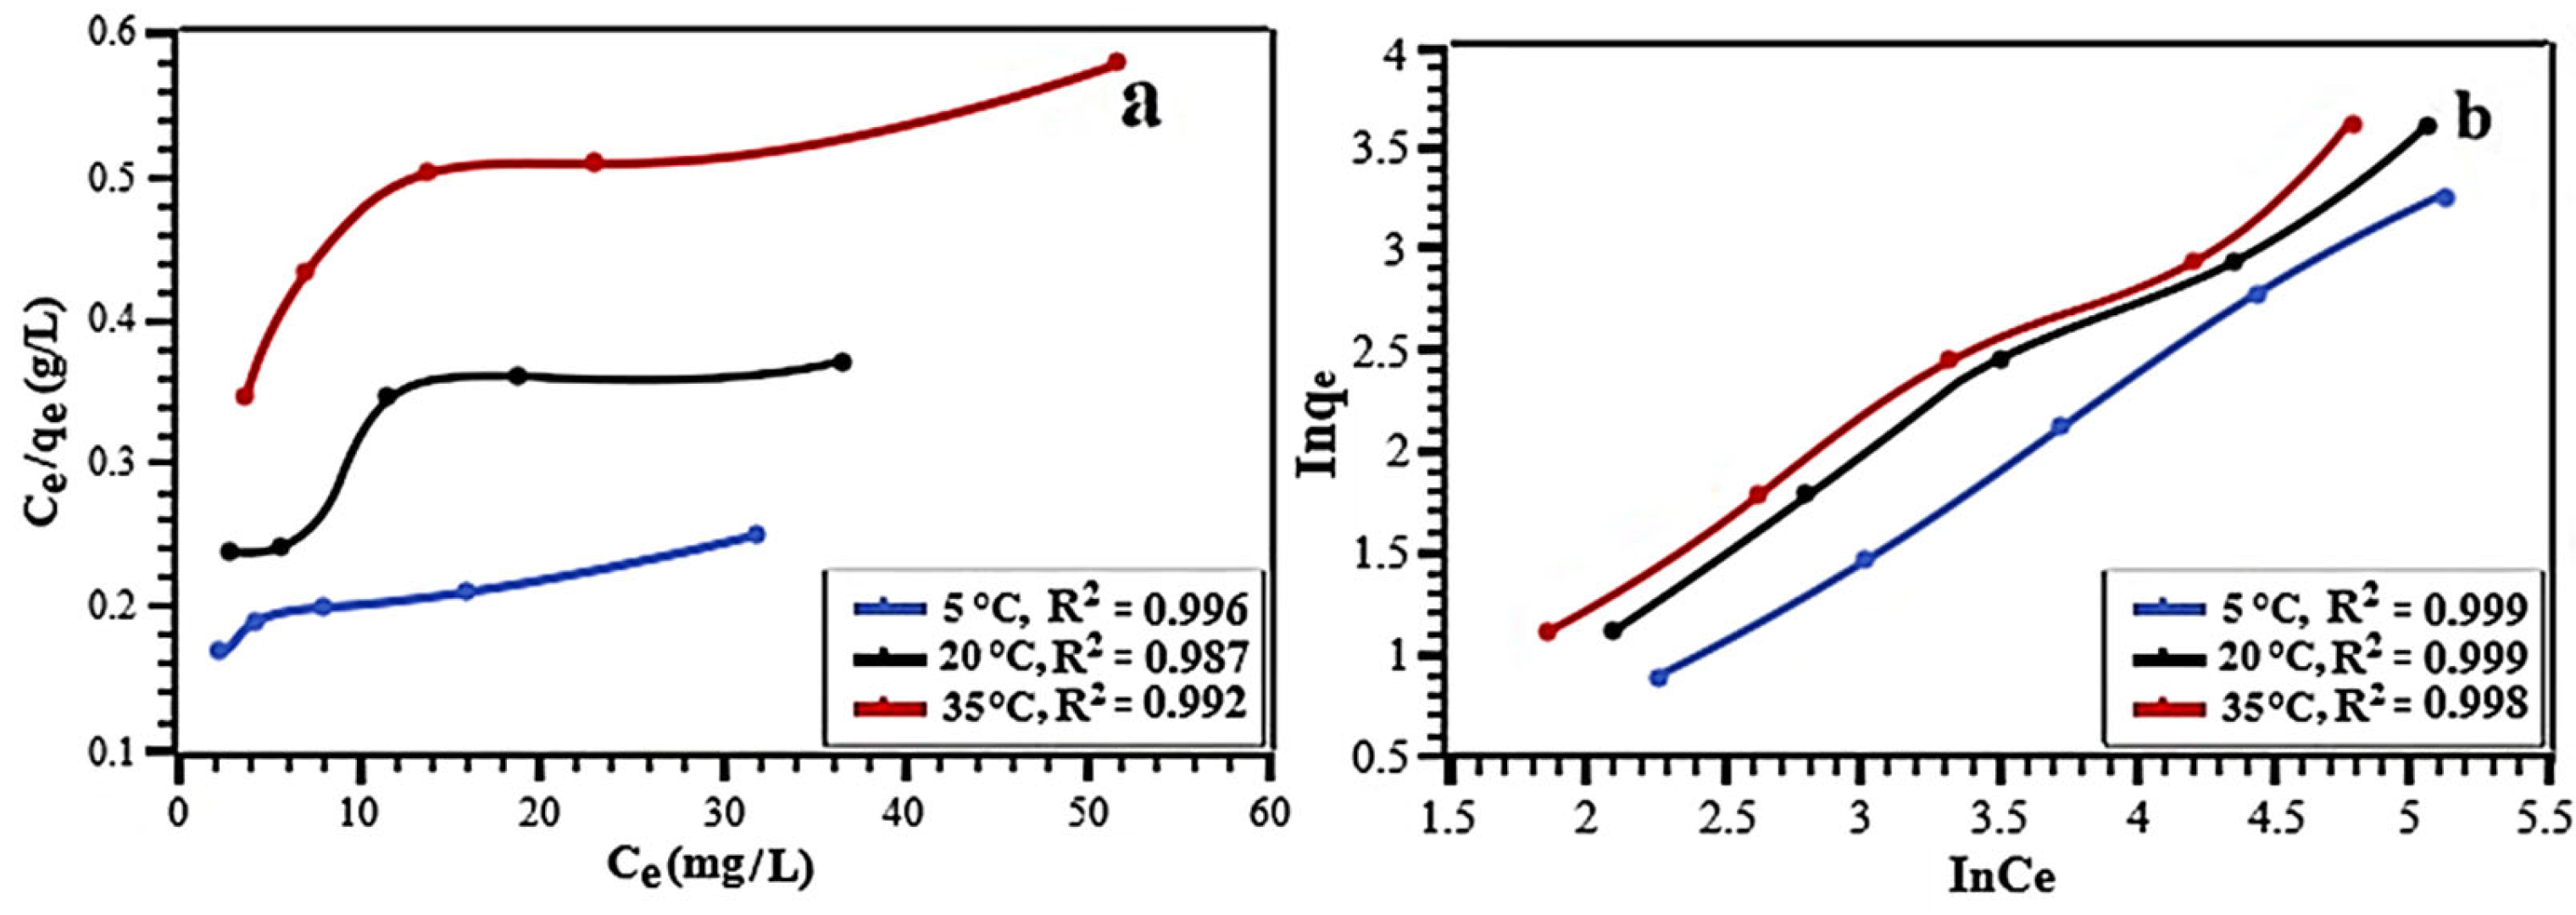
To understand the mechanism of CTC sorption, the experimental data were analyzed using the Langmuir and Freundlich sorption models.
The Langmuir model assumes that sorption occurs on a homogeneous surface with active centers capable of sorbing only one molecule. However, this model does not take into account the filling of pores and the formation of multilayers, which makes it suitable only for homogeneous surfaces. On the other hand, the Freundlich model more accurately describes real surfaces with sorption centers of different energies. This model allows one to estimate the nonlinearity of the dependence of adsorption on concentration by the value of the coefficient 1/n.
The results of the analysis show that the adsorption process of the CTC cycle is best described by the Freundlich model. The adsorption isotherms are of type I according to the IUPAC classification, which characterizes the sorbent as a macroporous material. The sorption process of the CTC cycle is most intense at the initial stages and is characterized by favorable conditions for sorption, which is confirmed by high values of the 1/n coefficient. The results are presented in Figure 18 and Table 5.
Table 6 shows the comparison of the efficiency of MOF-based sorbents for the removal of tetracycline antibiotics, including CTC. Despite the structural similarity of these compounds, the synthesized Zr-NH2-BDC demonstrates excellent adsorption properties and practical applicability.
The Gibbs free energy was calculated analytically using the following equation:
G 0 = R T l n K d
and the enthalpy of the processes was determined graphically using the Van’t Hoff equation:
l n K d =   Δ S R Δ H R T
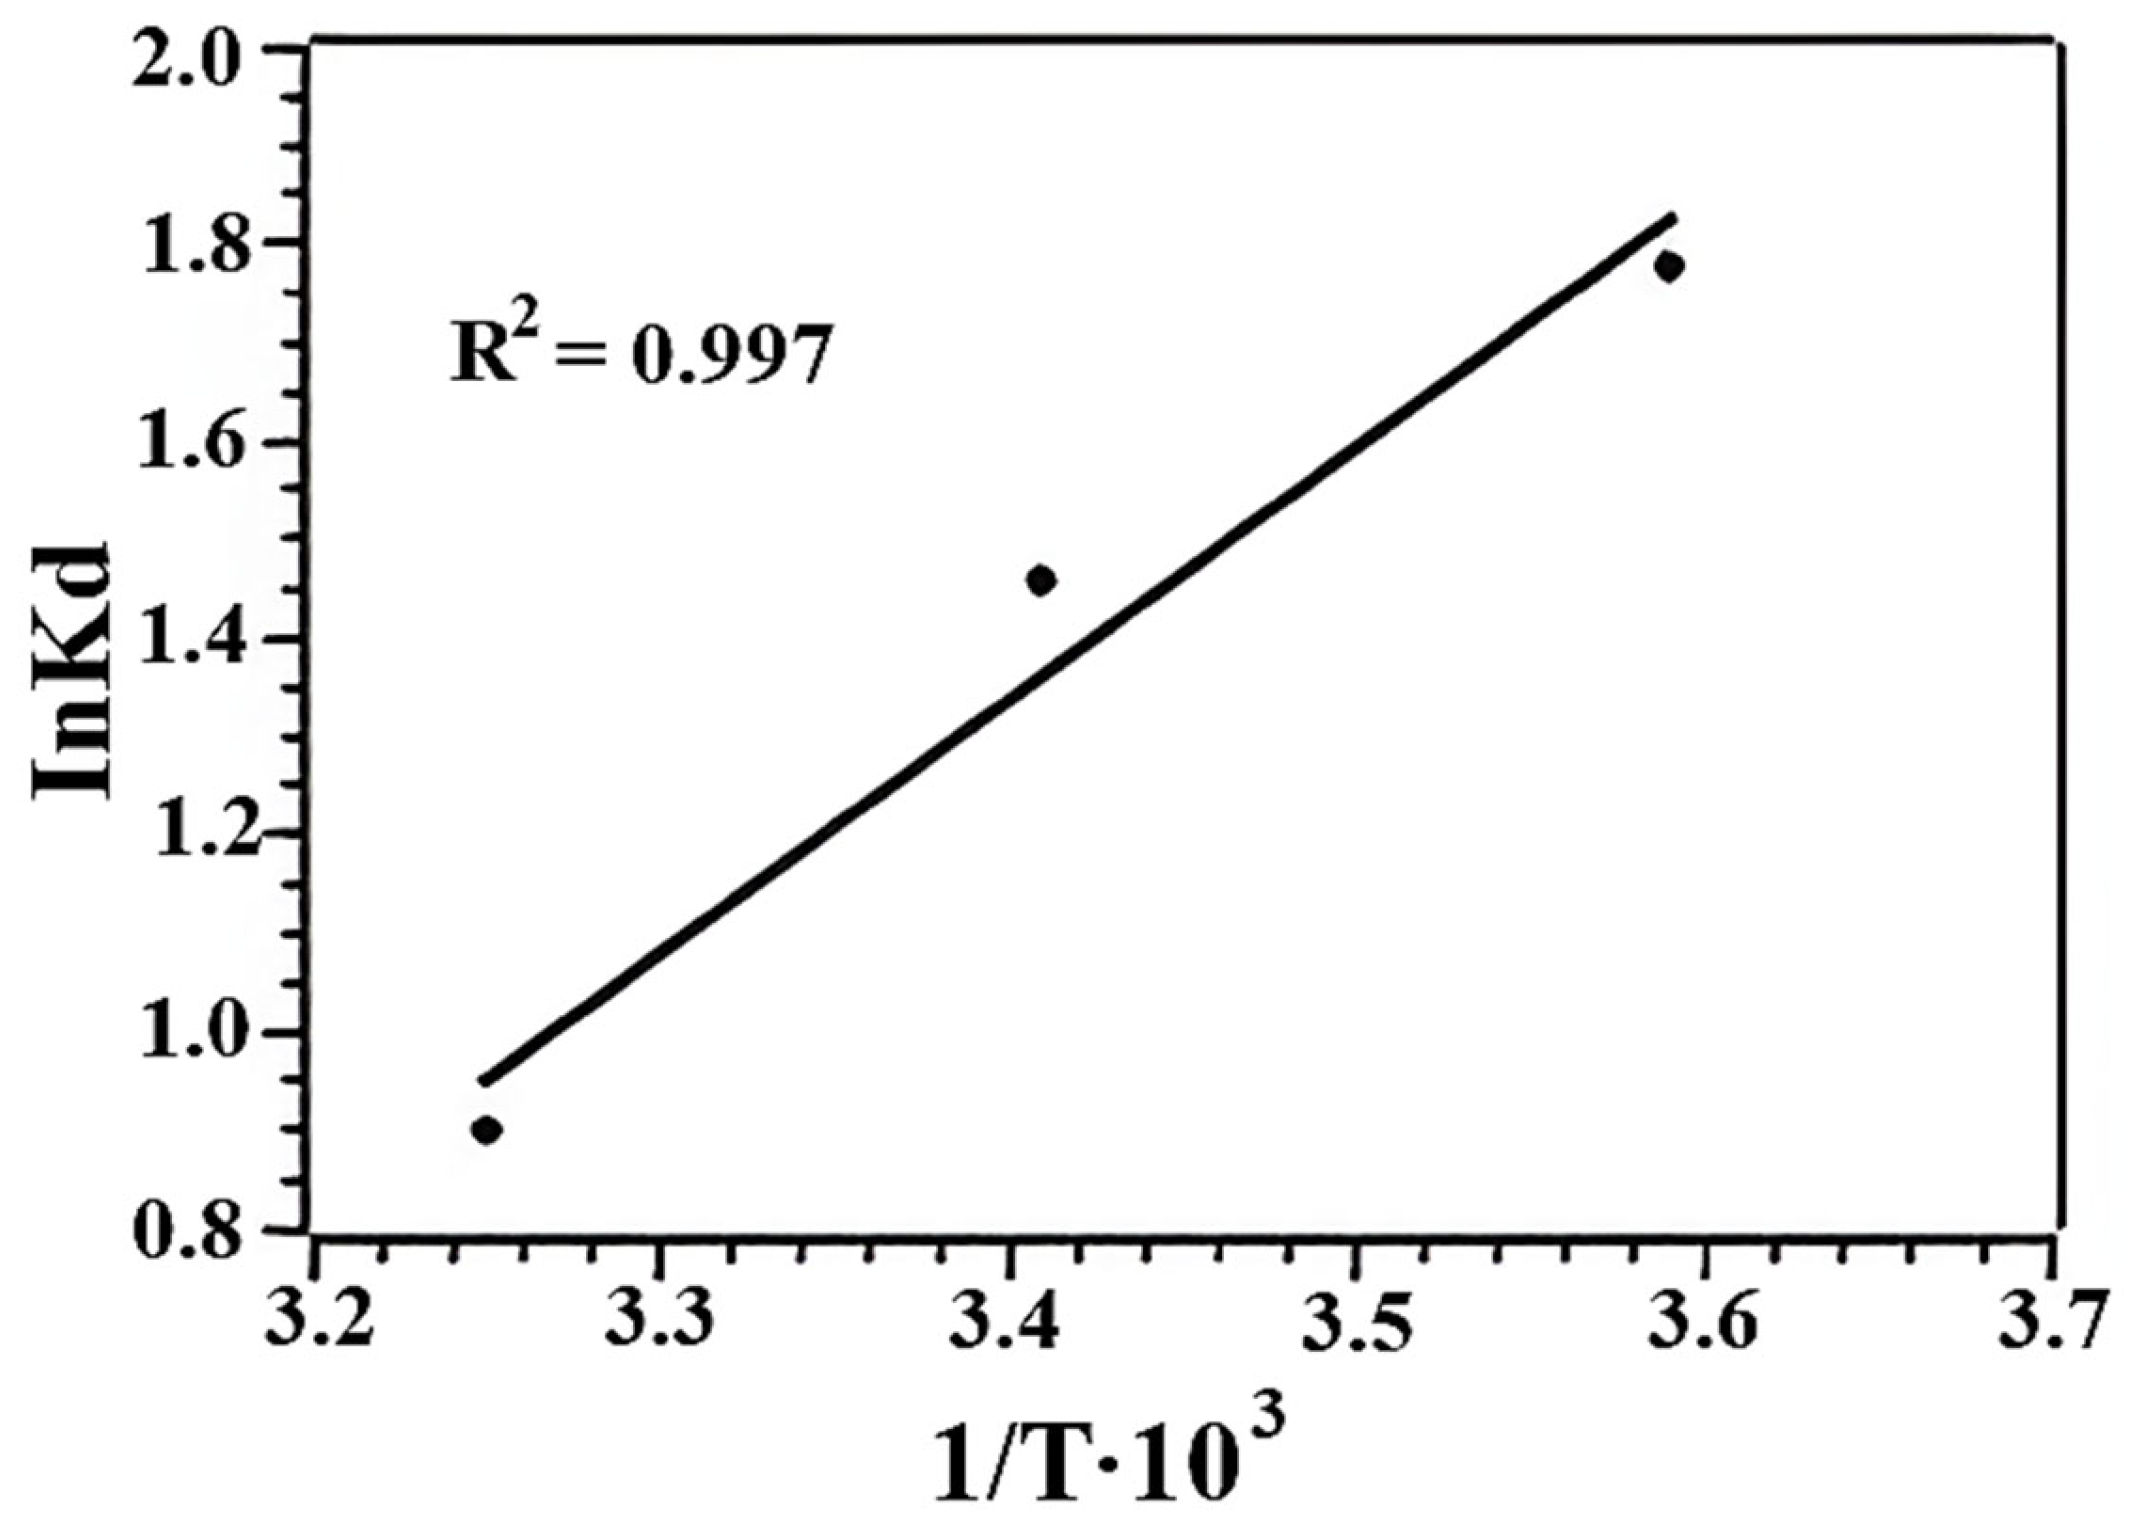
The values of ΔH° and ΔS° were determined graphically from the dependence of the thermodynamic constant Kd on the reciprocal temperature (Figure 19) using the slope tangent and the intersection with the OY axis.
Data analysis shows that the process of sorption of CTC is characterized by relatively small negative values of the Gibbs free energy (less than 40 kJ/mol). This means that the activation energy of the sorption process will be small.
Based on these data, it can be concluded that the most probable physical mechanism of sorption is the mechanism in which the sorbate molecules are held by Van der Waals forces and form numerous hydrogen bonds in the cavities of the sorbent.
Negative values of the sorption enthalpy indicate the exothermicity of the sorption process. In addition, an increase in the Gibbs free energy with increasing temperature indicates greater sorption efficiency at moderately low temperatures.
Positive entropy values indicate an increase in the number of degrees of freedom at the solid–liquid interface during the sorption of CTC. The thermodynamic indicators of the process (Table 7) reflect the affinity of the sorbent to the sorbate molecules.
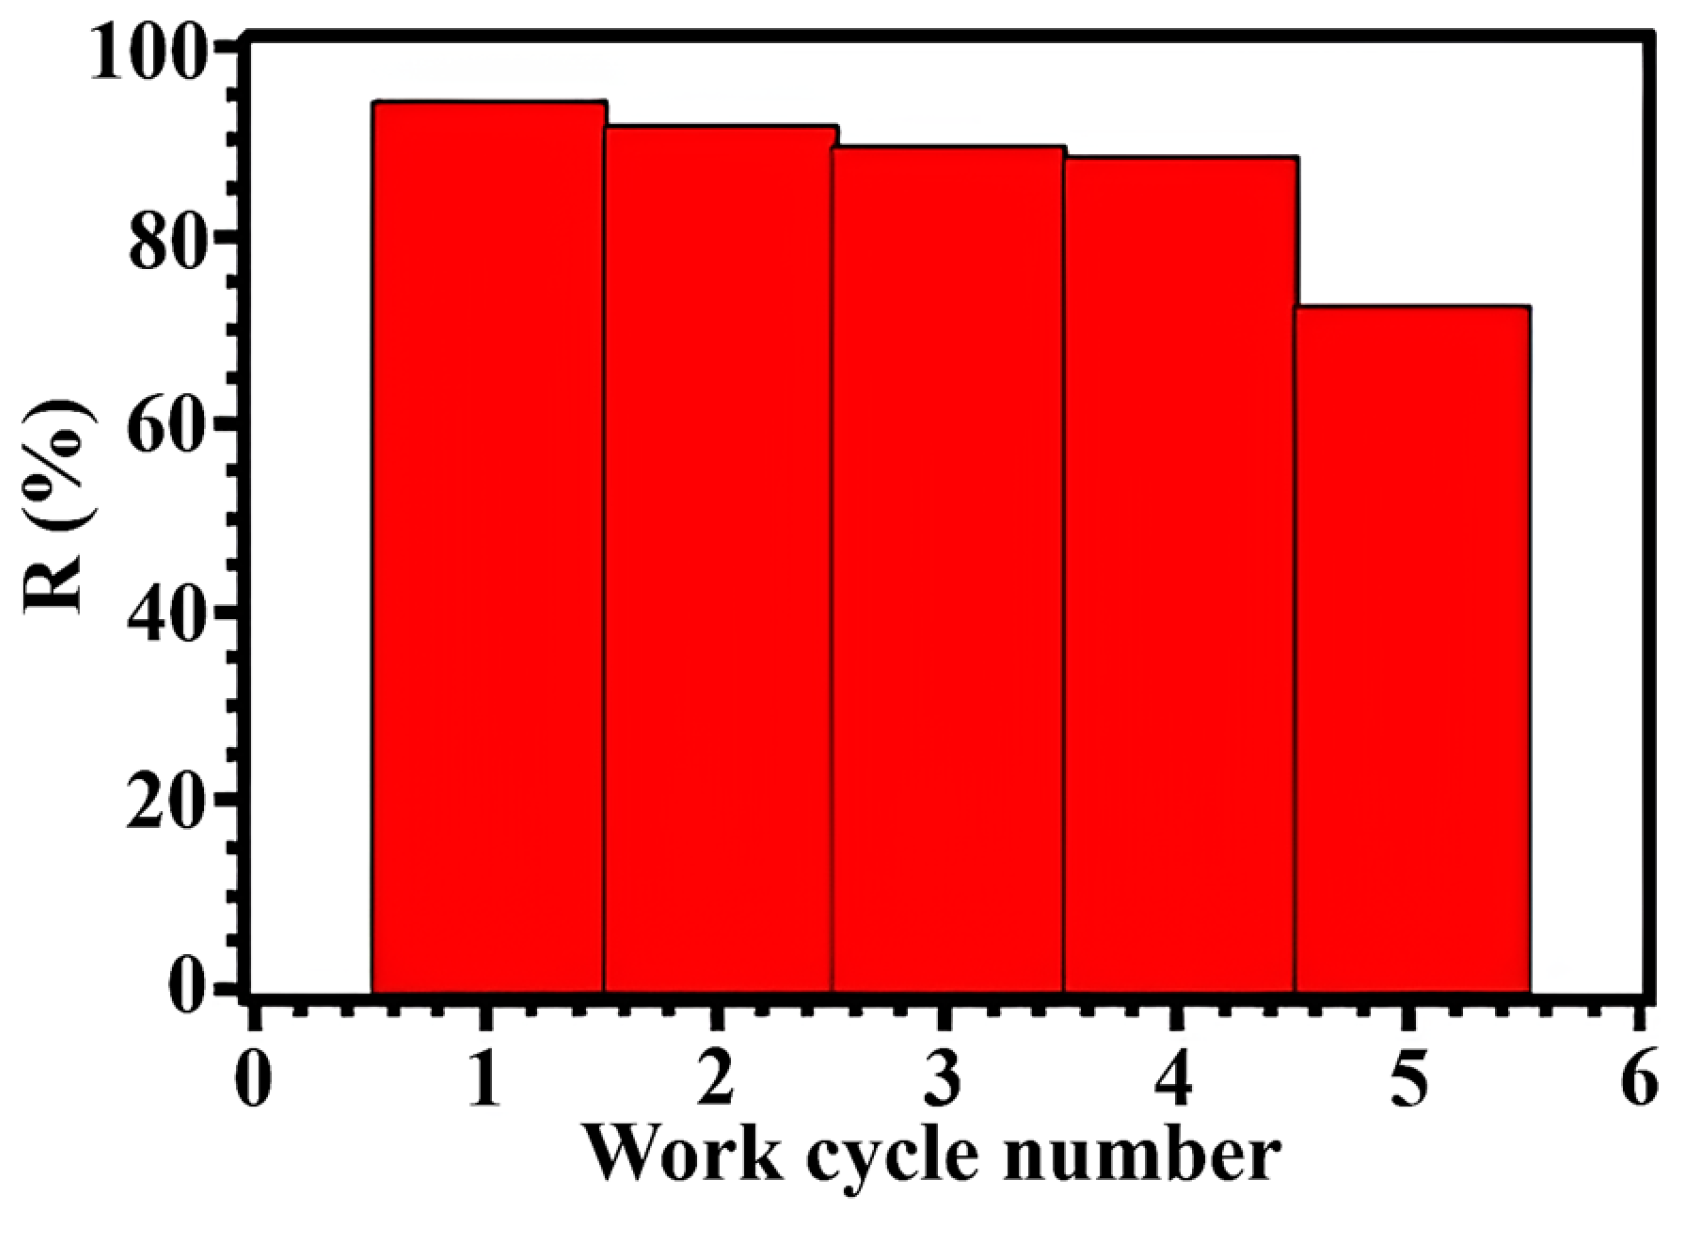
Regeneration of the sorbent is the most important economic and technological factor. For this purpose, the dependence of the degree of sorption of CTC on the number of working cycles was experimentally studied. It was found that the sorption capacity of the sorbent gradually decreases after each working cycle but remains quite high. This means that this material can be effectively used as a sorbent with the possibility of its reuse up to fivetimes (Figure 20) [37].
The obtained results allow us to assume that this sorbent may be a promising material both from the technological and economic points of view.

3.3. Study of Solid-Phase Extraction of CTC by Dynamic Method

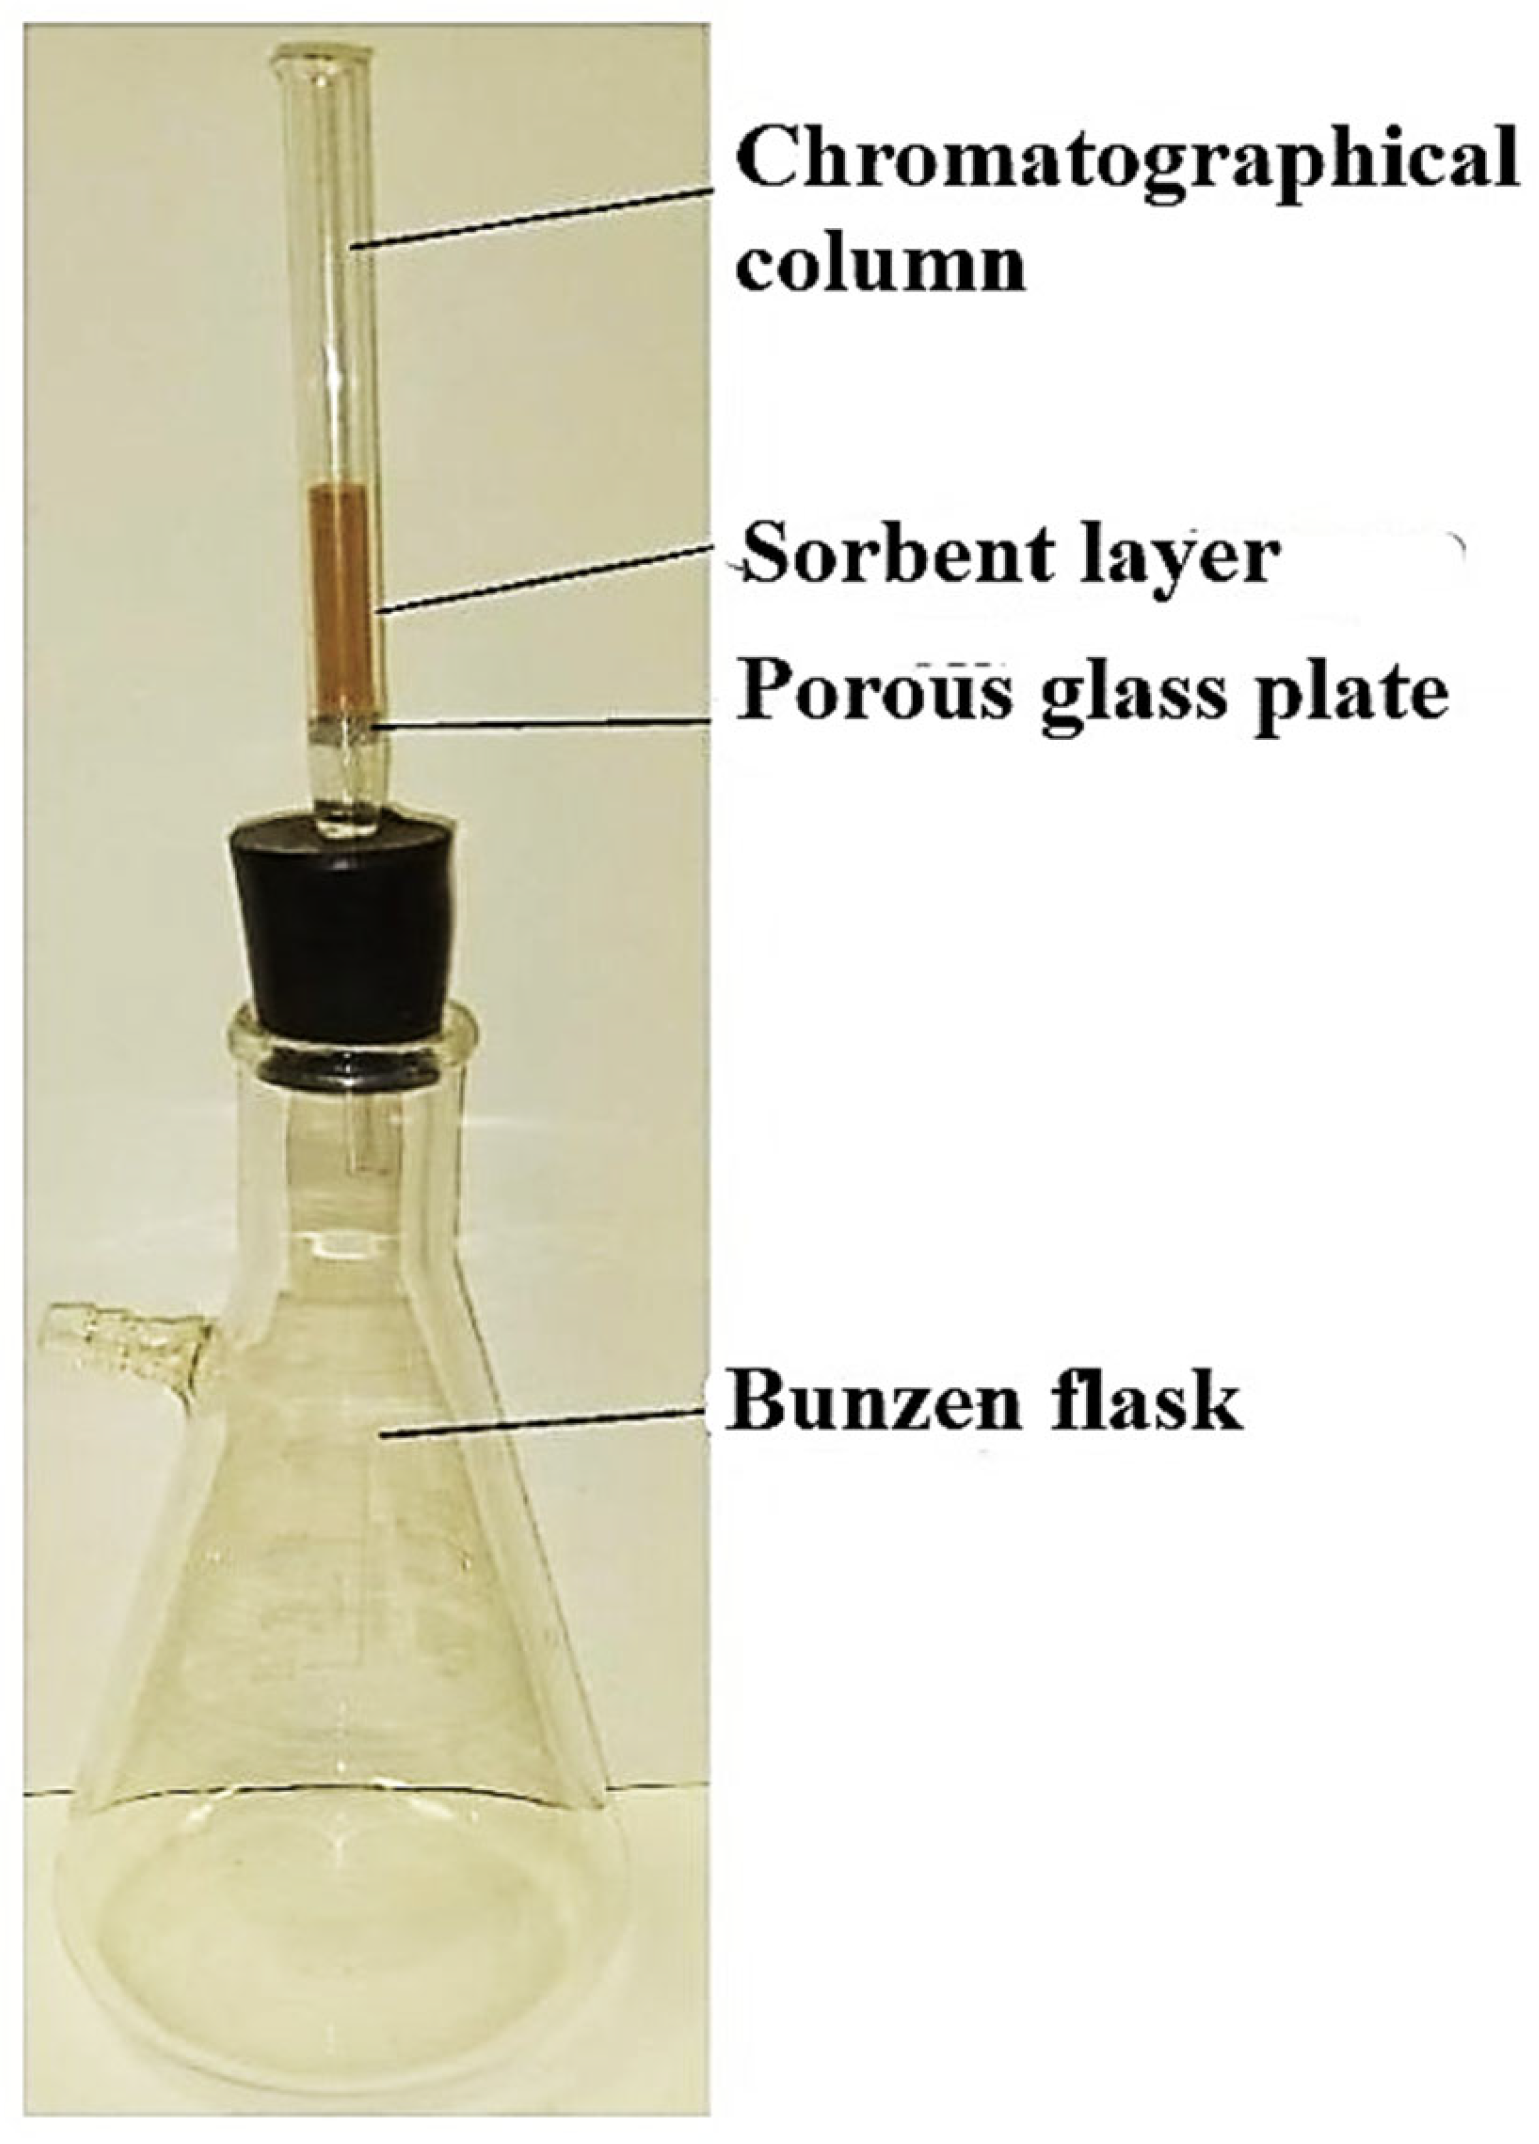
Solid-phase extraction of CTC by the dynamic method was studied on an adsorption column using the device shown in Figure 21.
The method for determining CTC in aqueous solutions with preliminary concentration at the sample preparation stage was as follows: 100.00 mL of CTC solution was introduced into a column with the sorbent, leaving a 1 cm thick liquid layer above the sorbent layer. The flow rate of the solution was regulated in the range of 1.5 ± 0.5 mL/min until the end of the entire sample [38].
The concentration of CTC in the analyzed solution was 1.5 mg/L, which corresponded to a CTC mass of 0.15 mg when passing through the entire sample. After passing the entire aliquot, the sorbent layer was washed with distilled water twice in 5 mL portions. Then, the vessel was connected to a vacuum, the solvent was removed as much as possible, and the sorbent layer was dried with an air flow. A mixture of acetonitrile, acetic acid and water in a ratio of 7:35:65 was used to elute CTC [21]. The total time of passage through the column was 142 min with spontaneous flow.
The completeness of CTC extraction was determined by the CTC content in the liquid that passed through the sorbent layer, in which CTC was not detected. At the next stage of the experiment, the isolated CTC was eluted from the solid phase of the sorbent with an eluate volume of 25 mL at a rate of 1.0 ± 0.2 mL/min. After each mL of eluate was isolated, it was analyzed spectrophotometrically and the concentration of CTC was determined (λ = 356 nm). The dynamics of elution are shown in Figure 22.
After sampling 15 mL of the eluate, the optical density of the resulting solution was determined relative to the pure eluent. In accordance with the calibration graphs, the concentration of CTC in the eluate was calculated, which, in this case, was 10.434 ± 0.0182 (±0.17%) mg/L. Thus, the enrichment factor (concentration factor) of CTC at the sample preparation stage was 6.95, and the concentration factor was 6.6.
The accuracy and precision of the method for determining CTC in aqueous solutions by the spectrophotometric method with preliminary concentration at the sample preparation stage were determined by comparing the standard deviation when performed in laboratory conditions by different researchers. The metrological characteristics of the spectrophotometric determination of CTC with preliminary concentration are presented in Table 8.
Thus, based on the obtained experimental results, the following advantages of the SPE method can be noted:
1.
The use of SPE to concentrate the analyte increases its concentration by 6.95 times, which allows its spectrophotometric determination with acceptable reliability, since the determined values are in the zone of optimal concentrations on the calibration graph.
2.
SPE of the analyte allows one to avoid a long and labor-intensive evaporation procedure to increase the concentration of the analyte, including for GLC and HPLC.
3.
Spectrophotometric analysis does not require expensive equipment, scarce standard samples, and highly qualified personnel.
4.
Studies of the dependence of the degree of extraction of CTC from aqueous solutions allow it to be extracted at an initial concentration of 0.06 mg/L, which is quite sufficient to control the content of the analyte in natural waters and food products, since the standards of the European Union allow the content of CTC from 0.1 to 0.6 mg/kg of the product, depending on its type [39].
5.
Dynamic SPE demonstrates more acceptable results compared to other methods [40].

3.4. Method for Determination of CTC in Real Objects Using Solid-Phase Extraction

The proposed method was developed based on model experiments with preliminary concentration on a cartridge and experiments with objects using the “introduced–found” method. The method includes several stages: 1—preliminary concentration on a column with a synthesized solid-phase sorbent; 2—elution of the CTC extracted into the solid phase; 3—spectrophotometric determination of CTC at a wavelength of 280 nm or 360 nm; and 4—statistical processing of the obtained results.
Stage 1. A chromatographic column (cartridge) 13 cm long and 1.5 cm in internal diameter is filled with the prepared sorbent and kept in a drying cabinet at 120 °C for 30 min. After the specified time, the column is placed in a vacuum desiccator over anhydrous calcium chloride, evacuated and left to cool to room temperature. After reaching room temperature, the column is fixed with a stopper in a Bunsen flask, which is connected to the vacuum system. The object under study should not contain a large number of mechanical impurities orexcessive amounts of proteins and lipids. For this purpose, natural or waste water is pre-filtered, for example, through nylon filters. Milk, biological fluids and meat extracts are processed in such a way as to remove as many proteins and lipids as possible, using a calcium chloride solution in the presence of EDTA (for the purpose of possible chelation of calcium with CTC). The milk is treated with trichloroacetic acid until interfering compounds are completely precipitated and centrifuged. The volume of the aliquot is 100 mL. The resulting aliquot is passed through a chromatographic column, regulating the flow rate of 1±0.5 mL/min using a tap in front of the vacuum device.
Stage 2. The column with the sorbent and extract is dried by passing air through it using a vacuum device. A total of 10 mL of an eluent of the composition acetonitrile: acetic acid: water in a ratio of 7:35:65 is passed through the dried column, maintaining a flow rate of 0.5±0.2 mL/min. The eluate is collected and its volume is brought up to 10.0 mL with the eluent. Thus, the concentration corresponds to a 10-fold increase.
Stage 3. The concentration of CTC is determined spectrophotometrically in the collected eluate using a calibration graph relative to the pure eluent. The experiment is repeated at least three times, and the average value is taken as the result. The discrepancy between parallel results should not exceed 3%, otherwise all measurements are repeated again.
Stage 4. The concentration of CTC is calculated using the following formula:
C C T C = C x K F
where CCTC is the concentration of CTC in the aliquot, mg/L; Cx is the concentration of CTC in the eluate, found from the calibration graph; and KF is the concentration factor calculated using the following formula:
K F = V e V a
where Ve is the volume of eluate; Va is the volume of the aliquot.

4. Conclusions

Zirconium 2-amino-1,4-benzenedicarboxylate was synthesized by the reaction of zirconium tetrachloride with 2-amino-1,4-benzenedicarboxylic acid in N,N-dimethylformamide with the addition of HCl. The metal–organic framework is an effective sorbent for the extraction of chlortetracycline hydrochloride from an aqueous solution. The structure of the obtained framework was studied using elemental analysis, SEM, IR spectroscopy and X-ray diffraction. Model experiments were carried out to determine the dependence of solid-phase extraction of chlortetracycline hydrochloride on the sorbent mass, initial sorbate concentration, temperature, contact time of the pollutant solution with the sorbent and pH. The regularities of solid-phase extraction of chlortetracycline hydrochloride with the metal–organic framework under isothermal conditions were also studied. Zirconium 2-amino-1,4-benzenedicarboxylate is effective in a fairly wide range of pH values. A study of solid-phase extraction of chlortetracycline hydrochloride when passing through a cartridge showed that the desorption coefficient reaches 97.3±0.2%.

Author Contributions

Conceptualization: I.E.U.; methodology: M.O.G. and I.E.U.; validation: V.A.Z.; investigation: J.D.B. and V.A.Z.; resources: writing—original draft preparation: M.O.G. and I.E.U.; writing—review and editing: I.E.U. All authors have read and agreed to the published version of the manuscript.

Funding

This research received no external funding.

Data Availability Statement

The data presented in this study are available on request from the corresponding author.

Conflicts of Interest

The authors declare no conflicts of interest.

References

  1. Lu, J.; Kong, D.; Zhang, Y.; Xie, Y.; Gu, X.; Gulakhmadov, A. Hotspots of Global Water Resource Changes and Their Causes. Earths Future 2025, 13, e2024EF005461. [Google Scholar] [CrossRef]
  2. Husein, D.Z.; Hassanien, R.; Al-Hakkani, M.F. Green-synthesized copper nano-adsorbent for the removal of pharmaceutical pollutants from real wastewater samples. Heliyon 2019, 5, e02339. [Google Scholar] [CrossRef]
  3. Rivera-Utrilla, J.; Sánchez-Polo, M.; Ferro-García, M.A.; Prados-Joya, G.; Ocampo-Pérez, R. Pharmaceuticals as emerging contaminants and their removal from water. A review. Chemosphere 2013, 93, 1268–1287. [Google Scholar] [CrossRef]
  4. Guedidi, H.; Reinert, L.; Leveque, J.-M.; Soneda, Y.; Bellakhal, N.; Duclaux, L. The effects of the surface oxidation of activated carbon, the solution pH and the temperature on adsorption of ibuprofen. Carbon 2013, 54, 432–443. [Google Scholar] [CrossRef]
  5. Liang, C.; de Jonge, N.; Carvalho, P.N.; Nielsen, J.L.; Bester, K. Biodegradation kinetics of organic micropollutants and microbial community dynamics in a moving bed biofilm reactor. Chem. Eng. J. 2021, 415, 128963. [Google Scholar] [CrossRef]
  6. Garcia-Becerra, F.Y.; Ortiz, I. Biodegradation of Emerging Organic Micropollutants in Nonconventional Biological Wastewater Treatment: A Critical Review. Environ. Eng. Sci. 2018, 35, 10. [Google Scholar] [CrossRef]
  7. Chopra, I.; Roberts, M. Tetracycline Antibiotics: Mode of Action, Applications, Molecular Biology, and Epidemiology of Bacterial Resistance. Microbiol. Mol. Biol. Rev. 2001, 65, 232–260. [Google Scholar] [CrossRef] [PubMed]
  8. Di Cerbo, A.; Pezzuto, F.; Guidetti, G.; Canello, S.; Corsi, L. Tetracyclines: Insights and Updates of their Use in Human and Animal Pathology and their Potential Toxicity. Open Biochem. J. 2019, 13, 1–12. [Google Scholar] [CrossRef]
  9. Liu, M.K.; Liu, Y.Y.; Bao, D.; Zhu, G. Effective Removal of Tetracycline Antibiotics from Water using Hybrid Carbon Membranes. Sci. Rep. 2017, 7, 43717. [Google Scholar] [CrossRef]
  10. Liu, Q.; Ning, D.; Li, W.-J.; Du, X.-M.; Wang, Q.; Li, Y.; Ruan, W.-J. Metal-organic framework based fluorescent sensing of tetracycline type antibiotics applicable to environmental and food analysis. Analyst 2019, 144, 1916–1922. [Google Scholar] [CrossRef]
  11. Lupeiko, T.G.; Gorbunova, M.O.; Bayan, E.M. Deep purification of aqueous solutions to remove iron(III) with carbonate-containing industrial waste. Russ. J. Appl. Chem. 2004, 77, 79–82. [Google Scholar] [CrossRef]
  12. Lupeiko, T.G.; Bayan, E.M.; Gorbunova, M.O. Use of carbonate-containing industrial waste for treatment of aqueous solutions to remove nickel(II) ions. Russ. J. Appl. Chem. 2004, 77, 83–87. [Google Scholar] [CrossRef]
  13. Lupeiko, T.G.; Gorbunova, M.O.; Bayan, E.M. Deep purification of aqueous solutions to remove chromium(III) with industrial carbonate-containing wastes. Russ. J. Appl. Chem. 2001, 74, 1698–1701. [Google Scholar] [CrossRef]
  14. Utpal, S. Colorimetric Determination of Tetracycline Hydrochloride in Pharmaceutical Preparations. J. AOAC Int. 1987, 70, 686–688. [Google Scholar] [CrossRef]
  15. Cherkashina, K.D.; Sumina, A.I.; Vakh, K.S.; Bulatov, A.V. Liquid–liquid microextraction of tetracyclines from biological fluids for their subsequent determination by high-performance liquid chromatography with UV detection. J. Anal. Chem. 2020, 75, 1424–1429. [Google Scholar] [CrossRef]
  16. Gorbunova, M.O.; Bayan, E.M. A novel paper-based sensor for determination of halogens and halides by dynamic gas extraction. Talanta 2019, 199, 513–521. [Google Scholar] [CrossRef]
  17. Gorbunova, M.O.; Bayan, E.M. A rapid field test method for the determination of hydrogen sulfide and sulfides in waters with gas preextraction. J. Anal. Chem. 2017, 72, 1263–1269. [Google Scholar] [CrossRef]
  18. Apyari, V.V.; Furletov, A.A.; Garshev, A.V.; Volkov, P.A.; Gorbunova, M.O.; Shevchenko, A.V. Preparation of reagent indicator papers with silver triangular nanoplates for chemical analysis. Moscow Univ. Chem. Bull. 2017, 72, 167–173. [Google Scholar] [CrossRef]
  19. Gorbunova, M.O.; Bayan, E.M.; Shevchenko, A.V.; Kulyaginova, M.S. Digital colorimetric determination of chlorides in water using gas extraction and methyl orange. Anal. Control 2017, 21, 274–280. [Google Scholar] [CrossRef]
  20. Uflyand, I.E.; Zhinzhilo, V.A.; Nikolaevskaya, V.O.; Kharisov, B.I.; Oliva González, C.M.; Kharissova, O.V. Recent Strategies to Improve MOF Performance in Solid Phase Extraction of Organic Dyes. Microchem. J. 2021, 168, 106387. [Google Scholar] [CrossRef]
  21. Kharisov, B.; Kharissova, O.; Zhinzhilo, V.; Bryantseva, J.; Uflyand, I. Solid-Phase Extraction of Organic Dyes on Mixed-Ligand Zr(IV) Metal–Organic Framework. Appl. Sci. 2022, 12, 12219. [Google Scholar] [CrossRef]
  22. Kharissova, O.V.; Zhinzhilo, V.A.; Bryantseva, J.D.; Uflyand, I.E.; Kharisov, B.I. ZrIV metal–organic framework based on terephthalic acid and 1,10-phenanthroline as an adsorbent for solid phase extraction of tetracycline antibiotics. Mendeleev Commun. 2022, 32, 661–663. [Google Scholar] [CrossRef]
  23. Sigma-Aldrich. Chlortetracycline Hydrochloride, Analytical Standard, ≥98.0% (HPLC). Available online: https://www.sigmaaldrich.com/RU/en/product/sial/phr1520 (accessed on 1 January 2025).
  24. Konieczka, P. Validation and Regulatory Issues for Sample Preparation. In Comprehensive Sampling and Sample Preparation; Pawliszyn, J., Ed.; Academic Press: Cambridge, MA, USA; Elsevier: Amsterdam, The Netherlands, 2012; Volume 2, pp. 699–711. [Google Scholar]
  25. Timofeev, K.L.; Kulinich, S.A.; Kharlamova, T.S. NH2-Modified UiO-66: Structural Characteristics and Functional Properties. Molecules 2023, 28, 3916. [Google Scholar] [CrossRef] [PubMed]
  26. Katz, M.J.; Brown, Z.J.; Siu, P.W. A facile synthesis of UiO-66, UiO-67 and their derivatives. Chem. Commun. 2013, 49, 9449–9451. [Google Scholar] [CrossRef]
  27. Hosseini-Bandegharaei, A.; Sarwghadi, M.; Heydarbeigi, A.; Hosseini, S.H.; Nedaie, M. Solid-Phase Extraction of Trace Amounts of Uranium(VI) in Environmental Water Samples Using an Extractant-Impregnated Resin Followed by Detection with UV-Vis Spectrophotometry. J. Chem. 2013, 2013, 671564. [Google Scholar] [CrossRef]
  28. Katz, M.J.; Moon, S.-Y.; Mondloch, J.E. Exploiting parameter space in MOFs: A 20-fold enhancement of phosphate-ester hydrolysis with UiO-66-NH2. Chem. Sci. 2015, 6, 2286–2291. [Google Scholar] [CrossRef]
  29. Rezaei, K.M.; Oveisi, A.R.; Kaykhaii, M.; Rezaei Kahkha, B. Determination of carbamazepine in urine and water samples using amino-functionalized metal-organic framework as sorbent. Chem. Cent. J. 2018, 12, 77. [Google Scholar] [CrossRef]
  30. Nickolov, Z.; Georgiev, G.; Stoilova, D.; Ivanov, I. Raman and IR study of cobalt acetate dihydrate. J. Mol. Struct. 1995, 354, 119–125. [Google Scholar] [CrossRef]
  31. Harouna-Oumarou, H.A.; Fauduet, H.; Porte, C.; Ho, Y.S. Comparison of kinetic models for the aqueous solid-liquid extraction of tilia sapwood in a continuous stirred tank reactor. Chem. Eng. Commun. 2007, 194, 537–552. [Google Scholar] [CrossRef]
  32. Gorodilova, A.I.; Lebedeva, E.L.; Petrova, Y.S.; Neudachina, L.K. Study of Sorption of Chlortetracycline Hydrochloride and Its Subsequent Determination by Capillary Zone Electrophoresis. J. Anal. Chem. 2023, 78, 1659–1664. [Google Scholar] [CrossRef]
  33. Polak, D.; Kamocki, S.; Szwast, M. Evaluation of the Potential of Metal–Organic Compounds ZIF-8 and F300 in a MembraneFiltration–Adsorption Process for the Removal of Antibiotics from Water. Antibiotics 2025, 14, 619. [Google Scholar] [CrossRef] [PubMed]
  34. Fan, L.; Miao, J.; Wang, X.; Cai, J.; Lin, J. Novel Al-doped UiO-66-NH2 nanoadsorbent with excellent adsorption performance for tetracycline: Adsorption behavior, mechanism, and application potential. J. Environ. Chem. Eng. 2023, 11, 109292. [Google Scholar] [CrossRef]
  35. Guo, Z.; Yang, F.; Yang, R.; Sun, L. Preparation of novel ZnO-NP@Zn-MOF-74 composites for simultaneous removal of copper and tetracycline from aqueous solution. Sep. Purif. Technol. 2021, 274, 118949. [Google Scholar] [CrossRef]
  36. Chen, B.; Li, Y.-H.; Du, Q.; Pi, X. Effective removal of tetracycline from water using copper alginate@graphene oxide with in-situ grown MOF-525 composite: Synthesis, characterization and adsorption mechanisms. Nanomaterials 2022, 12, 2897. [Google Scholar] [CrossRef] [PubMed]
  37. Kanmaz, N.; Demircivi, P. Adsorption of tetracycline using one-pot synthesis zirconium metal-organic framework (UiO-66) decorated hydroxyapatite. J. Mol. Liq. 2024, 397, 124171. [Google Scholar] [CrossRef]
  38. Robati, D.; Rajabi, M.; Moradi, O.; Najafi, F.; Tyagi, I.; Agarwal, S.; Gupta, V.K. Kinetics and thermodynamics of malachite green dye adsorption from aqueous solutions on graphene oxide and reduced graphene oxide. J. Mol. Liq. 2016, 214, 259–263. [Google Scholar] [CrossRef]
  39. Zhao, T.; Sun, A.; Xu, R.; Chen, R. Enhancing solid-phase extraction of tetracyclines with a hybrid biochar sorbent: A comparative study of chlorella and bamboo biochars. J. Chromatogr. A 2024, 1730, 465092. [Google Scholar] [CrossRef]
  40. Barroso, J.M. Commission regulation (EU) №37/2010 of 22 December 2009 on pharmacologically active substances and their classification regarding maximum residue limits in food stuffs of animal origin. Off. J. Eur. Union 2010, 1, 1–72. [Google Scholar]
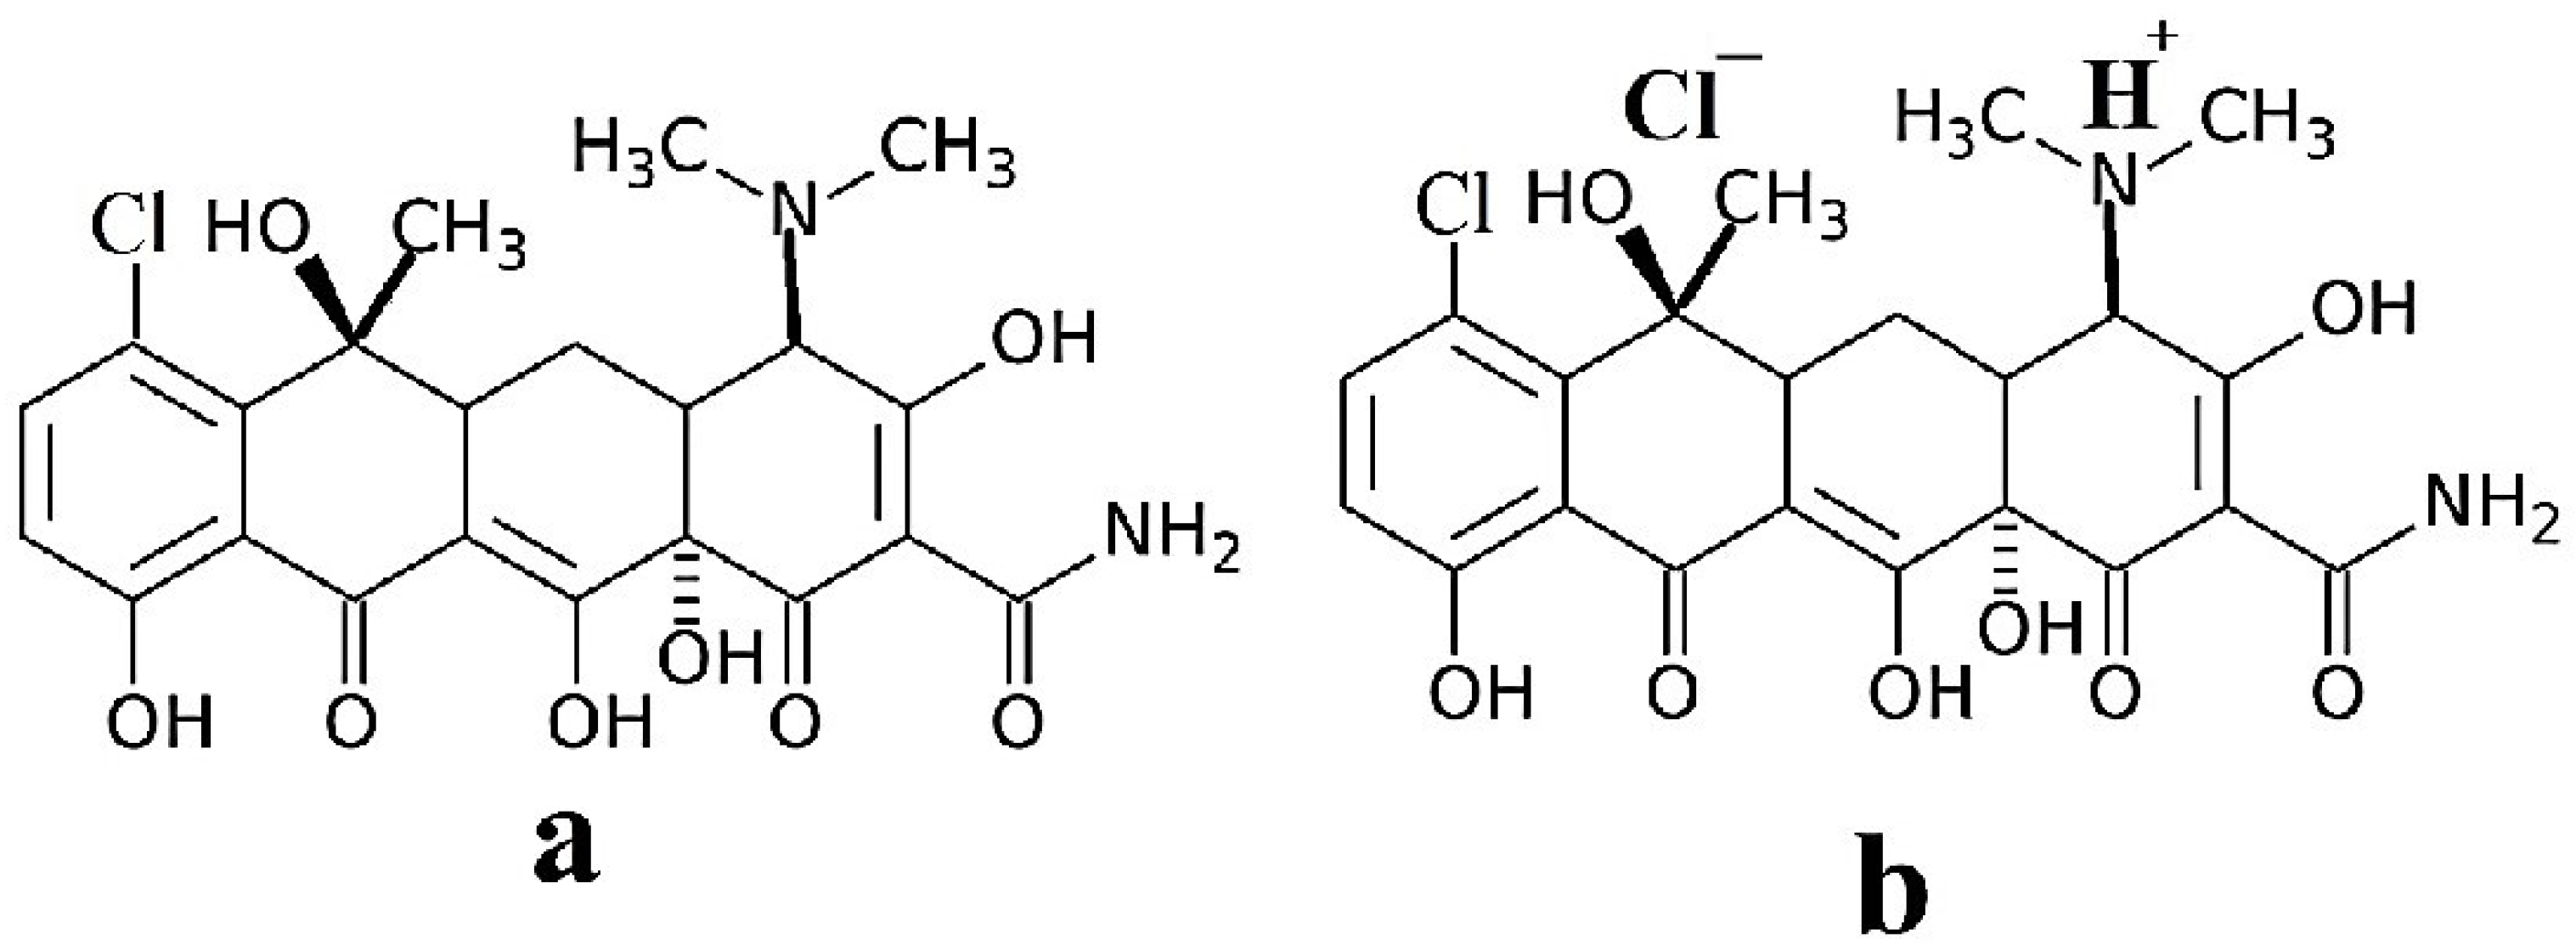
Figure 1. Structure of CTC: (a)—chlortetracycline base, (b)—chlortetracycline hydrochloride. The structures were manually drawn by the authors using ChemDraw 23.1.1 (PerkinElmer, Waltham, MA, USA).
Analytica 06 00028 g001
Figure 2. Scheme of synthesis of Zr-MOF. The structures were manually drawn by the authors using ChemDraw 23.1.1 (PerkinElmer).
Analytica 06 00028 g002
Figure 3. Fluorescence of Zr-MOF suspension in DMF in UV light (λ = 350 nm): (a)—view of the sorbent dispersion in DMF in daylight, (b)—under UV irradiation using a wood filter.
Analytica 06 00028 g003
Figure 4. SEM image of Zr-MOF crystals.
Analytica 06 00028 g004
Figure 5. XRD pattern of Zr-MOF.
Analytica 06 00028 g005
Figure 6. IR spectrum of Zr-MOF.
Analytica 06 00028 g006
Figure 7. Nitrogen sorption–desorption isotherm of Zr-MOF at 77 K.
Analytica 06 00028 g007
Figure 8. Dependence of the degree of sorption of CTC from an aqueous solution on time at 5 °C (1), 20 °C (2), and 35 °C (3); C0—100 mg/L, sorbent mass—100 mg, pH—6.5.
Analytica 06 00028 g008
Figure 9. Electronic absorption spectra of CTC solution at 5 °C (a), 20 °C (b), and 35 °C (c): 1—initial solution, 2—solution after 10 min of phase contact, 3—30 min, 4—45 min, 5—60 min, 6—90 min and 7—after 180 min.
Analytica 06 00028 g009
Figure 10. Kinetic curves for CTC solution at 5 °C (1), 20 °C (2), and 35 °C (3); C0—100 mg/L, sorbent mass—100 mg, pH—6.5, n = 3, p = 0.95.
Analytica 06 00028 g010
Figure 11. Kinetics of the CTC sorption in kinetic models of pseudo-first (a) and pseudo-second (b) order at 5 °C (1), 20 °C (2), and 35 °C (3); C0—100 mg/L, sorbent mass—100 mg, pH—6.5.
Analytica 06 00028 g011
Figure 12. Dependence of the logarithm of the sorption rate constant on the reciprocal temperature.
Analytica 06 00028 g012
Figure 13. Dependence of the thermodynamic distribution constant on the reciprocal temperature for the CTC sorption.
Analytica 06 00028 g013
Figure 14. Dependence of the maximum sorption degree on the mass of the sorbent for CTC at 5 °C (1), 20 °C (2), and 35 °C (3); C0—100 mg/L, pH—6.5, n = 3, p = 0.95.
Analytica 06 00028 g014
Figure 15. Effect of initial CTC concentration on sorption at 5 °C (1), 20 °C (2), and 35 °C (3); sorbent mass—100 mg, pH—6.5, n = 3, p = 0.95.
Analytica 06 00028 g015
Figure 16. Isomerization of CTC under alkaline conditions. The structures were manually drawn by the authors using ChemDraw 23.1.1 (PerkinElmer).
Analytica 06 00028 g016
Figure 17. Dependence of the degree of sorption of CTC on the pH of the solution, C0—100 mg/L, sorbent mass—100 mg.
Analytica 06 00028 g017
Figure 18. Langmuir (a) and Freundlich (b) sorption isotherms for CTC solution at 5, 20 and 35 °C.
Analytica 06 00028 g018
Figure 19. Dependence of the logarithm of the thermodynamic constant on the reciprocal temperature for CTC.
Analytica 06 00028 g019
Figure 20. Number of repeated cycles of sorbent operation after its regeneration, C0—100 mg/L, sorbent mass—100 mg, pH—6.5, t—20 °C.
Analytica 06 00028 g020
Figure 21. Schematic diagram of the apparatus for the CTC sorption.
Analytica 06 00028 g021
Figure 22. Dynamics of CTC elution from the solid phase of the sorbent, aliquot volume 100.0 mL, pH—6.5, t—20 °C.
Analytica 06 00028 g022
Table 1. Characteristics of Zr-MOF.
SBET (m2/g)Vpore (cm3/g)Vmicropore (cm3/g)Average Pore Size (Å)
8200.950.237.97
Table 2. Logarithms of the sorption rate constant at different temperatures.
t, °C52035
ln k0.0850.250.4
Table 3. Thermodynamic parameters of the CTC sorption.
t, °CΔG0 (kJ mol−1)ΔH0 (kJ mol−1)ΔS0 (J mol−1K−1)Ea (kJ mol−1)
5−6.19−4.4139.886.48
20−5.45
35−4.60
Table 4. Values of the maximum sorption capacity of the sorbent at different temperatures.
t (°C)52035
qmax (mg/g)578502337
Table 5. Values of the parameters of the isotherms of sorption of CTC with the sorbent.
ModelParameterT, K
278293308
Langmuirqmax252.1165.8122.1
KL0.0230.0240.021
R20.9960.9870.992
Freundlich1/n0.540.580.69
KF2.212.181.87
R20.9990.9990.998
Table 6. Comparison of MOF-based adsorbents for tetracycline class antibiotics.
MOF SorbentAdsorption
Capacity (mg/g)
Applicable pH
Range
Regeneration
Cycles
Reference
ZIF-8442.25–74[32]
Al-doped UiO-66-NH25204–103[33]
ZnO-NP@Zn-MOF-74118.974[34]
Alg-Cu@GO@MOF-5255336–7Not reported[35]
UiO-66@HAp52.9Not reportedNot reported[36]
Zr-NH2-BDC5784–105This work
Table 7. Thermodynamic parameters of CTC sorption in the temperature range of 283–308 K.
T (K)KcΔG0 (kJ/mol)ΔH0 (kJ/mol)ΔS0 (J/mol K)
2785.9−4.12−0.0465.76
2934.4−3.63
3082.4−2.31
Table 8. Metrological characteristics of the method for determining CTC by spectrophotometric method with preliminary concentration by SPE.
CTC Introduced (mg)CTC Found (mg)Rdes (%)SrEFKdKLOD (mg/L)LOQ (mg/L)
0.150.14008±0.0014 (±1.02%)97.3±0.20.026.9530.097.50.060.06–90
Disclaimer/Publisher’s Note: The statements, opinions and data contained in all publications are solely those of the individual author(s) and contributor(s) and not of MDPI and/or the editor(s). MDPI and/or the editor(s) disclaim responsibility for any injury to people or property resulting from any ideas, methods, instructions or products referred to in the content.