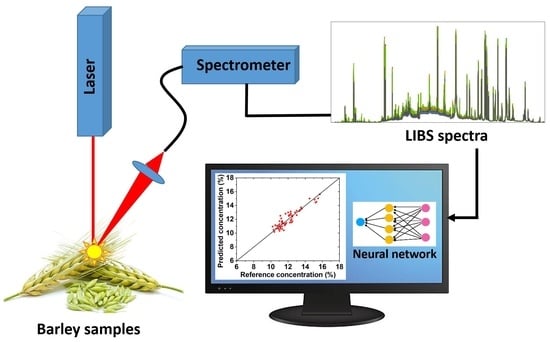
Article

Rapid Spectroscopic Analysis for Food and Feed Quality Control: Prediction of Protein and Nutrient Content in Barley Forage Using LIBS and Chemometrics

1
Institut National de la Recherche Scientifique, Centre Énergie Matériaux Télécommunications, 1650 Lionel-Boulet Blvd, Varennes, QC J3X 1P7, Canada
2
Clean Energy Innovation Research Centre, National Research Council of Canada, 75 de Mortagne Blvd., Boucherville, QC J4B 6Y4, Canada
3
Aquatic and Crop Resource Development, National Research Council of Canada, Saskatoon, SK S7N 0W9, Canada
*
Authors to whom correspondence should be addressed.
Analytica 2025, 6(3), 29; https://doi.org/10.3390/analytica6030029
Submission received: 10 June 2025 / Revised: 22 July 2025 / Accepted: 25 August 2025 / Published: 28 August 2025
(This article belongs to the Section Spectroscopy)

Abstract

Rapid and accurate assessment of nutritional quality, particularly crude protein content and essential nutrient concentrations, remains a major challenge in the food and feed industries. In this study, laser-induced breakdown spectroscopy (LIBS) was combined with advanced chemometric modeling to predict the levels of crude protein and key macro- and micronutrients (Ca, Mg, K, Na, Fe, Mn, P, Zn) in 61 barley forage samples composed of whole aerial plant parts ground prior to analysis. LIBS offers a compelling alternative to traditional analytical methods by enabling real-time analysis with minimal sample preparation. To minimize interference from atmospheric nitrogen, nitrogen spectral lines were excluded from the protein calibration model in favor of spectral lines from elements biochemically associated with proteins. We compared the performance of Partial Least Squares (PLSR) regression and Extreme Learning Machine (ELM) using fivefold cross-validation. ELM outperformed PLS in terms of prediction, achieving a coefficient of determination (R2) close to 1 and a ratio of performance to deviation (RPD) exceeding 2.5 for proteins and several nutrients. These results underscore the potential of LIBS-ELM integration as a robust, non-destructive, and in situ tool for rapid forage quality assessment, particularly in complex and heterogeneous plant matrices.

1. Introduction

Plants play a central role in the food chain for both humans and animals, serving as the primary source of essential nutrients such as proteins, minerals, and bioactive compounds. In animal nutrition, the quality of forage plants is critical for maintaining ruminant health, optimizing zootechnical performance, and supporting the sustainability of livestock systems. Among the key nutritional components, proteins and minerals (e.g., calcium, magnesium, potassium, phosphorus, and iron) are vital for numerous physiological processes, including metabolism, growth, reproduction, and the production of milk and meat. The concentration of these elements in plants is influenced by factors such as plant variety, environmental conditions, and agricultural practices [1]. Therefore, accurate and rapid measurement is essential for adjusting feed rations and ensuring the nutritional quality of animal products.
Barley is a strategic forage crop in the Canadian Prairies due to its nutritional value and resilience to climatic variability. As the entire plant is commonly used in ruminant diets, its comprehensive analysis is relevant for evaluating overall forage quality [2]. However, current analytical methods for determining its chemical composition remain largely conventional. For mineral analysis, techniques such as atomic absorption spectroscopy (AAS), inductively coupled plasma optical emission spectroscopy (ICP-OES), and inductively coupled plasma mass spectrometry (ICP-MS) are standard. While accurate and sensitive, these methods require acid digestion, substantial reagent use, and skilled personnel, making them unsuitable for rapid, on-site analysis. Protein content is typically assessed using the Kjeldahl or Dumas methods [3], which are also labor-intensive, costly, and require corrosive or high-purity reagents. Near-infrared (NIR) spectroscopy has emerged as an indirect method for estimating protein content, especially in homogeneous matrices such as wheat or rice [4,5], and, to some extent, in more heterogeneous matrices like woody plants [6]. However, the low spectral specificity of NIR signals and their sensitivity to matrix effects limit their performance, necessitating complex chemometric models [7] and frequent recalibration.
To address these limitations, laser-induced breakdown spectroscopy (LIBS) [8] has emerged as a promising alternative. LIBS operates by focusing a laser pulse on a sample surface, generating a plasma whose light emission contains spectral lines characteristic of the constituent elements. The presence and concentration of elements are determined from emission wavelengths and intensities, respectively. LIBS is rapid, versatile, quasi-non-destructive, and compatible with portable instrumentation, making it particularly advantageous for in situ applications where conventional techniques fall short. These strengths have propelled its adoption across diverse domains, including environmental monitoring [9], food safety [10], medicine and biology [11], and agriculture [12], especially where fast, reagent-free, and spatially resolved analyses are required.
In the agri-food sector, recent studies have explored the potential of LIBS for a variety of applications [10,13], including the analysis of medicinal plants compared with ICP-OES [14], determination of essential minerals in leafy vegetables [15], assessment of micronutrients in diverse plant species [16], detection of contaminants such as chromium in rice leaves [17], and analysis of heavy metal accumulation [18,19]. LIBS has also been used to assess plant responses to pathogens [20], evaluate nutrient levels in hydroponically grown lettuce [21], and discriminate between aromatic plants [22]. A few studies have also highlighted the feasibility of using LIBS for forage plant analyses, such as elemental detection in barley leaves [23] or metal accumulation in tall fescue [24]. In addition, LIBS has demonstrated the capacity to deliver molecular insights under controlled conditions, as evidenced by the detection of trace alcohol congeners in a gas matrix [25], the identification of hydrocarbons [26], or the analysis of explosives [27].
Several studies have reported the use of LIBS for protein-related analysis in animal-derived samples, including sheep colostrum [28], poultry meat [29], canned tuna [30], maternal milk and infant formula [31], meat product authentication [32], and discrimination of terrestrial processed animal proteins [33]. Other studies have focused on identifying blood-contained proteins [34,35], the detection of whey protein concentrate adulteration [36], and the analysis of foreign protein adulteration in milk powder [37,38]. However, with the exception of the study by Abdel-Salam et al. [28], in which a strong correlation was found between the protein content and a calcium line, as well as C2 and CN bands, these applications have been largely limited to qualitative assessments or species classification tasks, without aiming for direct, quantitative determination of protein content. To the best of our knowledge, no prior studies have focused on determining the protein content of plant-based materials using LIBS. The only exception is [39], which attempted to directly estimate protein content in homogeneous cereal samples by using nitrogen spectral lines. However, this approach faces major limitations when applied to more complex plant matrices, such as forages, due to strong interference from atmospheric nitrogen that compromises the reliability of the nitrogen signal.
The present study is, to our knowledge, the first to propose a direct quantitative LIBS-based approach for protein prediction in plant materials that does not rely on nitrogen lines. Specifically, it focuses on heterogeneous whole-plant barley forage, offering a novel application of LIBS to complex agricultural samples. To establish robust correlations between LIBS spectral features and chemical concentrations, the application of chemometric models is essential [40]. Among these, Extreme Learning Machines (ELM) [41], a type of single-layer feedforward neural network, and Partial Least Squares (PLS) regression [42] have shown considerable promise in addressing the challenges posed by the high dimensionality and complexity of LIBS data. PLS is widely used for its capacity to manage collinear and noisy datasets [43,44,45], whereas ELM provides a compelling alternative for capturing non-linear relationships, offering significantly faster training times than traditional backpropagation-based neural networks [46,47,48].
This study aims to develop a rapid, reliable, and non-destructive method for predicting the protein and nutrient composition of barley forage using LIBS. By leveraging advanced chemometric models, specifically PLS and ELM, we evaluate the potential of this technique as a practical alternative to conventional chemical analyses for feed quality assessment.

2. Materials and Methods

2.1. Sample Preparation

A total of 61 barley forage samples were collected from various regions across the Canadian Prairies, where they were cultivated under whole-barley swath grazing systems. Post-harvest, the entire plants (including stems, leaves, and ears) were chopped, dried, and ensiled following standard long-term forage storage practices. For analysis using both LIBS and conventional techniques, the samples were further dried and ground. The entire barley plant was analyzed, as this reflects the actual form in which it is fed to animals. This approach was essential to ensure the relevance of our analysis to real-world applications in animal nutrition. For LIBS measurements, the resulting coarse powder was pressed into pellets (4 cm diameter) using a hydraulic press at 88.5 MPa for 3 min. This pressing step ensured a uniform and compact surface to minimize variations in laser focusing and to reduce crater formation caused by laser ablation [49]. Figure 1 displays an example of such a pellet, highlighting the inherent heterogeneity in fibre size and composition.

2.2. Chemical Composition

Chemical characterization of the samples was performed by Cumberland Valley Analytical Services (Waynesboro, PA, USA) [50], an accredited laboratory specializing in feed and forage analysis. These results served as reference values for calibrating and validating LIBS models. Table 1 presents the summary statistics (minimum, maximum, and average concentrations) for proteins, macronutrients, and micronutrients in the 61 samples. Full compositional data are provided in Table A1 of Appendix A. The dataset demonstrates significant nutritional richness and variability, reflecting the biochemical diversity of the forage samples.
The nutrient concentrations were determined by wet chemistry. The analytical uncertainty in crude protein concentration determined by standard wet chemistry methods (e.g., Kjeldahl or Dumas) typically ranges between ±0.1 and ±0.5 percentage points on an absolute basis, assuming that proper grinding, mixing, and subsampling techniques are followed [51]. For chemical elements, typical relative analytical uncertainties are approximately ±1% to ±5% for macronutrients and ±10% to ±20% for micronutrients, depending on the concentration and analytical method [52].

2.3. LIBS Experimental Setup

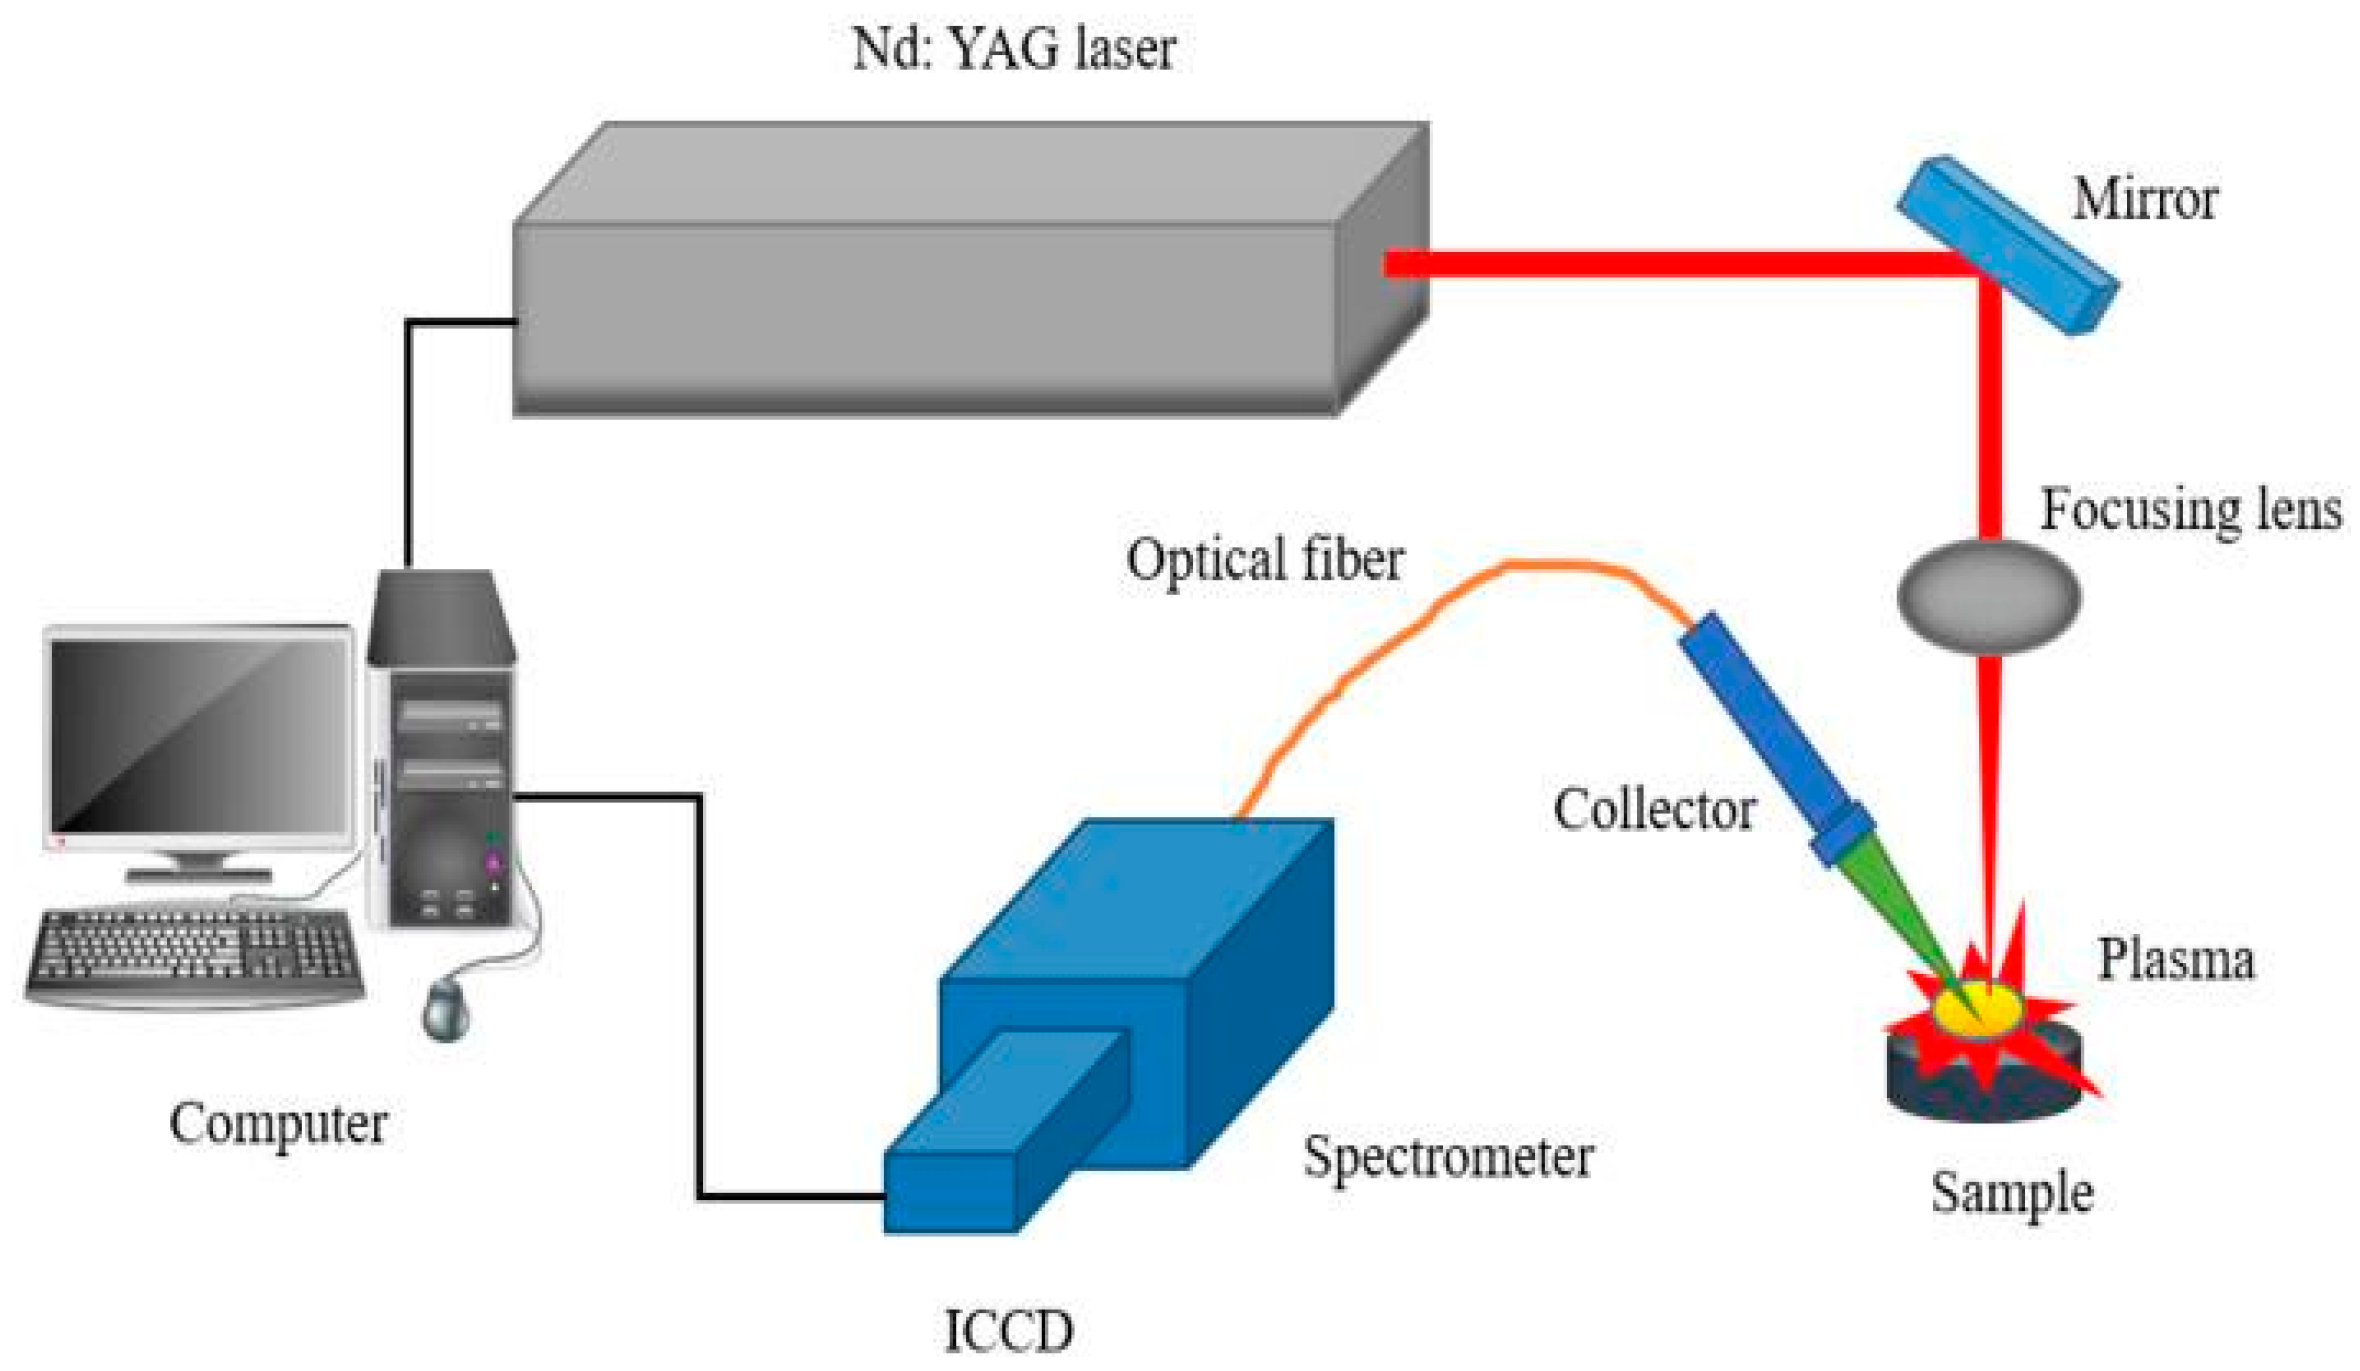
The LIBS experimental setup is illustrated in Figure 2. A QuantaRay GCR150 Q-switched Nd:YAG laser (Spectra-Physics, Mountain View, CA, USA) operating at 1064 nm, with a pulse duration of 6 ns and a repetition rate of 5 Hz, was used to deliver 35 mJ per pulse onto a spot with a diameter of ~275 µm. An argon gas stream was employed to suppress interference from ambient air and enhance signal quality [53].
Two spectrometers were employed. The primary instrument, referred to as the Modular spectrometer, was a multi-channel system consisting of eight AvaSpec-2048 CCD modules (Avantes, Apeldoorn, The Netherlands) covering the 186.75–1007.65 nm range. Spectral acquisition was conducted with a 1 µs delay and an integration time of 1 ms. A 10 × 10 mapping pattern (100 spots per sample, as shown in Figure 1) was applied, with 5 laser shots per position and a 1 mm step size. The sample was mounted on a motorized translation stage for automated scanning.
Due to reduced sensitivity in the lower UV region for the used setup in our conditions, especially near 214 nm where phosphorus and zinc lines occur, a high-resolution Echelle spectrometer Aryelle 200 (LTB Lasertechnik Berlin, Berlin, Germany) having good sensitivity in the UV region, with 200–817 nm range and 22–90 pm resolution, was also used. This spectrometer was equipped with an ICCD camera iStar DH334T (Andor Technology, Belfast, Northern Ireland, UK), using a 1 µs delay time, a 5 µs integration time, and averaging 20 spectra per spot across 11 manually selected spots per sample. Although not automated, this secondary setup allowed for specific assessment of elements poorly detected by the Modular system and enabled evaluation of sampling variability in heterogeneous matrices.

2.4. Spectral Preprocessing and Variable Selection

Preprocessing of the spectral data is critical to enhance signal quality and suppress artifacts [7,54]. Baseline correction was applied to remove background plasma emission and electronic noise using the 1st or 2nd order polynomial fittings [55]. Standard normal variate (SNV) normalization [56,57] was used to correct for sampling and instrumental variability.
Principal Component Analysis (PCA) was employed to assess spectral consistency across sampling points and identify outliers [7,54]. This multivariate technique reduces data dimensionality while preserving variance, facilitating the detection of anomalous spectra based on the first two principal components. Outlier spectra at certain locations were excluded prior to modeling to enhance prediction reliability.
Univariate calibration was found inadequate for most elements, except for iron, due to matrix effects and non-linear signal responses. To improve variable selection, we adopted a targeted approach based on known atomic transitions. First, relevant spectral lines were identified using the NIST atomic database [58], excluding those involving transitions from the ground state to mitigate self-absorption effects [49,59]. Next, Pearson correlation coefficients [60] were computed between spectral line intensities and analyte concentrations:
r = C o v ( Y , Z ) V a r Y   V a r | Z |
where Y R N × 1 is the concentration vector; Z R N × 1 is the vector of spectral line intensities, and N is the number of samples. Spectral lines exhibiting strong and statistically significant correlations with the target analytes were retained for subsequent chemometric modeling.

2.5. Quantitative Analysis: PLS and ELM Modeling

Quantitative LIBS analysis often requires advanced modeling due to complex relationships between signal intensity and element concentration. This complexity results from matrix effects and self-absorption phenomena [49,53,61], rendering univariate methods inadequate. Two multivariate approaches were evaluated for predicting protein and nutrient content: PLS regression [62] and ELM [63].

2.5.1. Partial Least Squares (PLS) Regression

PLS regression is a widely used linear chemometric technique that models the relationship between high-dimensional spectral data and target variables by extracting latent variables that maximize covariance [64]. It is especially suited for datasets with collinearity. The main hyperparameter is the number of latent components, which must be optimized to balance model complexity and predictive performance.

2.5.2. Extreme Learning Machine (ELM)

The ELM algorithm, developed by Huang [65], enables rapid training of single-layer feedforward neural networks. Unlike traditional neural networks that require iterative weight adjustment (e.g., via backpropagation), ELM randomly assigns input weights and biases and computes output weights analytically. This process allows for exceptionally fast training while preserving generalization capability.
As shown in Figure 3, the ELM network includes an input layer, a hidden layer with non-linear activation (sigmoid), and a single output neuron predicting concentration. The hidden layer output matrix H is computed from the input data X, random weight matrix W, and bias vector b. The output weights β are calculated by minimizing the least-squares error between the predicted and reference concentrations using the Moore–Penrose pseudo-inverse of H. The mathematical formulation of the ELM algorithm is provided in Appendix B.
Due to the random initialization of weights and biases, model performance may vary. To address this, we optimized the number of hidden neurons, ELM’s main hyperparameter, by testing multiple architectures and evaluating each configuration over 1000 random initializations. The model yielding the best cross-validation performance was retained. Despite the high number of iterations, the process remains computationally lightweight. While PLS is well-suited for modeling linear dependencies, ELM offers significant advantages for capturing non-linear relationships in LIBS spectra, with excellent training speed, robustness, and minimal tuning.

2.6. Model Evaluation

Model performance was assessed using three standard metrics: Root Mean Square Error (RMSE), coefficient of determination ( R 2 ) [66], and Ratio of Performance to Deviation (RPD) [67]:
R M S E = 1 n i = 1 n ( y i y ^ i ) 2 ,
R 2 = 1 i = 1 n y i y ^ i 2 i = 1 n y i y ¯ i 2 ,
R P D = S D R M S E .
where y i   and y ^ i are reference and predicted values, respectively; y ¯ i   is the mean of the reference values; S D is the standard deviation of the reference values, and n is the number of samples.
An RMSE near zero and an R 2 close to 1 indicates high accuracy. RPD values are interpreted as follows [67]:
  • RPD < 1.5: Not usable for analysis;
  • 1.5 ≤ RPD < 2.0: Fair, can distinguish high/low values;
  • 2.0 ≤ RPD < 2.5: Acceptable for rough screening;
  • 2.5 ≤ RPD < 3.0: Good, suitable for approximate prediction;
  • RPD ≥ 3.0: Excellent, reliable for quantitative use.
Cross-validation was employed to optimize model hyperparameters and reduce the risk of overfitting [66]. To this end, the dataset was first randomly shuffled and then partitioned into six validation subsets, each containing 10 or 11 samples, with the remaining samples used for calibration. The hyperparameters of both PLS and ELM models were tuned by minimizing the following heuristic objective function:
φ = 0.3 · R M S E C + 0.7 · R M S E V 0.3 · R C 2 0.7 · R V 2 ,
where the subscripts C and V refer to the calibration and validation sets, respectively. Although this composite parameter lacks dimensional consistency, it was found to effectively balance the trade-offs between RMSE, R 2 , and RPD in the validation sets, while maintaining consistency with the corresponding calibration metrics. The performance metrics reported below represent the average results obtained from the cross-validation process. All models were implemented using direct programming, allowing fine control over training parameters and more precise optimization of model architecture.

3. Results

3.1. LIBS Spectra Processing and PCA Analysis

Figure 4 presents the LIBS spectra obtained from 61 barley forage samples using the Modular spectrometer. Each spectrum is an average of approximately 100 individual spectra, with each location representing the average of five consecutive laser shots. To ensure data reliability, outlier spectra were identified and removed using a PCA-based filtering approach. Specifically, spectra falling far outside the main cluster in the PCA score plot were excluded, typically fewer than six per sample, before averaging the remaining spectra. This preprocessing step effectively removed spectra exhibiting significant deviations, likely due to local inhomogeneities or acquisition artifacts.
Each channel of the Modular spectrometer was preprocessed independently to improve signal quality. This included baseline correction and standard normal variate (SNV) normalization. Additionally, spectral overlaps between adjacent channels were removed to prevent artifacts. A similar procedure was applied to spectra obtained with the Echelle spectrometer. However, due to its design, which produces a single continuous spectrum rather than eight separate channels, the preprocessing was comparatively simpler.
PCA was employed to evaluate the consistency of LIBS measurements within each sample and to assess the chemical variability between samples. For each of the 61 samples, 100 spectra were randomly divided into three subgroups of equal size. The spectra within each subgroup were averaged to generate three representative spectra per sample, thereby enabling simultaneous assessment of both intra-sample reproducibility and inter-sample differentiation. PCA was then performed on the resulting set of 183 spectra (3 × 61). To aid interpretation, Figure 5 presents the PCA score plots for a representative subset of 30 samples, comparing the results obtained with both the Modular and Echelle LIBS instruments.
As illustrated in Figure 5a, PCA applied to the Modular spectrometer data shows that the three spectra for each sample are fairly well clustered, confirming good measurement repeatability and a distinct chemical signature for each sample. Notably, samples with higher iron (Fe) and manganese (Mn) concentrations are located further from the main data cloud, suggesting that these elements significantly influence spectral variance and are, thus, key contributors to chemical differentiation. In contrast, the Echelle spectrometer data (Figure 5b) show more dispersion among the three subgroups per sample. This increased variability likely stems from the smaller number of sampling locations (11 per sample), resulting in lower representativeness of the sample’s heterogeneity.
To quantitatively assess clustering quality, silhouette coefficients were calculated. For a given spectrum i, the silhouette coefficient s i is defined as
s i = b i a i m a x [ a i , b i ]
where a i is the average distance between spectrum i and other spectra in the same cluster, and b i is the average distance between i and the nearest spectra of neighboring clusters. Values of s i   close to 1 indicate well-separated, cohesive clusters, while negative values suggest poor clustering. The mean silhouette coefficient s ¯ was 0.52 for the Modular spectrometer and 0.19 for the Echelle spectrometer when using the first three principal components (PCs), confirming superior clustering performance with the Modular system. This performance gap became even more pronounced when a greater number of PCs were included, with s ¯ reaching a maximum of 0.72 for the Modular system and 0.23 for the Echelle when using nine PCs, and slowly decreasing when using more PCs.

3.2. Protein Prediction Results

In conventional analytical methods such as Kjeldahl or Dumas, protein content is estimated from nitrogen concentration using a standard conversion factor (typically 6.25). However, this approach presents significant limitations in the context of LIBS spectroscopy due to the high background contribution from atmospheric nitrogen in the laser-induced plasma. Although an argon purge was used to reduce air interference, nitrogen emission lines were still detected, even in nitrogen-free reference materials such as cellulose. This observation confirms that nitrogen lines in LIBS spectra originate not only from the sample matrix but also from the ambient atmosphere, undermining their reliability for direct protein quantification.
Consistent with these findings, no robust correlation could be established between nitrogen line intensities and measured protein concentrations. Consequently, nitrogen lines were excluded from the calibration models. Unlike Sezer [39], who used nitrogen emissions to predict protein content in relatively homogeneous cereal grains, our strategy focused on alternative elemental markers biochemically associated with proteins. Elements, such as calcium (Ca), iron (Fe), manganese (Mn), potassium (K), and sodium (Na), were selected for their known roles in protein structure, stabilization, and enzymatic function. For example, iron acts as a cofactor in metalloenzymes [68,69], calcium aids in protein folding and structural stability [68,70], manganese functions as an enzyme activator, and both potassium and sodium maintain the crucial ionic environment for protein activity and membrane protein function [68,69].
Incorporating these elements into the chemometric models enabled accurate predictions of protein content from the LIBS spectra. One notable outlier, sample 18, showed significant discrepancies in all modeling scenarios, across both instruments (Modular and Echelle) and both modeling approaches (ELM and PLS). Despite normal macro- and micronutrient levels, its reported protein concentration (19.3%) was anomalously high and could not be reproduced by any model. This suggests a possible error in the reference measurement. To preserve model robustness, sample 18 was excluded from further protein prediction analysis.
The ELM and PLS models were developed using 41 and 32 spectral input variables for the Modular and Echelle spectrometers, respectively. These correspond to emission lines from the elements listed in Table A2 of Appendix A. The number of hidden neurons in the ELM models was optimized through cross-validation by minimizing the average parameter φ (Equation (5)), resulting in 35 neurons for the Modular spectrometer and 30 for the Echelle. For partial least squares (PLS), the optimal number of latent variables was determined by cross-validation in a similar way and was found to be 28.
Cross-validation results for both models are presented in Table 2. With the Modular spectrometer, ELM achieved an RMSEC of 0.50% and an RMSEV of 0.56%, with R 2 values of 0.84 (calibration) and 0.74 (validation), and RPDs above 2. These values reflect satisfactory and practically useful predictive performance, supporting the suitability of the model for quantitative applications. In contrast, the PLS model produced similar calibration results but weaker validation performance.
For the Echelle spectrometer, both models performed slightly worse due to lower sample representativeness (fewer acquisition spots). Nonetheless, ELM still outperformed PLS, underscoring its capacity to model non-linear relationships that linear PLS cannot capture. ELM’s flexible architecture enhances its robustness against signal variability, making it particularly suited to complex, heterogeneous samples.
A comparative analysis further confirmed the superior performance of models built using the Modular spectrometer. The improved results are attributed to the higher number of measurement points (~100 vs. 11), enabling better sampling of the forage’s heterogeneous composition. Although the Echelle spectrometer offers superior spectral resolution, its limited spatial sampling introduces variability that compromises prediction stability.
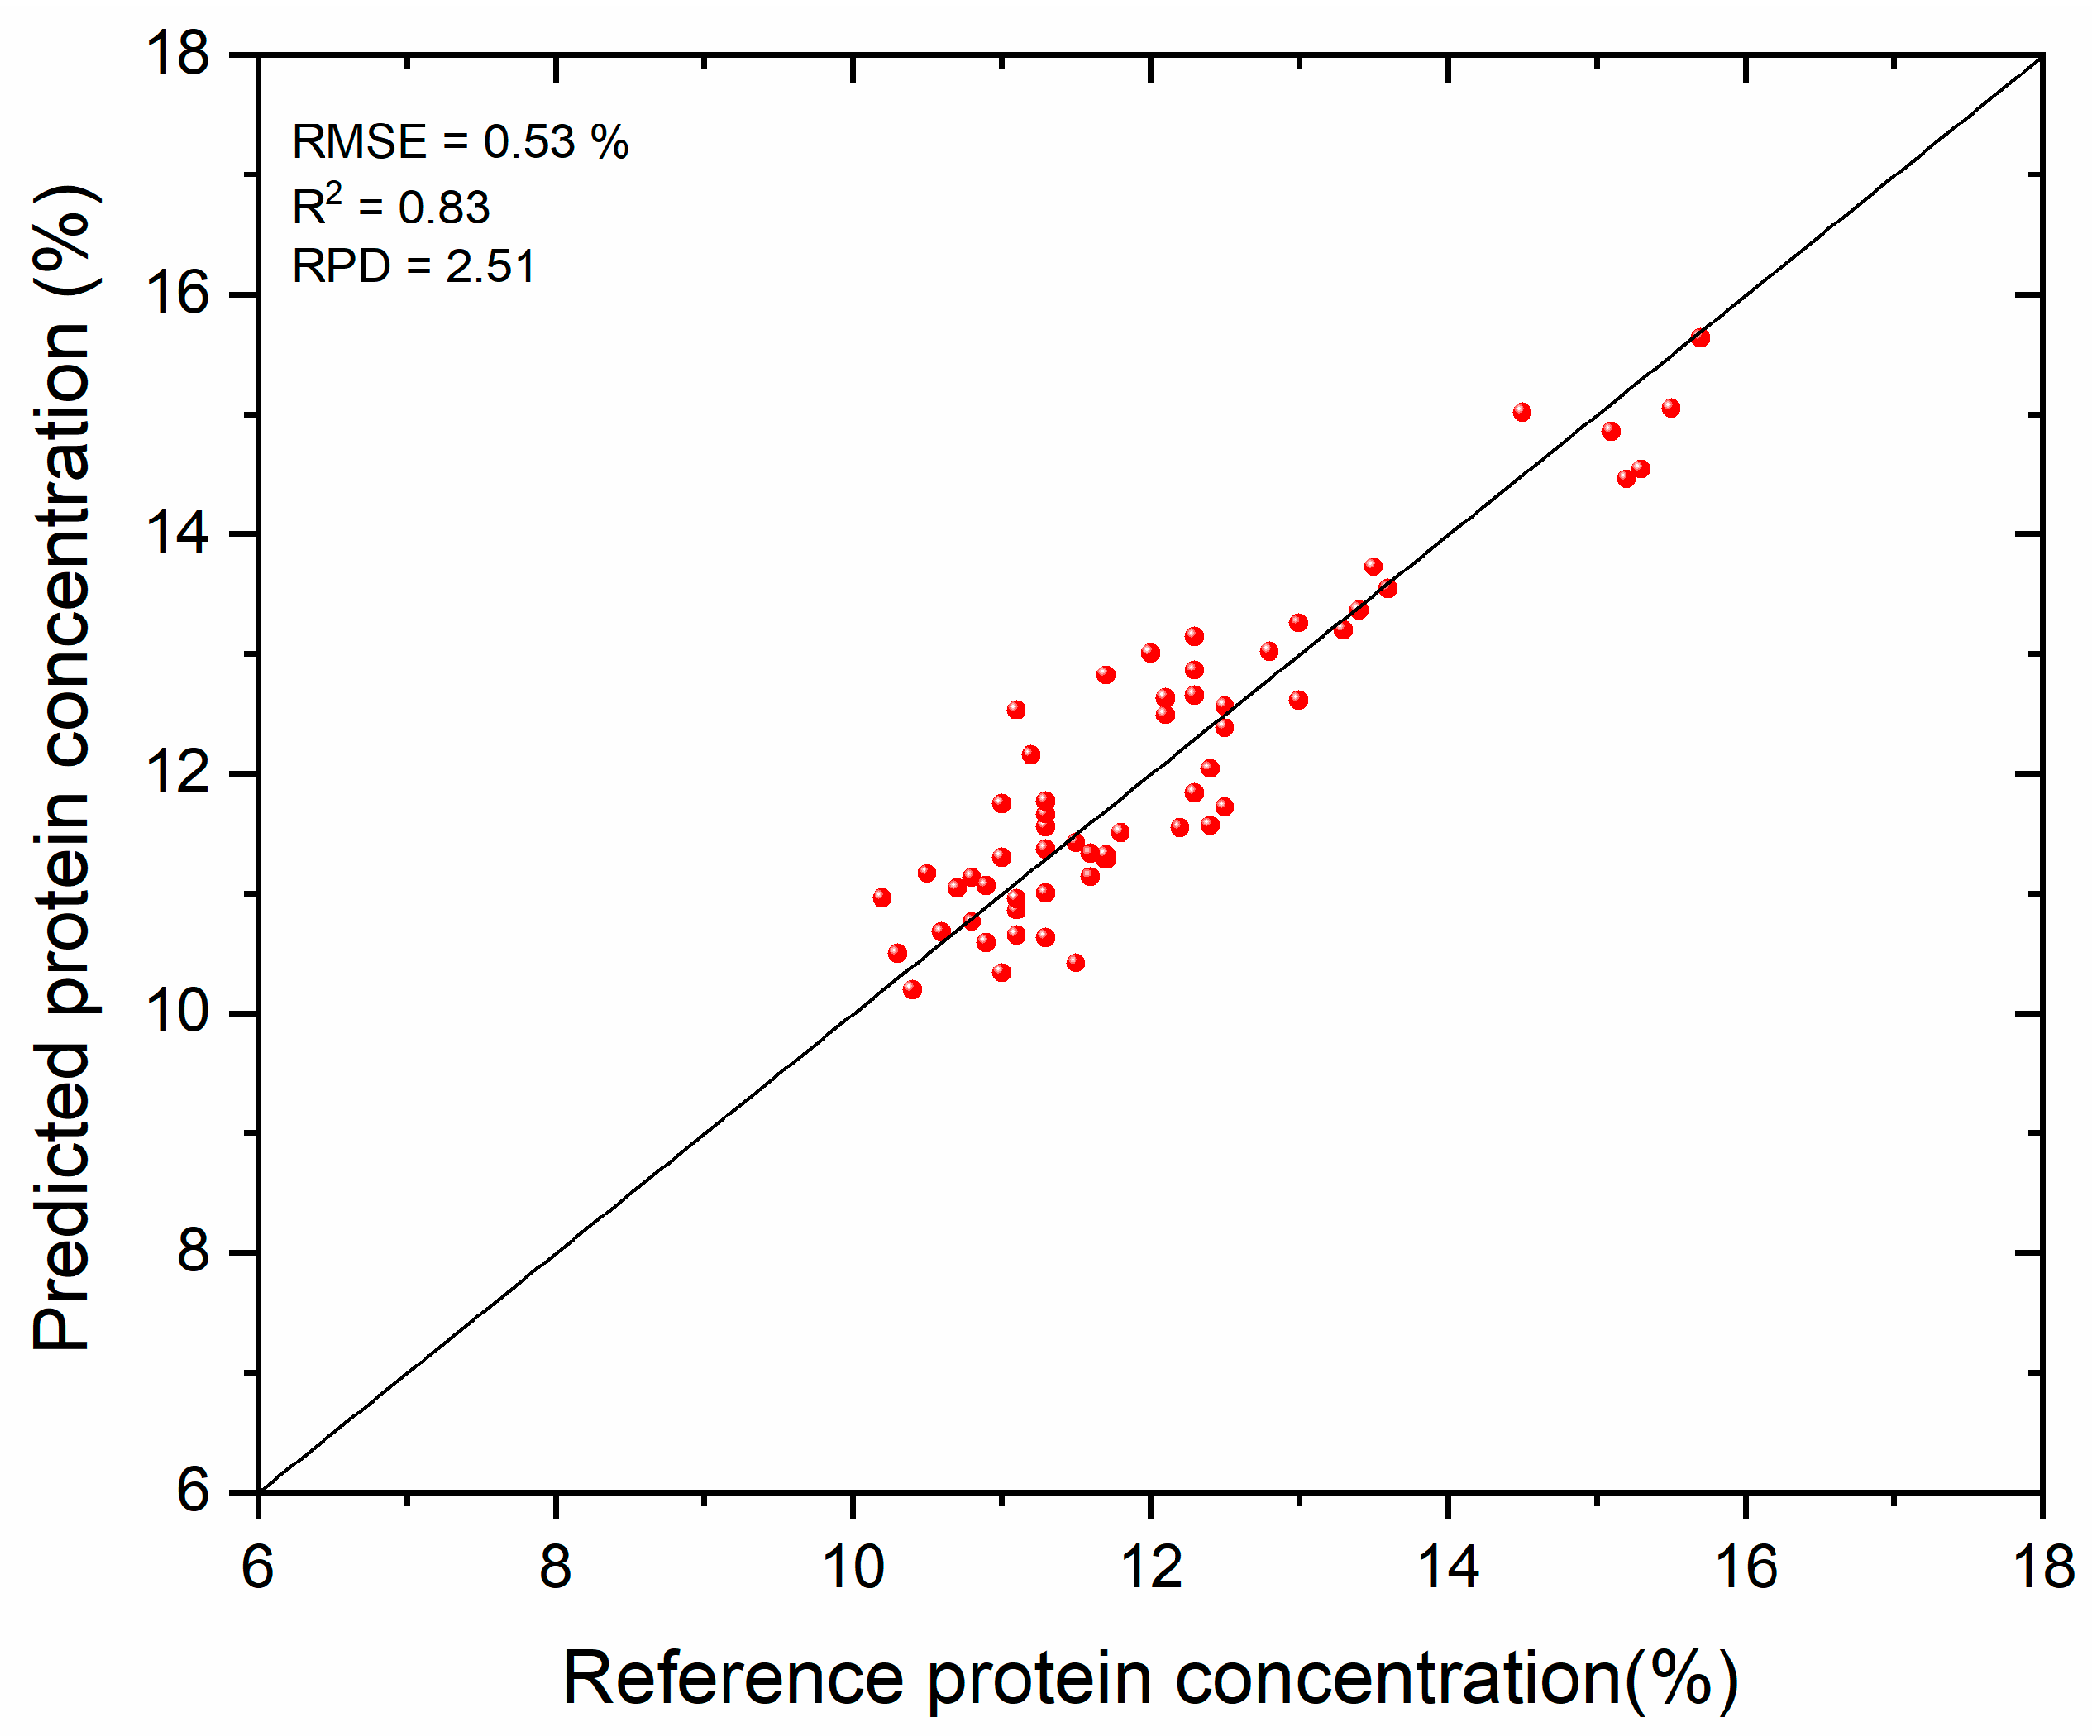
To evaluate the practical robustness and operational viability of the ELM-Modular calibration model, we performed predictions using alternative spectral averages derived from only 50 randomly selected spectra per sample, half the number used during model training. Given the inherent heterogeneity of the ground barley samples, these reduced spectral subsets provide a more stringent and realistic test of the model’s performance under suboptimal acquisition conditions. Remarkably, as shown in Figure 6, the model maintained strong predictive accuracy despite this challenging scenario, with an RMSE of 0.53%, an R 2 of 0.83, and an RPD of 2.51. These results underscore the model’s robustness and suggest its suitability for deployment in field or industrial settings where spectral acquisition may be constrained by time, resources, or operational variability. For comparison, PLS gives an RMSE of 0.80%, an R 2 of 0.64, and an RPD of 1.80.
A variable exclusion analysis was conducted using the same prediction set to evaluate the contribution of individual spectral elements to the performance of the protein prediction model. Table A3 of Appendix A presents the RMSE, R 2 , and RPD values obtained after removing one of the five elements used for protein content determination. Comparing these results with those from the full model reveals that omitting certain elements leads to a decline in predictive accuracy, underscoring their importance. Among the elements, iron, calcium, and manganese had the greatest impact on model performance, while potassium and sodium were less influential. These findings highlight the critical role of elemental information in enhancing the accuracy of LIBS-based chemometric models for protein estimation.
To further assess the robustness and reliability of the ELM calibration model for protein prediction, a Y-randomization test was conducted. In this validation procedure, the reference concentration values were randomly reassigned among the samples while maintaining the spectral data unchanged. The test was repeated 30 times, and the reported RMSE, R 2 , and RPD values represent the average performance across these iterations. As expected, the randomized models exhibited poor predictive ability, with a mean RMSE of 1.01, an R 2 of 0.40, and an RPD of 1.30. Given that RPD values below 1.5 are generally considered not suitable for analytical purposes, these results confirm that the original model’s performance was not driven by chance, but rather reflects genuine and consistent spectral–chemical relationships.

3.3. Mineral Nutrient Prediction Results

Macro- and micronutrient quantification was conducted using LIBS spectra acquired with the Modular spectrometer. Consistent with protein modeling results, the Modular spectrometer outperformed the Echelle due to its broader spatial sampling. Therefore, this section focuses on models developed from Modular spectra, with the exception of zinc (Zn) and phosphorus (P), which were analyzed using Echelle spectra due to detection limitations of the Modular instrument. As with protein, certain samples exhibited atypical behavior. Sample 43, which had the lowest measured concentrations of magnesium (Mg), calcium (Ca), and potassium (K), was a significant outlier and was excluded from macronutrient models to avoid bias. No anomalies were observed in the micronutrient dataset, and all samples were retained for analysis.
A preliminary univariate analysis was performed for each nutrient to evaluate the correlation between the intensity of individual emission lines and corresponding elemental concentrations. For each nutrient, the spectral line with the highest correlation was selected for simple linear regression. Results are summarized in Table 3.
Iron (Fe) yielded the best univariate performance, with R 2 = 0.93 , and an RPD exceeding 3, demonstrating a strong linear relationship between spectral intensity and concentration. However, for other elements such as Ca, Mg, Na, and K, the univariate performance was more modest ( R 2 between 0.42 and 0.80, RPD < 2), reflecting the influence of matrix effects and inter-element interactions. Zinc and phosphorus showed particularly weak correlations ( R 2 < 0.2, RPD ≈ 1.1), largely due to low emission line intensities, low concentrations in samples, and instrumental sensitivity constraints.
These findings confirm that univariate analysis is insufficient for reliable nutrient quantification from LIBS spectra, except for Fe. The complex, multi-elemental nature and heterogeneity of the forage matrix introduce spectral interferences and non-linear effects that necessitate a multivariate approach [49,53,71]. To address this, PLS and ELM models were developed for all nutrients. These models integrate multiple selected wavelengths per element to enhance predictive robustness. Fivefold cross-validation results presented in Table 4 show that ELM significantly outperformed PLS for most nutrients, achieving R 2   >   0.85 and an RPD > 2.29. ELM was particularly effective for elements like Fe, Ca, K, and Na, where non-linear relationships between spectral features and concentration are prominent. PLS provided reasonable results for Fe but was limited in capturing the non-linear spectral interactions prevalent in LIBS data.
For Zn and P, both models yielded suboptimal results ( R 2 < 0.65, RPD < 2), consistent with their low spectral signal strength and limited concentration range in the samples. Although ELM slightly improved performance over PLS, further enhancements in sampling strategy and instrument configuration are needed to improve the detection and quantification of these elements.
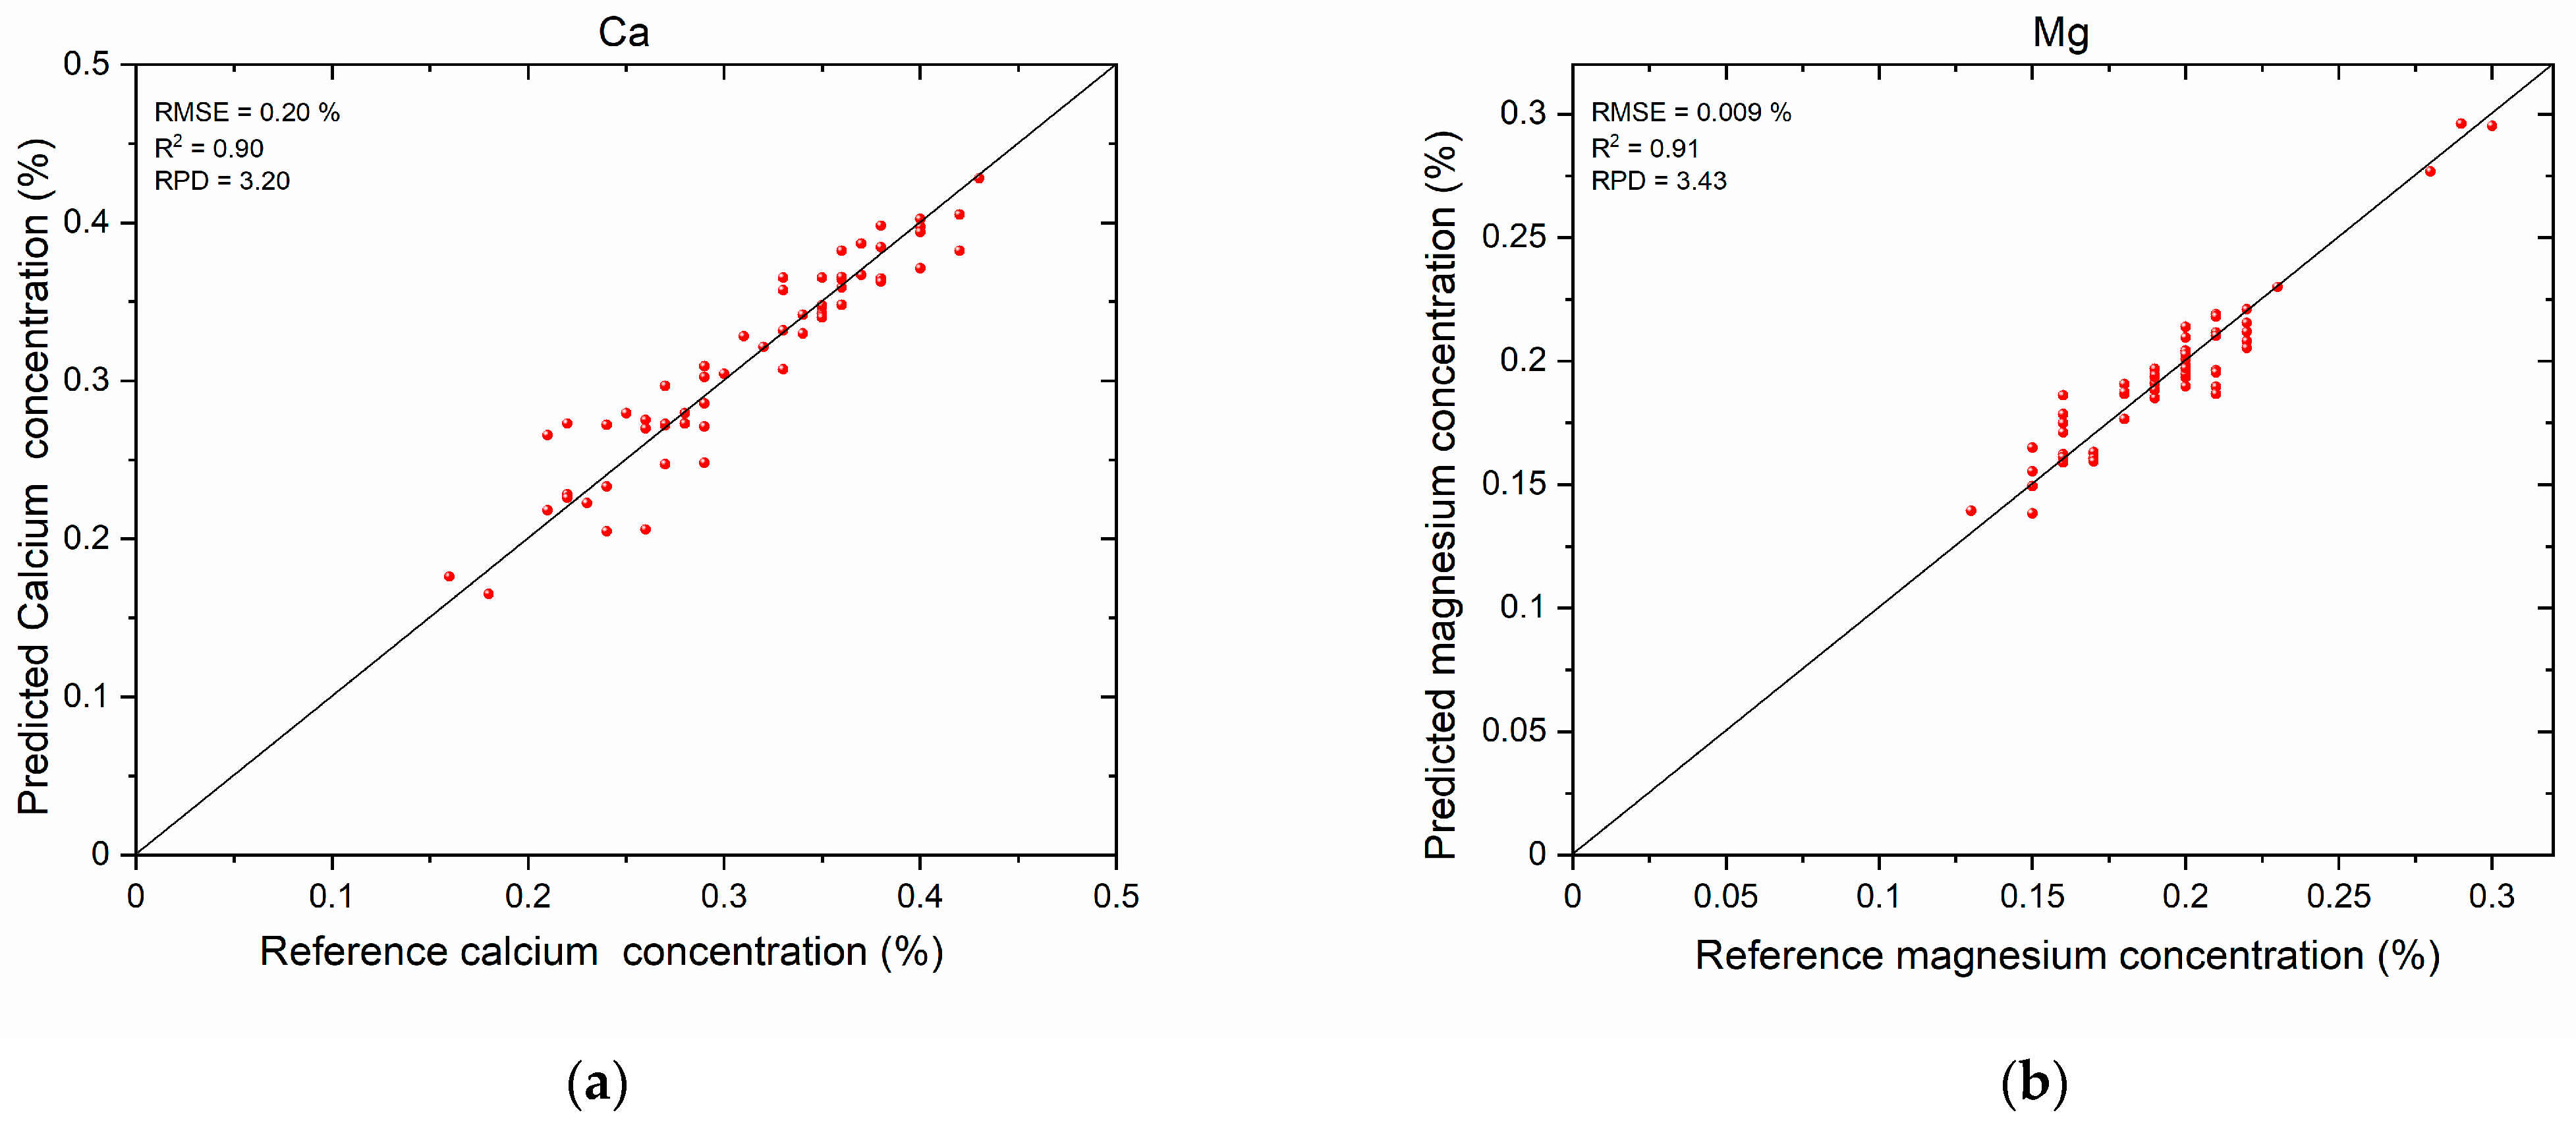
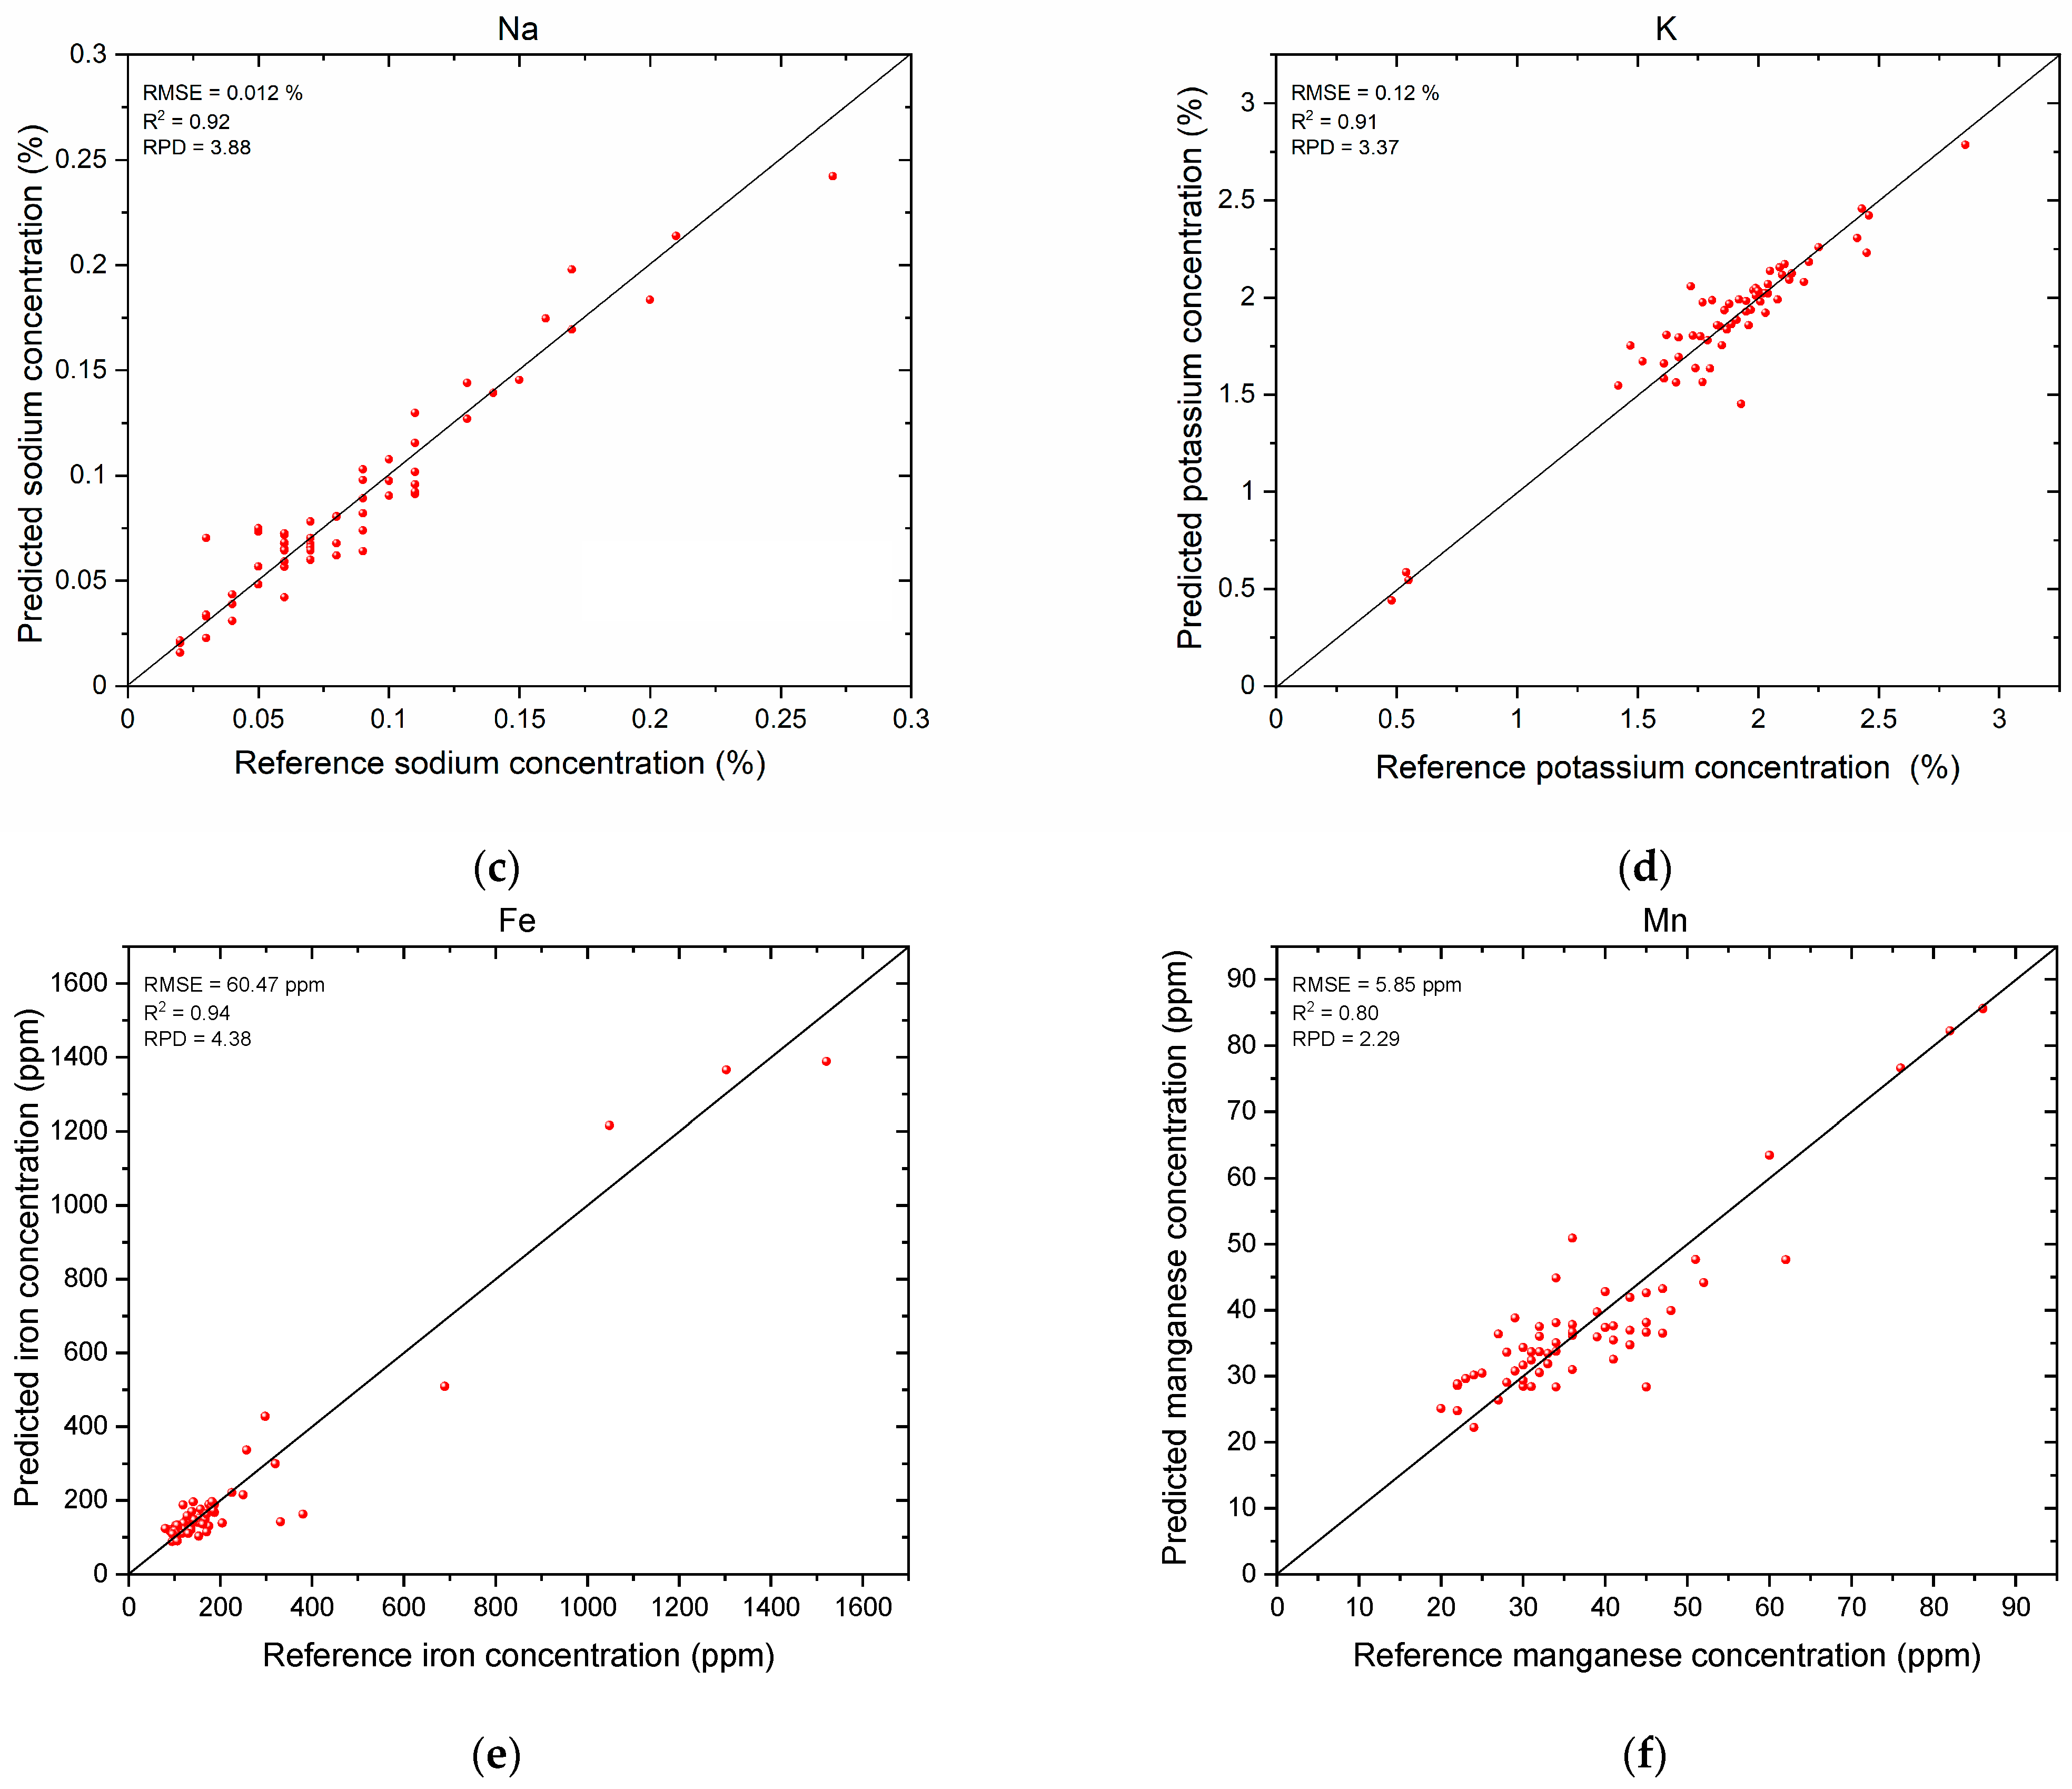
These results further demonstrate the robustness of the ELM models. To evaluate their generalization capability more thoroughly, nutrient concentrations were also predicted using averaged spectra, each computed from 50 randomly selected spectra per sample. Figure 7 presents the predicted versus measured concentrations for six key nutrients, Ca, Mg, Na, K, Fe, and Mn, using the optimized ELM models. The models consistently achieved good-to-excellent predictive performance across all elements, with R 2 ranging from 0.80 to 0.94 and RPD values between 2.29 and 4.38. Despite the good correlation observed between manganese content and its selected emission lines, the lower predictive performance obtained for Mn is likely due to its relatively low concentration and limited concentration range in the samples. This limited concentration range reduces the variability needed for the model to learn robust relationships, which may hinder accurate prediction. These findings confirm the ability of the multivariate ELM approach to effectively manage spectral variability and matrix complexity, reinforcing its suitability for accurate nutrient quantification in heterogeneous forage samples.
For nutrient prediction, the robustness of the ELM models was further examined using a Y-randomization approach. The procedure was repeated 30 times, and the average RMSE, R 2 , and RPD values are presented in Table 5. As anticipated, all models showed weak predictive performance, with R 2 values below 0.45 and RPDs consistently under 1.5, a threshold below which models are generally considered unreliable for quantitative analysis. These findings support the reliability of the original nutrient models and confirm that their predictive power arises from real spectral–chemical relationships rather than random correlations.

4. Discussion and Conclusions

This study demonstrates the strong potential of LIBS spectroscopy, when combined with advanced chemometric modeling, for accurate and non-destructive prediction of protein and mineral nutrient content in complex plant matrices such as barley forage. By shifting the focus from nitrogen to elemental markers biochemically associated with proteins, the reliability of protein prediction was significantly improved, especially when using Extreme Learning Machines (ELM) with the Modular spectrometer. Across all analyses, the ELM approach consistently outperformed Partial Least Squares (PLS), offering superior accuracy, robustness, and resilience to matrix effects inherent in heterogeneous plant samples.
To our knowledge, this study is the first to propose a direct quantitative LIBS-based approach for protein prediction in plant samples, without relying on nitrogen emission lines, which have been found to be unreliable under ambient conditions. Specifically, we focus on heterogeneous whole barley forage, a complex and representative matrix for forage analysis. Our main contribution lies in demonstrating that protein content, generally inaccessible by direct elemental detection, can be indirectly estimated using chemometric models (PLS and ELM) applied to the spectral signals of elements biochemically bound to proteins, such as calcium, manganese, potassium, sodium, and iron. This work demonstrates that LIBS, a rapid technique requiring little preparation, can provide valuable predictive information not only on elemental composition but also on broader nutritional quality indicators relevant to the agri-food sector.
Nonetheless, several limitations must be acknowledged. The fibrous and heterogeneous nature of forage introduces measurement variability due to the limited sampling volume of each laser pulse. In addition, atmospheric interference restricts the reliable use of nitrogen emission lines, precluding direct estimation of total protein via elemental nitrogen detection. While our dataset was sufficient to develop and validate robust regression models, using cross-validation, Y-randomization, and a quasi-independent test set, larger and more diverse sample sets will be essential to improve the generalizability and practical applicability of the proposed approach.
These findings open the door to the development of portable, rapid LIBS-based tools for analyzing barley and other forage crops in the field. LIBS is already a well-established technique in various industrial sectors, including metallurgy, mining, recycling, and environmental monitoring [72]. It is valued in these sectors for its speed, minimal sample preparation requirements, and ability to detect multiple elements. Continued development of portable and handheld LIBS systems demonstrates the technology’s maturity and suitability for use outside laboratory environments [73,74].
Further miniaturization, enhanced durability, and the integration of automated spectral interpretation algorithms could make such devices accessible to non-experts by providing real-time, actionable information on forage quality. To encourage widespread adoption, future efforts should prioritize developing user-friendly interfaces and embedding robust chemometric models that can translate complex spectral data into easily understandable metrics, such as nutrient concentrations or predicted feed value. This would eliminate the delays and logistical issues associated with centralized laboratory analysis.
This capability would support precision livestock feeding strategies by enabling feed rations to be adjusted according to the actual nutrient composition of crops at different growth stages or under varying environmental conditions. In the longer term, these applications could contribute to improved animal health and productivity, more cost-effective feed management, and increased sustainability in forage-based livestock systems.
Beyond immediate agricultural applications, this work aligns with broader goals of sustainability and climate resilience. Enhancing the nutritional quality of forage is a critical component of efficient and ecoresponsible livestock production. The LIBS-based approach presented here offers a promising path toward data-driven, resource-efficient practices in the agri-food sector, contributing to a more sustainable agricultural future.

Author Contributions

Conceptualization, J.S., A.A., M.S., and F.V. (François Vidal); methodology, M.S. and F.V. (François Vidal); software, J.S. and F.V. (François Vidal); validation, J.S.; formal analysis, J.S.; investigation, J.S. and A.A.; resources, F.V. (Francis Vanier), N.P., A.F., and A.H.; data curation, J.S. and F.V. (François Vidal); writing original draft preparation, J.S.; writing review and editing, J.S., A.A., F.V. (Francis Vanier), N.P., A.F., M.S., and F.V. (François Vidal); visualization, J.S.; supervision, M.S. and F.V. (François Vidal); project administration, M.S. and F.V. (François Vidal); funding acquisition, M.S. and F.V. (François Vidal). All authors have read and agreed to the published version of the manuscript.

Funding

This research was funded by the Sustainable Protein Production Program of the National Research Council Canada (Project Number: SPP-116-1).

Data Availability Statement

The original contributions presented in this study are included in this article. Further inquiries can be directed to the corresponding authors.

Acknowledgments

The authors would like to thank Gregory Penner and Katarzyna Burakowska of the University of Saskatchewan for providing the barley forage samples and their detailed composition used in this work.

Conflicts of Interest

The authors declare no conflicts of interest.

Abbreviations

The following abbreviations are used in this manuscript:
CovCovariance
ELMExtreme Learning Machine
LIBSLaser-induced breakdown spectroscopy
LTBLasertechnik Berlin
PLSPartial Least Squares
PCPrincipal Component
R 2 Coefficient of determination
RMSERoot Mean Square Error
RPDRatio of Performance to Deviation
SNVStandard Normal Variate
VarVariance

Appendix A

Table A1. Protein and nutrient content for the 61 barley forage samples.
SamplesProtein (%)Ca
(%)
Mg
(%)
K
(%)
P
(%)
Na
(%)
Fe
(ppm)
Mn
(ppm)
Zn
(ppm)
110.50.280.191.660.280.072043031
211.10.290.201.730.270.061363227
312.40.350.232.210.320.071543631
411.10.290.201.910.270.091063028
511.30.260.191.790.280.071242828
611.50.310.211.930.290.061533333
711.20.290.201.970.270.081253227
811.80.280.222.020.280.11953128
913.00.300.201.670.290.111702533
1012.50.290.201.720.280.131282231
1112.10.270.221.870.280.201292228
1211.70.350.202.100.380.151572732
1311.10.380.212.250.40.162573134
1415.20.350.212.410.260.101524525
1514.50.320.192.430.250.091414722
1615.50.330.202.450.250.111284523
1715.30.330.202.460.250.091754821
1819.30.230.151.610.180.051673413
1912.30.220.161.760.20.061864513
2012.30.210.161.770.20.051384114
2111.00.250.161.740.190.061753014
2210.30.220.171.420.230.062502416
2310.20.270.181.470.240.071872318
2411.70.370.201.980.220.101033417
2511.00.380.201.990.230.083803114
2611.50.400.222.110.240.111203617
2710.90.380.211.950.250.071193214
2812.30.400.222.040.250.111273917
2910.80.360.201.880.250.06912714
3012.20.400.212.090.240.101203417
3110.70.360.202.030.240.061092815
3211.70.400.211.990.240.081433216
3310.60.420.202.010.240.061203414
3412.50.360.201.860.230.08913015
3511.30.420.201.920.230.091623314
3612.00.380.192.130.240.093315227
3711.10.350.181.960.240.061704023
3812.30.360.192.030.240.071074124
3911.00.350.192.000.260.061174122
4012.30.360.212.190.250.061064024
4111.30.330.182.040.250.031013622
4212.40.350.212.140.250.071044323
4312.10.180.101.090.140.03802411
4410.40.240.161.620.220.052253631
4510.80.240.161.670.220.041873426
4611.30.260.161.850.240.041816224
4711.60.240.151.810.240.031825122
4815.70.330.222.860.280.171704725
4912.80.340.191.840.290.051363927
5011.30.270.161.770.30.211302021
5112.10.260.181.890.320.27962224
5213.40.160.171.520.30.111282920
5312.50.180.151.610.250.091193619
5413.00.210.161.830.280.031062918
5511.30.340.150.480.190.026896016
5611.60.290.130.540.20.022984316
5715.10.270.170.550.310.023204323
5813.60.430.32.080.20.1415218627
5913.50.350.282.050.20.1310487625
6013.30.370.291.950.20.1313038224
6110.90.220.171.80.250.041854523
Table A2. List of selected spectral variables (atomic or molecular species) used for each nutrient prediction.
NutrientSelected Spectral Variables
ProteinCa, Mn, K, Na, Fe
CaCa, Mn, Mg, K, Na, O, C, Fe
MgMg, Ca, Mn, K, Na, C2, Fe, C
KK, Ca, Mg, Si, H, C, Mn
NaNa, Mg, C, Mg, Ca I, C2
FeFe, Mn
MnMn, Fe
Table A3. Impact of Spectral Element Exclusion on Protein Prediction Performance.
Element ExcludedELMPLS
R M S E R 2 R P D R M S E R 2 R P D
(%)(%) (%)(%)
Ca0.930.451.361.10.31.14
K0.770.661.730.870.521.45
Na0.730.691.810.820.541.62
Fe0.990.431.341.110.321.1
Mn0.880.561.520.980.431.4

Appendix B

In this appendix, we present the Extreme Learning Machine Algorithm (ELM) mathematical formulation. The network structure (Figure 3) includes an input layer (with features selected based on Pearson correlation), a hidden layer, and an output layer with a single neuron representing the predicted concentration. The hidden layer output matrix H R K × N , where K is the number of hidden neurons and N is the number of samples, is computed using a non-linear activation function σ (sigmoid, in our case):
H = σ WX + b 1 N T
where W R K × M , with M the number of features in the spectra, is the randomly initialized input weight matrix. X R M × N is the input matrix, and b   R K × 1 is the bias vector of the hidden layer. The output vector Y R N × 1 is calculated as
Y = β H + c · 1 N T ,
where c R 1 × 1 is the bias of the output neuron. The output weight matrix β R 1 × K is computed by minimizing the least-squares error between Y and the reference concentration vector Y :
β = Y c · 1 N T H
where H R N × K is the Moore–Penrose pseudo-inverse of H [41,75].

References

  1. Carvalho, G.G.A.; Guerra, M.B.B.; Adame, A.; Nomura, C.S.; Oliveira, P.V.; Pereira de Carvalho, H.W.; Santos, D., Jr.; Nunes, L.C.; Krug, F.J. Recent advances in LIBS and XRF for the analysis of plants. J. Anal. At. Spectrom. 2018, 33, 919–944. [Google Scholar] [CrossRef]
  2. Albro, J.D.; Weber, D.W.; DelCurto, T. Comparison of whole, raw soybeans, extruded soybeans, or soybean meal and barley on digestive characteristics and performance of weaned beef steers consuming mature grass hay. J. Anim. Sci. 1993, 71, 26–32. [Google Scholar] [CrossRef]
  3. Nielsen, S.S. Food Analysis Laboratory Manual, 3rd ed.; Springer International Publishing: Cham, Switzerland, 2017. [Google Scholar] [CrossRef]
  4. Miralbés, C. Prediction of chemical composition and alveograph parameters on wheat by near-infrared transmittance spectroscopy. J. Agric. Food Chem. 2003, 51, 6335–6339. [Google Scholar] [CrossRef]
  5. Shao, Y.; Cen, Y.; He, Y.; Liu, F. Infrared spectroscopy and chemometrics for the starch and protein prediction in irradiated rice. Food Chem. 2011, 126, 1856–1861. [Google Scholar] [CrossRef]
  6. Petisco, C.; García-Criado, B.; Vázquez de Aldana, B.R.; Zabalgogeazcoa, I.; Mediavilla, S.; García-Ciudad, A. Use of near-infrared reflectance spectroscopy in predicting nitrogen, phosphorus and calcium contents in heterogeneous woody plant species. Anal. Bioanal. Chem. 2005, 382, 458–465. [Google Scholar] [CrossRef]
  7. Adams, M.J. Chemometrics in Analytical Spectroscopy, 2nd ed.; Royal Society of Chemistry: Cambridge, UK, 2004. [Google Scholar]
  8. Fortes, F.J.; Moros, J.; Lucena, P.; Cabalín, L.M.; Laserna, J.J. Laser-induced breakdown spectroscopy. Anal. Chem. 2013, 85, 640–669. [Google Scholar] [CrossRef]
  9. Zhang, Y.; Zhang, T.; Li, H. Application of laser-induced breakdown spectroscopy (LIBS) in environmental monitoring. Spectrochim. Acta Part B At. Spectrosc. 2021, 181, 106218. [Google Scholar] [CrossRef]
  10. Singh, V.K.; Sharma, N.; Verma, O.N.; Singh, V.K.; Tripathi, D.K.; Lee, Y.; Kumar, S.; Rai, P.K.; Gondal, M.A. Application of LIBS to elemental analysis and mapping of plant samples. At. Spectrosc. 2021, 42, 99–113. [Google Scholar] [CrossRef]
  11. Busser, B.; Moncayo, S.; Coll, J.-L.; Sancey, L.; Motto-Ros, V. Elemental imaging using laser-induced breakdown spectroscopy: A new and promising approach for biological and medical applications. Coord. Chem. Rev. 2018, 358, 70–79. [Google Scholar] [CrossRef]
  12. Ren, J.; Zhao, Y.; Yu, K. LIBS in agriculture: A review focusing on revealing nutritional and toxic elements in soil, water, and crops. Comput. Electron. Agric. 2022, 197, 106986. [Google Scholar] [CrossRef]
  13. Santos, D., Jr.; Nunes, L.C.; Carvalho, G.G.A.d.; Gomes, M.S.; Souza, P.F.d.; Leme, F.O.; dos Santos, L.G.C.; Krug, F.J. Laser-induced breakdown spectroscopy for analysis of plant materials: A review. Spectrochim. Acta Part B At. Spectrosc. 2012, 71–72, 3–13. [Google Scholar] [CrossRef]
  14. Sharma, N.; Singh, V.K.; Lee, Y.; Kumar, S.; Rai, P.K.; Pathak, A.K.; Singh, V.K. Analysis of mineral elements in medicinal plant samples using LIBS and ICP-OES. At. Spectrosc. 2020, 41, 234–241. [Google Scholar] [CrossRef]
  15. Shukla, P.; Kumar, R.; Rai, A.K. Detection of minerals in green leafy vegetables using laser induced breakdown spectroscopy. J. Appl. Spectrosc. 2016, 83, 872–877. [Google Scholar] [CrossRef]
  16. Trevizan, L.C.; Santos, D., Jr.; Samad, R.E.; Vieira, N.D., Jr.; Nunes, L.C.; Rufini, I.A.; Krug, F.J. Evaluation of laser induced breakdown spectroscopy for the determination of micronutrients in plant materials. Spectrochim. Acta Part B At. Spectrosc. 2009, 64, 369–377. [Google Scholar] [CrossRef]
  17. Peng, J.; Liu, F.; Shen, T.; Ye, L.; Kong, W.; Wang, W.; Liu, X.; He, Y. Comparative study of the detection of chromium content in rice leaves by 532 nm and 1064 nm laser-induced breakdown spectroscopy. Sensors 2018, 18, 621. [Google Scholar] [CrossRef]
  18. Galiová, M.; Kaiser, J.; Novotný, K.; Novotný, J.; Vaculovič, T.; Liška, M.; Malina, R.; Stejskal, K.; Adam, V.; Kizek, R. Investigation of heavy-metal accumulation in selected plant samples using laser induced breakdown spectroscopy and laser ablation inductively coupled plasma mass spectrometry. Appl. Phys. A 2008, 93, 917–922. [Google Scholar] [CrossRef]
  19. Wang, W.; Man, Z.; Li, X.; Zhao, Y.; Chen, R.; Pan, T.; Wang, L.; Dai, X.; Xiao, H.; Liu, F. Multi-phenotype response and cadmium detection of rice stem under toxic cadmium exposure. Sci. Total Environ. 2024, 917, 170585. [Google Scholar] [CrossRef]
  20. Pereira, F.M.V.; Milori, D.M.B.P.; Venâncio, A.L.; Russo, M.S.T.; Martins, P.K.; Freitas-Astúa, J. Evaluation of the effects of Candidatus Liberibacter asiaticus on inoculated citrus plants using laser-induced breakdown spectroscopy (LIBS) and chemometrics tools. Talanta 2010, 83, 351–356. [Google Scholar] [CrossRef]
  21. Keerthi, K.; Antony, M.M.; Matham, M.V. Single-shot LIBS: A rapid method for in situ and precise nutritional evaluation of hydroponic lettuce. Chem. Biol. Technol. Agric. 2024, 11, 138. [Google Scholar] [CrossRef]
  22. Ercioglu, E.; Velioglu, H.M.; Boyaci, I.H. Chemometric evaluation of discrimination of aromatic plants by using NIRS, LIBS. Food Anal. Methods 2018, 11, 1656–1667. [Google Scholar] [CrossRef]
  23. Pouzar, M.; Černohorský, T.; Průšová, M.; Prokopčáková, P.; Krejčová, A. LIBS analysis of crop plants. J. Anal. At. Spectrom. 2009, 24, 487–496. [Google Scholar] [CrossRef]
  24. Martin, M.Z.; Stewart, A.J.; Gwinn, K.D.; Waller, J.C. Laser-induced breakdown spectroscopy used to detect endophyte-mediated accumulation of metals by tall fescue. Appl. Opt. 2010, 49, C161–C167. [Google Scholar] [CrossRef]
  25. Zhang, J.; Wang, S.; Zhao, L.; Liu, L.; Wang, D. Feasibility of trace alcohol congener detection and identification using laser-induced breakdown spectroscopy. Chin. Phys. Lett. 2017, 34, 014208. [Google Scholar] [CrossRef]
  26. Kang, M.; Shin, W.; Choi, J.; Kim, K.; Rhee, H.; Do, H. Identification of hydrocarbon molecules using emission spectra of femtosecond laser-induced plasma. Opt. Express 2025, 33, 24969–24981. [Google Scholar] [CrossRef] [PubMed]
  27. Ding, J.; Zhang, T.; Li, H. Recent advances in laser-induced breakdown spectroscopy for explosive analysis. TrAC Trends Anal. Chem. 2023, 166, 117197. [Google Scholar] [CrossRef]
  28. Abdel-Salam, Z.A.; Abdel-Salam, S.A.M.; Abdel-Mageed, I.I.; Harith, M.A. Evaluation of proteins in sheep colostrum via laser-induced breakdown spectroscopy and multivariate analysis. J. Adv. Res. 2019, 15, 19–25. [Google Scholar] [CrossRef]
  29. Abdel-Salam, Z.A.; Abdel-Salam, S.A.M.; Harith, M.A. Application of laser spectrochemical analytical techniques to follow up spoilage of white meat in chicken. Food Anal. Methods 2017, 10, 1225–1232. [Google Scholar] [CrossRef]
  30. Abdel-Salam, Z.; Alexeree, S.M.I.; Harith, M.A. Utilizing biosynthesized nano-enhanced laser-induced breakdown spectroscopy for proteins estimation in canned tuna. Spectrochim. Acta Part B At. Spectrosc. 2018, 149, 112–117. [Google Scholar] [CrossRef]
  31. Abdel-Salam, Z.; Al Sharnoubi, J.; Harith, M.A. Qualitative evaluation of maternal milk and commercial infant formulas via LIBS. Talanta 2013, 115, 422–426. [Google Scholar] [CrossRef]
  32. Sezer, B.; Bjelak, A.; Velioglu, H.M.; Boyaci, I.H. Identification of meat species in processed meat products by using protein based laser induced breakdown spectroscopy assay. Food Chem. 2022, 372, 131245. [Google Scholar] [CrossRef]
  33. Wang, M.; Han, L.; Yang, Z.; Liu, X. Species discrimination of terrestrial processed animal proteins by laser-induced breakdown spectroscopy (LIBS) based on elemental characteristics. Biotechnol. Agron. Soc. Environ. 2019, 23, 137–146. [Google Scholar] [CrossRef]
  34. Pokrajac, D.; Lazarevic, A.; Melikechi, N. Automatic classification of laser-induced breakdown spectroscopy (LIBS) data of protein biomarker solutions. Appl. Spectrosc. 2014, 68, 999–1006. [Google Scholar] [CrossRef] [PubMed]
  35. Karunanithy, R.; Ratnasingam, S.; Holland, T.; Sivakumar, P. Sensitive detection of the Human Epididymis Protein-4 (HE4) ovarian cancer biomarker through a sandwich-type immunoassay method with laser-induced breakdown spectroscopy. Bioconjug. Chem. 2023, 34, 501–509. [Google Scholar] [CrossRef]
  36. Zhu, M.; Song, W.; Tang, X.; Kong, X. Detection of whey protein concentrate adulteration using laser-induced breakdown spectroscopy combined with machine learning. Food Addit. Contam. Part A 2025, 42, 570–579. [Google Scholar] [CrossRef]
  37. Zhang, D.; Xiao, S.; Shi, S.; Ma, H.; Nie, J.; Niu, X.; Zheng, W.; Guo, L. Precise qualitative analysis of foreign protein adulteration in milk powder by fully exploring the spectral information in laser-induced breakdown spectroscopy. J. Laser Appl. 2023, 35, 022027. [Google Scholar] [CrossRef]
  38. Huang, W.; Guo, L.; Kou, W.; Zhang, D.; Hu, Z.; Chen, F.; Chu, Y.; Cheng, W. Identification of adulterated milk powder based on convolutional neural network and laser-induced breakdown spectroscopy. Microchem. J. 2022, 176, 107190. [Google Scholar] [CrossRef]
  39. Sezer, B.; Bilge, G.; Boyaci, I.H. Laser-induced breakdown spectroscopy-based protein assay for cereal samples. J. Agric. Food Chem. 2016, 64, 9459–9463. [Google Scholar] [CrossRef]
  40. Zhang, T.-L.; Wu, S.; Tang, H.-S.; Wang, K.; Duan, Y.-X.; Li, H. Progress of chemometrics in laser-induced breakdown spectroscopy analysis. Chin. J. Anal. Chem. 2015, 43, 939–948. [Google Scholar] [CrossRef]
  41. Huang, G.-B.; Zhu, Q.-Y.; Siew, C.-K. Extreme learning machine: Theory and applications. Neurocomputing 2006, 70, 489–501. [Google Scholar] [CrossRef]
  42. Yao, S.; Lu, J.; Li, J.; Chen, K.; Li, J.; Dong, M. Multi-elemental analysis of fertilizer using laser-induced breakdown spectroscopy coupled with partial least squares regression. J. Anal. At. Spectrom. 2010, 25, 1733–1738. [Google Scholar] [CrossRef]
  43. Mishra, P.; Rai, A.K. Spectroscopic Evaluation of Contents Present in a Therapeutic Plant: Cannabis sativa. J. Opt. 2024; in press. [Google Scholar] [CrossRef]
  44. Sharma, N.; Kumar, S.; Lee, Y.; Singh, V.K.; Singh, V.K. Spectroscopic investigations of healthy and diseased ber (Ziziphus mauritiana) fruits using laser-induced breakdown spectroscopy in combination with partial least squares-discriminant analysis. Arab. J. Sci. Eng. 2022, 47, 7519–7529. [Google Scholar] [CrossRef]
  45. Awasthi, S.; Kumar, R.; Devanathan, A.; Acharya, R.; Rai, A.K. Multivariate methods for analysis of environmental reference materials using laser-induced breakdown spectroscopy. Anal. Chem. Res. 2017, 12, 10–16. [Google Scholar] [CrossRef]
  46. Khosravi, V.; Doulati Ardejani, F.; Yousefi, S.; Aryafar, A. Monitoring soil lead and zinc contents via combination of spectroscopy with extreme learning machine and other data mining methods. Geoderma 2018, 318, 29–41. [Google Scholar] [CrossRef]
  47. Ding, Y.; Wang, Y.; Chen, J.; Chen, W.; Hu, A.; Shu, Y.; Zhao, M. Substrate-assisted laser-induced breakdown spectroscopy combined with variable selection and extreme learning machine for quantitative determination of fenthion in soybean oil. Photonics 2024, 11, 129. [Google Scholar] [CrossRef]
  48. Liu, Y.; Pan, K.; Liu, Z.; Dai, Y.; Duan, X.; Wang, M.; Shen, Q. Simultaneous determination of four catechins in black tea via NIR spectroscopy and feature wavelength selection: A novel approach. Sensors 2024, 24, 3362. [Google Scholar] [CrossRef]
  49. Hahn, D.W.; Omenetto, N. Laser-induced breakdown spectroscopy (LIBS), Part I: Review of basic diagnostics and plasma—Particle interactions: Still-challenging issues within the analytical plasma community. Appl. Spectrosc. 2010, 64, 335A–366A. [Google Scholar] [CrossRef]
  50. Forage Laboratory. Available online: https://www.foragelab.com/Resources/Lab-Procedures (accessed on 30 April 2025).
  51. Beljkaš, B.; Matić, J.; Milovanović, I.; Jovanov, P.; Mišan, A.; Šarić, L. Rapid method for determination of protein content in cereals and oilseeds: Validation, measurement uncertainty and comparison with the Kjeldahl method. Accredit. Qual. Assur. 2010, 15, 555–561. [Google Scholar] [CrossRef]
  52. Nascimento, A.C.; Motta, C.; Rego, A.; Delgado, I.; Santiago, S.; Assunção, R.; Matos, A.S.; Santos, M.; Castanheira, I. Measuring Minerals in Pseudocereals Using Inductively Coupled Plasma Optical Emission Spectrometry: What Is the Optimal Digestion Method? Foods 2025, 14, 565. [Google Scholar] [CrossRef]
  53. Hahn, D.W.; Omenetto, N. Laser-induced breakdown spectroscopy (LIBS), Part II: Review of instrumental and methodological approaches to material analysis and applications to different fields. Appl. Spectrosc. 2012, 66, 347–419. [Google Scholar] [CrossRef]
  54. Brunnbauer, L.; Gajarska, Z.; Lohninger, H.; Limbeck, A. A critical review of recent trends in sample classification using laser-induced breakdown spectroscopy (LIBS). TrAC Trends Anal. Chem. 2023, 159, 116859. [Google Scholar] [CrossRef]
  55. Sun, L.; Yu, H. Automatic estimation of varying continuum background emission in laser-induced breakdown spectroscopy. Spectrochim. Acta Part B At. Spectrosc. 2009, 64, 278–287. [Google Scholar] [CrossRef]
  56. Castro, J.P.; Pereira-Filho, E.R. Twelve different types of data normalization for the proposition of classification, univariate and multivariate regression models for the direct analyses of alloys by laser-induced breakdown spectroscopy (LIBS). J. Anal. At. Spectrom. 2016, 31, 2005–2014. [Google Scholar] [CrossRef]
  57. Syvilay, D.; Wilkie-Chancellier, N.; Trichereau, B.; Texier, A.; Martinez, L.; Serfaty, S.; Detalle, V. Evaluation of the standard normal variate method for Laser-Induced Breakdown Spectroscopy data treatment applied to the discrimination of painting layers. Spectrochim. Acta Part B At. Spectrosc. 2015, 114, 38–45. [Google Scholar] [CrossRef]
  58. National Institute of Standards and Technology (NIST), Atomic Spectra Database (ASD), Lines Data. Available online: https://physics.nist.gov/PhysRefData/ASD/lines_form.html (accessed on 30 April 2025).
  59. Suchoňová, M.; Krištof, J.; Pribula, M.; Veis, M.; Tabarés, F.L.; Veis, P. Analysis of LiSn alloy at several depths using LIBS. Fusion Eng. Des. 2017, 117, 175–179. [Google Scholar] [CrossRef]
  60. Adler, J.; Parmryd, I. Quantifying colocalization by correlation: The Pearson correlation coefficient is superior to the Mander’s overlap coefficient. Cytom. Part A 2010, 77, 733–742. [Google Scholar] [CrossRef]
  61. Zhang, S.; He, M.; Yin, Z.; Zhu, E.; Hang, W.; Huang, B. Elemental fractionation and matrix effects in laser sampling-based spectrometry. J. Anal. At. Spectrom. 2016, 31, 358–382. [Google Scholar] [CrossRef]
  62. Wang, Z.; Feng, J.; Li, L.; Ni, W.; Li, Z. A multivariate model based on dominant factor for laser-induced breakdown spectroscopy measurements. J. Anal. At. Spectrom. 2011, 26, 2289–2299. [Google Scholar] [CrossRef]
  63. Huang, G.; Huang, G.-B.; Song, S.; You, K. Trends in extreme learning machines: A review. Neural Netw. 2015, 61, 32–48. [Google Scholar] [CrossRef]
  64. Tenenhaus, M.; Gauchi, J.-P.; Ménardo, C. Régression PLS et applications. Rev. Stat. Appl. 1995, 43, 7–63. [Google Scholar]
  65. Huang, G.-B.; Zhu, Q.-Y.; Siew, C.-K. Extreme learning machine: A new learning scheme of feedforward neural networks. In Proceedings of the 2004 IEEE International Joint Conference on Neural Networks, Budapest, Hungary, 25–29 July 2004; IEEE: Piscataway, NJ, USA, 2004; Volume 2, pp. 985–990. [Google Scholar] [CrossRef]
  66. El Haddad, J. Chimiométrie appliquée à la spectroscopie de plasma induit par laser (LIBS) et à la spectroscopie terahertz. Ph.D. Thesis, Université Bordeaux, Bordeaux, France, 2013. Available online: https://tel.archives-ouvertes.fr/tel-00959288 (accessed on 30 April 2025).
  67. Saeys, W.; Mouazen, A.M.; Ramon, H. Potential for onsite and online analysis of pig manure using visible and near infrared reflectance spectroscopy. Biosyst. Eng. 2005, 91, 393–402. [Google Scholar] [CrossRef]
  68. Permyakov, E.A. Metal Binding Proteins. Encyclopedia 2021, 1, 261–292. [Google Scholar] [CrossRef]
  69. Tripathi, D.K.; Singh, S.; Singh, S.; Mishra, S.; Chauhan, D.K.; Dubey, N.K. Micronutrients and their diverse role in agricultural crops: Advances and future prospective. Acta Physiol. Plant 2015, 37, 139. [Google Scholar] [CrossRef]
  70. Morris, V.S.; Richards, E.M.B.; Morris, R.; Dart, C.; Helassa, N. Structure-Function Diversity of Calcium-Binding Proteins (CaBPs): Key Roles in Cell Signalling and Disease. Cells 2024, 14, 152. [Google Scholar] [CrossRef] [PubMed]
  71. Braga, J.W.B.; Trevizan, L.C.; Nunes, L.C.; Rufini, I.A.; Santos, D., Jr.; Krug, F.J. Comparison of univariate and multivariate calibration for the determination of micronutrients in pellets of plant materials by laser-induced breakdown spectrometry. Spectrochim. Acta Part B At. Spectrosc. 2010, 65, 66–74. [Google Scholar] [CrossRef]
  72. Deguchi, Y.; Wang, Z. Industrial applications of laser-induced breakdown spectroscopy. In Plasma Science and Technology—Progress in Physical States and Chemical Reactions; Mieto, T., Ed.; IntechOpen: London, UK, 2016; Chapter 14. [Google Scholar] [CrossRef]
  73. Bouchard, P.; Sabsabi, M.; Blouin, A.; Padioleau, C. Hybrid Laser-Induced Breakdown Spectroscopy System. U.S. Patent 11,385,182, 12 July 2022. [Google Scholar]
  74. Bouchard, P.; Sabsabi, M.; Padioleau, C. High Resolution and High Throughput Spectrometer. U.S. Patent 11,385,101, 12 July 2022. [Google Scholar]
  75. Zhu, Q.-Y.; Qin, A.K.; Suganthan, P.N.; Huang, G.-B. Evolutionary extreme learning machine. Pattern Recognit. 2005, 38, 1759–1763. [Google Scholar] [CrossRef]
Figure 1. Example of a 4 cm diameter barley forage pressed pellet. The 100 circles superimposed on the picture represent the template used by the Modular system for the placement of laser shots.
Analytica 06 00029 g001
Figure 2. Schematic representation of the experimental LIBS setup.
Analytica 06 00029 g002
Figure 3. Architecture of the ELM model used in this work. The X k i   denotes the components of the input matrix for the sample i. The H k i   is activation of the neuron k of the hidden layer  .   W   denotes the weight matrix connecting the input layer and the hidden layer. The b j and c denote the biases of the hidden and output layers, respectively. The weight matrix β, connecting the hidden and output layer, is calculated analytically from the reference values  Y i .
Analytica 06 00029 g003
Figure 4. Average spectra of 61 barley forage samples taken with the Modular spectrometer: (a) Average spectra of 61 barley forage samples; (b) The same spectra after baseline correction. Some important lines are identified in (b).
Analytica 06 00029 g004
Figure 5. PCA projection of 3 sets of averaged spectra of 30 samples. Spectra from the same sample are identified by the same color. (a) Modular spectrometer; (b) Echelle spectrometer.
Analytica 06 00029 g005
Figure 6. Predicted vs. measured protein concentrations using the ELM-modular model for 50 randomly selected spectra for each sample.
Analytica 06 00029 g006
Figure 7. Predicted vs. measured nutrient concentrations ELM models for 50 randomly selected spectra for each sample: (a) Ca; (b) Mg; (c) Na; (d) K; (e) Fe; (f) Mn.
Analytica 06 00029 g007aAnalytica 06 00029 g007b
Table 1. Summary of the protein, macronutrient, and micronutrient contents of the 61 barley samples.
NutrientsMinMaxMean
Proteins (%)10.219.312.4
Macronutrients (%)
Ca0.160.430.31
P0.140.320.25
Mg0.130.290.21
K0.482.861.87
Na0.020.210.09
Micronutrients (ppm)
Fe801521180
Mn208635
Zn113423
Table 2. Cross-validation results for protein content for the PLS and ELM algorithms for both the Modular and Echelle spectrometers. The average metrics RMSE, R 2 , and RPD for the calibration and validation sets are displayed using indices C and V, respectively.
PLSELM
R M S E C R M S E V R C 2 R V 2 R P D C R P D V R M S E C R M S E V R C 2 R V 2 R P D C R P D V
(%)(%) (%)(%)
Echelle0.751.180.670.441.631.500.620.810.740.581.871.76
Modular0.431.060.820.532.511.620.500.560.840.742.802.01
Table 3. Summary of univariate linear regressions for nutrients.
ElementsWavelength (nm) R 2 R P D
Ca428.9360.531.47
Mg285.2120.421.18
K769.8960.641.68
Na819.4810.81.56
Fe II275.5730.933.46
Mn II257.6100.661.56
P213.6180.161.1
Zn213.8560.0041.07
Table 4. Summary statistics for calibration and validation using PLS and ELM models for nutrients.
MacronutrientsPLSELM
R M S E C R M S E V R C 2 R V 2 R P D C R P D V R M S E C R M S E V R C 2 R V 2 R P D C R P D V
(%)(%) (%)(%)
Ca0.020.0340.890.753.122.210.0170.0210.920.873.72.79
Mg0.0140.020.750.742.342.260.0080.0090.930.893.873.48
K0.110.190.890.853.142.940.090.10.940.884.383.44
P0.0250.0420.630.41.861.460.0220.0260.610.571.851.67
Na0.0140.0240.890.843.132.850.010.0120.930.924.684.64
Micronutrients(ppm)(ppm) (ppm)(ppm)
Fe53.9960.720.930.924.074.0539.2951.690.950.926.025.8
Mn6.3110.310.710.651.911.835.375.790.830.82.532.29
Zn4.265.340.490.361.421.33.693.510.630.591.671.66
Table 5. Predictive performance of ELM models trained with randomized concentration assignments for nutrient prediction (Y-randomization test).
MacronutrientsELM
R M S E R 2 R P D
(%)(%)
Ca0.050.411.32
Mg0.0250.431.34
K0.30.411.32
Na0.0420.231.15
Micronutrients(ppm)(ppm)
Fe236.70.181.12
Mn10.670.351.26
Disclaimer/Publisher’s Note: The statements, opinions and data contained in all publications are solely those of the individual author(s) and contributor(s) and not of MDPI and/or the editor(s). MDPI and/or the editor(s) disclaim responsibility for any injury to people or property resulting from any ideas, methods, instructions or products referred to in the content.