Article

Spatial Distribution and Radiological Risk Assessment of Natural Radionuclides in Soils from Zacatecas, Mexico

by
Daniel Hernández-Ramírez
*,
Carlos Ríos-Martínez
,
José Luis Pinedo-Vega
,
Fernando Mireles-García
,
Fernando De la Torre Aguilar
and
Edmundo Escareño-Juárez
Unidad Académica de Estudios Nucleares, Universidad Autónoma de Zacatecas “Francisco García Salinas”, Calle Ciprés No.10, La Peñuela, Zacatecas 98000, Mexico
*
Author to whom correspondence should be addressed.
Analytica 2025, 6(2), 20; https://doi.org/10.3390/analytica6020020
Submission received: 20 April 2025 / Revised: 22 May 2025 / Accepted: 23 May 2025 / Published: 25 May 2025
(This article belongs to the Section Spectroscopy)

Abstract

:
This study investigated the spatial distribution and radiological risks of naturally occurring radionuclides (226Ra, 232Th, 40K) in 37 soil samples from Zacatecas, located in north-central Mexico, using high-resolution gamma spectrometry. Results revealed 40K concentrations (mean: 736.81 Bq kg−1), nearly double the global average, while 226Ra (29.96 Bq kg−1) and 232Th (29.72 Bq kg−1) aligned with worldwide norms. Geoaccumulation indices identified moderate 40K accumulation at 22 sites, with El Capulín classified as moderately contaminated (Igeo = 1.07). Radiological risk indices showed absorbed dose rates (62.52 nGy h−1) and excess lifetime cancer risk (0.330 × 10⁻³) exceeding global thresholds by 4% and 14%, respectively. Multivariate analyses demonstrated strong Spearman correlations (ρ = 0.75–1.00) among risk indices, while spatial interpolation identified southern/western regions as high-risk zones. These findings emphasize the necessity of integrating spatial analysis with multivariate statistical techniques in environmental radioprotection frameworks. While most of the study area complies with international safety standards, the identified zones exceeding dose thresholds warrant prioritized management to mitigate potential cumulative health risks.

Graphical Abstract

1. Introduction

The ubiquitous presence of natural radioactivity in the terrestrial environment represents a continuous and inescapable feature of life on Earth. Naturally occurring radionuclides, particularly those from the uranium, thorium, and actinium decay series, along with radioactive potassium (40K), are distributed widely in the Earth’s crust, contributing significantly to background radiation exposure for all living organisms. These primordial radionuclides, with half-lives comparable to the age of the Earth, persist in various environmental matrices, including soil, rocks, water, air, food, and building materials, with soil being the most important terrestrial source of natural radiation exposure to human populations [1,2,3,4,5,6,7,8,9,10].
The determination of activity concentration of naturally occurring radionuclides in soil is of prime importance for several reasons. First, soil acts as the primary reservoir for radionuclides, playing a predominant role in environmental radioecology by serving as both sink and source for radioactive elements that can be transferred to other environmental compartments. Second, soil radioactivity data provide essential baseline information for distinguishing between natural background radiation and anthropogenic contamination, enabling the detection of possible environmental radioactive pollution. Third, understanding the distribution and concentration of these radionuclides is crucial for accurate assessment of radiation exposure to human populations, as approximately 84% of the annual radiation dose received by humans originates from natural sources [11], with terrestrial radionuclides being significant contributors [12,13,14,15,16,17]. Furthermore, the systematic measurement of soil radioactivity allows for the creation of comprehensive radiological maps that serve as valuable reference records for monitoring temporal changes in environmental radioactivity patterns [4,18,19,20].
Geoaccumulation indices represent vital tools for evaluating the extent of elemental enrichment or depletion in soil compared to natural background levels. These indices provide meaningful information about the geological and geochemical processes governing the distribution and mobility of radionuclides in the terrestrial environment [21]. The assessment of radiological risk indices derived from measured activity concentration constitutes an essential component of environmental radioprotection frameworks. These indices—including radium equivalent activity (Raeq), absorbed dose rate (D), annual effective dose equivalent (AEDE), internal and external hazard indices (Hex and Hin), and excess lifetime cancer risk (ELCR)—provide standardized metrics for evaluating potential health impacts associated with exposure to environmental radioactivity [22]. Radium equivalent activity serves as a widely used hazard index that represents the combined activity concentrations of 226Ra, 232Th, and 40K as a single quantity, providing a numerical indicator of external radiation dose to the public. The absorbed gamma dose rate in air and the resulting annual effective dose enable direct comparison with internationally recommended reference levels for radiation exposure. Internal and external hazard indices offer critical screening parameters for evaluating radiation exposure through different pathways, while the excess lifetime cancer risk assessment provides an estimate of the probability of developing cancer due to lifelong exposure to background radiation. Together, these indices facilitate a comprehensive evaluation of radiological safety and potential public health concerns in areas with varying levels of natural radioactivity [2,3,4,15,17,19,23,24].
In Mexico, particularly in the state of Zacatecas, systematic studies of natural radioactivity distribution in soils have been limited, creating a significant knowledge gap regarding local background radiation levels and potential radiological hazards. Zacatecas, with its diverse geological formations and extensive mining history, presents a unique environment for investigating the spatial distribution of natural radionuclides and associated radiological risks. The geological terrain of Zacatecas features various rock types and soil compositions that may influence the concentration and distribution of natural radionuclides, while anthropogenic activities, such as mining, agriculture, and industrial development, could potentially modify natural radioactivity patterns [6,7,14,25].
The present study aims to address this knowledge gap by undertaking a comprehensive assessment of activity concentrations of 226Ra, 232Th, and 40K in soils of Zacatecas using high-resolution gamma spectrometry. Beyond mere quantification of radionuclide concentrations, this research endeavors to determine geoaccumulation indices and evaluate various radiological risk parameters to provide a holistic understanding of the radiological status of the study area. The findings will contribute to the establishment of baseline data on natural radioactivity in Mexican soils, facilitate comparison with global reference values, and inform radiation protection strategies and environmental management decisions in the region.

2. Materials and Methods

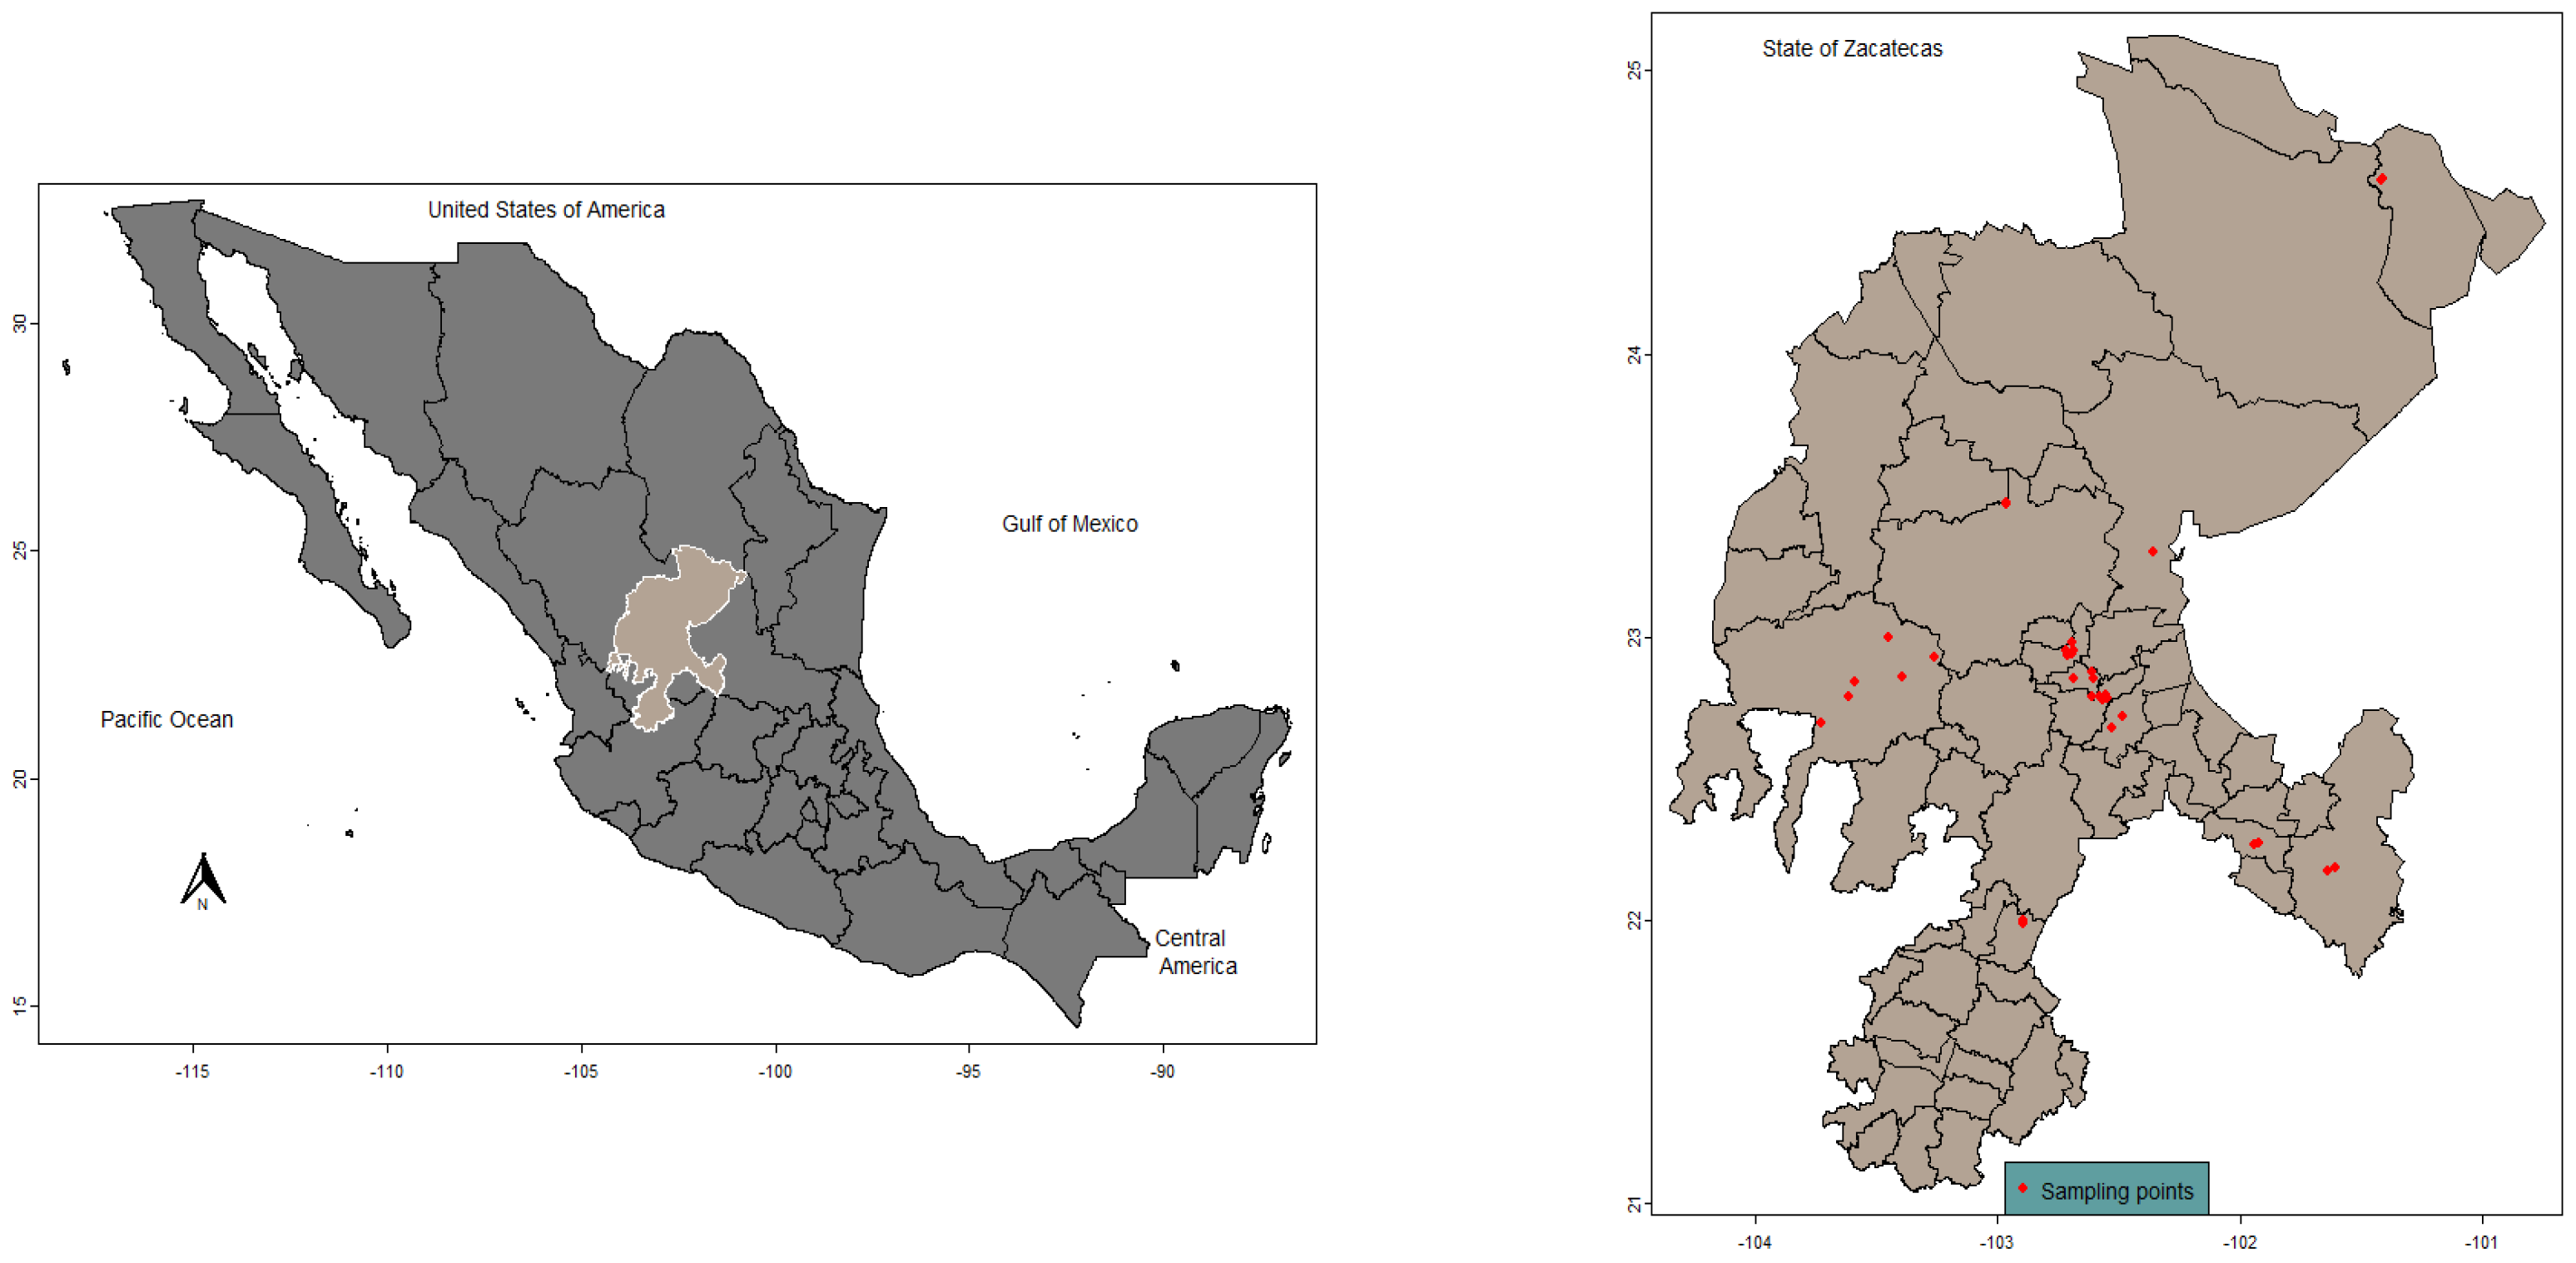
2.1. Description of Study Area

The state of Zacatecas, located in the north-central region of Mexico (see Figure 1), borders several neighboring states. To the north, it is bordered by the states of Coahuila and Durango. To the east, it shares borders with Coahuila, San Luis Potosí, and Nuevo León. To the south, it borders the states of Guanajuato, Jalisco, and Aguascalientes. Finally, to the west, it borders the states of Nayarit and Durango. Its extreme coordinates are 25°07′31″ north and 21°02′31″ south latitude, while longitudinally it extends from 100°44′32″ east to 104°21′13″ west. The total area of the state is 75,275.3 km2, representing 3.8% of the national territory, ranking it eighth in territorial extension in Mexico.
The state’s topography includes three main physiographic provinces: the Sierra Madre Occidental, the Sierra Madre Oriental, and the Mesa del Centro. Its elevation ranges from 1000 m above sea level in valleys, such as the Juchipila Canyon, to 3200 m in highlands, such as the Sierra El Astillero. The predominant climate is semiarid (73% of the territory), followed by temperate subhumid climates (17%) and very dry areas (6%), with an average annual temperature of 17 °C and annual precipitation around 510 mm, concentrated between June and September. Vegetation includes xerophilous scrub (31.5%), grasslands (9.3%), forests (8.5%), and jungle (0.6%), while the rest of the territory is used for agriculture or has been altered by human activities [26,27,28,29,30,31].

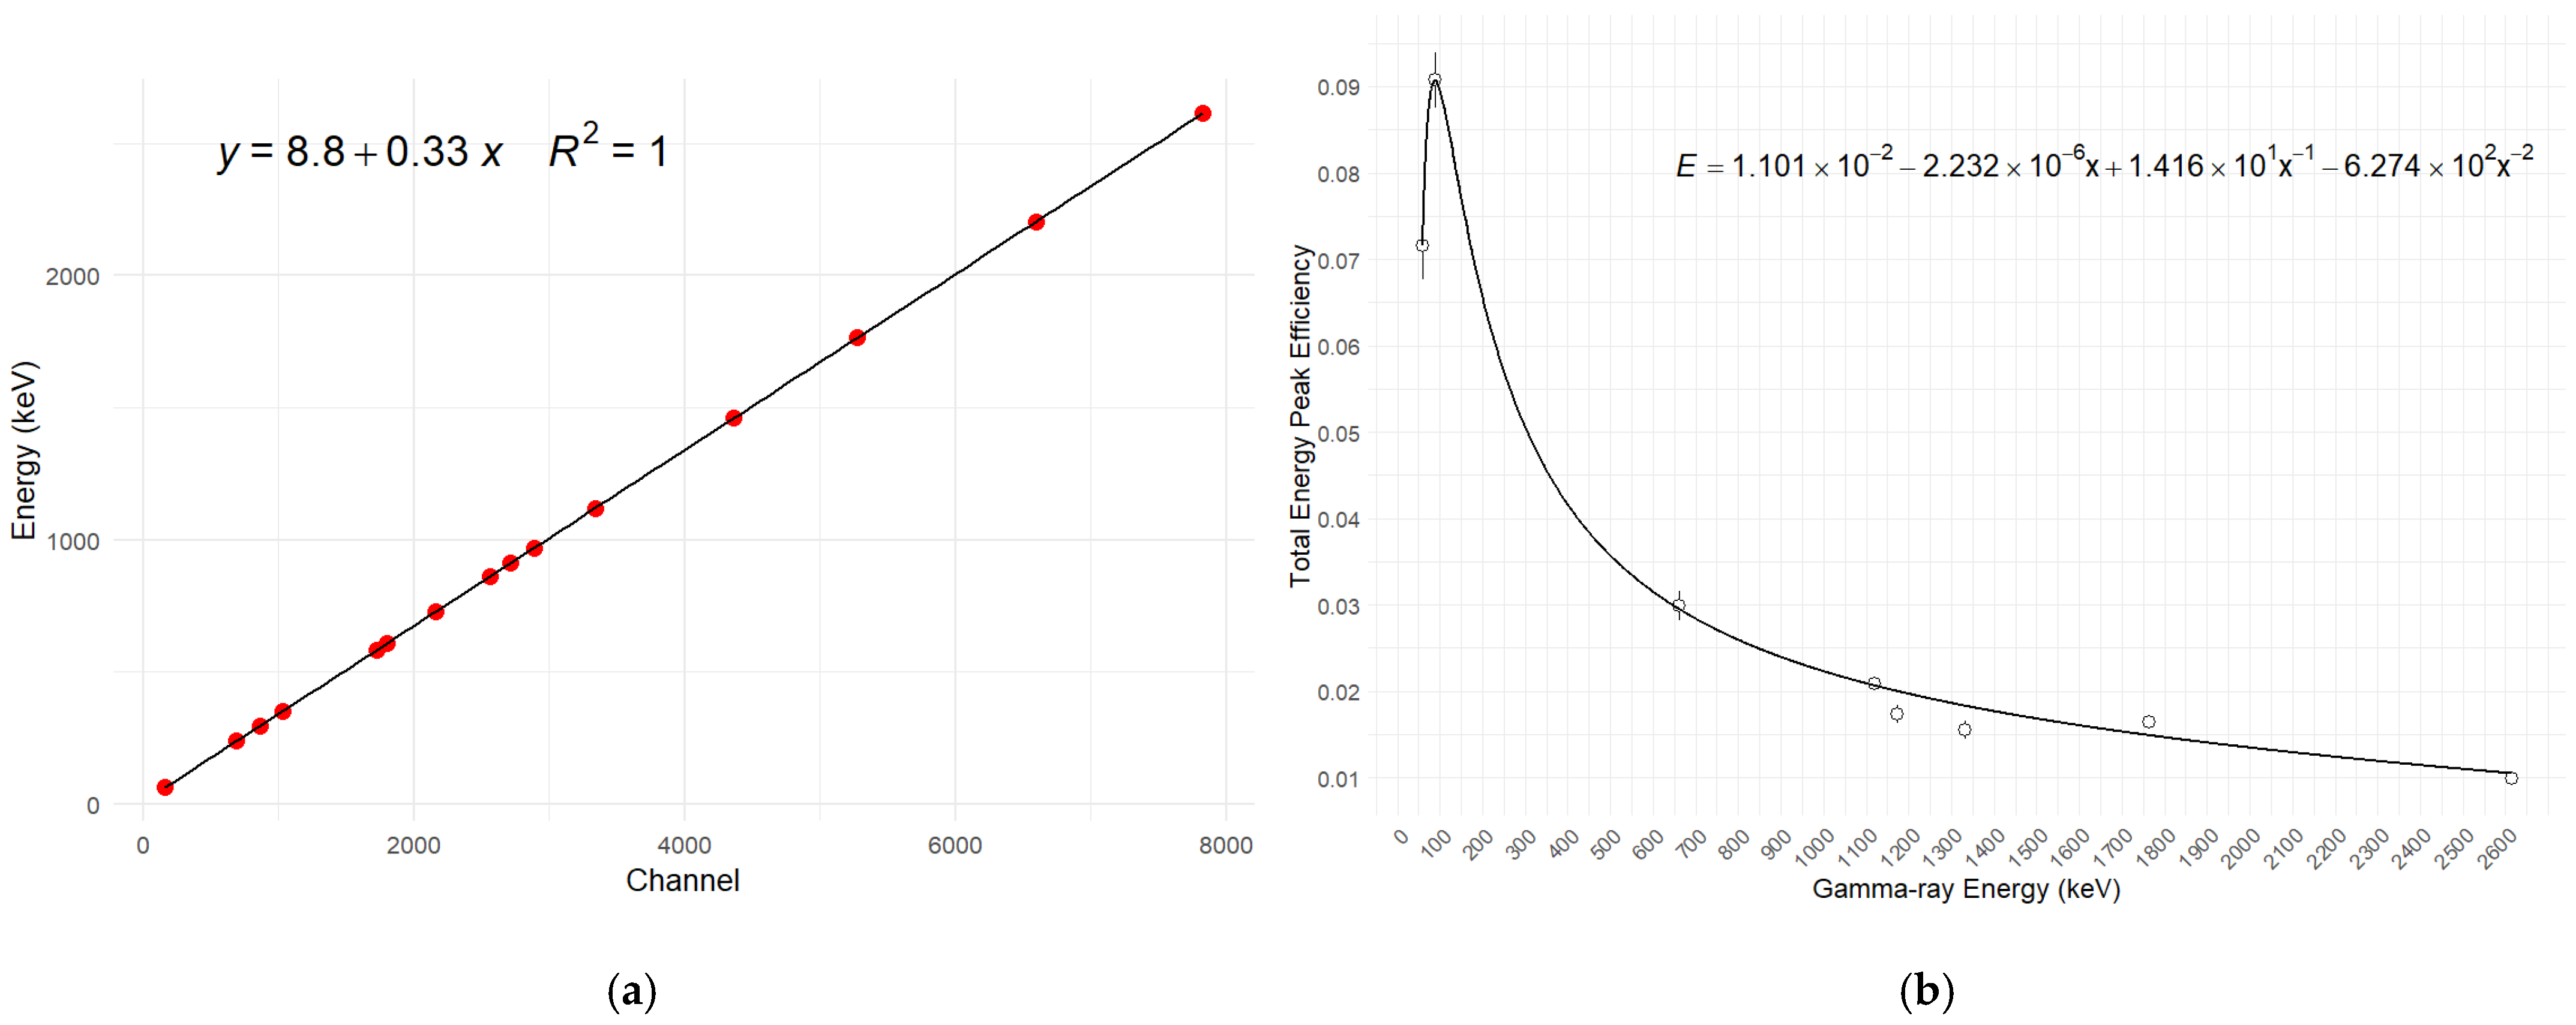
2.2. Sampling and Determination of Activity Concentration

Soil samples were collected from 37 strategically distributed points throughout the territory (Table 1). Site selection was conducted through convenience sampling, prioritizing accessibility and geographical representativeness, rather than a random method. Two complementary sampling strategies were implemented: a uniform surface sampling covering the first 15 cm of soil at most sites, and a stratified vertical sampling at selected locations, where samples were collected at specific depths of 0–5 cm, 5–10 cm, 10–15 cm, 15–20 cm, and 20–25 cm (in 14 points). Samples were uniquely labeled and transported to the laboratory to ensure full traceability and prevent cross-contamination. Upon arrival, each soil specimen was manually screened to remove stones and organic debris, isolating the fine earth fraction representative of in situ conditions [32]. The material was then passed through a 2 mm mesh in accordance with ISO 18589-1:2017 [33] to guarantee sample homogeneity and reproducibility. Finally, samples were oven dried at 70 °C for 24 h to produce a constant mass, eliminating moisture variability and allowing all activity measurements to be reported on a dry-weight basis. Subsequently, the processed samples were transferred to 500 mL Marinelli containers, which were hermetically sealed with vinyl tape to prevent 222Rn gas escape and identified through a specific labeling system. The activity of the uranium decay series was indirectly quantified through the analysis of post-222Rn radionuclides, accounting for the volatilization of 222Rn (a noble gas) during sample preparation and its extended half-life (3.825 days). To mitigate disequilibrium caused by 222Rn loss, the protocol incorporated a critical one-month post-sealing incubation period, allowing secular equilibrium to be re-established among short-lived progeny within the decay chain [34,35,36].
The samples were spectrometrically analyzed using a Canberra n-type hyperpure Germanium reverse electrode detector (GeRe 3522) with 35% relative efficiency and an energy resolution of 2.2 keV FWHM at the 1332.5 keV line of ⁶⁰Co. Measurements were conducted over 80,000 s using a low-background shielding system. Gamma spectra were recorded in 8000 channels and processed with Genie 2000 software [37], which was also used to calculate activity concentrations, evaluate measurement uncertainty and limit of detection (LID) following Currie’s method [38], and correct for true coincidence summing (TCS). This passive, non-destructive analytical technique enables qualitative characterization through the identification of gamma emitters based on their characteristic gamma-ray energies. Calibration standards consisted of a certified multinuclide source in a Marinelli beaker geometry, made by the Advanced Materials Research Center (CIMAV). A certified soil reference material (EML-613) provided by the U.S. Department of Energy Environmental Measurements Laboratory Quality Assessment Program (June 2001) was analyzed alongside our samples to verify the accuracy, traceability, and precision of the gamma spectrometry measurements [39]. The relationship between channel number and gamma-ray energy was fitted to a simple linear model [34,40], as shown in Figure 2a (Equation (1)).
E γ = a + b × C h a n n e l
The full-energy peak efficiency (ε) as a function of energy was described by a mixed rational model (Figure 2b, Equation (2)), where E γ is the energy of the gamma rays and A, B, C and D are fitted parameters.
ε E γ = A + B E γ + C E γ 1 + D E γ 2
Activity concentration ( A i ), defined as the radioactivity per unit mass of sample (Bq kg−1), was calculated using the calibrated efficiency values, accounting for measurement geometry and decay corrections. This formulation ensures metrological traceability by integrating spectral data with physics-based corrections, enabling reliable activity determination in complex environmental matrices [41].
The radiometric characterization of soils through gamma spectrometry enables the identification and quantification of all categories of gamma-emitting radionuclides present in the environment, including primordial radionuclides, those belonging to natural radioactive series, and those of anthropogenic origin [1,21]. However, this study focuses on determining those that contribute significantly to environmental radioactivity. These include radionuclides from the uranium and thorium series, whose parent isotopes are primordial, as well as the primordial 40K. Under the assumption of secular radioactive equilibrium, all descendants within each series are considered to exhibit the activity concentration of their respective parent isotopes. For the uranium series, activity is represented by 226Ra, while the thorium series uses 232Th as the reference [6].
The quantification of the uranium series was performed through gamma emissions from 226Ra (186.211 keV), 214Bi (609.321 keV and 1238.122 keV), 214Pb (351.93 keV), and 234mPa (1001.03 keV). A specific procedure was implemented to resolve spectral interferences in the 226Ra peak, particularly with transitions from 235U and 232Th. The thorium series was analyzed using emissions from 208Tl (583.187 keV), 228Ac (911.204 keV), 212Bi (727.330 keV), and 212Pb (238.632 keV). For each series, the representative activity was calculated as the arithmetic mean of descendant activities whose peak counts exceeded the critical limit (CL) to ensure statistical reliability [6,34].
40K was directly quantified through its characteristic 1460.82 keV emission, leveraging the absence of significant spectral interferences in this energy range. Minor contributors, such as radionuclides from the actinium series, cosmogenic isotopes and anthropogenic species (e.g., 137Cs), were omitted because the study focused on dosimetric aspects [34] and their inclusion was not necessary for determining these parameters. Reported activities refer to the dry weight of the sample (Bq kg−1, d.w.)

2.3. Geoaccumulation Index

The geoaccumulation index (Igeo) was applied to quantify the accumulation levels of radionuclides 226Ra, 232Th, and 40K in environmental samples. This index, originally proposed by Muller [42,43], serves as an effective tool for measuring the degree of contamination in soils and has been widely adopted in environmental radiological assessments [4]. For the calculation of Igeo, the activity concentration of radionuclides measured by gamma spectrometry was used directly in the following equation [4]:
I g e o = l o g 2 C i 1.5 B i
where C i represents the measured activity concentration of the radionuclide (Bq kg−1) in the sample and B i represents the reference background activity concentration (Bq kg−1) [42]. The factor 1.5 was incorporated to account for potential fluctuations in background levels due to environmental variables and anthropogenic influences. The population-weighted average values from UNSCEAR 2000 [44] were used as reference background values: 32 Bq kg−1 for 226Ra, 45 Bq kg−1 for 232Th, and 420 Bq kg−1 for 40K [44]. This approach was chosen since these values represent global averages of natural background radiation levels and provide a standardized reference point for evaluating the degree of radionuclide accumulation. The calculated Igeo values were interpreted according to Muller’s classification system: Igeo < 0 (practically uncontaminated), 0 ≤ Igeo < 1 (uncontaminated to moderately contaminated), 1 ≤ Igeo < 2 (moderately contaminated), 2 ≤ Igeo < 3 (moderately to heavily contaminated), 3 ≤ Igeo < 4 (heavily contaminated), 4 ≤ Igeo < 5 (heavily to extremely contaminated), and Igeo > 5 (extremely contaminated) [42]. This classification system provided a standardized framework for interpreting the severity of radionuclide accumulation across the study area and facilitated comparisons between different sampling locations. The logarithmic scale (base 2) was employed to normalize the distribution of values and enhance the comparative assessment of different radionuclides. When a sample reaches high Igeo levels (for example, Igeo ≥ 3), this indicates that the radionuclide concentration in question exceeds its natural baseline exponentially. Because the index uses a base-2 logarithm, each one-unit increase in Igeo corresponds to a doubling of accumulation relative to the background value; thus, an Igeo = 4 represents an approximate enrichment of 24 = 16 times the natural level. Therefore, the upper categories (“heavily to extremely contaminated” and “extremely contaminated”) do not merely reflect a linear excess of activity, but rather a multiplicative increase that highlights very intense contamination hotspots. This logarithmic approach makes it possible to clearly distinguish between small and large increases in contaminant load, facilitating the identification of areas where more urgent mitigation measures are required. The Igeo values for 226Ra, 232Th, and 40K were calculated individually to evaluate their respective contributions to the overall radiological status of the study area [42,45].

2.4. Radiological Risk Assessment

Radiological risk indices are tools for simplified assessment of the potential radiological impact of natural radionuclides present in soils. These indices have the advantage of synthesizing in a single numerical value the combined contribution of different gamma emitters, which facilitates the interpretation and comparison of exposure levels. The radiological indices are calculated from the activity concentration (Bq kg−1) of primordial radionuclides 238U (or 226Ra), 232Th and 40K through formulas that weigh their relative contribution. The main advantage of these indices is that they allow rapid assessments of radiological risk through comparison with internationally accepted reference values. By condensing all this information into single values, these indices facilitate decision making on radiation protection measures and the establishment of reference levels [3,4,5,6,7,11,15,19,22,23,24,45,46,47,48].

2.4.1. The Radium Equivalent Activity (Raeq)

The radium equivalent activity (Raeq) is a radiological index that has been used for decades to evaluate the radiological hazard of radioactivity in environmental materials. From a physical standpoint, Raeq represents the activity of a radionuclide that would produce the same effect as 1 mg of 226Ra B q   k g 1 . Its importance lies in the fact that, instead of establishing individual limits for each radionuclide present in a material, it allows establishing a single regulatory limit that considers the combined contribution of all radionuclides present, thus simplifying the radiological safety assessment. The calculation of Raeq is performed using a specific formula that considers the activity concentration of the main natural radionuclides. Thus, Raeq was defined as follows [2,3,4,5,16,48,49]:
R a e q = A R a 370 + A T h 259 + A K 4810 × 370

2.4.2. Absorbed Dose Rate (D)

The absorbed dose rate represents the rate at which ionizing radiation energy is absorbed per unit mass in a material or tissue at one meter above the ground n G y h 1 . In the case of terrestrial gamma radiation, the absorbed dose rate in air can be calculated using empirical formulas that relate the concentrations of natural radionuclides in soil [3,4]. For example, UNSCEAR proposes the following formula in its 2000 report [44]:
D = 0.0417 A K + 0.462 A U + 0.604 A T h
It is important to note that the absorbed dose rate is a physical quantity that does not take into account the biological effects of radiation. To evaluate the biological impact, appropriate weighting factors must be applied and the absorbed dose must be converted to equivalent dose.

2.4.3. Annual Effective Dose Equivalent (AEDE)

The annual effective dose is a measure that quantifies the biological impact of ionizing radiation on the human body over a one-year period. This parameter is calculated from the absorbed dose rate in air, applying specific conversion factors that take into account both exposure and the biological impact of radiation. To calculate the annual effective dose equivalent μ S v   y 1 , the following formula is used that incorporates several elements: the absorbed dose rate in air (D) measured in nGy h−1, the total annual exposure time (8760 h y−1), a conversion coefficient from Gray to Sievert (0.7 Sv Gy−1), and an outdoor occupancy factor (0.2). This latter factor accounts for the transient nature of exposure for individuals, who are assumed to spend approximately 20% of their time outdoors. The annual effective dose is calculated using the following relationship [2,3,4,16]:
A E D E = D × 8760 × 0.7 × 0.2 × 1 0 3
The conversion coefficient of 0.7 Sv Gy−1 is a value for adults used in various studies according to UNSCEAR [50], although there are different values for adults (0.72), children (0.80), and infants (0.93). This coefficient is fundamental for transforming the physical absorbed dose into a measure of effective biological impact.

2.4.4. Radiological Risk Indices (Hex and Hin)

The radiological risk indices (Hex and Hin) are parameters used to evaluate potential hazards from gamma radiation originating from natural radioactive materials. The external hazard index (Hex) specifically evaluates the excess gamma radiation emanating from samples and is widely used to determine if a material is safe for use, especially in building construction. It is calculated using the following expression [2,3,4,5]:
H e x = A U 370 + A T h 259 + A K 4810
For the material to be considered safe, the Hex value must be less than unity.
The internal hazard index (Hin) quantifies the hazardous impact of short-lived radioactive products and specifically evaluates internal exposure to radon and its decay products in respiratory organs. It is calculated using the following expression [2,4,5]:
H i n = A U 185 + A T h 259 + A K 4810
As with Hex, for a material to be considered safe for use in construction and have insignificant internal radiation risk, the calculated Hin value must be less than unity. These indices are important tools for evaluating the radiological safety of materials, especially those intended for building construction or that will be in close contact with people.

2.4.5. Excess Lifetime Cancer Risk (ELCR)

The excess lifetime cancer risk (ELCR) represents the increased probability of developing cancer above background levels due to exposure to contaminants. The ELCR is calculated using the following expression [2,3,4]:
E L C R = A E D × L E × R F
where AED represents the annual effective dose equivalent, LE is life expectancy (75.5 years for México according to INEGI data for 2024 [51]), and RF is the fatal cancer risk factor per Sievert. The RF value established by the International Commission on Radiological Protection (ICRP) in its publication 103 [52] is 0.057 per Sievert for stochastic effects in the general population. It should be emphasized that the ELCR values are model-based estimates and not exhaustive predictions of actual cancer outcomes. The calculation relies on several simplifying assumptions—such as linear risk extrapolation and average life expectancy—and does not capture the full complexity of stochastic effects, especially in environments (e.g., mining areas) with highly variable radionuclide distributions. Therefore, while ELCR is a useful comparative metric, these risk estimates should be interpreted with caution and not used in isolation to drive alarmist conclusions.
In Equations (4)–(9), A R a represents the activity concentration of 226Ra (or activity concentration of 238U), A T h the activity concentration of 232Th, and A K   the activity concentration of 40K, all expressed in Bq kg−1. Threshold values for the radiological indices were set at 370 Bq kg−1 for Raeq, 59 nGy h−1 for D, 460 µSv y−1 for AEDE, 1 for Hex, 1 for Hin, and 0.29 for ELCR × 103.

2.5. Statistical Methods

Statistical analyses and visualizations were performed using R version 4.4.2 [53]. Descriptive statistics, including measures of central tendency (mean, median), dispersion (standard deviation, variance, range), and distribution characteristics (skewness, kurtosis) were calculated, additionally, the normality of the distributions was evaluated using the Shapiro–Wilk test for all variables and displayed in histograms to visualize their frequency distributions compared against reference values from UNSCEAR and other regulatory bodies. All these statistical analyses were performed using specialized functions of the R language through the “moments” package [54]. Spearman’s rank correlation coefficients were computed between geoaccumulation indices and radiological risk parameters (Raeq, absorbed dose rate, annual effective dose, external and internal hazard indices, excess lifetime cancer risk) to determine non-parametric associations that remain robust against outliers and non-normal distributions, using the “corrplot” package [55]. This correlation approach was specifically chosen over Pearson correlation to account for potential non-linear relationships between variables while avoiding the automatic correlations that would appear if the activity concentrations were included in the analysis alongside the derived indices [56].
Advanced multivariate techniques were implemented to elucidate complex patterns in the dataset. K-means clustering analysis was performed in two separate analyses—one grouping measurement sites (observations) based on similar radiological profiles [43,57,58], and another clustering variables (indices) according to their inter-relationships with the “cluster” [59] and dendextend [60] packages. Principal component analysis (PCA) was conducted to reduce dimensionality while preserving maximum variance [43,58,61,62,63], using the “FactoMineR” [63] and “factoextra” [64] packages. The spatial dimensions of the data were analyzed through georeferenced clustering displayed on geographical maps and through ordinary kriging interpolation to generate continuous prediction surfaces of radiological parameters across the study area using the gstat package [65,66] and the terra package [4,19,22,43,58,67,68,69,70,71]. Throughout the analysis, special attention was given to identifying three types of outliers: univariate outliers (detected through Z-scores), multivariate outliers (identified using Mahalanobis distance and leverage values), and spatial outliers (located through local indicators of spatial association and Moran’s I statistic) these using the “MASS” [72] and “spdep” [73,74,75,76] packages.

3. Results and Discussion

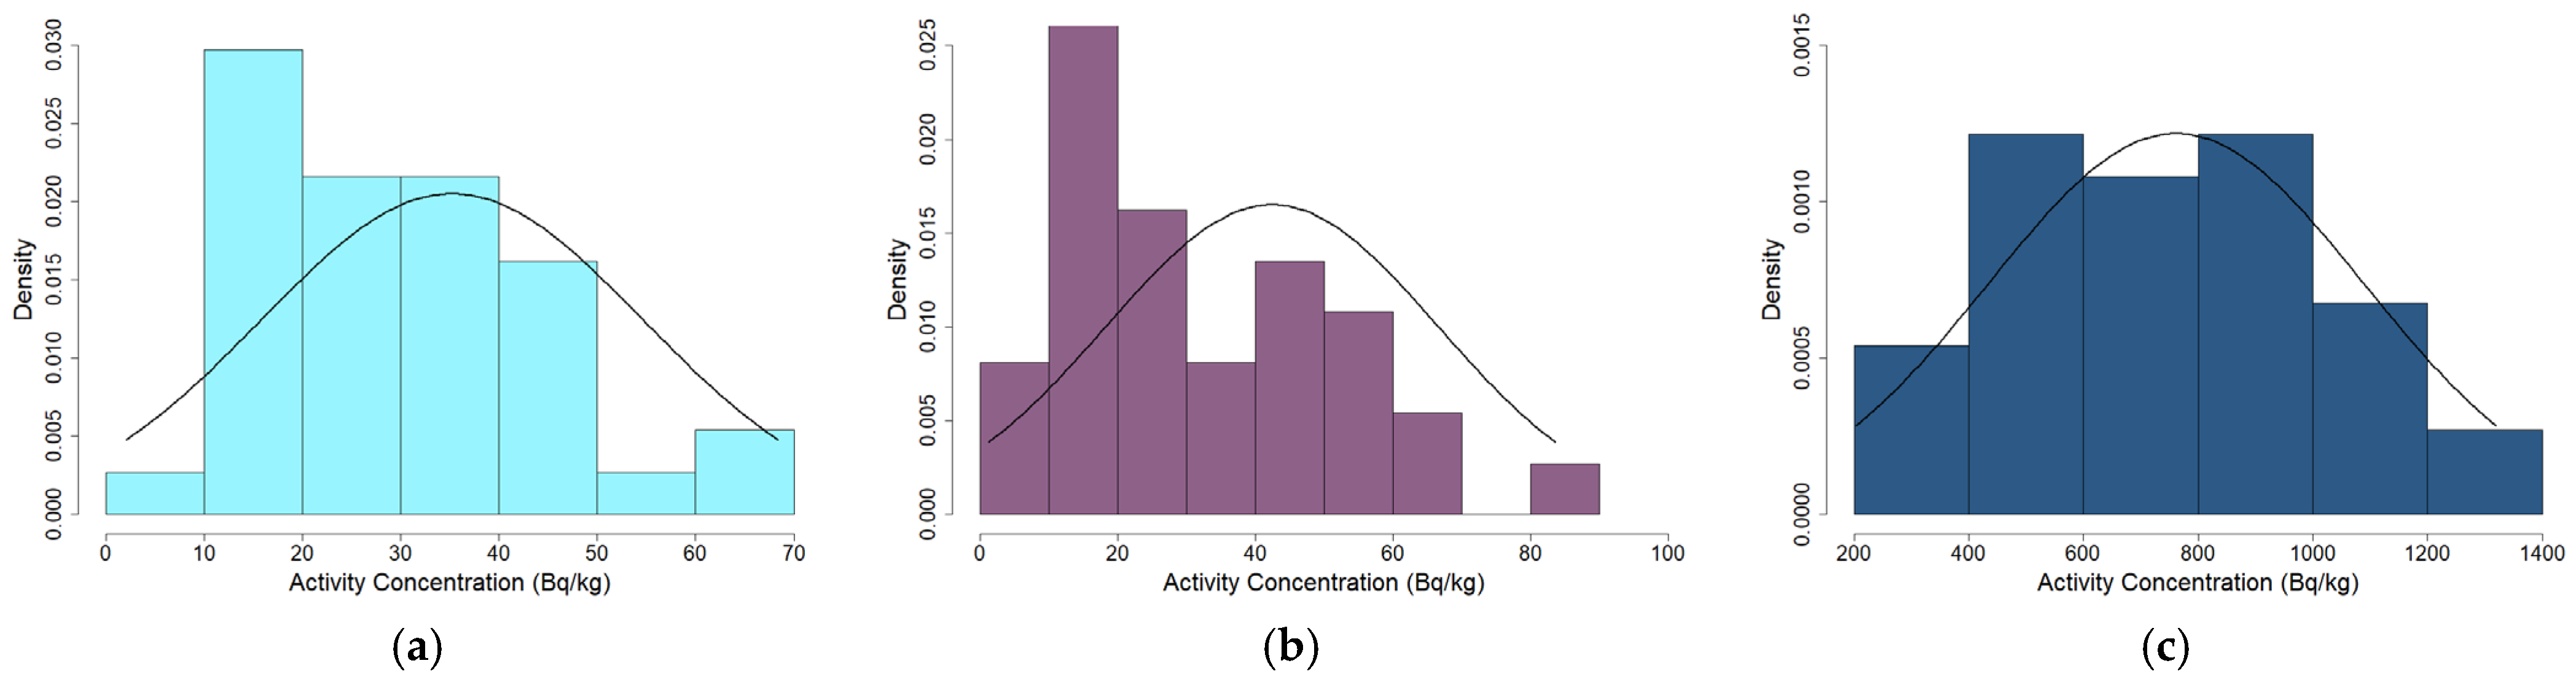
3.1. Natural Radionuclide Concentrations in Soils

Appendix A presents the activity concentration values of the studied radionuclides measured at each sampling site, accompanied by their respective uncertainty quantifications. The measurements of 226Ra exhibited a range from 2.05 to 68.38 Bq kg−1, with a median of 26.75 Bq kg−1 and a mean of 29.96 Bq kg−1. This radionuclide demonstrated moderate spatial variability as evidenced by a coefficient of variation of 0.5012, with a variance of 225.56. 40K consistently showed the highest activity concentration among all analyzed radionuclides, with values ranging between 202.63 and 1320.07 Bq kg−1, a median of 760.74 Bq kg−1, and a mean of 736.81 Bq kg−1. This predominance of 40K aligns with its greater natural abundance in the Earth’s crust, where potassium is measured in percentages while uranium and thorium are typically quantified in parts per million [18]. Despite having the highest absolute concentrations, 40K exhibited the lowest relative variability with a coefficient of variation of 0.3684, suggesting a more uniform distribution across the study area. 232Th measurements ranged between 1.22 and 83.67 Bq kg−1, with a median of 24.74 Bq kg−1 and a mean of 29.72 Bq kg−1. Among the three radionuclides, 232Th displayed the highest relative variability (CV = 0.6464), indicating greater spatial heterogeneity in its distribution throughout the study area.
Notable deviations from established worldwide averages reported by UNSCEAR (2000) [44], particularly for 40K. The mean 40K concentration of 736.81 Bq kg−1 is nearly double the worldwide median value of 400 Bq kg−1 (range 140–850 Bq kg−1), indicating enrichment of this isotope in local soils. This elevated concentration could be attributed to the geological characteristics of the region, potentially reflecting potassium-rich parent materials, such as granites or certain types of metamorphic rocks, or possibly enhanced by agricultural practices involving potassium fertilizers. By contrast, 226Ra exhibited a mean concentration of 29.96 Bq kg−1, slightly below the worldwide median of 35 Bq kg−1 (range 17–60 Bq kg−1), suggesting somewhat lower uranium content in the local lithology compared to global averages. The 232Th concentration (mean of 29.72 Bq kg−1) closely approximates the worldwide median of 30 Bq kg−1 (range 11–64 Bq kg−1), indicating that thorium levels in the study area are typical of global soil compositions. Shapiro–Wilk tests yielded p = 0.1334 for 226Ra (normality not rejected), p = 0.0187 for 232Th (normality rejected), and p = 0.8274 for 40K (normality not rejected). The non-normal distribution observed for 232Th concentrations points to localized variations that may reflect heterogeneity in the underlying geology or differential weathering and transport processes.
The elevated 40K concentrations observed in this study merit particular attention from radiological protection and environmental health perspectives. While 40K contributes significantly to natural background radiation, its biological behavior differs from uranium and thorium series radionuclides due to homeostatic regulation of potassium in organisms. The moderate levels of 226Ra and 262Th, which are below or near global averages, suggest that radiation exposure from these series may not present elevated concerns compared to worldwide norms. However, the considerable spatial variability observed, particularly for 232Th, indicates that localized areas may exist with substantially higher concentrations than the central tendency measures suggest. This spatial heterogeneity underscores the importance of detailed radiological mapping for accurate risk assessment rather than relying solely on summary statistics. The data presented provide a valuable baseline for future monitoring and serve as critical inputs for dose assessment calculations that would complement this radiological characterization.
Figure 3 presents the frequency distributions of the activity concentration for the three primary naturally occurring radionuclides measured in soil samples across the study area. The histogram for 226Ra (Figure 3a) displays a distribution that closely approximates normality, with a slight positive skew (skewness = 0.5469) as evidenced by the extended tail toward higher activity values. Most samples cluster around the 20–40 Bq kg−1 range, which aligns with the previously reported mean of 29.96 Bq kg−1. The distribution pattern supports the Shapiro–Wilk test result (p-value = 0.1334) that indicated conformity to a normal distribution.
Figure 3b illustrates the frequency distribution of 232Th activities, revealing a more pronounced right-skewed pattern (skewness = 0.7976) with the majority of samples falling between 10–40 Bq kg−1, while a smaller number of samples extend toward significantly higher values approaching 80 Bq kg−1. This non-normal distribution is consistent with the Shapiro–Wilk test result (p-value = 0.0187) that rejected the hypothesis of normality. The histogram for 40K (Figure 3c) demonstrates a broader distribution with considerably higher activity values, spanning predominantly between 400 and 1000 Bq kg−1, reflecting the substantially greater natural abundance of this radionuclide in soil. Despite having the highest absolute values and widest range (202.63–1320.07 Bq kg−1), the 40K distribution exhibits the most symmetrical pattern among the three radionuclides, with minimal skewness (0.1306) and a clear bell-shaped curve that confirms its normal distribution as indicated by the Shapiro–Wilk test (p-value = 0.8274). These distinct distributional patterns provide a sound basis for our chosen spatial interpolation, clustering and risk-assessment workflows, ensuring that each radionuclide is analyzed with the most appropriate statistical framework [12].

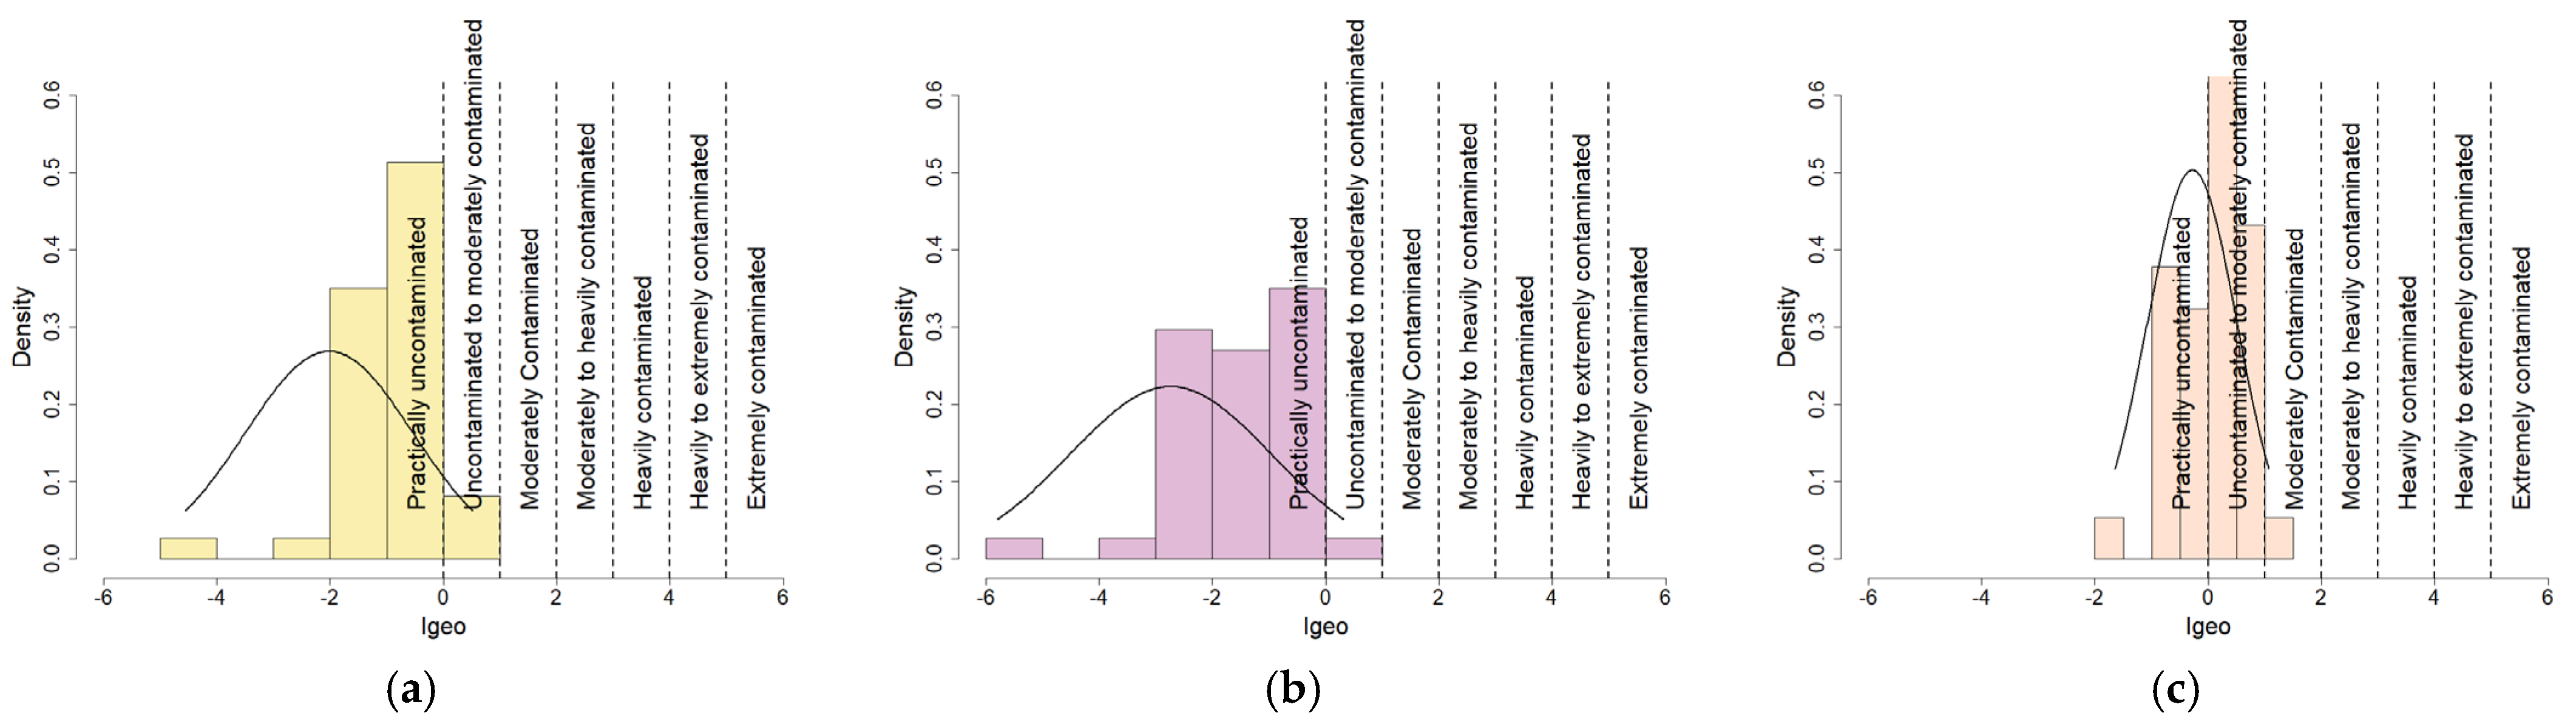
3.2. Geoaccumulation Indices

Igeo 226Ra values ranged from −4.5493 to 0.5105 with a mean of −0.9034, indicating generally low accumulation levels throughout the region. The negative skewness (−1.5788) and significant departure from normality (p-value = 0.0006) suggest predominantly uncontaminated conditions with few outlier sites. Most sampling locations exhibited negative Igeo values for 226Ra, placing them in the uncontaminated category, while only three sites (Villa de Cos, El Capulín, and La Sierrita) fell within the uncontaminated to moderately contaminated range. Similarly, Igeo 232Th displayed even lower geoaccumulation patterns, with values ranging from −5.7899 to 0.3098 and a mean of −1.5400. The distribution was also negatively skewed (−1.2088) and non-normal (p-value = 0.0069), with only one site (El Chique 2) classified as uncontaminated to moderately contaminated. In contrast, Igeo 40K showed the highest overall accumulation levels among the analyzed radionuclides, with Igeo values ranging from −1.6365 to 1.0672 and a mean of 0.1157. The Igeo 40K distribution approached normality (p-value = 0.1169) and was less skewed (−0.7384) than the other radionuclides, indicating more widespread moderate accumulation. Twenty-two locations showed uncontaminated to moderately contaminated levels for 40K, including Bracho, Aranzazú mine, Capstone Gold, Morelos, El Chique 1, El Chique 2, Hancón 1, Hancón 2, El Obraje 1, El Obraje 2, La Bufa Sur, La Minita, La Sierrita, La Zacatecana, Lobatos, Loreto 1, Loreto 2, Los Sauces, Parque Bicentenario, Rincón de Bueyes, San Ramón, and Deportiva Calera. Notably, El Capulín was the only site that reached the moderately contaminated classification for 40K, with an Igeo value between 1 and 2. These findings indicate that while 226Ra and 232Th contamination remains minimal throughout the study area, 40K shows more significant accumulation patterns that warrant monitoring, particularly at El Capulín where moderate contamination was detected. The overall geoaccumulation pattern suggests that natural potassium-bearing minerals may be more prevalent in the regional geology than uranium or thorium series elements.
The histograms of geoaccumulation indices (Figure 4a–c) show the distribution patterns for each radionuclide that align with the statistical parameters. For Igeo 226Ra (Figure 4a), the histogram displays a pronounced left skewness (−1.5788) with a steep peak at higher Igeo values (near −1 to 0) and an elongated tail extending toward extreme negative values (−4.5), consistent with its leptokurtic distribution (kurtosis = 7.55). This configuration reflects the predominance of uncontaminated sites (Igeo < 0) and explains why only three locations reach the uncontaminated-to-moderate threshold (0 ≤ Igeo < 1). The Shapiro–Wilk p-value (0.0006) confirms significant deviation from normality, underscoring the asymmetric distribution caused by natural geochemical variations in uranium-rich minerals.
The Igeo 232Th histogram (Figure 4b) exhibits a less pronounced but still evident left skew (−1.2088), with most data clustered between Igeo values of −3 to 0. The narrower distribution range compared to Igeo 226Ra (minimum −5.79 vs. −4.55) and lower kurtosis (5.90) suggests fewer extreme outliers, though the non-normal distribution (p = 0.0069) indicates persistent asymmetry. This pattern correlates with the singular site (El Chique 2), showing elevated thorium accumulation, potentially linked to localized geological features or anthropogenic influences. In contrast, the Igeo 40K histogram (Figure 4c) demonstrates a quasi-normal distribution (p = 0.1169) with mild left skew (−0.7384) and reduced kurtosis (3.26). The symmetric bell-shaped curve centered near the mean (0.1157) spans from −1.6 to 1.1 Igeo values, encompassing the majority of sites within the uncontaminated-to-moderate range. This distribution explains why 22 locations exhibit potassium accumulation levels approaching moderate contamination, particularly El Capulín (Igeo = 1.07), which sits at the distribution’s upper boundary. The broader dispersion (CV = 5.20) compared to other radionuclides suggests more variable potassium distribution in soils, likely influenced by both natural geological potassium abundance and site-specific pedological processes.

3.3. Risk Assessment

The assessment of radiological risk indices shows that the mean values of radium equivalent activity (Raeq), absorbed dose rate (D), annual effective dose Equivalent (AEDE), external hazard index (Hex), internal hazard index (Hin), and excess lifetime cancer risk (ELCR) were 129.20 Bq kg−1, 62.52 nGy h−1, 76.68 μSv y−1, 0.3489, 0.4299, and 0.330 × 10⁻³, respectively. These values indicate moderate variability (coefficient of variation: 0.41–0.42), with skewness (0.28–0.36) and kurtosis (~2.5) suggesting near-normal distributions, supported by Shapiro–Wilk p-values > 0.05.
Notably, the absorbed dose rate (D) and ELCR exceeded their respective global thresholds (59 nGy h−1 and 0.29 × 10⁻³). The mean D (62.52 nGy h−1) surpassed the threshold by ~4%, primarily due to elevated contributions from 232Th and 40K in soil, while ELCR (0.330 × 10⁻³) exceeded the limit by ~14%, highlighting potential long-term carcinogenic risks from chronic exposure. In contrast, Raeq (mean: 129.20 Bq kg−1), Hex (0.3489), and Hin (0.4299) remained well below safety limits (370 Bq kg−1, 1), reflecting minimal external and internal radiation hazards.
Spatially, Raeq and AEDE showed significant variation (standard deviations: 55.27 Bq kg−1 and 31.91 μSv y−1), likely influenced by heterogeneous mineral distribution and localized anthropogenic activities, such as agriculture or industrial practices. The positive skewness and light-tailed distributions (kurtosis < 3) imply sporadic higher values in specific hotspots, though overall trends align with natural background levels.
The distribution of radiological risk indices is generally positively skewed, with most samples clustered at lower values and a tail toward higher values. The radium equivalent activity (Raeq) shows that most values lie well below the safety cut-off of 370 Bq kg−1, with concentrations typically ranging between approximately 60 and 250 Bq kg−1, indicating that even though the majority of sites remain within the recommended limits, a few locations approach higher values (e.g., El_Capulín at about 255 Bq kg−1). In contrast, the absorbed gamma dose rate (D) distinguishes two groups; while many sites record values near or below the world average of 59 nGy h−1, a significant number of samples—especially those from mining-impacted areas, such as El Capulín, El Chique 1, El Chique 2, Hancón 1, Hancón 2, El Obraje 1, El Obraje 2, La Bufa Sur, La Minita, La Sierrita, La Zacatecana, Lobatos, Loreto 1, Loreto 2, Los Sauces, Rincón de Bueyes, and San Ramón—exhibit markedly elevated dose rates, nearly doubling the average value. The annual effective dose equivalent (AEDE), while generally concentrated at lower values well beneath the outdoor threshold of 460 μSv y−1, also displays a trailing end that represents higher exposures at some of these sites, highlighting that the elevated absorbed dose rate in certain areas translates into proportionally increased effective dose values. The histograms of the radiological risk indices are provided in the Supplementary Material (Figure S1).
Similarly, the distributions of both the external hazard index (Hex) and the internal hazard index (Hin) are confined to values below unity, with most samples ranging between roughly 0.17 and 0.69 for Hex and 0.21 to 0.86 for Hin; these indices show a modest spread due to localized variations, yet they consistently indicate minimal immediate radiological harm under typical use conditions. Meanwhile, for the excess lifetime cancer risk (ELCR × 10−3) is characterized by a pronounced rightward tail; while many sites have ELCR values below the threshold of 0.29, a notable subset—including sites such as Bracho, Mina Aranzazú, Morelos, El Capulín, El Chique 1, El Chique 2, Hancón 1, Hancón 2, El Obraje 1, El Obraje 2, La Bufa Sur, La Minita, La Sierrita, La Zacatecana, Lobatos, Loreto 1, Loreto 2, Los Sauces, Rincón de Bueyes, and San Ramón—exceed the cut-off, suggesting a potential increase in lifetime cancer risk where elevated radionuclide levels persist. Overall, the bulk of the samples fall within recommended radiological safety limits—particularly in terms of Raeq, Hex, and Hin—the absorbed dose rate and the corresponding effective dose as well as the cancer risk indicator (ELCR) in certain mining-affected sites exceed global averages, thereby emphasizing the need for targeted monitoring and mitigation in these hotspots.

3.4. Outliers

The identification of outliers is a critical step in geostatistical and environmental data analysis, as it ensures the reliability of spatial risk assessments and prevents skewed interpretations of radiological hazards. This process involves detecting anomalous values that deviate significantly from the dataset’s statistical or spatial patterns, which may arise from measurement errors, contamination hotspots, or unique geogenic processes. In this study, a multi-strategy approach was implemented to comprehensively identify outliers across the following different variable sets: activity concentrations of 226Ra, 232Th, and 40K; their corresponding geoaccumulation indices (Igeo); and the absorbed dose ratio (D). For activity concentrations and Igeo values, three complementary methods were applied: univariate analysis using Z-scores to flag data points exceeding ±3 standard deviations, multivariate analysis via Mahalanobis distance to detect anomalies in correlated multidimensional spaces, and spatial analysis using Adaptive Moran’s I to identify localized deviations from spatial autocorrelation patterns [70,71,77,78,79,80,81,82]. These methods were paired with comparisons to regulatory limit values to distinguish between statistically anomalous data and values exceeding safety thresholds.
For the radiological indices, only univariate (Z-scores) and spatial (Adaptive Moran’s I) approaches were employed due to the high collinearity among indices, such as the absorbed dose ratio (D), which precluded the use of the Mahalanobis distance. This constraint arises because collinear variables violate the independence assumptions required for robust multivariate outlier detection. The spatial method accounted for neighborhood relationships, isolating regions where dose ratios diverged anomalously from surrounding areas. By integrating these strategies, the analysis not only identified data points that were statistically extreme but also contextualized them within spatial and regulatory frameworks, ensuring a holistic interpretation of radiological risks. This layered approach balances rigor with practicality, addressing both data-driven anomalies and safety-critical exceedances while respecting the limitations imposed by variable interdependencies.
An examination of activity concentrations (226Ra, 232Th, and 40K) showed no univariate or multivariate anomalous values, indicating generally consistent distribution patterns across most sampling sites. However, spatial analysis identified two significant outliers: the Mina Aranzazú site exhibited anomalous 40K activity (845.16 Bq kg−1 compared to the dataset mean of 702.53 Bq kg−1), while the Villa de Cos site emerged as a spatial outlier for all three activity concentrations (226Ra: 68.38 Bq kg−1, 232Th: 7.95 Bq kg−1, and 40K: 444.16 Bq kg−1). For the geoaccumulation indices (Igeo), which provide insight into contamination levels, the Uraga 2 site was identified as an outlier for both Igeo 226Ra (−4.55) and Igeo 232Th (−5.79), and also manifested as a multivariate outlier when all indices were considered collectively. Spatial analysis of Igeo values revealed that Mina Aranzazú was an outlier for Igeo 232Th (−2.21) and Igeo 40K (0.42), Uraga 2 was spatially anomalous for Igeo 232Th and Igeo 40K, and Villa de Cos presented as a spatial outlier across all three Igeo variables (226Ra: 0.51, 232Th: −3.09, 40K: −0.50). Regarding the absorbed dose ratio, although no univariate outliers were detected, Villa de Cos was identified as a spatial outlier with a value of 54.9 nGy h−1, differing significantly from surrounding sites.
The observed patterns of radiological outliers reflect complex geochemical processes and potential anthropogenic influences across the study area. The absence of univariate and multivariate anomalies in activity concentrations suggests regional geological homogeneity in radionuclide distribution, while the identified spatial outliers indicate localized variations likely attributable to specific geological formations or human activities. At Mina Aranzazú, the elevated 40K activity could be linked to potassium-rich mineral compositions typical of certain igneous formations or hydrothermal alterations associated with mining activities. The comprehensive anomaly at Villa de Cos across all radiological parameters indicates a distinct radiological signature that diverges from regional trends, potentially representing a unique lithological unit or contamination from mining operations. The strongly negative Igeo values at Uraga 2 suggest significant depletion of radionuclides compared to background levels, possibly resulting from leaching processes or the presence of materials with naturally low radioactivity content. The spatial outlier status of Villa de Cos for absorbed dose ratio carries important implications for radiation protection, as it indicates a localized area of potentially higher radiological exposure. The identified outliers were retained in all subsequent analyses, as they reflect genuine variability rather than measurement errors. These results emphasize the importance of spatially resolved monitoring in radiological assessment programs and suggest that site-specific management strategies may be necessary, particularly at Villa de Cos, where multiple parameters exceed typical background levels. Future investigations should incorporate mineralogical analyses to better understand the mechanisms contributing to these radiological anomalies and their potential environmental significance.

3.5. Spearman Correlation Analysis

The Spearman correlation analysis was employed to assess relationships between geoaccumulation indices (Igeo 226Ra, Igeo 232Th, Igeo 40K) and radiological risk indices (Raeq, D, AEDE, Hex, Hin, ELCR), with all correlations statistically significant (p < 0.05). The correlogram is shown in Figure 5. This nonparametric method was selected to mitigate the influence of potential outliers in the dataset, ensuring robust statistical interpretation [56,62,80,81,82]. The activity concentrations of 226Ra, 232Th, and 40K were intentionally excluded from the correlation matrix, as the radiological risk indices are directly derived from these parameters.
Moderate positive correlations ( ρ = 0.47–0.91) were observed among geoaccumulation indices and between geoaccumulation and radiological risk indices, indicating that the anthropogenic enrichment of radionuclides in soils contributes to elevated radiation hazards, though additional factors, such as geochemical mobility, mineralogical associations, and environmental redistribution processes, likely modulate these relationships. In contrast, the radiological risk indices exhibited strong intercorrelations ( ρ = 0.75–1.00), reflecting their shared dependence on radiation exposure pathways and their role as complementary metrics for quantifying health and environmental risks. These high correlations underscore that indices such as Raeq (radium equivalent activity), D (absorbed dose rate), and ELCR (excess lifetime cancer risk) collectively capture the same underlying radiological hazard phenomenon but emphasize distinct aspects (e.g., gamma dose contribution, lifetime risk projection), thereby validating their combined use in comprehensive risk assessments. The statistical coherence among radiological indices supports their utility in decision-making frameworks, while the moderate associations with geoaccumulation indices highlight the need for integrated approaches that account for both contamination levels and site-specific environmental dynamics.

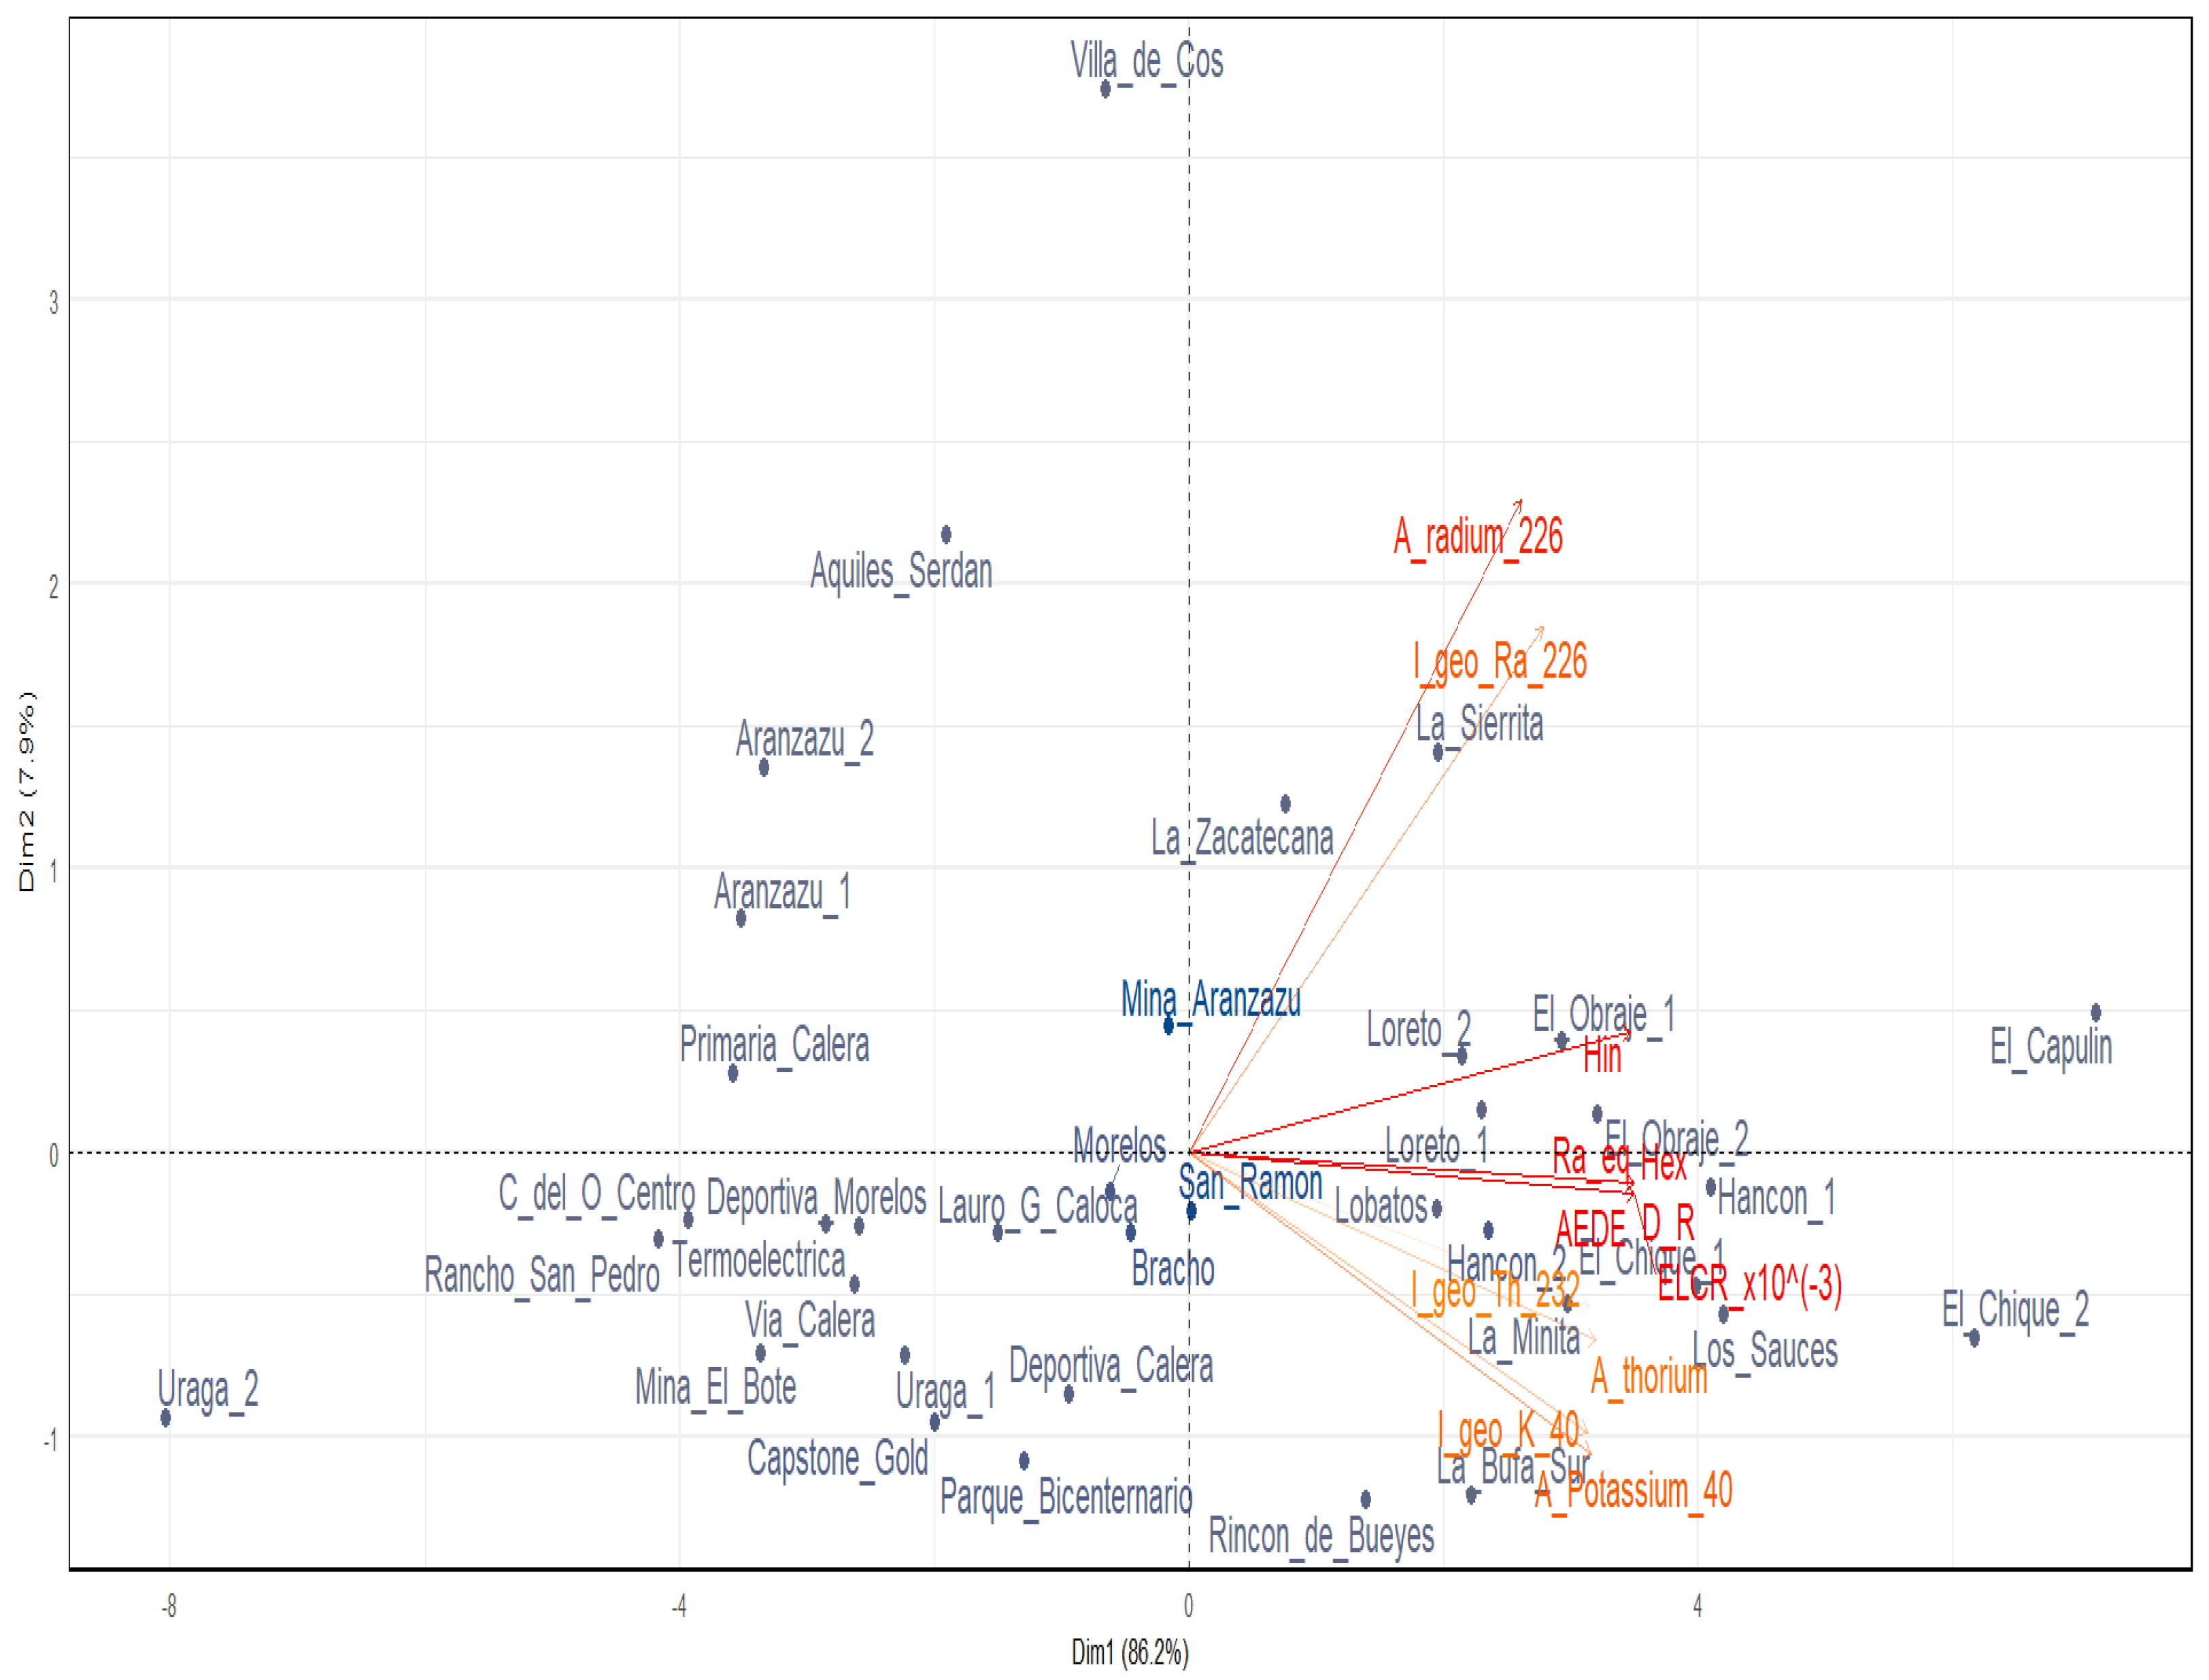
3.6. Principal Components Analysis

Principal component analysis (PCA) was employed to explore the multivariate relationships between radiological variables and identify underlying patterns in the dataset [61,62,63,79]. The PCA biplot (Figure 6) of the first two principal components reveals distinct clustering patterns among the analyzed variables, effectively reducing the dimensionality while preserving the essential information structure. The first principal component (Dimension 1) dominates the variance explanation with an eigenvalue of 10.03, accounting for 86.21% of the total variance (Table 2). This component exhibits exceptionally strong positive correlations with all radiological risk indices: absorbed dose rate (D), annual effective dose equivalent (AEDE), and excess lifetime cancer risk (ELCR) all sharing identical correlation coefficients of 0.9956 (p = 1.11 × 10−37), followed closely by external hazard index (Hex) and radium equivalent activity (Raeq) both at 0.9948 (p ≈ 2 × 10−36), and internal hazard index (Hin) at 0.9876 (p = 9.59 × 10⁻³⁰). The activity concentrations of 232Th and 40K also demonstrate strong correlations with this component (0.9098 and 0.9002, respectively), as do their corresponding geoaccumulation indices. 226Ra parameters show moderately strong but comparatively weaker associations with Dimension 1, with correlation coefficients of 0.7433 for activity concentration and 0.7929 for its geoaccumulation index.
The second principal component (Dimension 2) has an eigenvalue of 0.95, contributing an additional 7.94% to the explained variance, bringing the cumulative explained variance to 94.15%. This dimension primarily represents 226Ra parameters, with activity concentration of 226Ra showing a correlation of 0.6521 (p = 1.22 × 10⁻⁵) and Igeo 226Ra at 0.5260 (p = 8.25 × 10⁻⁴). The biplot visualization demonstrates that radiological risk indices cluster tightly together and align strongly with PC1, indicating their high intercorrelation and suggesting they effectively capture similar aspects of radiological contamination. The 232Th and 40K parameters form another distinct group, also primarily aligned with PC1 but more dispersed than the risk indices cluster. The 226Ra parameters appear more isolated, showing substantial loading on both PC1 and PC2, which suggests they possess unique variance not shared with the other variables and potentially reflect distinct environmental processes or sources.
The third principal component (Dimension 3) has a smaller eigenvalue of 0.37, explaining 3.12% of the variance and bringing the cumulative explained variance to 97.28%. This component shows a moderate positive correlation with Igeo 40K (0.3404, p = 0.039) and a moderate negative correlation with activity concentration of 232Th (−0.3641, p = 0.027), suggesting an inverse relationship between these variables in this dimension [61]. The high cumulative variance explanation across just three dimensions (97.28%) indicates the dataset’s strong internal structure, with most information captured by the first principal component. The clear separation of 226Ra parameters in the biplot, particularly their substantial loading on PC2, suggests these radionuclides may have different environmental behaviors or sources compared to 232Th and 40K. This distinction could be valuable for identifying and differentiating natural from anthropogenic sources of radioactive contamination across the measurement sites.

3.7. Cluster Analysis

3.7.1. Cluster Analysis in Q Mode

Cluster analysis proved instrumental in discerning spatial patterns of radiological risk across sampling sites by grouping locations with similar contamination profiles and hazard potential. We applied k-means clustering conducted in the PCA-derived factor space. In Q mode, the aim is to associate the experimental units [57,62]. The integration of k-means clustering, principal component analysis (PCA), and radiological indices revealed a consistent three-cluster structure, highlighting distinct environmental behaviors of radionuclides and associated risks. The Supplementary Materials (Figure S2 and Figure S3) present two additional clustering methods—standard hierarchical clustering and hierarchical clustering on principal component scores—which confirm the existence of three underlying clusters in Q-mode and four in R-mode.
K-means clustering (Figure 7) demonstrated strong differentiation among sites, with Uraga 2 forming a solitary cluster due to its exceptionally low radionuclide activities (226Ra: 2.05 Bq kg−1, 232Th: 1.22 Bq kg−1, 40K: 202.63 Bq kg−1) and minimal geoaccumulation indices (Igeo 226Ra: −4.55, Igeo 232Th: −5.79, Igeo 40K: −1.64). This outlier status reflects negligible anthropogenic influence and background-level radiation, consistent with its radiological risk indices (e.g., AEDE: 12.43 µSv y−1, ELCR: 0.053 × 10⁻³), which are orders of magnitude lower than other sites. The remaining clusters grouped sites based on intermediate (e.g., Mina El Bote, Termoeléctrica) and elevated contamination levels (e.g., El Capulín, Los Sauces), driven by higher 226Ra, 232Th, and 40K activities.
PCA visualization of k-means clustering reduced the 12-dimensional dataset (activities, geoaccumulation indices, and risk indices) into two principal components explaining ~94% of the cumulative variance. The solitary classification of Uraga 2 underscores its unique radiological safety, while the other clusters reflect gradients of natural radionuclides. This stratification aids targeted environmental management, with high-risk clusters (e.g., El Capulín, Los Sauces) warranting monitoring due to elevated AEDE (>150 µSv y−1) and ELCR (>0.6 × 10⁻³) values exceeding recommended limits.

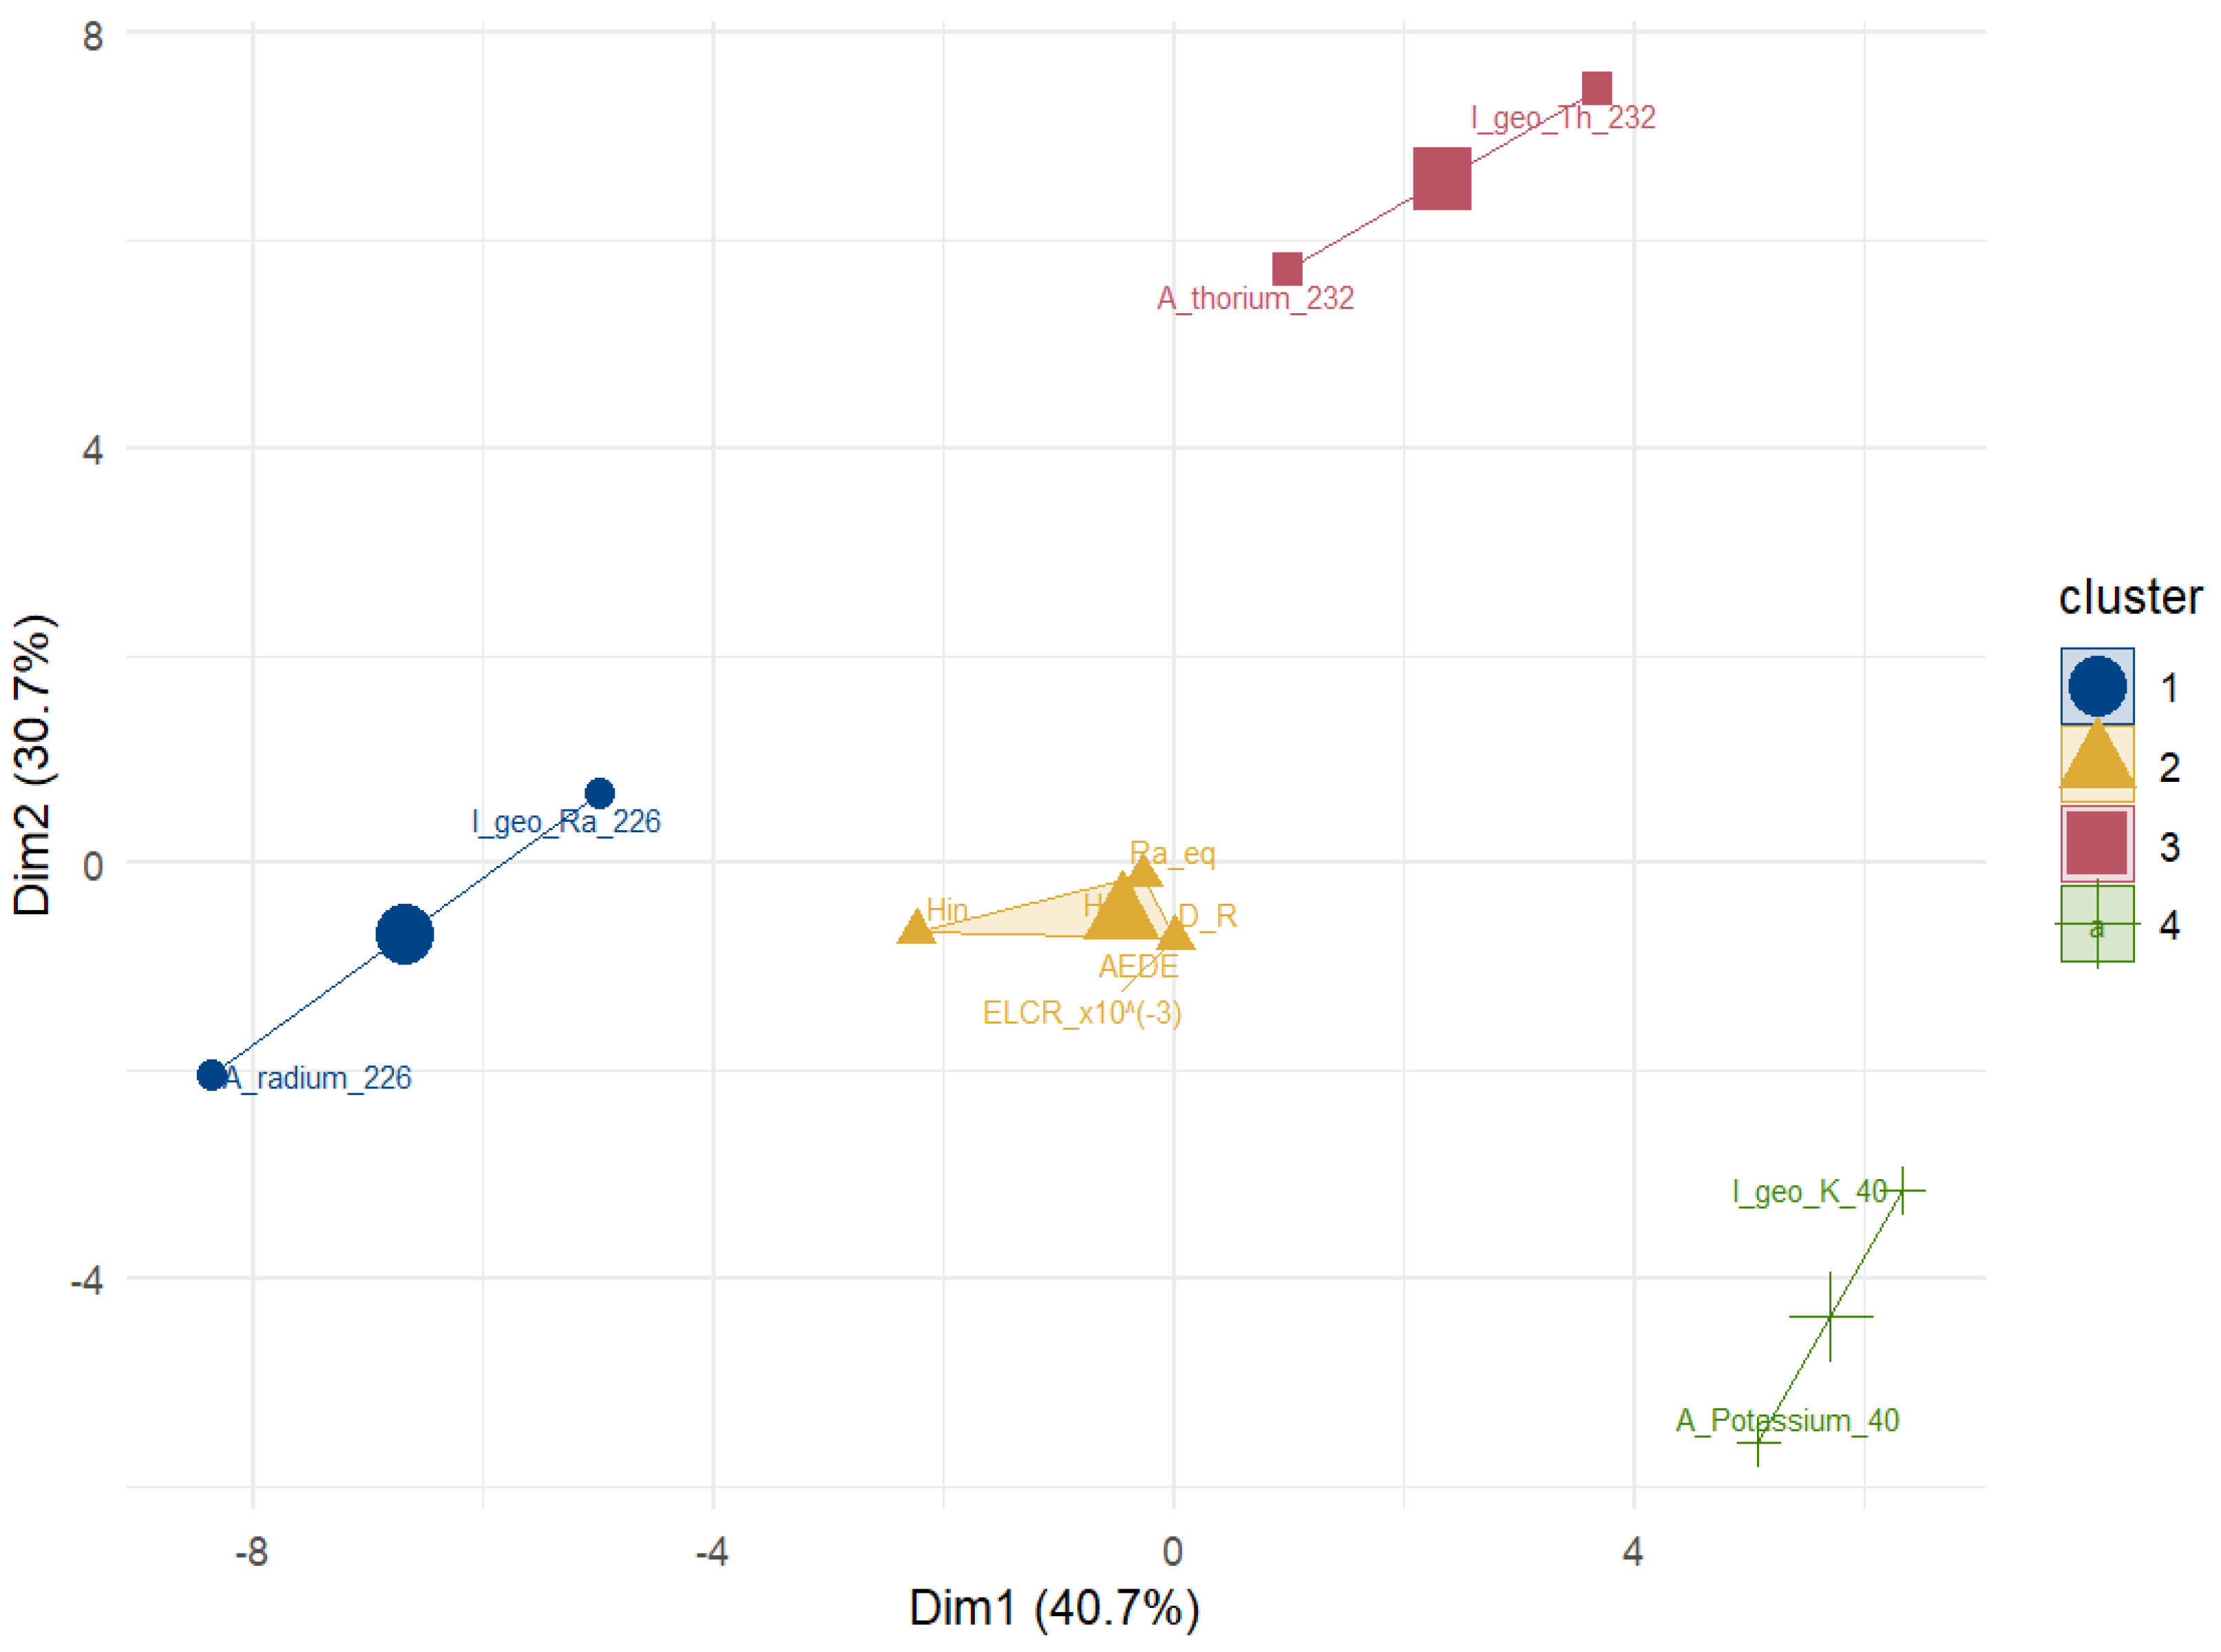
3.7.2. Cluster Analysis in R Mode

In R-mode cluster analysis, the study variables are treated as units of analysis [57,62]. Figure 8 provides critical insights into the spatial relationships among radiological variables across measurement sites. The analysis was applied to a transposed data matrix in which variables correspond to measurement sites and observations comprise the activity concentrations of 226Ra, 232Th, and 40K; their geoaccumulation indices (Igeo); and the radiological risk indices (Raeq, D, AEDE, Hex, Hin, and ELCR). Principal component analysis (PCA) reduced the dataset’s dimensionality, capturing 71.4% of the total variance in a lower-dimensional PC space. The spatial distribution of clusters within this reduced space reveals correlative patterns among variables—such as co-occurring radionuclide activities or shared risk indices—and further validates the four-cluster structure through data-driven criteria.
Clustering variables into groups is essential for identifying correlations and independence among radiological parameters. Highly correlated variables within clusters (e.g., D with Raeq or AEDE) suggest common sources or synergistic environmental behaviors, such as similar geogenic origins or deposition pathways. Conversely, variables in separate clusters exhibit relative independence, implying distinct dynamics—for instance, 232Th’s geoaccumulation index Igeo might diverge from 40K’s due to differential mobility or anthropogenic influences. This grouping clarifies multivariate interactions, aiding in risk prioritization and targeted mitigation strategies. For example, clustered risk indices (e.g., D and AEDE) could indicate overlapping exposure pathways, while isolated variables, such as Hin, may reflect unique drivers. By distilling complex datasets into interpretable clusters, this analysis enhances environmental monitoring efficiency and informs policy decisions by highlighting key variables governing radiological hazards. Supplementary Material Figure S4 presents the heat map based on hierarchical clustering in both Q-mode and R-mode, which clearly highlights the anomalous sites (Uraga 2 and Villa de Cos).

3.7.3. Spatial Distribution of Clusters and Hierarchical Relationships on the Map

The map of Zacatecas, with sampling points colored according to their respective clusters and overlaid with a dendrogram of the hierarchical clustering with Ward’s method and Euclidean distances (Figure 9), provides a multidimensional perspective on the spatial distribution of radiological risk indices. The dendrogram’s vertical branches, emerging from each sampling point and extending to a transformed maximum height of approximately 2.5 units on a natural logarithmic scale, visually represent the hierarchical relationships between sites. This innovative visualization allows for the simultaneous interpretation of clustering patterns in both statistical and geographical contexts.
The spatial distribution of radiological clusters across the state exhibits notable geographic patterns. The cluster containing only the observation of Uraga 2 is distinctly located in the central part of the state, representing a unique and isolated case with significantly low radiological activity and risk indices. In contrast, the clusters with the highest activity values and associated risk indices are concentrated in the southern and western regions of the state, suggesting these areas are hotspots for elevated radiological risks, likely influenced by local environmental or anthropogenic factors. Meanwhile, the cluster characterized by the lowest activity values and risk indices is distributed across the central and northeastern parts of the state, indicating these regions have relatively minimal radiological impact. This overall spatial arrangement highlights a clear gradient of radiological risk, with higher values in the south and west and lower values toward the center and northeast, reflecting underlying variations in environmental conditions or sources of radiological material.
From the analysis of this map, it is evident that the spatial distribution of clusters exhibits a tendency toward geographic grouping, suggesting some influence of physical proximity on radiological similarity. However, this relationship is not absolute. The presence of adjacent sites belonging to different clusters highlights the role of other factors, such as variations in lithology, soil composition, and potentially anthropogenic influences, in shaping the distribution of radionuclides. For instance, differences in soil type or mineralogical content could significantly affect the natural radioactivity levels at specific locations, leading to divergent radiological profiles even among geographically close sites. Supplementary Material Figure S5 displays the sampling locations on the Zacatecas map, with each site colored according to its cluster assignment.
The three-dimensional representation enhances our understanding by integrating hierarchical clustering with spatial data. This approach underscores the complexity of radiological phenomena in Zacatecas and emphasizes the importance of considering both spatial and non-spatial factors. The dendrogram’s hierarchical structure reveals relationships that might not be immediately apparent from a purely geographical or numerical perspective. For example, sites grouped closely in the dendrogram may share similar radiological characteristics despite being geographically distant, suggesting common underlying geological or environmental processes.
This visualization serves as a powerful tool for identifying patterns and anomalies in radiological data. It facilitates hypothesis generation regarding the factors influencing radionuclide distribution and provides a foundation for targeted field investigations. Moreover, by combining statistical clustering with geographic mapping, this method bridges the gap between quantitative data analysis and practical environmental assessment. The integration of hierarchical clustering with geographic mapping offers valuable insights into the spatial distribution of radiological risk indices in Zacatecas. It highlights the interplay between geographic proximity and other environmental factors in determining radiological profiles. This approach not only enhances our understanding of radionuclide behavior but also underscores the need for interdisciplinary methodologies to address complex environmental challenges effectively.

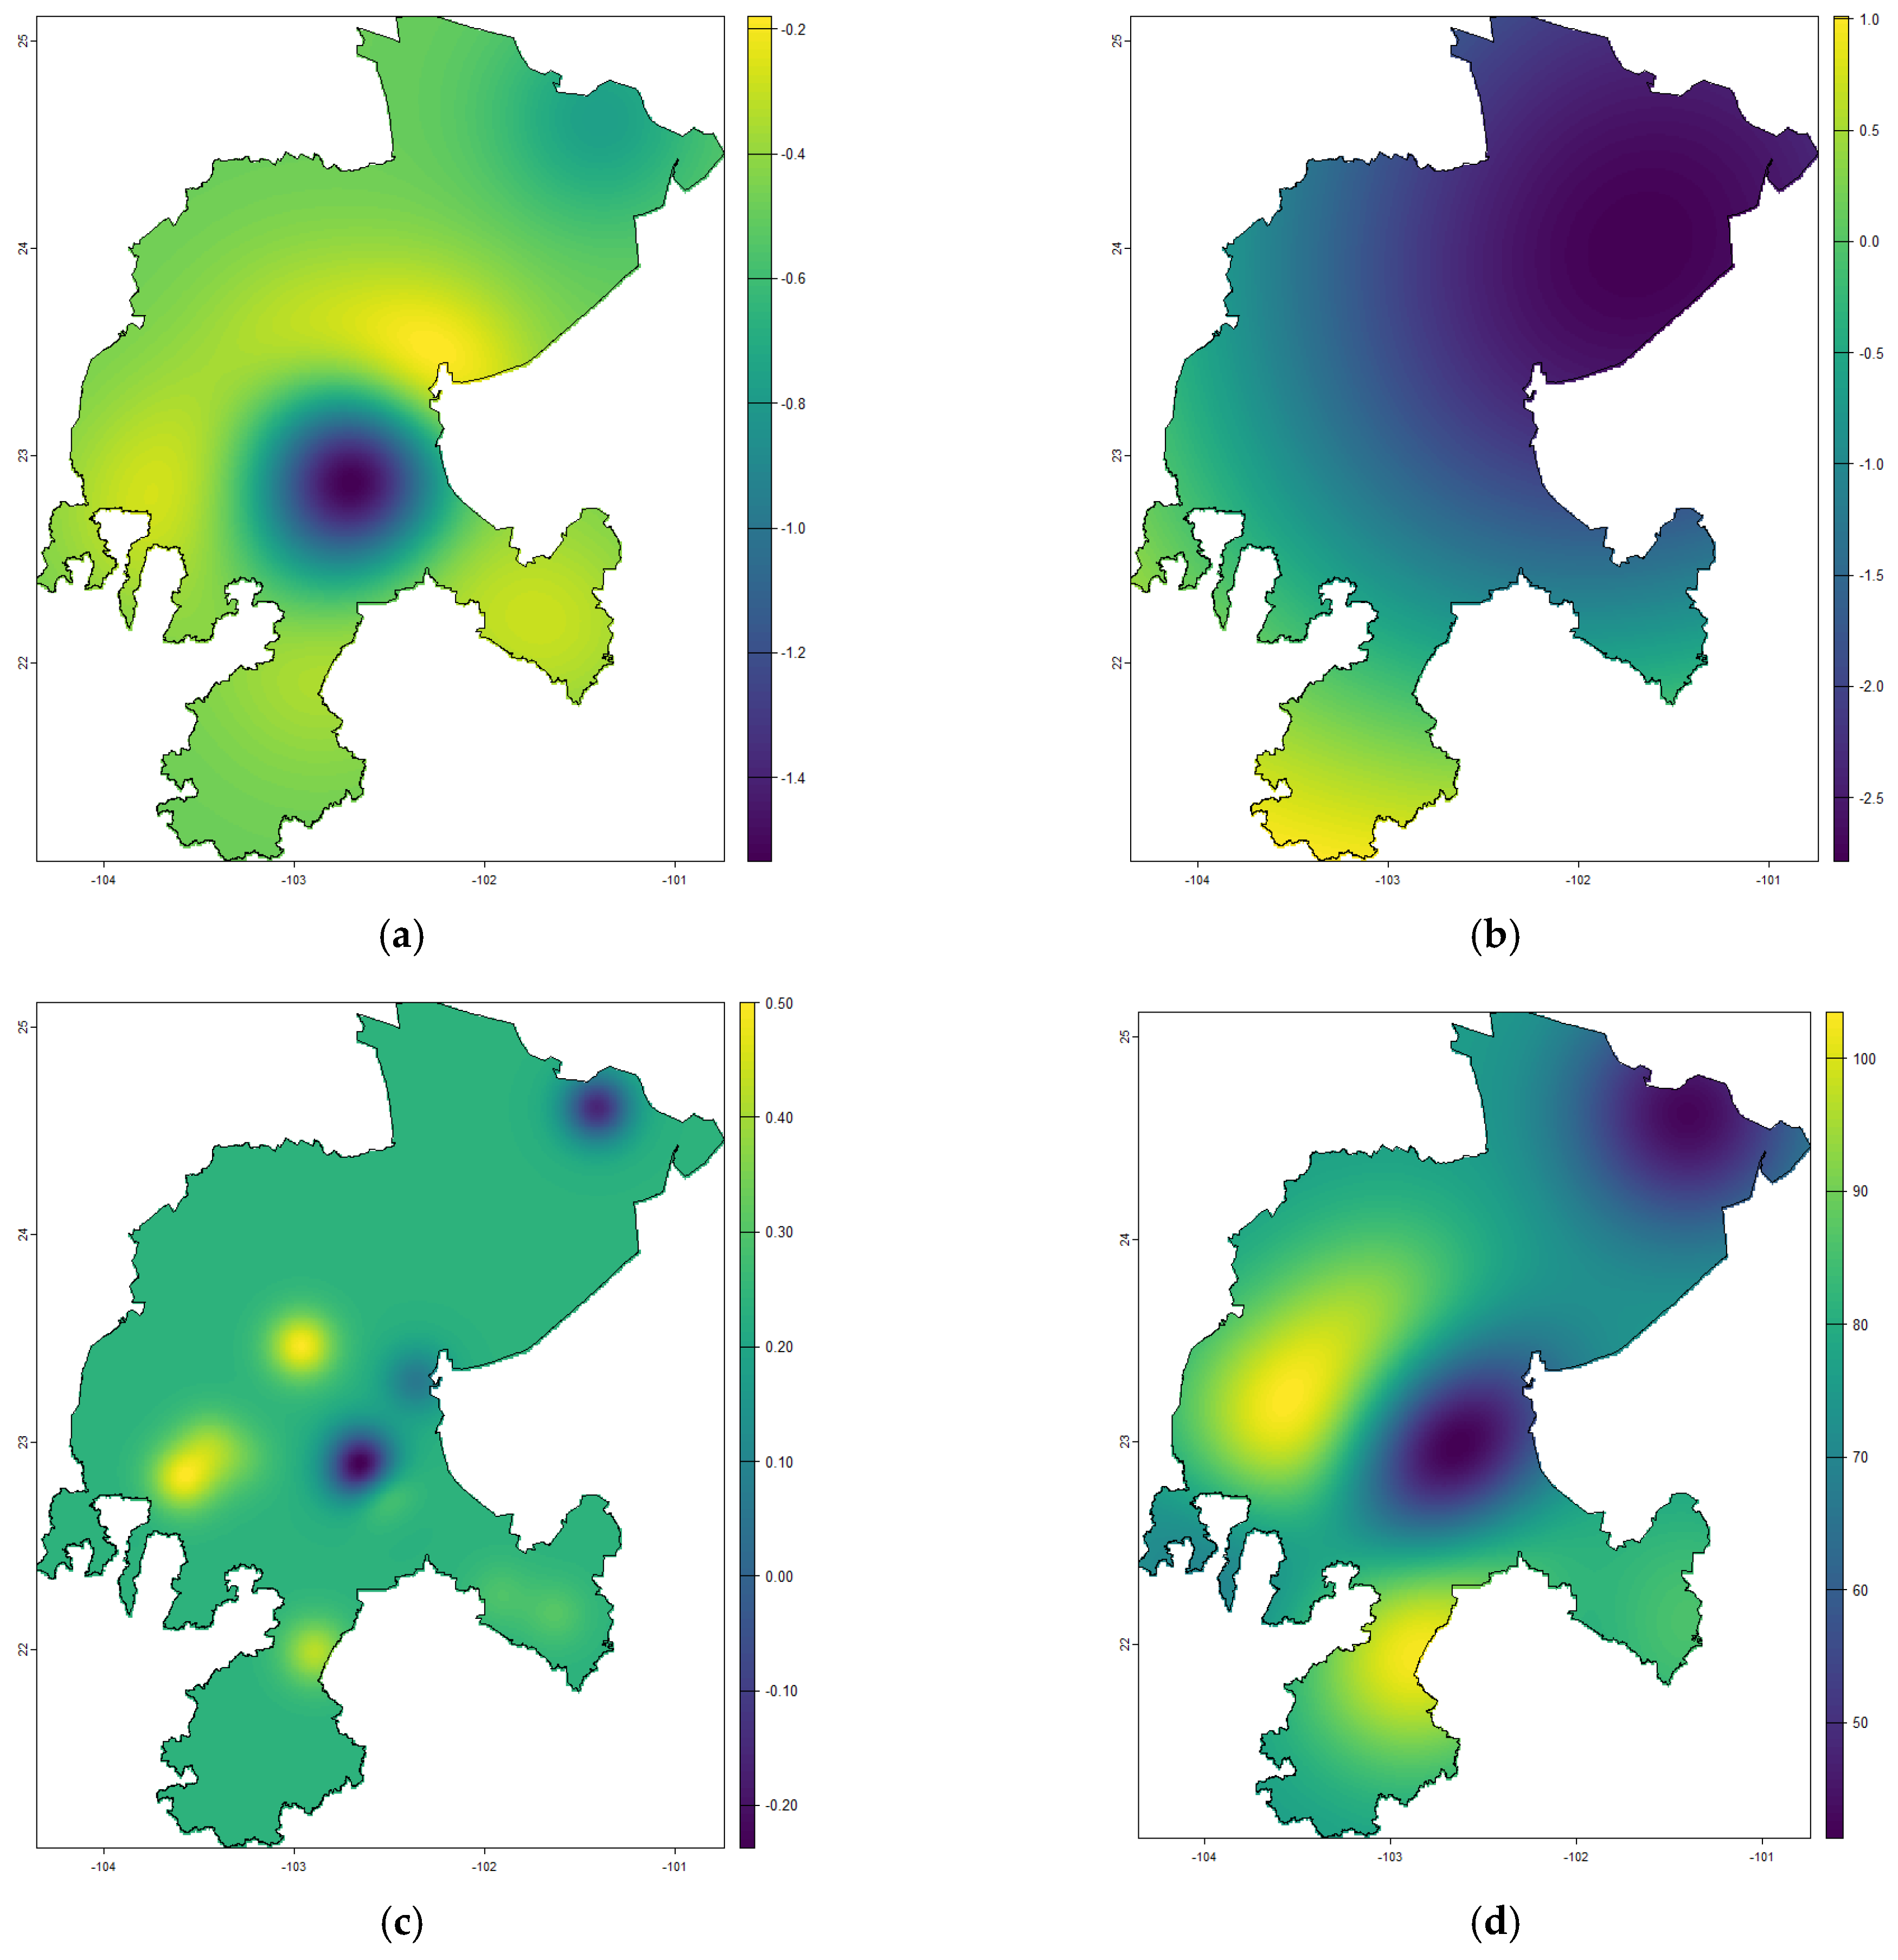
3.8. Geospatial Interpolations

The cross-validation results of the ordinary Kriging models for the geoaccumulation indices (Igeo) and radiological risk parameters demonstrated varying predictive performance across the measured variables (Table 3). For the Igeo indices, 226Ra exhibited moderate accuracy, with a root mean square error (RMSE) of 0.754 and a mean absolute error (MAE) of 0.458, alongside a pseudo-R2 of 0.316, indicating a partial capture of spatial variability. 232Th showed higher prediction errors (RMSE: 0.908; MAE: 0.600) but a marginally improved pseudo-R2 (0.372), suggesting greater inherent spatial heterogeneity or measurement uncertainties. In contrast, 40K displayed the lowest errors (RMSE: 0.494; MAE: 0.387) among the Igeo parameters, albeit with a similar pseudo-R2 (0.307), reflecting relatively stable spatial patterns. The model structures for Igeo indices utilized a Stable parameterization (Ste), with nugget-to-sill ratios ranging from 0.22 (40K) to 0.15 (232Th), indicating moderate spatial autocorrelation influenced by localized factors. The spatial correlation ranges varied substantially, from ~18 km for 40K to ~359 km for 232Th, highlighting differences in the extent of geochemical processes governing these elements.
For radiological risk indices, the Gaussian (Gau) models demonstrated stronger explanatory power, with pseudo-R2 values of 0.668 for Raeq, 0.663 for D and AEDE, and 0.636–0.668 for Hex, Hin, and ELCR. The Raeq index exhibited an RMSE of 31.429 Bq kg−1 and MAE of 24.014 Bq kg−1, while the effective dose equivalents (AEDE: 18.273 μSv y−1 RMSE) and excess lifetime cancer risk (ELCR: 0.079 × 10⁻³ RMSE) indicated generally low radiological hazards across the study area. The nugget effects for these parameters were minimal relative to their sills (e.g., Hex nugget: 0.006 vs. sill: 0.330), implying that spatial variability was dominated by broad-scale trends rather than microscale noise. The correlation ranges for radiological indices (~65–71 km) suggested regional-scale influences, potentially linked to lithological units or anthropogenic activities.
The results underscore the differential behavior of natural radionuclides: elevated Igeo for 232Th relative to 226Ra and 40K aligns with its stronger association with heavy mineral assemblages, while the lower spatial predictability of 232Th may reflect complex weathering or transport dynamics. The radiological risk indices, though generally within safe limits, exhibited localized variability necessitating targeted monitoring. The cross-validation approach confirmed model robustness, with pseudo-R2 values indicating reasonable variance explanation given the inherent complexities of environmental systems. This spatial analysis provides critical insights for land-use planning and risk management, particularly in identifying zones where natural or anthropogenic processes amplify radiological exposure. However, the moderate model performances for Igeo indices emphasize the need to integrate auxiliary geochemical or geological data to refine predictions of radionuclide distribution.
Spatial distribution maps generated through ordinary Kriging for the geoaccumulation index (Igeo) of 226Ra, 232Th and 40K in the study area are shown in Figure 10a–c. The Igeo map for 226Ra (Figure 10a) displays moderate spatial heterogeneity characterized by several hotspots primarily concentrated in the northeastern and southwestern regions, where values reach the highest contamination categories. The distribution pattern of 232Th (Figure 10b) exhibits greater spatial continuity than 226Ra, with elevated Igeo values forming a distinctive band stretching from the northwest to southeast. In contrast, the 40K geoaccumulation index (Figure 10c) presents the most fragmented spatial pattern among the three radionuclides, with isolated patches of elevated values scattered throughout the central region, likely associated with potassium-rich feldspathic rocks and areas subject to agricultural fertilizer application.
The various radiological-risk indices—radium equivalent activity (Raeq), annual effective dose equivalent (AEDE), external and internal hazard indices (Hex and Hin), and excess lifetime cancer risk (ELCR)—are all derived from very similar linear combinations of activity concentrations and, thus, yield nearly identical spatial-distribution maps. To avoid redundancy, we present only the absorbed dose-rate map (D; Figure 10d). Supplementary Material Figure S6 presents the spatial distribution of radium equivalent activity, annual effective dose, external radiological hazard index, internal radiological hazard index, and excess lifetime cancer risk. This D map reveals a pronounced north–south gradient, with peak values around 120 nGy h−1—well above the global average of 59 nGy h−1 reported by UNSCEAR [44]—highlighting the principal areas of elevated radiological concern.
The geostatistical parameters of the Kriging models provide valuable insights into the spatial behavior of the studied variables [6,7,8,19,24,45,58,68,69,70,71]. The radiological risk indices exhibit relatively high pseudo-R2 values (0.636–0.668) and were best fitted with Gaussian models, indicating good spatial predictability and smooth transitions between measurement points. In contrast, the Igeo parameters show notably lower pseudo-R2 values (226Ra: 0.316, 232Th: 0.372, 40K: 0.307) despite being modeled with stable variograms. This discrepancy in model performance can be attributed to several factors. First, the considerable nugget-to-sill ratios for 226Ra (0.734/1.223) and 232Th (1.085/7.323) indicate substantial microscale variability and measurement uncertainty that cannot be captured by the sampling design. Second, the vastly different range values among radionuclides (40K: 18,033 m vs. 232Th: 359,347 m) suggest that different spatial processes operate at different scales for each element.
The modest predictive power of the Igeo models reflects the complex interplay of geological, pedological, and anthropogenic factors governing radionuclide distribution. Local variations in lithology, particularly the presence of uranium or thorium-bearing accessory minerals within seemingly homogeneous geological units, contribute to abrupt changes in radionuclide concentrations that are difficult to model spatially. The contrasting spatial behavior of 40K, with its short range of spatial autocorrelation (18,033 m), points to a strong influence of localized soil properties, such as clay content, organic matter, and cation exchange capacity, which regulate potassium mobility and bioavailability. Additionally, anthropogenic activities, including agricultural practices (application of phosphate fertilizers), land use changes, and soil erosion processes, introduce non-stationary trends and discontinuities in radionuclide distribution that conventional Kriging struggles to capture.
It is worth noting that the radiological risk indices demonstrate superior spatial predictability due to their integrative nature, as they combine the contributions of multiple radionuclides, thus smoothing out localized variations specific to individual elements. The high range values (65,635–71,039 m) for these indices suggest regional-scale processes dominating their spatial distribution, possibly related to broader geological structures and landforms. The lower RMSE and MAE values for Igeo of 40K (0.494 and 0.387) compared to 226Ra and 232Th indicate that, despite its lower predictive power, the 40K model produces smaller absolute errors, possibly due to its narrower concentration range in the study area. These findings highlight the need for supplementary data layers, such as detailed lithological maps, soil property databases, and land use information, to improve the accuracy of spatial predictions, particularly for elements with complex environmental behaviors, such as radium and thorium [22].

4. Conclusions

The comprehensive assessment of natural radionuclides in soils of Zacatecas, Mexico, shows critical insights into their spatial distribution patterns and associated radiological risks. Through extensive sampling and analysis of 37 strategically distributed sites, this research establishes important baseline data for environmental radioprotection in the region. The activity concentration of primary radionuclides varied significantly across the study area, with 40K showing substantially elevated levels (mean 736.81 Bq kg−1) that nearly double the worldwide average of 400 Bq kg−1. This enrichment likely reflects potassium-rich geological substrates or agricultural fertilization practices. In contrast, 226Ra and 232Th exhibited mean concentrations (29.96 and 29.72 Bq kg−1, respectively) that align more closely with global norms, though 232Th demonstrated notably higher spatial heterogeneity.
Geoaccumulation indices (Igeo) indicate that most sampling locations remain uncontaminated with respect to 226Ra and 232Th. However, moderate accumulation of 40K was observed at 22 sites, with El Capulín (Igeo = 1.07) being the only location classified as moderately contaminated for this radionuclide. This pattern suggests differential enrichment dynamics between potassium and the uranium/thorium series elements across the region. In the context of natural radionuclides in soil, the term “contamination” requires careful interpretation. When researchers refer to radionuclide “contamination” in environmental studies, they are primarily describing concentration levels that significantly exceed natural background values, rather than indicating the presence of substances that are not naturally found in soils. Natural radionuclides, such as 40K, 226Ra, and 232Th, have existed in the Earth’s crust since its formation and are ubiquitous components of all soils and rocks, though their distribution varies considerably based on geological characteristics.
The geoaccumulation index (Igeo) classification system used in radiological studies illustrates this nuanced interpretation by categorizing enrichment levels relative to global reference values. For instance, describing a soil as “moderately contaminated” with 40K (as in the case of El Capulín, with Igeo = 1.07) does not imply that 40K is a foreign substance inappropriately introduced to the environment, but rather that its concentration substantially exceeds expected background levels. This enrichment may result from natural geological processes, such as the presence of potassium-rich parent materials, or from anthropogenic activities, such as agricultural fertilization or mining operations, that may concentrate or redistribute naturally occurring radioactive materials. Therefore, “contamination” in radiological assessment refers to the relative abundance of these elements compared to reference values, acknowledging that while these radionuclides are natural components of the environment, their elevated concentrations may potentially contribute to increased radiation exposure above typically expected levels.
The radiological risk assessment revealed that while most indices remain within internationally accepted safety limits, some parameters exceed global thresholds in specific locations. The mean absorbed dose rate (62.52 nGy h−1) and excess lifetime cancer risk (0.330 × 10⁻³) surpassed global references by approximately 4% and 14%, respectively. However, radium equivalent activity (Raeq = 129.20 Bq kg−1) and hazard indices (Hex = 0.35, Hin = 0.43) remained well below safety thresholds, indicating minimal external and internal radiation hazards under typical exposure scenarios.
Multivariate statistical analysis demonstrated strong correlations ( ρ = 0.75–1.00) among radiological risk indices, confirming their complementary roles in comprehensive risk assessment. Moderate correlations between geoaccumulation indices and radiological parameters highlight the influence of anthropogenic enrichment on radiation exposure. Spatial interpolation and cluster analysis identified the southern and western regions of Zacatecas as radiological hotspots, with elevated Raeq (>200 Bq kg−1) and annual effective dose equivalent (>150 μSv y−1). Certain locations exhibited unique radiological signatures—notably Uraga 2 with exceptionally low radionuclide activities across all parameters, and Villa de Cos with elevated 226Ra despite low thorium and potassium levels.
These findings emphasize the necessity of integrating spatial analysis with multivariate statistical techniques in environmental radioprotection frameworks. While most of the study area complies with international safety standards, the identified zones exceeding dose thresholds warrant prioritized management to mitigate potential cumulative health risks. The study establishes critical baseline data for Mexico and highlights the importance of continuous monitoring of natural radionuclides, particularly in areas with heterogeneous distribution patterns or proximity to mining operations.

Supplementary Materials

The following supporting information can be downloaded at: https://www.mdpi.com/article/10.3390/analytica6020020/s1, Figure S1: Histograms of radiological risk indices; Figure S2: Cluster analysis in Q mode; Figure S3: Cluster analysis in R mode; Figure S4: Heat map of radiological variables and sampling sites; Figure S5: Spatial Distribution of Clusters; Figure S6: Spatial distribution of radiological risk indices.

Author Contributions

Conceptualization, D.H.-R. and C.R.-M.; methodology, C.R.-M.; software, D.H.-R.; validation, J.L.P.-V., F.M.-G. and E.E.-J.; formal analysis, C.R.-M.; investigation, F.D.l.T.A.; resources, J.L.P.-V.; data curation, F.D.l.T.A. and E.E.-J.; writing—original draft preparation, D.H.-R.; writing—review and editing, C.R.-M.; visualization, F.D.l.T.A.; supervision, J.L.P.-V.; project administration, F.M.-G.; funding acquisition, F.M.-G. and E.E.-J. All authors have read and agreed to the published version of the manuscript.

Funding

This research received no external funding.

Data Availability Statement

The original contributions presented in this study are included in the article.

Acknowledgments

Hernández-Ramírez Daniel acknowledge to SECIHTI (CONAHCyT) for the scholarship grant 734737.

Conflicts of Interest

The authors declare no conflicts of interest.

Abbreviations

The following abbreviations are used in this manuscript:
226RaRadium-226
232ThThorium-232
40K Potassium-40
BqBecquerels
yYear
kgKilogram
GyGray
IgeoGeoaccumulation index
hHour
km2Square kilometers
NNorth
WWest
GeReGermanium reverse
FWHMFull Width at Half Maximum
keVkiloelectron volt
Energy of the gamma rays
εEfficiency
γGamma emission probability
tsLive acquisition time
mSample mass
kCorrection factor
log2Logarithmic scale (base 2)
CiMeasured activity concentration of the radionuclide
BiReference background activity concentration
AEDEAnnual Effective Dose Equivalent
DAbsorbed Dose Rate
RaeqRadium equivalent activity
SvSievert
HexExternal hazard index
Hininternal hazard index
ELCRExcess Lifetime Cancer Risk
LELife expectancy
RFFatal cancer risk factor
AEDAnnual effective dose equivalent
ARaactivity concentration of 226Ra
AThactivity concentration of 232Th
AKactivity concentration of 40K
nNano
pp-values
ρ Correlation coefficient
INEGIInstituto Nacional de Estadística y Geografía

Appendix A

This appendix presents the activity concentration values of the studied radionuclides and their associated uncertainties. Both geoaccumulation indices and radiological risk indices can be derived from these activity measurements using Equations (3) through (9), with their corresponding uncertainties determined through systematic error propagation analysis.
Table A1. Activity concentration of 226Ra.
SamplesSite NameActivity ConcentrationUncertaintiesSamplesSite NameActivity ConcentrationUncertainties
M1Bracho25.003.83%M20Lauro G. Caloca20.533.88%
M2Aquiles Serdán43.403.70%M21Lobatos34.043.81%
M3Concepción del oro centro (C_del_O_Centro)13.294.06%M22Loreto 139.013.76%
M4Aranzazú 123.303.79%M23Loreto 239.833.80%
M5Aranzazú 228.433.79%M24Los Sauces38.573.84%
M6Aranzazú mine34.453.76%M25Mina El Bote12.054.13%
M7Capstone Gold15.144.00%M26Parque Bicentenario16.023.96%
M8Morelos25.284.00%M27Primaria Calera17.263.88%
M9El Capulín63.983.72%M28Rancho San Pedro11.764.12%
M10El Chique 138.083.83%M29Rincón de Bueyes22.723.99%
M11El Chique 243.052.29%M30San Ramón26.753.80%
M12Hancón 145.133.74%M31Termoeléctrica16.613.89%
M13Hancón 237.163.81%M32Deportiva Calera18.334.13%
M14El Obraje 143.193.76%M33Deportiva Morelos17.053.97%
M15El Obraje 241.663.79%M34Uraga 115.224.05%
M16La Bufa Sur25.433.82%M35Uraga 22.059.60%
M17La Minita33.433.83%M36Vía Calera15.783.96%
M18La Sierrita52.183.72%M37Villa de Cos68.382.08%
M19La Zacatecana45.163.78%----
Table A2. Activity concentration of 232Th.
SamplesSite NameActivity ConcentrationUncertaintiesSamplesSite NameActivity ConcentrationUncertainties
M1Bracho23.683.78%M20Lauro G. Caloca24.743.66%
M2Aquiles Serdán12.204.68%M21Lobatos41.503.67%
M3Concepción del oro centro (C_del_O_Centro)11.164.65%M22Loreto 143.013.66%
M4Aranzazú 18.485.62%M23Loreto 245.793.64%
M5Aranzazú 210.104.18%M24Los Sauces56.143.65%
M6Aranzazú mine14.604.08%M25Mina El Bote12.933.89%
M7Capstone Gold10.653.10%M26Parque Bicentenario16.303.90%
M8Morelos26.083.90%M27Primaria Calera17.773.72%
M9El Capulín62.673.62%M28Rancho San Pedro13.543.80%
M10El Chique 160.163.62%M29Rincón de Bueyes36.163.69%
M11El Chique 283.673.60%M30San Ramón31.183.66%
M12Hancón 140.603.65%M31Termoeléctrica15.673.75%
M13Hancón 226.873.76%M32Deportiva Calera23.613.74%
M14El Obraje 152.433.61%M33Deportiva Morelos19.633.74%
M15El Obraje 253.833.61%M34Uraga 118.403.84%
M16La Bufa Sur42.793.58%M35Uraga 21.226.39%
M17La Minita55.823.63%M36Vía Calera16.543.79%
M18La Sierrita34.613.67%M37Villa de Cos7.952.82%
M19La Zacatecana27.213.66%----
Table A3. Activity concentration of 40K.
SamplesSite NameActivity ConcentrationUncertaintiesSamplesSite NameActivity ConcentrationUncertainties
M1Bracho761.923.41%M20Lauro G. Caloca592.953.42%
M2Aquiles Serdán415.173.41%M21Lobatos880.703.41%
M3Concepción del oro centro (C_del_O_Centro)437.903.42%M22Loreto 1865.463.42%
M4Aranzazú 1423.853.44%M23Loreto 2781.093.42%
M5Aranzazú 2363.233.46%M24Los Sauces1099.713.41%
M6Aranzazú mine845.163.41%M25Mina El Bote537.743.42%
M7Capstone Gold811.913.41%M26Parque Bicentenario845.243.41%
M8Morelos685.403.45%M27Primaria Calera343.913.44%
M9El Capulín1320.073.40%M28Rancho San Pedro380.823.44%
M10El Chique 1999.933.41%M29Rincón de Bueyes1005.783.41%
M11El Chique 21079.683.41%M30San Ramón722.503.41%
M12Hancón 11222.913.40%M31Termoeléctrica521.383.42%
M13Hancón 21157.623.40%M32Deportiva Calera760.743.44%
M14El Obraje 1808.843.41%M33Deportiva Morelos503.253.43%
M15El Obraje 2870.473.41%M34Uraga 1624.013.42%
M16La Bufa Sur1048.213.40%M35Uraga 2202.633.49%
M17La Minita904.413.41%M36Vía Calera563.433.42%
M18La Sierrita741.023.41%M37Villa de Cos444.161.72%
M19La Zacatecana688.943.40%----

References

  1. Cinelli, G.; Tollefsen, T.; Bossew, P.; Gruber, V.; Bogucarskis, K.; De Felice, L.; De Cort, M. Digital version of the European Atlas of natural radiation. J. Environ. Radioact. 2019, 196, 240–252. [Google Scholar] [CrossRef] [PubMed]
  2. Isinkaye, M.O.; Emelue, H.U. Natural radioactivity measurements and evaluation of radiological hazards in sediment of Oguta Lake, South East Nigeria. J. Radiat. Res. Appl. Sci. 2015, 8, 459–469. [Google Scholar] [CrossRef]
  3. Mbonu, C.C.; Ben, U.C. Assessment of radiation hazard indices due to natural radioactivity in soil samples from Orlu, Imo State, Nigeria. Heliyon 2021, 7, e07812. [Google Scholar] [CrossRef]
  4. Chandra, K.; Proshad, R.; Dey, H.C.; Idris, A.M. A review on radionuclide pollution in global soils with environmental and health hazards evaluation. Environ. Geochem. Health 2023, 45, 9245–9266. [Google Scholar] [CrossRef]
  5. Beretka, J.; Mathew, P.J. Natural Radioactivity of Australian Building Materials, Industrial Wastes and By-products. Health Phys. 1985, 48, 87–95. [Google Scholar] [CrossRef]
  6. Bajoga, A.D.; Alazemi, N.; Shams, H.; Regan, P.H.; Bradley, D.A. Evaluation of naturally occurring radioactivity across the State of Kuwait using high-resolution gamma-ray spectrometry. Radiat. Phys. Chem. 2017, 137, 203–209. [Google Scholar] [CrossRef]
  7. Bajoga, A.D.; Al-Dabbous, A.N.; Abdullahi, A.S.; Alazemi, N.A.; Bachama, Y.D.; Alaswad, S.O. Evaluation of elemental concentrations of uranium, thorium and potassium in top soils from Kuwait. Nucl. Eng. Technol. 2019, 51, 1638–1649. [Google Scholar] [CrossRef]
  8. Krishnamoorthi, T.; Bramha, S.; Chandrasekaran, S.; Ravichandaran, R.; Sivakumar, S.; Ravisankar, R. Measurement of natural radioactivity and assessment of radiological hazard indices in soil from Tirunelveli District, Tamil Nadu, India with statistical approach. Nucl. Anal. 2025, 4, 100156. [Google Scholar] [CrossRef]
  9. Mubarak, F.; Fayez-Hassan, M.; Mansour, N.A.; Ahmed, T.S.; Ali, A. Radiological Investigation of High Background Radiation Areas. Sci. Rep. 2017, 7, 15223. [Google Scholar] [CrossRef]
  10. Yasmin, S.; Barua, B.S.; Khandaker, M.U.; Kamal, M.; Rashid, A.; Sani, S.A.; Ahmed, H.; Nikouravan, B.; Bradley, D. The presence of radioactive materials in soil, sand and sediment samples of Potenga sea beach area, Chittagong, Bangladesh: Geological characteristics and environmental implication. Results Phys. 2018, 8, 1268–1274. [Google Scholar] [CrossRef]
  11. Feng, W.; Zhang, Y.; Li, Y.; Wang, P.; Zhu, C.; Shi, L.; Hou, X.; Qie, X. Spatial distribution, risk assessment and influence factors of terrestrial gamma radiation dose in China. J. Environ. Radioact. 2020, 222, 106325. [Google Scholar] [CrossRef] [PubMed]
  12. Altıkulaç, A.; Turhan, Ş.; Gümüş, H. Activity concentration of terrestrial and anthropogenic radionuclides (226Ra, 222Rn, 232Th, 40K, and 137Cs) in soil samples. Environ. Earth Sci. 2016, 75, 41. [Google Scholar] [CrossRef]
  13. Escareño-Juárez, E.; Pardo, R.; Gascó-Leonarte, C.; Vega, M.; Sánchez-Báscones, M.I.; Barrado-Olmedo, A.I. Determination of natural uranium by various analytical techniques in soils of Zacatecas State (Mexico). J. Radioanal. Nucl. Chem. 2019, 319, 1135–1144. [Google Scholar] [CrossRef]
  14. Escareño-Juarez, E.; Jiménez-Barredo, F.; Gascó-Leonarte, C.; Barrado-Olmedo, A.I.; Vega, M. Baseline thorium concentration and isotope ratios in topsoil of Zacatecas State, Mexico. Chemosphere 2021, 268, 128915. [Google Scholar] [CrossRef]
  15. Ibraheem, A.A.; El-Taher, A.; Alruwaili, M.H.M. Assessment of natural radioactivity levels and radiation hazard indices for soil samples from Abha, Saudi Arabia. Results Phys. 2018, 11, 325–330. [Google Scholar] [CrossRef]
  16. Olarinoye, I.O.; Kolo, M.T.; Shittu, H.O.; Anumah, A.S. Estimation of indoor gamma radiation dose rate from concrete blocks constructed from tin mine tailings. J. Build. Eng. 2023, 66, 105934. [Google Scholar] [CrossRef]
  17. La Verde, G.; Raulo, A.; D’Avino, V.; Roca, V.; Pugliese, M. Radioactivity content in natural stones used as building materials in Puglia region analysed by high resolution gamma-ray spectroscopy: Preliminary results. Constr. Build. Mater. 2020, 239, 117668. [Google Scholar] [CrossRef]
  18. Guastaldi, E.; Baldoncini, M.; Bezzon, G.; Broggini, C.; Buso, G.; Caciolli, A.; Carmignani, L.; Callegari, I.; Colonna, T.; Dule, K.; et al. A multivariate spatial interpolation of airborne γ-ray data using the geological constraints. Remote Sens. Environ. 2013, 137, 1–11. [Google Scholar] [CrossRef]
  19. Kurnaz, A.; Kucukomeroglu, B.; Damla, N.; Cevik, U. Radiological maps for Trabzon, Turkey. J. Environ. Radioact. 2011, 102, 393–399. [Google Scholar] [CrossRef]
  20. Santhanabharathi, B.; Ahmed, M.S.; Chandrasekaran, A.; Priyadharshini, M.; Pradhoshini, K.P.; Aarthi, M.; Sathish, V.; Krishnamoorthy, R.; Duong, V.-H.; Rahman, I.M.; et al. Spatial distribution and radiological risk assessment of natural radionuclides in sediments from Kayamkulam Estuary, Kerala. Environ. Pollut. Manag. 2025, 2, 77–86. [Google Scholar] [CrossRef]
  21. Kaintura, S.S.; Devi, S.; Tiwari, K.; Thakur, S.; Sebastian, R.; Singh, P.P. Gamma-spectroscopic assessment of radionuclides and radiological hazards in undisturbed and cultivated soils of Rupnagar, Punjab, India. Nucl. Eng. Technol. 2025, 57, 103418. [Google Scholar] [CrossRef]
  22. Aközcan, S.; Külahcı, F.; Mercan, Y. A suggestion to radiological hazards characterization of 226Ra, 232Th, 40K and 137Cs: Spatial distribution modelling. J. Hazard. Mater. 2018, 353, 476–489. [Google Scholar] [CrossRef] [PubMed]
  23. Ogundele, L.T.; Ayeku, P.O.; Inuyomi, S.O.; Ogunsakin, O.M.; Oladejo, O.F.; Adejoro, I.A. Assessment of naturally occurring 40K, 232Th and 238U and their associated radiological hazard indices in soils used for building in Ondo West Local Government Area, Southwestern, Nigeria. EQA Int. J. Environ. Qual. 2020, 37, 11–21. [Google Scholar] [CrossRef]
  24. Reddy, G.S.; Reddy, K.V.K.; Reddy, B.S.; Reddy, M.S.; Reddy, C.G.; Reddy, P.Y. Mapping of ambient gamma radiation levels and risk assessment in some parts of Eastern Deccan Plateau, India. Int. J. Environ. Anal. Chem. 2023, 103, 5355–5367. [Google Scholar] [CrossRef]
  25. Narayana, Y.; Rajashekara, K.M. The importance of physico-chemical parameters on the speciation of natural radionuclides in riverine ecosystems. J. Environ. Radioact. 2010, 101, 958–964. [Google Scholar] [CrossRef]
  26. Wikipedia. Zacatecas. Available online: https://en.wikipedia.org/wiki/Zacatecas (accessed on 21 January 2025).
  27. Wikipedia. Zacatecas. Available online: https://en.wikipedia.org/wiki/Zacatecas_(city) (accessed on 5 March 2025).
  28. Bautista-Capetillo, C. Agroclimatic Zoning of Semiarid Region of Zacatecas, Mexico. Appl. Ecol. Environ. Res. 2018, 16, 251–266. [Google Scholar] [CrossRef]
  29. Instituto Nacional de Estadística y Geografía. Conociendo Zacatecas; Instituto Nacional de Estadística y Geografía: Aguascalientes, Mexico, 2013; Available online: https://en.www.inegi.org.mx (accessed on 4 April 2025).
  30. Instituto Nacional de Estadística y Geografía. Aspectos Geográficos de Zacatecas; Instituto Nacional de Estadística y Geografía: Aguascalientes, Mexico, 2021. [Google Scholar]
  31. Instituto Nacional de Estadística y Geografía. Aspectos Geográficos de Zacatecas, Compendio 2022; Instituto Nacional de Estadística y Geografía: Aguascalientes, Mexico, 2023; Available online: https://www.inegi.org.mx/ (accessed on 4 April 2025).
  32. Iaea. Guidelines for Radioelement Mapping Using Gamma Ray Spectrometry Data; IAEA-TECDOC-1363; Iaea: Vienna, Austria, 2003. [Google Scholar]
  33. ISO 18589-1:2005; Measurement of Radioactivity in the Environment—Soil Part 1: General Guidelines and Definitions. British Standards Institution (BSI): London, UK, 2008.
  34. Gilmore, G. Practica Gamma-Ray Spectrometry, 2nd ed.; John Wiley & Sons, Ltd.: Hoboken, NJ, USA, 2008. [Google Scholar]
  35. Cember, H.; Johnson, T.E. Introduction to Health Physics, 4th ed.; McGraw Hill Companies, Inc.: New York, NY, USA, 2008. [Google Scholar]
  36. Magil, J.; Galy, J. Radioactivity, Radionuclides, Radiation; Springer: Berlin/Heidelberg, Germany, 2005. [Google Scholar]
  37. Canberra Industries. Genie-2000 Spectroscopy Software Operations, Edition 3.2.1. ed; Canberra Industries: Meriden, CT, USA, 2009. [Google Scholar]
  38. Done, L.; Ioan, M.-R. Minimum Detectable Activity in gamma spectrometry and its use in low level activity measurements. Appl. Radiat. Isot. 2016, 114, 28–32. [Google Scholar] [CrossRef]
  39. Pamela, D.G.; Anna, B. Semi-Annual Report of the Department of Energy, Office of Environmental Management, Quality Assessment Program; Department of Energy: New York, NY, USA, 2001. [Google Scholar]
  40. Ramírez, D.H.; Martínez, C.R.; Vega, J.L.P.; Espinosa, A.Z.L.; Mauricio, V.H. Calibración semi-empírica de un detector de germanio hiperpuro para mediciones in situ de radionúclidos naturales. Investig. Científica 2020, 14, 53–61. [Google Scholar]
  41. Al-Masri, M.S.; Doubal, A.W. Validation of in situ and laboratory gamma spectrometry measurements for determination of 226Ra, 40K and 137Cs in soil. Appl. Radiat. Isot. 2013, 75, 50–57. [Google Scholar] [CrossRef]
  42. Muller, G. Index of geoaccumulation in sediments of the Rhine river. Geol. J. 1969, 2, 108–118. [Google Scholar]
  43. Wang, L.; Dai, L.; Li, L.; Liang, T. Multivariable cokriging prediction and source analysis of potentially toxic elements (Cr, Cu, Cd, Pb, and Zn) in surface sediments from Dongting Lake, China. Ecol. Indic. 2018, 94, 312–319. [Google Scholar] [CrossRef]
  44. UNSCEAR. Sources and Effects of Ionising Radiation; United Nations Publications: New York, NY, USA, 2000; Volume 1. [Google Scholar]
  45. Ion, A.; Cosac, A.; Ene, V.V. Natural Radioactivity in Soil and Radiological Risk Assessment in Lișava Uranium Mining Sector, Banat Mountains, Romania. Appl. Sci. 2022, 12, 12363. [Google Scholar] [CrossRef]
  46. Boukhalfa, S.; Khelifi, R. Gamma-ray Spectrometry and X-ray Fluorescence Analysis for Natural Radioactivity Evaluation Associated with Radiation Hazard in Construction Materials. Jordan J. Phys. 2023, 16, 207–214. [Google Scholar] [CrossRef]
  47. Tufail, M.; Nasim-Akhtar; Sabiha-Javied; Hamid, T. Natural radioactivity hazards of building bricks fabricated from saline soil of two districts of Pakistan. J. Radiol. Prot. 2007, 27, 481–492. [Google Scholar] [CrossRef]
  48. Tufail, M. Radium equivalent activity in the light of UNSCEAR report. Environ. Monit. Assess. 2012, 184, 5663–5667. [Google Scholar] [CrossRef]
  49. Hamilton, E.I. The Relative Radioactivity of Building Materials. Am. Ind. Hyg. Assoc. J. 1971, 32, 398–403. [Google Scholar] [CrossRef]
  50. United Nations Scientific Committee on the Effects of Atomic Radiation. Sources and Effects of Ionizing Radiation. UNSCEAR 2008 Report to the General Assembly; United Nations Scientific Committee on the Effects of Atomic Radiation: Vienna, Austria, 2008. [Google Scholar]
  51. Instituto Nacional de Estadística y Geografía. Esperanza de Vida al Nacimiento Por Entidad Federativa Según Sexo, Serie Anual de 2010 a 2024; INEGI: Aguascalientes, México, 2024. [Google Scholar]
  52. ICRP. The 2007 Recommendations of the International Commission on Radiological Protection; Ann ICRP: London, UK, 2007; Volume ICRP-103. [Google Scholar]
  53. Team, R.C. R: A Language and Environment for Statistical Computing, Edition 4.4.2. ed; R Foundation for Statistical Computing: Vienna, Austria, 2024; Available online: https://www.R-project.org/ (accessed on 21 January 2025).
  54. Komsta, L.; Novomestky, F. Moments: Moments, Cumulants, Skewness, Kurtosis and Related Tests, 2022; 0.14.1. Available online: https://CRAN.R-project.org/package=moments (accessed on 21 January 2025).
  55. Wei, T.; Simko, V. R package ‘corrplot’: Visualization of a Correlation Matrix, 2024; 0.95. Available online: https://github.com/taiyun/corrplot (accessed on 21 January 2025).
  56. Siegel, S.; Castellan, N.J. Estadística no Paramétrica Aplicada a las Ciencias de la Conducta, 4th ed.; Trillas: Miami Lakes, FL, USA, 1995. [Google Scholar]
  57. Xu, R.; Wunsch, I.D.C. Clustering; John Wiley & Sons, Inc: New York, NY, USA, 2009. [Google Scholar]
  58. Li, X.; Feng, L. Multivariate and geostatistical analyzes of metals in urban soil of Weinan industrial areas, Northwest of China. Atmos. Environ. 2012, 47, 58–65. [Google Scholar] [CrossRef]
  59. Maechler, M.; Rousseeuw, P.; Struyf, A.; Hubert, M.; Hornik, K. Cluster: Cluster Analysis Basics and Extensions, 2023; 2.1.6. Available online: https://CRAN.R-project.org/package=cluster (accessed on 21 January 2025).
  60. Galili, T. Dendextend: An R package for visualizing, adjusting and comparing trees of hierarchical clustering. Bioinformatics 2015, 31, 3718–3720. [Google Scholar] [CrossRef]
  61. Kassambara, A. Multivariate Analysis II: Practical Guide to Principal Component Methods in R, 1st ed.; STHDA: Stanford, CA, USA, 2017; Volume II. [Google Scholar]
  62. Palacio, F.X.; Apodaca, M.J.; Crisci, J.V. Análisis Multivariado para Datos Biológicos: Teoría y sus Aplicaciones Utilizando el Lenguaje R, 1st ed.; Fundación de Historia Natural Félix de Azara: Buenos Aires, Argentina, 2020. [Google Scholar]
  63. Malinowski, E.R. Factor Analysis in Chemistry, 3rd ed.; John Wiley & Sons, Inc.: New York, NY, USA, 2002. [Google Scholar]
  64. Kassambara, A.; Mundt, F. Factoextra: Extract and Visualize the Results of Multivariate Data Analyses, 2020; 1.0.7. Available online: https://CRAN.R-project.org/package=factoextra (accessed on 21 January 2025).
  65. Benedikt, G.; Pebesma, E.; Heuvelink, G. Spatio-Temporal Interpolation using gstat. R. J. 2016, 8, 204–218. [Google Scholar]
  66. Pebesma, E.J. Multivariable geostatistics in S: The gstat package. Comput. Geosci. 2004, 30, 683–691. [Google Scholar] [CrossRef]
  67. Hijmans, R.J. Terra: Spatial Data Analysis, 2024; 1.7-83. Available online: https://CRAN.R-project.org/package=terra (accessed on 21 January 2025).
  68. Li, J.; Heap, A.D. A review of comparative studies of spatial interpolation methods in environmental sciences: Performance and impact factors. Ecol. Inform. 2011, 6, 228–241. [Google Scholar] [CrossRef]
  69. Yeşilkanat, C.M.; Kobya, Y.; Taşkin, H.; Çevik, U. Dose rate estimates and spatial interpolation maps of outdoor gamma dose rate with geostatistical methods; A case study from Artvin, Turkey. J. Environ. Radioact. 2015, 150, 132–144. [Google Scholar] [CrossRef] [PubMed]
  70. Moraga, P. Spatial Statistics for Data Science: Theory and Practice with R, 1st ed.; Data Science Series; Chapman & Hall/CRC Data: New York, NY, USA, 2023. [Google Scholar]
  71. Moraga, P. Geospatial Health Data: Modeling and Visualization with R-INLA and Shiny; Biostatistics Series; Chapman & Hall/CRC: New York, NY, USA, 2019. [Google Scholar]
  72. Venables, W.N.; Ripley, B.D. Modern Applied Statistics with S, 4th ed.; Springer: New York, NY, USA, 2002; Available online: https://www.stats.ox.ac.uk/pub/MASS4/ (accessed on 5 March 2025).
  73. Bivand, R. R Packages for Analyzing Spatial Data: A Comparative Case Study with Areal Data. Geogr. Anal. 2022, 54, 488–518. [Google Scholar] [CrossRef]
  74. Bivand, R.S.; Wong, D.W.S. Comparing implementations of global and local indicators of spatial association. Test 2018, 27, 716–748. [Google Scholar] [CrossRef]
  75. Pebesma, E.; Bivand, R. Spatial Data Science; Chapman and Hall/CRC: New York, NY, USA, 2023. [Google Scholar] [CrossRef]
  76. Bivand, R.S.; Pebesma, E.; Gómez-Rubio, V. Applied Spatial Data Analysis with R; Springer: New York, NY, USA, 2013. [Google Scholar] [CrossRef]
  77. Hastie, T.; Tibshirani, R.; Friedman, J.H. The Elements of Statistical Learning: Data Mining, Inference, and Prediction; Series in Statistics; Springer: New York, NY, USA, 2009; Available online: https://books.google.com.mx/books?id=eBSgoAEACAAJ (accessed on 17 February 2024).
  78. Balzarini, M.; Bruno, C.; Córdoba, M.; Teich, I. Herramientas en el Análisis Estadístico Multivariado; Editorial Universidad del Norte: Barranquilla, Colombia, 2015. [Google Scholar]
  79. Chávez, A.G. 100 Problemas Resueltos de Estadística Multivariante Implementados en Matlab; Delta Publicaciones: Kiel, WI, USA, 2007; Available online: https://books.google.com.mx/books?id=mejciP3IAygC (accessed on 14 October 2023).
  80. Mardia, K.V.; Kent, J.T.; Kent, J.T.; Bibby, J.M. Multivariate Analysis in Probability and Mathematical Statistics: A Series of Monographs and Textbooks; Academic Press: New York, NY, USA, 1979. [Google Scholar]
  81. Härdle, W.K.; Simar, L. Applied Multivariate Statistical Analysis; Springer: Berlin/Heidelberg, Germany, 2013. [Google Scholar] [CrossRef]
  82. Johnson, R.A.; Wichern, D.W. Applied Multivariate Statistical Analysis, 6th ed.; PearsonPrentice Hall: Upper Saddle River, NJ, USA, 2007. [Google Scholar]
Figure 1. Location of the State of Zacatecas in the Mexican Republic and location of the sampling points in the State.
Analytica 06 00020 g001
Figure 2. Calibration curves of the GeRe-3522 detection system: (a) energy calibration and linear fit; (b) efficiency calibration and mixed rational fit.
Analytica 06 00020 g002
Figure 3. Histograms of the activity concentration: (a) 226Ra, (b) 232Th and (c) 40K.
Analytica 06 00020 g003
Figure 4. Histograms of geoaccumulation indices: (a) Igeo 226Ra, (b) Igeo 232Th and (c) Igeo 40K.
Analytica 06 00020 g004
Figure 5. Correlation matrix of the geoaccumulation index and radiological risk indices.
Analytica 06 00020 g005
Figure 6. Biplot PCA—radiological analysis, dimensions, variables and sampling sites.
Analytica 06 00020 g006
Figure 7. Cluster analysis in Q mode: clusters on the principal components of k-means clustering. Yellow and pink shaded areas delineate convex hulls around clusters 2 and 3, respectively.
Analytica 06 00020 g007
Figure 8. Cluster analysis in R mode: clusters on the principal components of k-means clustering.
Analytica 06 00020 g008
Figure 9. Geographical distribution of clusters: hierarchical relationships on the map.
Analytica 06 00020 g009
Figure 10. Spatial distribution of geoaccumulation indices and radiological risk index: (a) Igeo 226Ra, (b) Igeo 232Th, (c) Igeo 40K and (d) Absorbed dose ratio.
Analytica 06 00020 g010
Table 1. Sampling sites in the state of Zacatecas, Mexico.
SamplesSite NameLatitudeLongitudeSamplesSite NameLatitudeLongitude
M1Bracho22.7933−102.5553M20Lauro G. Caloca22.9514−102.7152
M2Aquiles Serdán24.6142−101.4141M21Lobatos22.858−103.3933
M3Concepción del oro centro (C_del_O_Centro)24.6213−101.4086M22Loreto 122.2705−101.9213
M4Aranzazú 124.6213−101.4075M23Loreto 222.2693−101.9381
M5Aranzazú 224.6212−101.4126M24Los Sauces23.0016−103.4475
M6Aranzazú mine24.6206−101.4109M25Mina El Bote22.7876−102.61
M7Capstone Gold22.7909−102.5794M26Parque Bicentenario22.7814−102.5449
M8Morelos22.8563−102.6044M27Primaria Calera22.9435−102.6942
M9El Capulín22.8408−103.5888M28Rancho San Pedro22.8554−102.6879
M10El Chique 121.9986−102.8953M29Rincón de Bueyes22.792−103.613
M11El Chique 221.9885−102.8917M30San Ramón22.6765−102.525
M12Hancón 123.4695−102.9652M31Termoeléctrica22.9832−102.6947
M13Hancón 223.475−102.9644M32Deportiva Calera22.9365−102.7081
M14El Obraje 122.1842−101.6065M33Deportiva Morelos22.8543−102.6069
M15El Obraje 222.1747−101.635M34Uraga 122.8745−102.6083
M16La Bufa Sur22.7768−102.5644M35Uraga 222.874−102.6088
M17La Minita22.93−103.2625M36Vía Calera22.9523−102.6844
M18La Sierrita22.6958−103.7291M37Villa de Cos23.3026−102.3592
M19La Zacatecana22.7224−102.4865----
Table 2. Principal component analysis results for the first three dimensions, showing eigenvalues, explained variance, and variable correlations (p-values).
EigenvalueVariance
Percent
Cumulative
Variance
Percent
VariablesCorrelation
(p Value)
Dim. 110.0386.2186.21D (Absorbed dose rate)0.9956 (1.11 × 10−37)
AEDE (Annual effective dose equivalent)0.9956 (1.11 × 10−37)
ELCR × 10−3 (Excess lifetime cancer risk)0.9956 (1.11 × 10−37)
Hex (External hazard index)0.9948 (2.06 × 10−36)
Raeq (radium equivalent activity)0.9948 (2.10 × 10−36)
Hin (Internal hazard index)0.9876 (9.59 × 10⁻³⁰)
A_thorium_232 (activity concentration 232Th)0.9098 (9.59 × 10⁻³⁰)
A_Potassium_40 (activity concentration 40K)0.9002 (3.39 × 10⁻¹⁴)
I_geo_Th_232 (Igeo 232Th)0.8950 (7.93 × 10⁻¹⁴)
I_geo_K_40 (Igeo 40K)0.8920 (1.26 × 10⁻¹³)
I_geo_Ra_226 (Igeo 226Ra)0.7929 (4.88 × 10⁻⁹)
A_radium_226 (activity concentration 226Ra)0.7433 (1.36 × 10⁻⁷)
Dim. 20.957.9494.15A_radium_226 (activity concentration 226Ra)0.6521 (1.22 × 10⁻⁵)
I_geo_Ra_226 (Igeo 226Ra)0.5260 (8.25 × 10⁻⁴)
Dim. 30.373.1297.28I_geo_K_40 (Igeo 40K)0.3404 (0.039)
A_thorium_232 (activity concentration 232Th)−0.3641 (0.027)
Table 3. Statistics of geospatial interpolations.
VariableRMSEMAEPseudo R2ModelNuggetSillKappaRange (m)
Igeo226Ra0.7540.4580.316Ste0.7341.2231057,420.02
Igeo 232Th0.9080.6000.372Ste1.0857.32310359,346.8
Igeo 40K0.4940.3870.307Ste0.2690.3521018,033.37
Raeq(Bqkg−1)31.42924.0140.668Gau889.3015328.633-71,039.08
D(nGyh−1)14.90011.2020.663Gau204.3381118.800-65,635.04
AEDE(μSvy−1)18.27313.7400.663Gau307.3351682.739-65,635.04
Hex0.0850.0650.668Gau0.0060.330-71,036.06
Hin0.1080.0840.636Gau0.0100.059-68,692.92
ELCR × 10−30.0790.0590.663Gau0.0060.031-65,635.04
Disclaimer/Publisher’s Note: The statements, opinions and data contained in all publications are solely those of the individual author(s) and contributor(s) and not of MDPI and/or the editor(s). MDPI and/or the editor(s) disclaim responsibility for any injury to people or property resulting from any ideas, methods, instructions or products referred to in the content.

