
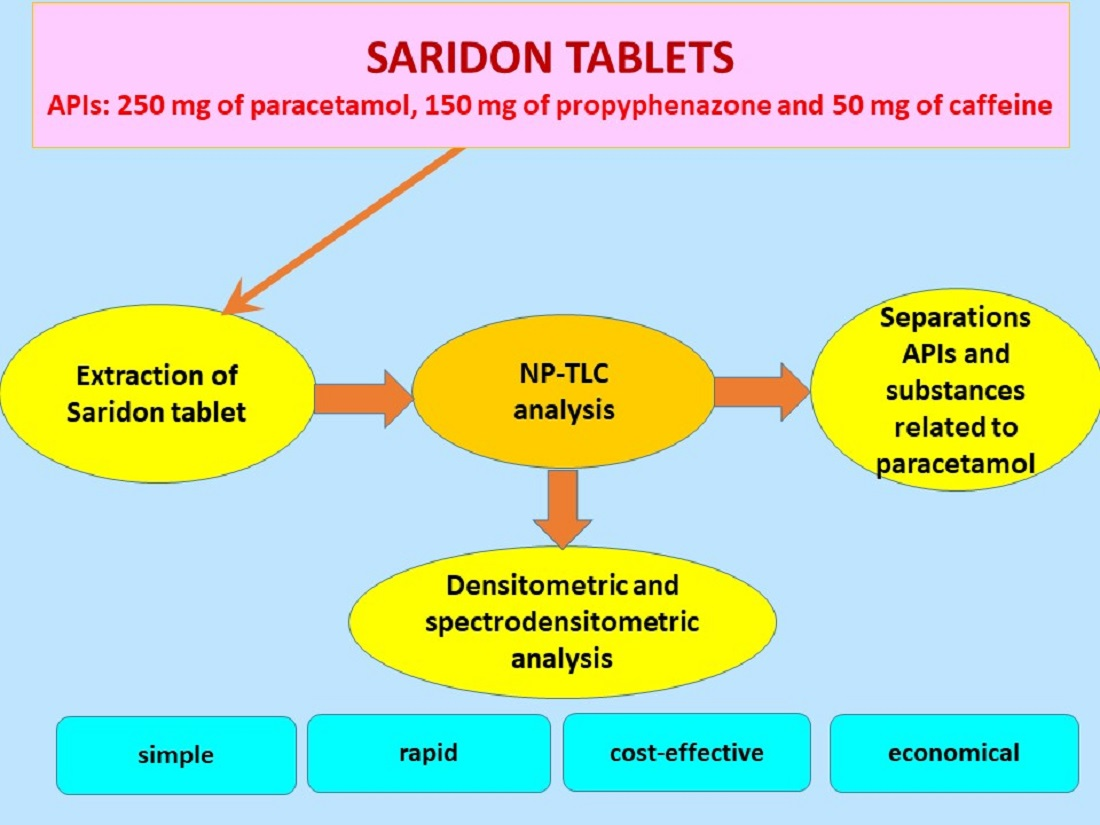
Determination of the Active Pharmaceutical Ingredients in Saridon Tablets Using an Economical and Sensitive Thin Layer Chromatography Method Combined with Densitometry


Abstract

1. Introduction
2. Materials and Methods
2.1. Chemicals and Reference Standards
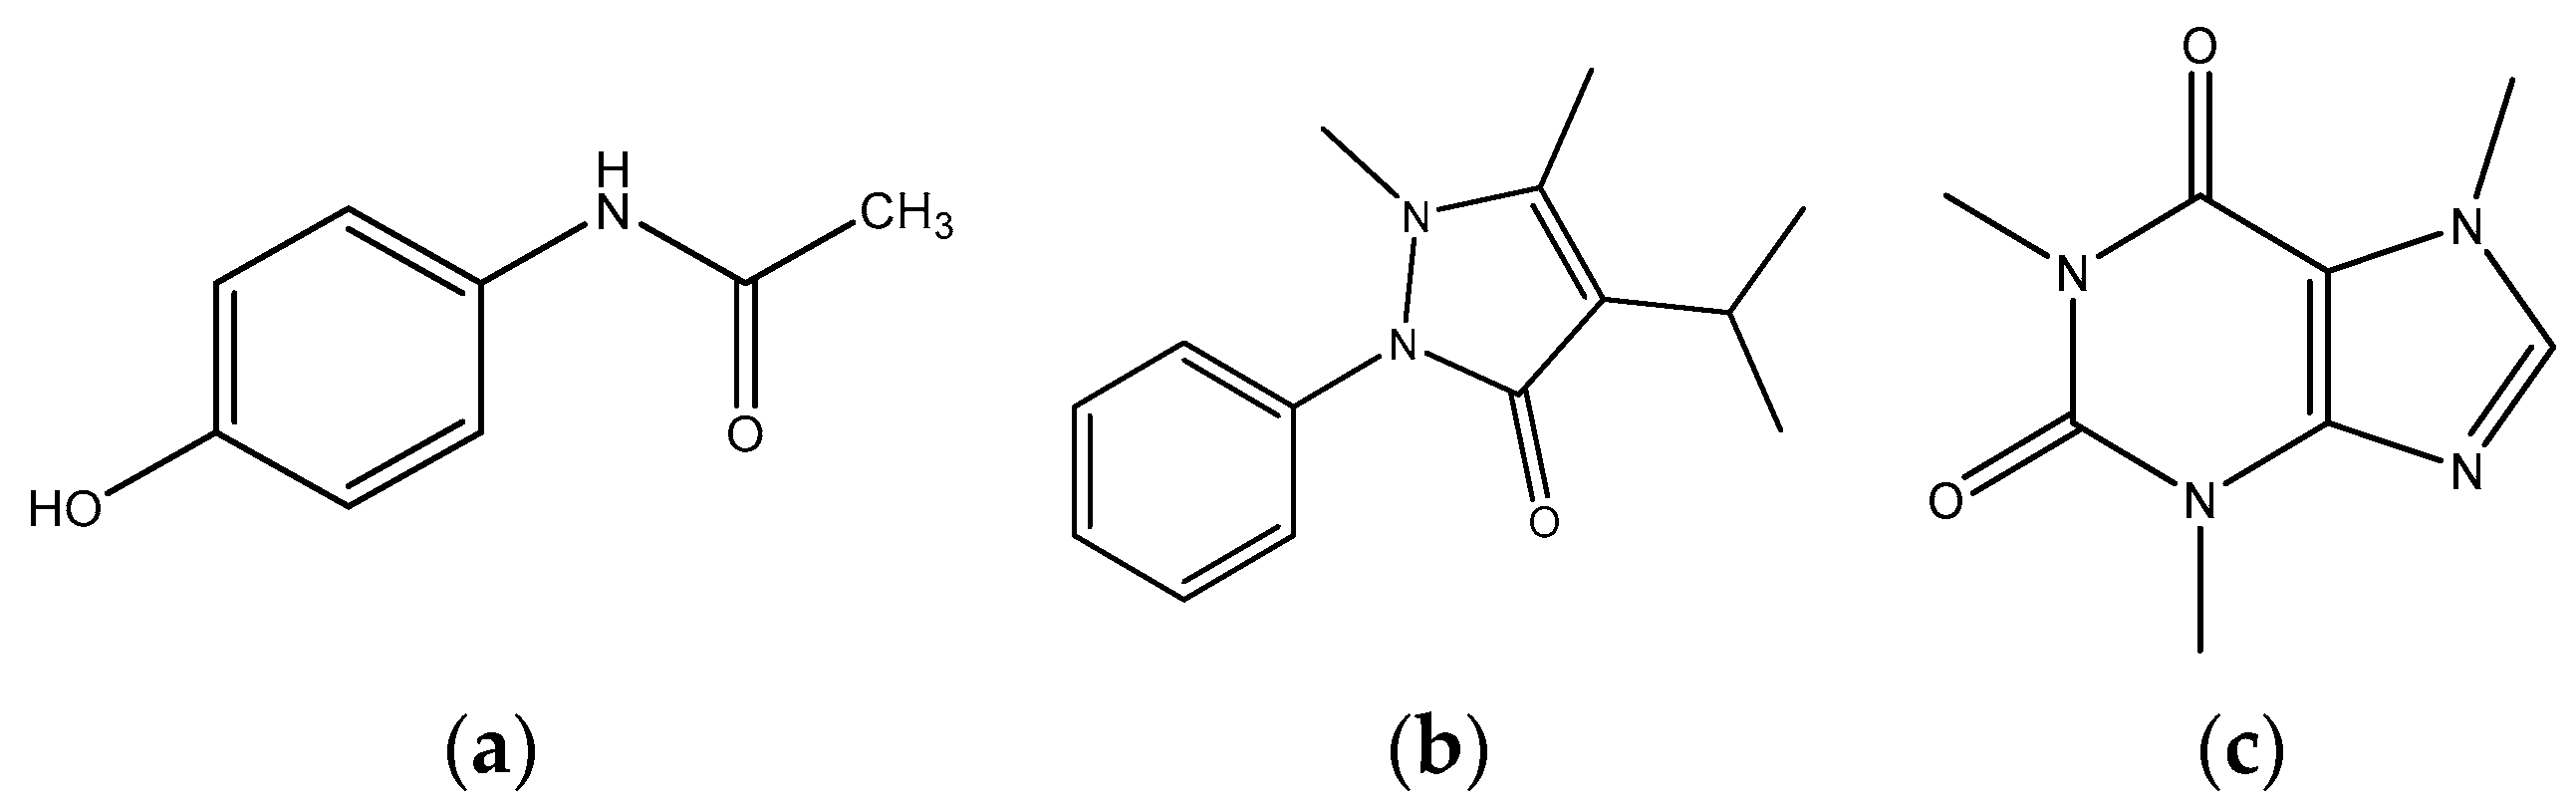
2.2. Preparation of Standard Solutions of Propyphenazone, Paracetamol and Caffeine as Well as Potential Impurities
2.3. Preparation of Saridon Drug Solutions
- 30 mg (A1), 20 mg (A2), 10 mg (A3) of propyphenazone,
- 30 mg (A4), 20 mg (A5), 10 mg (A6) of paracetamol,
- 30 mg (A7), 20 mg (A8), 10 mg (A9) of caffeine.
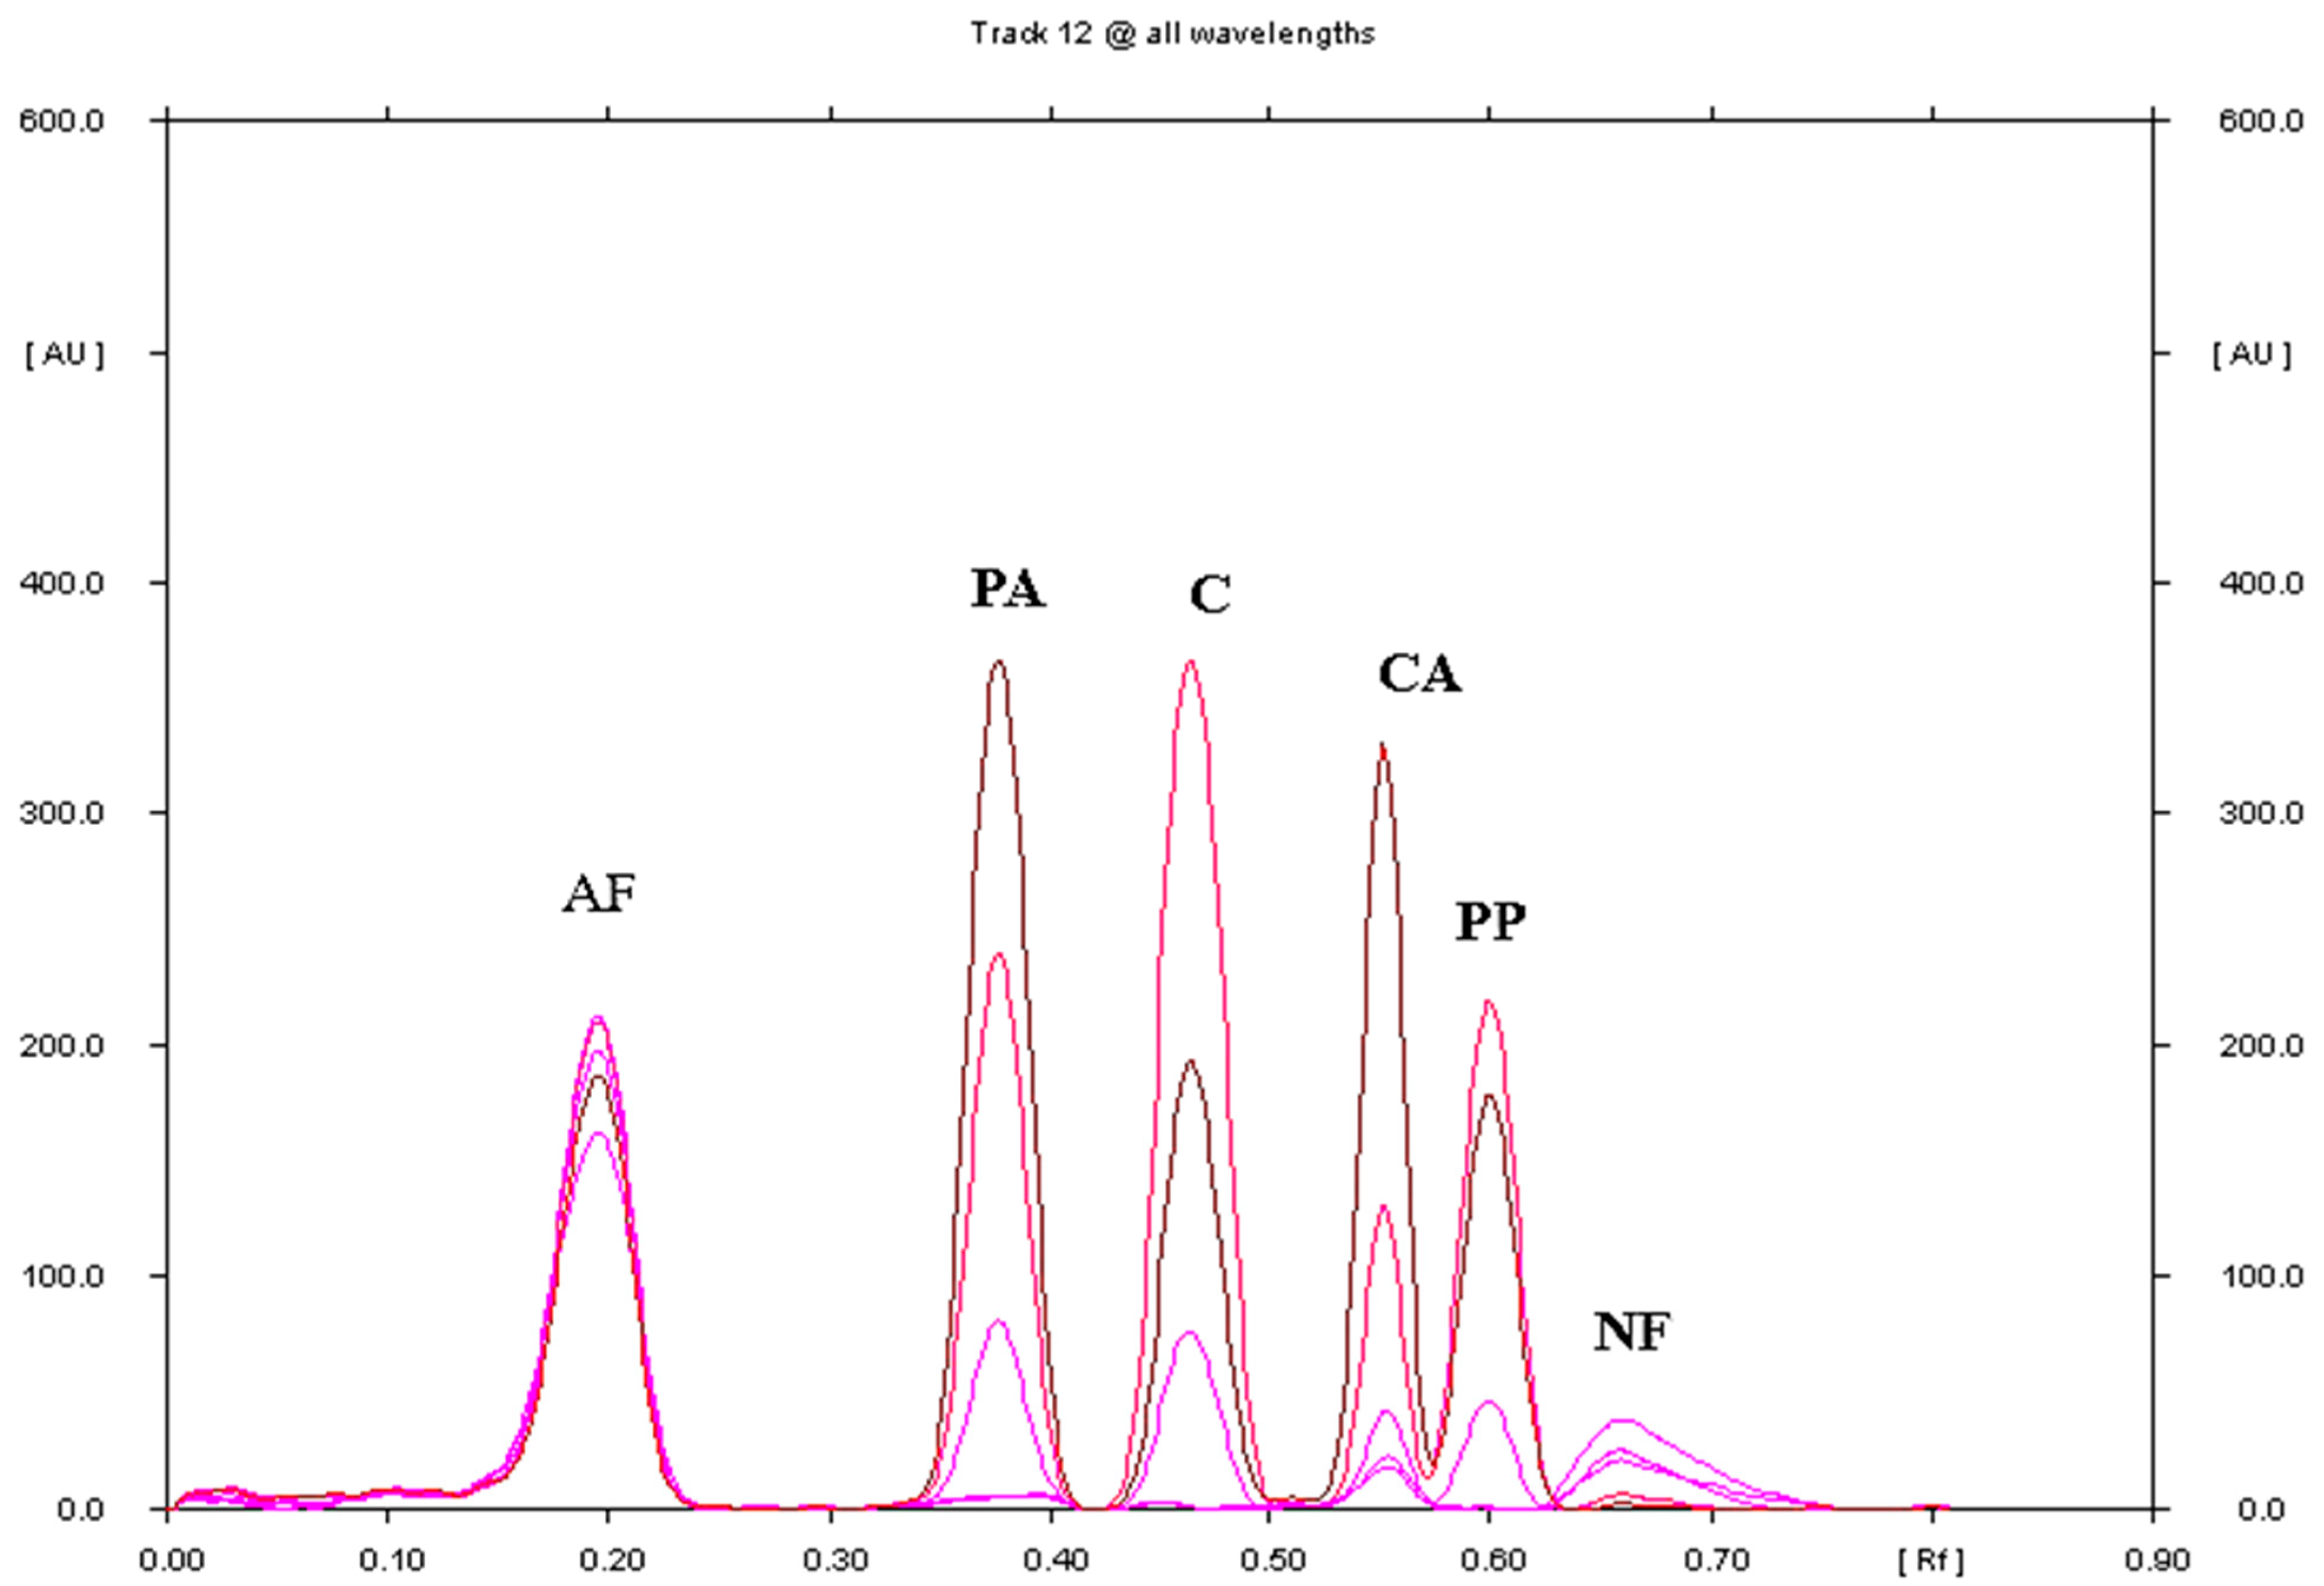
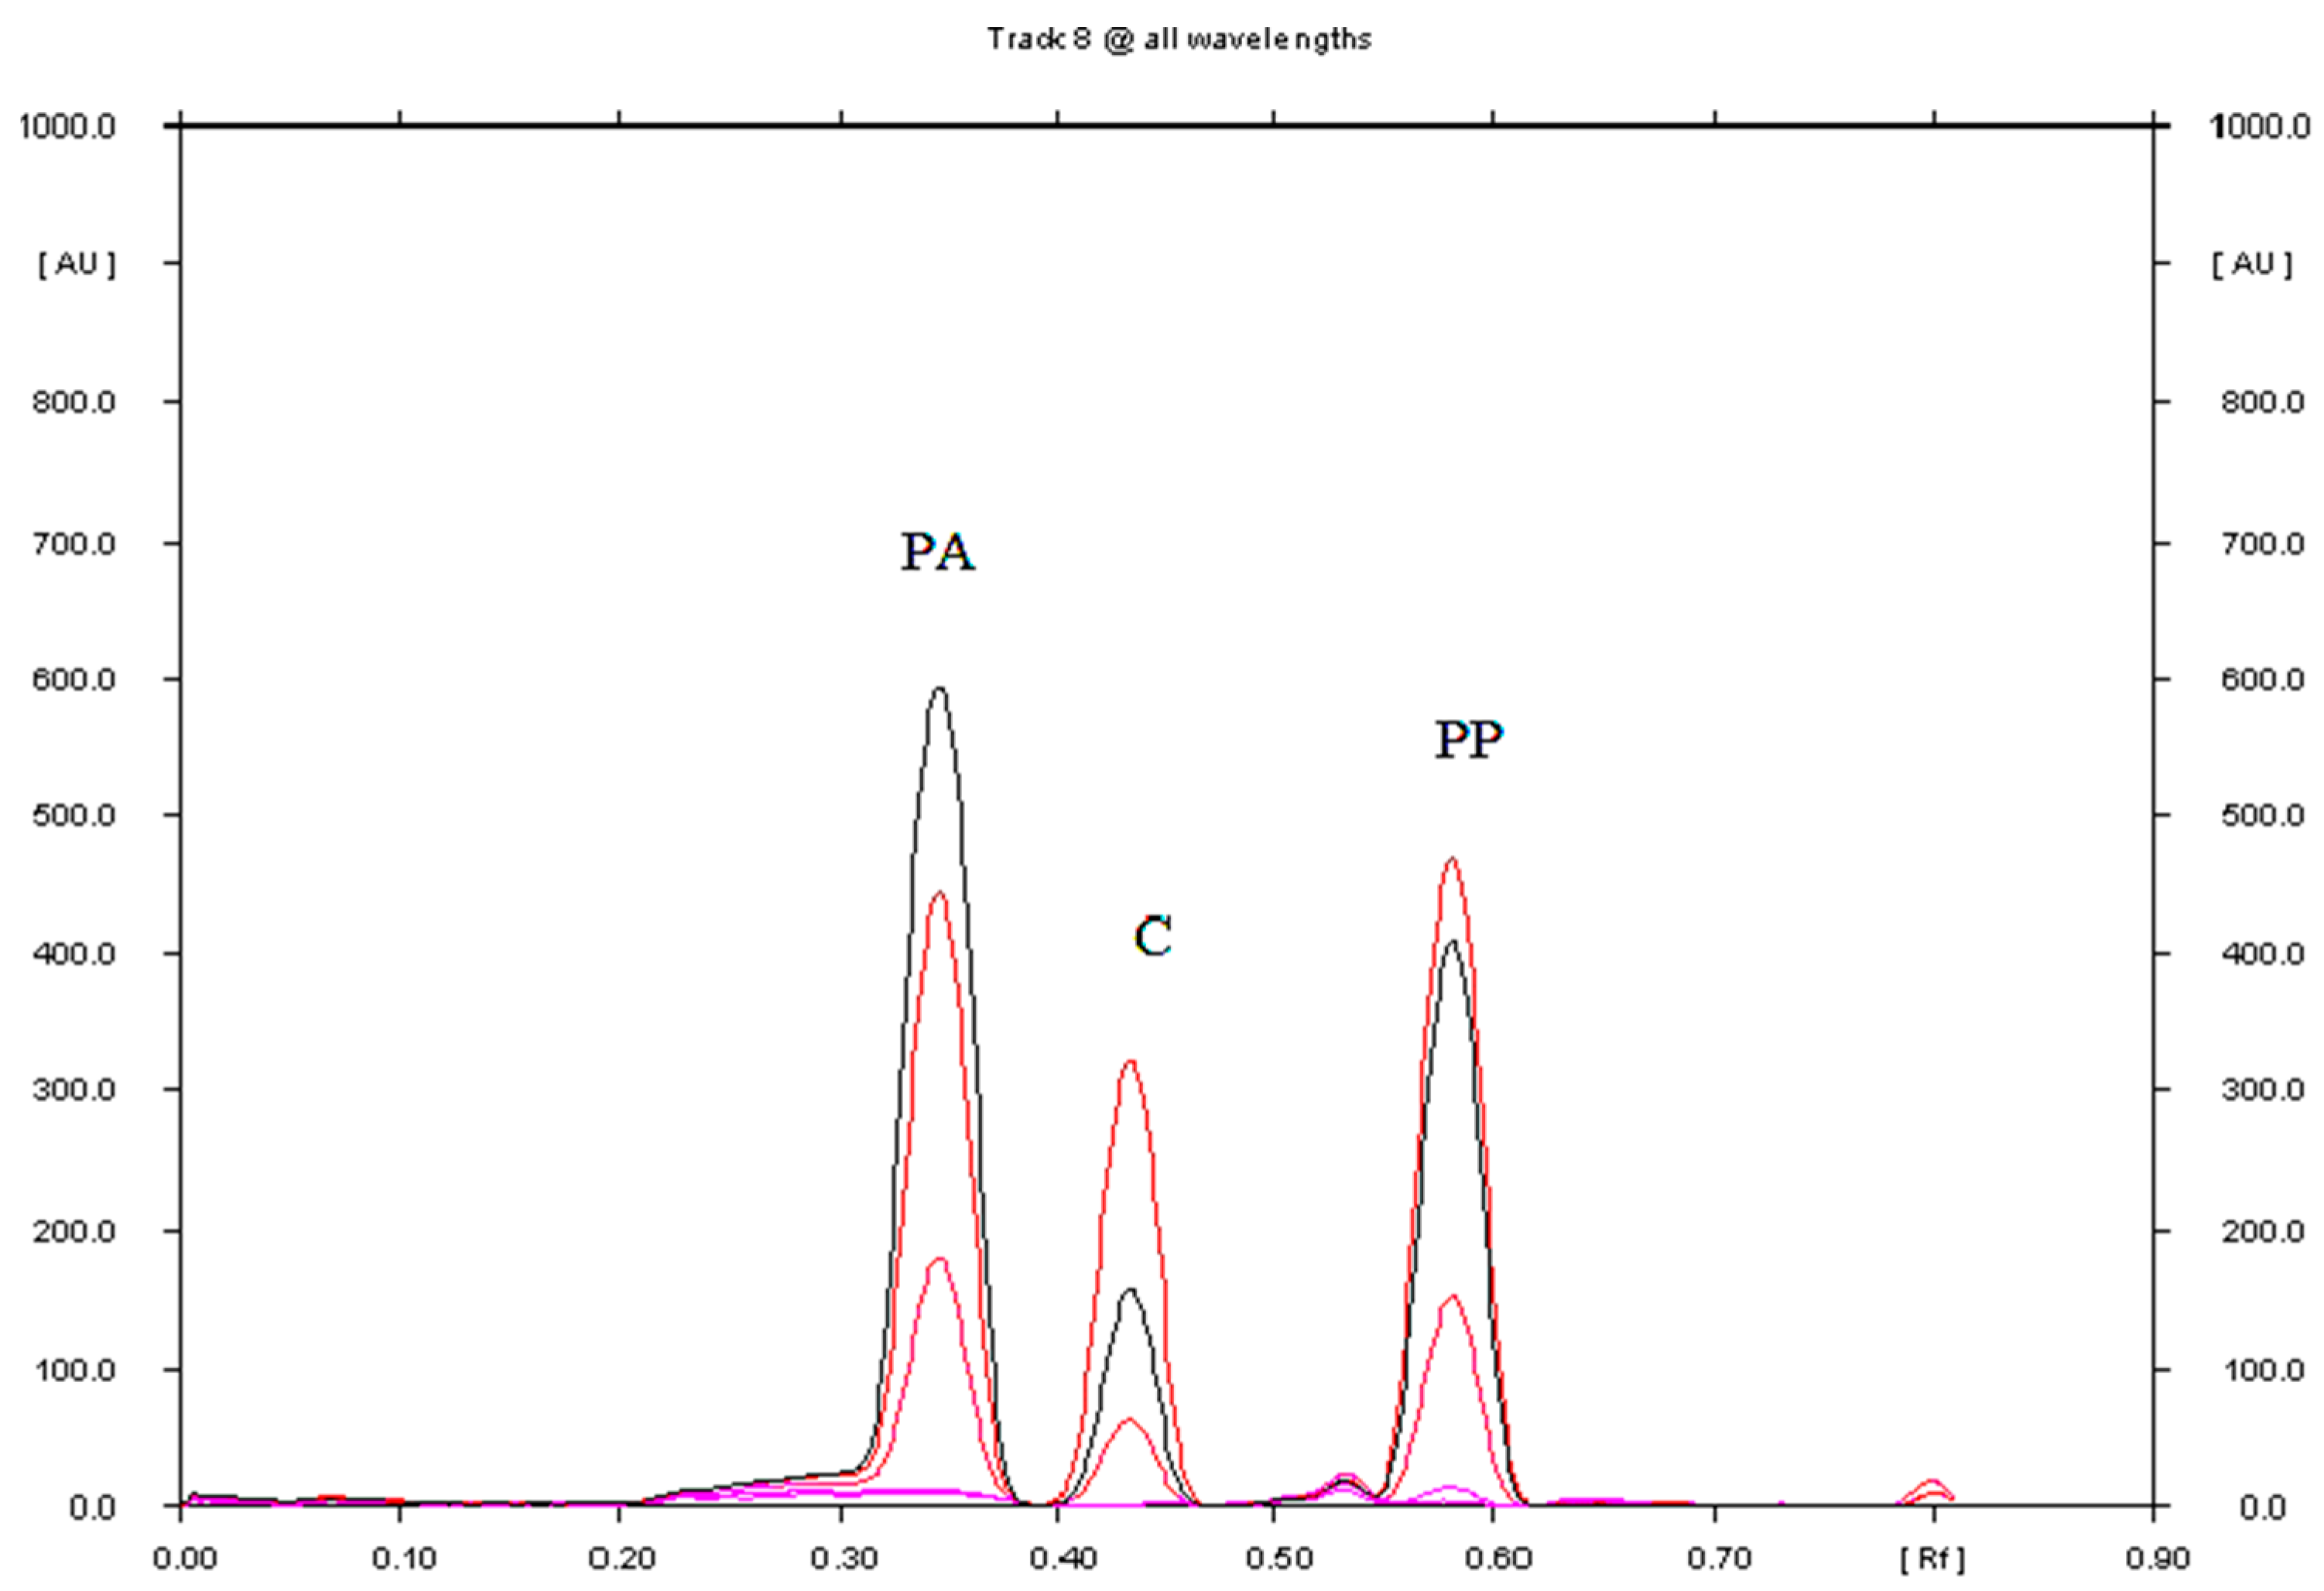
2.4. Description of the Conditions of TLC Combined with Densitometry
2.5. Thin Layer Chromatography (TLC) Method Validation
2.6. Quantitative Determination of PA, PP and C in Saridon and Comparison with the Literature Method
2.7. Statistical Analysis
3. Results and Discussion
3.1. Validation
3.1.1. Selection of Chromatographic Conditions


3.1.2. Linearity and Range

| Method Characteristic | Results | |||
|---|---|---|---|---|
| Paracetamol | Propyphenazone | Caffeine | ||
| Retardation factor (Rf) | 0.38 ± 0.04 | 0.60 ± 0.02 | 0.47 ± 0.03 | |
| Range [μg/spot] | 0.4–4.0 | 0.8–4.0 | 0.4–4.0 | |
| Linearity [μg/spot] A = a·X + b | a | 3462.8 (±26.6) | 3598.2 (±36.8) | 3317.4 (±30.5) |
| b | 3083.5 (±66.0) | 33,645.6 (±96.2) | 4211.3 (±75.7) | |
| n | 10 | 9 | 10 | |
| r | 0.9918 | 0.9996 | 0.9997 | |
| LOD [(µg/spot] | 0.016 | 0.032 | 0.054 | |
| LOQ [(µg/spot] | 0.048 | 0.096 | 0.162 | |
| For tablets | ||||
| Accuracy | ||||
| for 50% standard added (n = 6) | R = 100.2%; CV = 1.77% | R = 99.0%; CV = 2.12% | R = 99.7%; CV = 1.60% | |
| for 100% standard added (n = 6) | R = 100.0%; CV = 2.47% | R = 98.8%; CV = 2.68% | R = 100.2%; CV = 1.66% | |
| for 150% standard added (n = 6) | R = 99.6%; CV = 2.11% | R = 98.4%; CV = 1.98% | R = 99.2%; CV = 1.17% | |
| Precision (CV, [%]) | ||||
| Intraday | ||||
| for 3 µg/spot (n = 3) | 0.35 | 1.10 | 0.75 | |
| for 2 µg/spot (n = 3) | 1.56 | 0.92 | 1.08 | |
| for 1 µg/spot (n = 3) | 1.10 | 0.68 | 1.02 | |
| Inter-day | ||||
| for 3 µg/spot (n = 3) | 0.79 | 1.26 | 0.82 | |
| for 2 µg/spot (n = 3) | 1.23 | 0.53 | 0.93 | |
| for 1 µg/spot (n = 3) | 1.54 | 0.73 | 1.06 | |
| Robustness (CV, [%]) | robust | robust | robust | |
3.1.3. Precision
3.1.4. Accuracy
3.1.5. Limit of Detection (LOD) and Limit of Quantification (LOQ) of the Investigated APIs and Comparison with the Literature Data
| Method | Stationary Phase | Mobile Phase | LOD and LOQ [µg/spot] of | Ref | ||
|---|---|---|---|---|---|---|
| PA | PP | C | ||||
| NP-TLC | Silica gel 60F254 | Chloroform + toluene+ ethyl acetate + methanol+ acetic acid (6:6:1:2:0.1 v/v) | LOD: 1.50 LOQ: 4.54 | LOD = 1.59 LOQ = 4.83 | LOD: 1.21 LOQ: 3.67 | [24] |
| NP-TLC | Silica gel GF254 | Dichloromethane + methanol + acetone + glacial acetic acid (9:1:0.5:0.3, v/v) | LOD: 0.3 LOQ: 1.0 | - | LOD: 0.15 LOQ: 0.5 | [14] |
| NP-TLC | Silica gel 60F254 | Chloroform + acetone + ammonia 25%, 39.6 + 9.9 + 0.5, v/v | LOD: 0.070 LOQ: 0.231 | - | LOD: 0.064 LOQ: 0.194 | [12] |
| NP-TLC | Silica gel 60F254 | Chloroform + acetone + ammonia 25%, 8 + 2 + 0.1, v/v | LOD: 0.09 LOQ: 0.27 | - | [38] | |
| RP-HPTLC | RP18W | Methanol+ glacial acetic acid + water, 25:4.3:70.7, v/v | LOD: 0.100 LOQ: 0.191 | - | LOD: 0.040 LOQ: 0.076 | [8] |
| HP-TLC | Silica gel 60F254 | Toluene + ethyl acetate + methanol + formic acid, 16:2:4:0.8, v/v | LOD: 0.039 LOQ: 0.118 | - | LOD: 0.041 LOQ: 0.124 | [10] |
| HP-TLC | Silica gel | Ethyl acetate + ethanol + ammonia, 9:1:0.1, v/v | LOD: 0.262 LOQ: 0.793 | - | LOD: 0.265 LOQ: 0.802 | [11] |
| NP-HPTLC | Silica gel 60F254 | Ethyl acetate + ethanol, 85:15, v/v | LOD: 0.017 LOQ: 0.051 | - | LOD: 0.017 LOQ: 0.050 | [9] |
| RP-HPTLC | Silica gel | Ethanol + water, 50:50, v/v | LOD: 0.0087 LOQ: 0.0256 | - | LOD: 0.0085 LOQ: 0.0256 | [9] |
| RP-HPTLC | RP18W | Acetonitrile + buffer pH = 5.0 | LOD: 0.12 LOQ: 0.36 | LOD: 0.06 LOQ: 0.19 | LOD: 0.09 LOQ: 0.28 | [30] |
| PPEC | RP18W | Acetonitrile + buffer pH = 5.0 | LOD: 0.08 LOQ: 0.26 | LOD: 0.04 LOQ: 0.13 | LOD: 0.10 LOQ: 0.36 | [30] |
| RP-HPTLC | Silica gel 60F254s | Ethanol-water, 55:45, v/v | - | - | LOD: 0.017 LOQ: 0.051 | [39] |
| NP.-TLC | Silica gel 60F254 | Chloroform + toluene + ethyl acetate + ethanol + acetic acid (80%) (18:18:7.5:5.0:0.3, v/v) | LOD: 0.016 LOQ: 0.048 | LOD: 0.032 LOQ: 0.096 | LOD: 0.052 LOQ: 0.162 | in this work |
3.1.6. Robustness
| Experiment No | X1 | X2 | X3 | X4 | X5 | X6 | X7 | Active Pharmaceutical Ingredient a Content (yi) [mg·tablet−1] | |||
|---|---|---|---|---|---|---|---|---|---|---|---|
| PA | PP | C | |||||||||
| 1 | + | + | + | + | + | + | + | 245.6 | 149.1 | 49.2 | |
| 2 | + | + | − | + | − | − | − | 243.9 | 148.7 | 49.1 | |
| 3 | + | − | + | − | − | + | − | 247.6 | 150.9 | 49.8 | |
| 4 | + | − | − | − | + | − | + | 253.2 | 152.4 | 50.9 | |
| 5 | − | + | + | − | + | − | − | 249.9 | 152.4 | 50.3 | |
| 6 | − | + | − | − | − | + | + | 246.9 | 150.5 | 49.2 | |
| 7 | − | − | + | + | − | − | + | 246.3 | 150.1 | 49.1 | |
| 8 | − | − | − | + | + | + | − | 254.6 | 153.8 | 51.5 | |
| Size of effect (E) | PA | −1.850 | −3.850 | −2.300 | −1.800 | 4.650 | 0.350 | −1.000 | |||
| PP | −1.425 | −1.625 | −0.725 | −1.125 | 1.875 | 0.175 | −0.925 | ||||
| C | −0.275 | −0.875 | −0.575 | −0.325 | 1.175 | 0.075 | −0.575 | ||||
| The label claim [mg] | 250 | 150 | 50 | ||||||||
| Average amount [mg] | 248.5 | 151.0 | 49.9 | ||||||||
| Variance | 14.1 | 3.1 | 0.9 | ||||||||
| Standard deviation (SD) | 3.76 | 1.76 | 0.92 | ||||||||
| Coefficient of variation [CV, %] | 1.5 | 1.2 | 1.8 | ||||||||
3.2. Quantification of APIs in Saridon Tablets by Proposed NP-TLC–Densitometric Method and Comparison with the Literature Method
| Active Pharmaceutical Ingredients (APIs) | ||||||
|---|---|---|---|---|---|---|
| Paracetamol | Propyphenazone | Caffeine | ||||
| Determined by Methods | ||||||
| A | B | A | B | A | B | |
| Number of analysis | 10 | 10 | 10 | 10 | 10 | 10 |
| 1 | 258.8 | 248.7 | 151.0 | 148.2 | 50.0 | 49.1 |
| 2 | 250.4 | 251.5 | 151.8 | 153.1 | 51.1 | 48.2 |
| 3 | 263.4 | 257.2 | 148.5 | 146.9 | 49.5 | 50.9 |
| 4 | 253.5 | 249.4 | 147.3 | 151.8 | 50.4 | 51.8 |
| 5 | 249.1 | 262.5 | 149.4 | 152.1 | 51.2 | 48.2 |
| 6 | 260.9 | 258.7 | 149.7 | 148.7 | 49.9 | 50.2 |
| 7 | 251.2 | 252.6 | 151.2 | 149.8 | 50.3 | 49.8 |
| 8 | 253.1 | 253.5 | 150.2 | 151.6 | 49.3 | 50.3 |
| 9 | 249.8 | 251.3 | 148.7 | 152.2 | 50.7 | 49.5 |
| 10 | 250.5 | 247.2 | 149.6 | 151.0 | 51.4 | 50.8 |
| Average | 254.1 | 253.3 | 149.7 | 150.5 | 50.4 | 49.9 |
| Label claimed | 250 | 250 | 150 | 150 | 50 | 50 |
| Amount of API (%) in relations to the label claim | 101.6 | 101.3 | 99.8 | 100.3 | 100.8 | 99.8 |
| Standard deviation (SD) | 5.1 | 4.8 | 1.4 | 2.0 | 0.7 | 1.2 |
| Coefficient of variation [CV, %] | 2.01 | 1.89 | 0.94 | 1.33 | 1.39 | 2.40 |
| Confidence interval of arithmetic mean with confidence level equal 95% | µ = 254.1 ± 3.2 | µ = 253.3 ± 3.0 | µ = 149.7 ± 0.9 | µ = 150.5 ± 1.2 | µ = 50.4 ± 0.4 | µ = 49.9 ± 0.7 |
| Comparison of the results using methods A and B | ||||||
| t calculated | 0.364 | 1.756 | 0.923 | |||
| t(95%.18) tabulated | 2.101 | 2.101 | 2.101 | |||
| F calculated | 1.11 | 2.04 | 2.94 | |||
| F(95%.f1 = f2 = 9) tabulated | 3.18 | 3.18 | 3.18 | |||
3.3. Comparison of TLC and HPLC for the Separation and Determination of Paracetamol, Propyphenazone and Caffeine
4. Conclusions
Supplementary Materials
Funding
Data Availability Statement
Conflicts of Interest
References
- Willson, C. The clinical toxicology of caffeine: A review and case study. Toxicol. Rep. 2018, 5, 1140–1152. [Google Scholar] [CrossRef] [PubMed]
- Andrews, K.W.; Schweitzer, A.; Zhao, C.; Holden, J.M.; Roseland, J.M.; Brandt, M.; Dwyer, J.T.; Picciano, M.F.; Saldanha, L.G.; Fisher, K.D.; et al. The caffeine contents of dietary supplements commonly purchased in the US: Analysis of 53 products with caffeine—Contsining ingredients. Anal. Bioanal. Chem. 2007, 398, 231–239. [Google Scholar] [CrossRef] [PubMed]
- Granados-Soto, V.; Castañeda-Hernández, G. A review of the pharmacokinetic and pharmacodynamic factors in the potentiation of the antinociceptive effect of nonsteroidal anti-inflammatory drugs by caffeine. J. Pharmacol. Toxicol. Methods. 1999, 42, 67–72. [Google Scholar] [CrossRef] [PubMed]
- Kovacs, S.; Hawes, S.E.; Maley, S.N.; Mosites, E.; Wong, L.; Stergachis, A. Technologies for detecting falsified and substandard drugs in low and middle-income countries. PLoS ONE 2014, 9, e90601. [Google Scholar] [CrossRef]
- Höllein, L.; Kaale, E.; Mwalwisi, Y.H.; Schulze, M.H.; Holzgrabe, U. Routine quality control of medicines in developing countries: Analytical challenges, regulatory infrastructures and the prevalence of counterfeit medicines in Tanzania. TrAC Trends Anal. Chem. 2016, 76, 60–70. [Google Scholar] [CrossRef]
- Hassouna, M.E.; Issa, Y.M.; Zayed, A.G. Determination of residues of acetaminophen, caffeine, and drotaverine hydrochloride on swabs collected from pharmaceutical manufacturing equipment using HPLC in support of clearing validation. J. AOAC Int. 2014, 97, 1439–1445. [Google Scholar] [CrossRef]
- Mohammed, O.J.; Hamzah, M.J.; Saeed, A.M. RP–HPLC method Vvalidation for simultaneous estimation of paracetamol and caffeine in formulating pharmaceutical form. Res. J. Pharm. Technol. 2021, 14, 4743–4748. [Google Scholar] [CrossRef]
- Soponar, F.; Moţ, A.C.; Sârbu, C. Quantitative evaluation of paracetamol and caffeine from pharmaceutical preparations using image analysis and RP-TLC. Chromatographia 2009, 69, 151–155. [Google Scholar] [CrossRef]
- Alam, P.; Shakeel, F.; Ali, A.; Alqarni, M.H.; Foudah, A.I.; Aljarba, T.M.; Alkholifi, F.K.; Alshehri, S.; Ghoneim, M.M.; Ali, A. Simultaneous determination of caffeine and paracetamol in commercial formulations using greener normal-phase and reversed-phase HPTLC methods: A contrast of validation parameters. Molecules 2022, 27, 405. [Google Scholar] [CrossRef]
- Vidhate, S.S.; Potawale, S.E.; Kardile, S.S.; Kashid, A.M.; Bansode, A.S.; Bidkar, A.A.; Washimkar, H.M.; Pawar, P.D. Development and validation of HPTLC method for simultaneous quantification of paracetamol, phenylephrine hydrochloride, nimesulide, cetrizine and caffeine in bulk and pharmaceutical dosage form. Der Pharm. Sin. 2015, 6, 1–8. [Google Scholar]
- Farid, N.F.; Naguib, I.A.; Abdelhamid, N.S.; Anwar, B.H.; Magdy, M.A. Validated ecofriendly chromatographic method for quantitative determination of anti-migraine quaternary mixture. J. Sep. Sci. 2020, 43, 2330–2337. [Google Scholar] [CrossRef] [PubMed]
- Dołowy, M.; Pyka-Pająk, A. Application of TLC and densitometry for the determination of paracetamol and caffeine in combined pharmaceutical formulation. Farm. Pol. 2017, 73, 97–104. (In Polish) [Google Scholar]
- Boltia, S.A.; Soudi, A.T.; Elzanfaly, E.S.; Zaazaa, H.E. Development and validation of chromatographic methods for simultaneous determination of paracetamol, orphenadrine citrate and caffeine in presence of p-aminophenol; quantification of p-aminophenol nephrotoxic impurity using LC–MS/MS. J. Chromatogr. Sci. 2020, 58, 223–233. [Google Scholar] [CrossRef] [PubMed]
- Bouhsain, Z.; Garrigues, S.; de la Guardia, M. Clean Method for the simultaneous determination of propyphenazone and caffeine in pharmaceuticals by flow injection fourier transform infrared spectrometry. Analyst 1997, 122, 441–446. [Google Scholar] [CrossRef] [PubMed]
- Hadad, G.M.; El-Gindy, A.; Mahmoud, W.M. Development and validation of chemometrics-assisted spectrophotometry and liquid chromatography methods for the simultaneous determination of the activei ngredients in two multicomponent mixtures containing chlorpheniramine maleate and phenylpropanolamine hydrochloride. J. AOAC Int. 2007, 90, 957–970. [Google Scholar] [CrossRef] [PubMed]
- Ternes, T.; Bonerz, M.; Schmidt, T. Determination of neutral pharmaceuticals in wastewater and rivers by liquid chromatography–electrospray tandem mass spectrometry. J. Chromatogr. A 2001, 938, 175–185. [Google Scholar] [CrossRef]
- Elbarbry, F.A.; Mabrouk, M.M.; El-Dawy, M.A. Determination of the analgesic components of spasmomigraine tablet by liquid chromatography with ultrafiolet detection. J. AOAC Int. 2007, 90, 94–101. [Google Scholar] [CrossRef]
- Santoni, G.; Fabbri, L.; Gratteri, P.; Renzi, G.; Pinzauti, S. Simultaneous determination of aspirin, codeine phosphate and propyphenazone in tablets by reversed-phase high-performance liquid chromatography. Inter. J. Pharm. 1992, 80, 263–266. [Google Scholar] [CrossRef]
- Ainil, F.P.; Effendy, D.L.P.; Siti, M.S. Simultaneous spectrophotometric determination of paracetamol, propyphenazone, and caffeine by using absorption ratio method. Asian J. Pharm. Res. Dev. 2018, 6, 5–8. [Google Scholar] [CrossRef]
- Dinç, E.; Kökdil, G.; Onur, F. Derivative ratio spectra-zero crossing spectrophotometry and LC method applied to the quantitative determination of paracetamol, propyphenazone and caffeine in ternary mixtures. J. Pharm. Biomed. Anal. 2001, 26, 769–778. [Google Scholar] [CrossRef]
- Mamolo, M.G.; Vio, L.; Maurich, V. Simultaneous quantitation of paracetamol, caffeine and propyphenazone by high-pressure liquid chromatography. J. Pharm. Biomed. Anal. 1985, 3, 157–164. [Google Scholar] [CrossRef] [PubMed]
- Pal, N.; Avanapu, S.R.; Kumar, P. Stability indicating HPLC method development and validation for the simultaneous estimation of propyphenazone, caffeine and paracetamol by gradient elution technique. Int. J. Pharma Bio Sci. 2015, 5, 1100–1107. [Google Scholar]
- Issa, Y.H.; Hassouna, M.E.M.; Zayed, A.G. Simultaneous determination of paracetamol, caffeine, domperidone, ergotamine tartrate, propyphenazone and drotaverine HCl by HPLC. J. Liq. Chromatogr. Rel. Technol. 2012, 35, 2148–2161. [Google Scholar] [CrossRef]
- Ibrahim, H.; Hamdy, A.M.; Merey, H.A.; Saad, A.S. Simultaneous determination of paracetamol, propyphenazone and caffeine in presence of paracetamol impurities using dual-mode gradient HPLC and TLC densitometry methods. J. Chromatogr. Sci. 2021, 59, 140–147. [Google Scholar] [CrossRef] [PubMed]
- Chocholous, P.; Satínský, D.; Sklenárová, H.; Solich, P. Two-column sequential injection chromatography-new approach for fast and effective analysis and its comparison with gradient elution chromatography. Anal. Chim. Acta. 2010, 668, 61–66. [Google Scholar] [CrossRef] [PubMed]
- Rohman, A.; Dzulfianto, A.; Riswanto, F. The employment of UV-spectroscopy combined with multivariate calibration for analysis of paracetamol, Propyphenazone and caffeine. Indones. J. Pharm. 2017, 28, 191–197. [Google Scholar] [CrossRef]
- Özgür, M.; Alpdoğan, G.; Aşçi, B. A rapid spectrophotometric method to resolve ternary mixtures of propyphenazone, caffeine, and acetaminophen in tablets. Monatshefte Fuer Chem. 2002, 133, 219–223. [Google Scholar] [CrossRef]
- Silva, W.P.; Silva, L.A.J.; França, C.H.; Sousa, R.M.F.; Muñoz, R.A.A.; Richter, E.M. Square-wave voltammetric determination of propyphenazone, paracetamol, and caffeine: Comparative study between batch injection analysis and conventional electrochemical systems. Electroanalysis 2017, 29, 1860–1866. [Google Scholar] [CrossRef]
- Sopnar, F.; Staniloae, D.; Moise, G.; Szaniszlo, B.; David, V. Simultaneous determination of paracetamol, propyphenazone and caffeinr from pharmaceutical preparations in the presence in of related susbtances using a validated HPLC-DAD method. Rev. Roum. Chim. 2013, 58, 433–440. [Google Scholar]
- Hałka-Grysińska, A.; Ślązak, P.; Zaręba, G.; Markowski, W.; Klimek-Turek, A.; Dzido, H.T. Simultaneous determination of acetaminophen, propyphenazone and caffeine in cefalgin preparation by pressurized planar electrochromatography and high-performance thin-layer chromatography. Anal. Methods 2012, 4, 973–982. [Google Scholar] [CrossRef]
- Emre, D.; Ozaltin, N. Simultaneous determination of paracetamol, caffeine and propyphenazone in ternary mixtures by micellar electrokinetic capillary chromatography. J. Chromatogr. B 2007, 847, 126–132. [Google Scholar] [CrossRef] [PubMed]
- Golubitskii, G.B.; Budko, E.; Ivanov, V.M.; Basova, E. Quantitative analysis of Pentalgin tablets by gradient and isocratic high-performance liquid chromatography. J. Anal. Chem. 2006, 61, 350–353. [Google Scholar] [CrossRef]
- ICH Harmonised Tripartite Guideline: Validation of Analytical Procedures: Text and Methodology, Q2(R1); ICH: Geneva, Switzerland, 2005; Available online: https://database.ich.org/sites/default/files/Q2%28R1%29%20Guideline.pdf (accessed on 28 February 2023).
- Ferenczi Fodor, K.; Renger, B.; Végh, Z. The frustrated reviewer–Recurrent failures in manuscripts describing validation of quantitative TLC/HPTLC procedures for analysis of pharmaceuticals. J. Planar Chromatogr. Mod. TLC 2010, 23, 173–179. [Google Scholar] [CrossRef]
- Nagy-Turák, A.; Végh, Z.; Ferenczi-Fodor, K. Validaton of the quantitative planar chromatographic analysis of drug substances. III. Robustness testing in OPLC. J. Planar Chromatogr Mod. TLC 1995, 8, 188–193. [Google Scholar]
- Ferenczi-Fodor, K.; Nagy-Turák, A.; Végh, Z. Validation and monitoring of quantitative thin layer chromatographic purity tests for bulk drug substances. J. Planar Chromatogr Mod. TLC 1995, 8, 349–356. [Google Scholar]
- Hendix, C.D. What every technologist should know about experiment design. Chem. Technol. 1979, 9, 167–174. [Google Scholar]
- Pyka, A.; Budzisz, M.; Dołowy, M. Validation thin layer chromatography for the determination of acetaminophen in tablets and comparison with a pharmacopeial method. Biomed. Res. Int. 2013, 2013, 545703. [Google Scholar] [CrossRef]
- Foudah, A.I.; Shakeel, F.; Salkini, M.A.; Alshehri, S.; Ghoneim, M.M.; Alam, P. A Green high-performance thin-layer chromatography method for the determination of caffeine in commercial energy drinks and formulations. Materials 2022, 15, 2965. [Google Scholar] [CrossRef]
- Polish Pharmaceutical Society. Polish Pharmacopoeia X; Polish Pharmaceutical Society: Warsaw, Poland, 2014. (In Polish) [Google Scholar]
- United States Pharmacopeial Convention. The United States Pharmacopoeia, 34th ed.; United States Pharmacopeial Convention: Rockville, MD, USA, 2011. [Google Scholar]
- El Sherbiny, D.; Wahba, M. Validation of a micellar liquid chromatographic method for determination of caffeine and non-steroidal anti-inflammatories. J. Chromatogr. Sci. 2014, 52, 806–813. [Google Scholar] [CrossRef]

Disclaimer/Publisher’s Note: The statements, opinions and data contained in all publications are solely those of the individual author(s) and contributor(s) and not of MDPI and/or the editor(s). MDPI and/or the editor(s) disclaim responsibility for any injury to people or property resulting from any ideas, methods, instructions or products referred to in the content. |
© 2024 by the author. Licensee MDPI, Basel, Switzerland. This article is an open access article distributed under the terms and conditions of the Creative Commons Attribution (CC BY) license (https://creativecommons.org/licenses/by/4.0/).
Share and Cite
Pyka-Pająk, A. Determination of the Active Pharmaceutical Ingredients in Saridon Tablets Using an Economical and Sensitive Thin Layer Chromatography Method Combined with Densitometry. Analytica 2024, 5, 1-16. https://doi.org/10.3390/analytica5010001
Pyka-Pająk A. Determination of the Active Pharmaceutical Ingredients in Saridon Tablets Using an Economical and Sensitive Thin Layer Chromatography Method Combined with Densitometry. Analytica. 2024; 5(1):1-16. https://doi.org/10.3390/analytica5010001
Chicago/Turabian StylePyka-Pająk, Alina. 2024. "Determination of the Active Pharmaceutical Ingredients in Saridon Tablets Using an Economical and Sensitive Thin Layer Chromatography Method Combined with Densitometry" Analytica 5, no. 1: 1-16. https://doi.org/10.3390/analytica5010001
APA StylePyka-Pająk, A. (2024). Determination of the Active Pharmaceutical Ingredients in Saridon Tablets Using an Economical and Sensitive Thin Layer Chromatography Method Combined with Densitometry. Analytica, 5(1), 1-16. https://doi.org/10.3390/analytica5010001