Abstract
Chromatograms with overlapping peaks and a baseline rise or upset constitute a great challenge for analysts. Such a case regarding the analysis of bupropion hydrochloride and its 5 impurities in a tablet formulation was used as a model. A baseline correction technique for liquid chromatography coupled with diode array detection is described by using Rstudio. The asymmetry least squares (ALS) algorithm was used as implemented in the “baseline” package, with parameters lambda and p set to 4 and 0.05, respectively. Peak deconvolution and subsequent integration and area quantification were accomplished through Fytik software. Chromatographic data from the validation procedure were utilized to demonstrate the feasibility of the suggested method and whether this correction affects the outcome of the validation study. Finally, a robustness study was carried out in order to shed light on the factors that have a more significant influence on the baseline correction, showing the reliability of this procedure through random changes in its parameters.
1. Introduction
The goal of each analytical technique is to obtain signals, which are carriers of meaningful information about an analyte during measurement. On the other hand, noise is the sum of unwanted information since it degrades the accuracy and precision of the measurement. In the vast majority of analytical techniques, such as chromatography, nuclear magnetic resonance (NMR), infrared spectroscopy, etc., the existence of baseline drift and random noise may strongly affect the analytical result, especially when overlapping the peak of interest. Moreover, in liquid and gas chromatography, the automatic integration of chromatographic peaks is recommended, since it is non-biased and fast. However, many chromatograms suffer from overlapping peaks due to analyte coelution and peaks on baseline rise or near a baseline upset. In these cases, automatic integration may be considered complicated, and the analyst’s intervention is deemed necessary. When applying manual integration, the analyst sets the start and end of the chromatographic peak but quite often is proved ineffective and inaccurate, since it is based on an analyst’s experience. In addition, it is a tedious procedure and of limited reproducibility [1].
A baseline drift appeared in our previous work [2], namely the development of an HPLC method, based on chaotropic chromatography, for the efficient separation and reliable quantitation of bupropion hydrochloride (BUP) and its five impurities (Imp.) in the presence of excipients, implementing the analytical quality by design principles. To be more specific, the fluctuation of the overall background was caused by the choice of gradient elution for our method, since the neutral character of Imp. 5 (3-chloropropiophenone) kept its elution unaffected by the influence of chaotropic salt or the pH adjustment in the mobile phase. The only choice was the continuous increase of acetonitrile’s content via the selected gradient program. A relevant chromatogram depicting a standard solution containing all impurities at the specification limit (SL) is presented in Figure 1. It is clear from the chromatogram that the peak of Imp. 4-(1-(3-chlorophnenyl)-1-hydroxy-2-propanone) was eluted on a steep baseline rise, comprising a challenge during the validation procedure, since manual integration was implemented. Similarly, Imp. 5 eluted on the baseline rise but on a smoother fragment, allowing for automatic integration in the majority of the validation’s chromatograms, except for the low concentration levels. The validation protocol was performed successfully according to international guidelines.
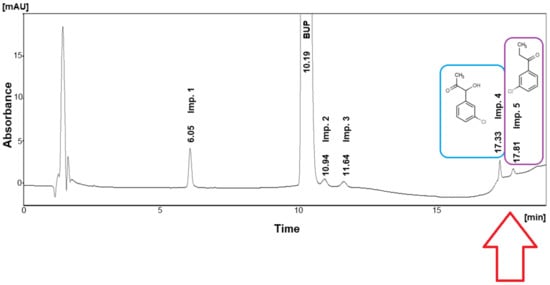
Figure 1.
Chromatogram corresponding to a standard solution containing 400 μg/mL BUP spiked with all impurities at their specification limits. The red arrow depicts the chromatographic area and the related impurities with their structures of the process described herein.
However, a procedure that will enable the automated integration of the chromatographic peaks, overcoming any baseline issues, in a reliable way would be desirable. Several methods have been proposed for eliminating the complex background, such as polynomial fitting [3], wavelet transform [4], asymmetric least squares [1,5,6], iterative averaging [7], iterative polynomial fitting [3] and a combination of these methods [8].
All the aforementioned methodologies have been reviewed so far; however, they suffer from the fact that they need a cheminformatic background in order to be successfully implemented, which is demanding for the practicing analyst, as well as time-consuming. This paper focuses on describing a simple step-by-step approach for the elimination of the chromatographic background, using freely available software and based on the chromatographic data of our previous study. The procedure, as well as the corresponding code, were based on the study reported by Dagla et al. [9]. Finally, a robustness analysis was carried out, created using design of experiments theory, in order to figure out which factors may potentially affect the procedure.
2. Materials and Methods
2.1. Dataset
The dataset consisted of 24 HPLC chromatograms obtained from the validation procedure of the method for the quantitation of bupropion hydrochloride and its 5 impurities [2], literally 15 from method linearity and 9 from accuracy evaluation. For the robustness analysis, 6 chromatograms of the linearity test were utilized, 3 at the limit of quantitation (LOQ) level and 3 at SL. Each chromatogram comprised 3741 points, each point reflecting the intensity (mV) in specific time (min). The aforementioned chromatograms, obtained at 250 nm, have been recorded by a chromatographic system, VWR Hitachi Chromaster (Tokyo, Japan), consisting of an HPLC pump with an on-line degasser, a column oven, an autosampler and a photo-diode array detector, controlled by the Clarity VA v.15.9.0 chromatographic software package from DataApex (Prague, Czech Republic).
2.2. Software
Baseline correction was performed in RStudio [10], employing the “baseline” package. In particular, it comprises a baseline correction algorithm, aiming to remove, with various correction methods, the fluctuation of background effects that originated from spectrometry graphs. Moreover, gWidgets2 and gWidgets2tcltk packages were also installed; they provide the programming interface for making graphical user interfaces with the R language.
Fityk (version 1.3.1) [11] was employed for peak fitting and deconvolution after the baseline correction.
Finally, the experimental plan and data analysis for the robustness testing were performed using Design-Expert® 13 trial version (Stat-Ease Inc., Minneapolis, MN, USA).
3. Results and Discussion
3.1. Baseline Correction
The procedure is schematically illustrated in Figure 2. The data from each chromatogram were exported from Clarity VA as CSV files, where the intensities (mV) in different times (min) were depicted in two vertical rows. To keep it simpler, the focus was on the timespan when Imps. 4 and 5 are eluted (Figure 1), since the automatic integration of Imps. 1–3 and BUP proceeded smoothly. Therefore, each CSV file was cropped and finally contained the intensities for the time period 17–19 min, i.e., 301 points for each chromatogram. Before each CSV file was imported to RStudio, the two rows were transposed, and any title description was deleted. Accordingly, the file was imported into RSstudio as a matrix, and the delimiter “semicolon” was selected. Following the typing of the commands in software, the original and the baseline-corrected chromatograms were graphically presented in the graphical user interface (GUI). The baseline package offers a collection of baseline correction algorithms, each with different parameters for further optimization. The basic criterion for choosing the appropriate correction method in our case was a visual inspection of the peaks of interest and the degree of fitting to a Gaussian curve. In that case, the asymmetric least squares (ALS) algorithm was applied, with a value of 4 for the smoothing parameter (lambda) and 0.05 for residual weighting (p) (Figure 3). After the correction of the baseline, a new CSV file with the modified chromatograms was obtained, and peak fitting was performed, as described below. The commands for the baseline correction are presented in Table S1 in the Supplementary Material.
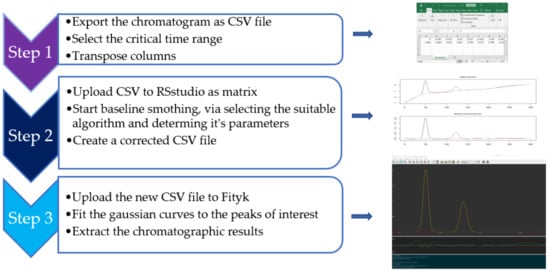
Figure 2.
Schematic presentation of the procedure of baseline correction.
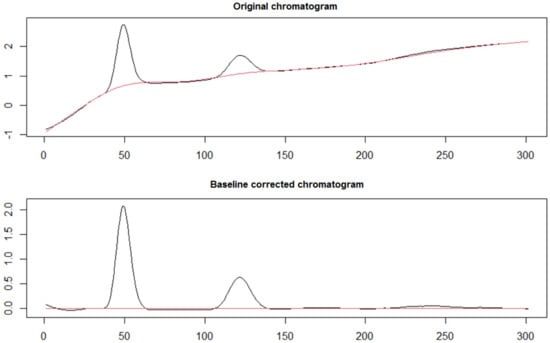
Figure 3.
Original chromatogram and baseline corrected chromatogram after applying the ALS algorithm from the “baseline” package in RStudio.
3.2. Peak Fitting and Integration
The baseline corrected CSV files of each chromatogram were transferred from RStudio to Fityk software for further processing. Fityk is a program for the nonlinear fitting of analytical functions, which enables the extraction of the area of the peaks of interest. In detail, each CSV file was imported to the software, and the chromatogram could be viewed at the main plot of the GUI. After selecting “gaussian” from the list of functions and choosing “auto-add”, the peaks of interest were bolded, as depicted in Figure 4. In addition, the selection of “star fitting” enables the accomplishment of the minimization of the error between the experimental data and the fitted curve. Critical information about the integrated peaks are presented in the GUI sidebar, such as the areas, which were collected and submitted to further processing, in order to figure out if the validation characteristics, i.e., linearity and accuracy, were fullfiled.
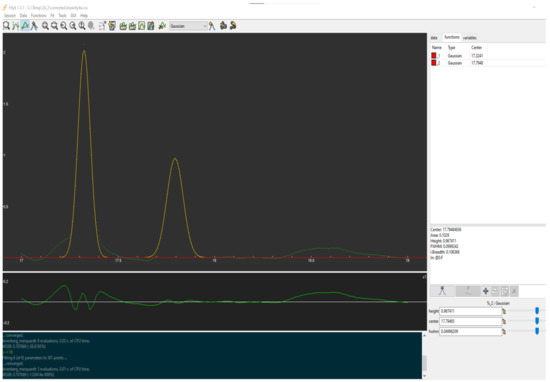
Figure 4.
A screenshot of Fityk GUI. The main plot shows experimental data (green dots), the baseline (red), and the fitted model (yellow). At sidebar, peak information for the selected peak are apparent.
3.3. Method Validation
The data obtained from Fityk (peak areas of interest) were further processed, and the validation results are presented in Table 1. For both impurities, the calibration curve, calculated with regression analysis, exhibited excellent linearity. Concerning the accuracy of the method, the recovery values were found to be within the acceptance criteria (recovery values: 90.0–110.0% for Imp 4, with a specification limit ≥ 1.0%, and 70.0–130.0% for Imp. 5, with 0.1% ≤ specification limit < 0.5%) [12].

Table 1.
Validation parameters: linearity and accuracy through baseline correction and integration through chromatographic software.
Table 1 also illustrates a comparison of the validation data obtained with the aforementioned procedure to those obtained by the previous chromatographic software treatment, either with manual or automatic integration. It can be concluded that the baseline correction procedure produces data within the acceptance limits in terms of %Recovery and %RSD. Thus, it does not affect the validation itself and is considered reliable. Regarding the slope and intercept of the calibration curve, the differences observed resulted from the scale differences of the areas, as provided by Fityk.
3.4. Robustness Testing
The initial trials for the baseline correction aimed to discover the best parameters, so as to achieve the proper integration through Fityk. The ALS algorithm proved to be the most suitable for our data process, but the choice of the parameters was a further point of concern. Our aim was to determine the same parameters for all of our chromatograms, ensuring non-biased integration for all. Despite the fact that many peaks, especially in low concentrations, could not be defined as symmetrical with the defined parameters, and the subsequent Fityk process transformed them to Gaussian-shaped peaks. Moreover, the choice of the time range of the chromatogram for baseline correction seemed to affect the integration procedure. Our concern was the robustness of this procedure, i.e., if and to what extent variable factors could influence the outcome.
Therefore, a robustness study was carried out, assisted by the design of experiments (DoE) theory, aiming to highlight the factors with the highest influence on the baseline correction procedure. This was achieved via a fractional design (FD) with 2k factorial runs, where k is the number of factors. The selected factors (lambda and p parameters and the time range) were assessed at two levels (−1, +1), symmetrical to their nominal values, namely those that implemented baseline correction. Concerning the time range, the low level (−1) included the chromatogram’s intensities at 17.1–18.6 min (1.5 min), the nominal value (0) at 17–19 min (2 min), and the high level (+1) at 16.7–19.2 min (2.5 min) comprising a set of 8 experiments plus 3 additional runs of nominal conditions, totaling 11 experiments. Chromatograms from the linearity assessment at LOQ level and SL were utilized for this testing. The plan of the experiments and the experimental responses, as well as the levels of the aforementioned factors, are presented in Table 2. Regarding the determined responses, areas for both impurities at two concentration levels were defined: at LOQ and at SL level. Therefore, 4 responses were studied in order to discover whether the slight variation in these factors could have a different impact on small peaks (LOQ level) compared to normal peaks (SL level).

Table 2.
Experimental plan proposed by the software and the obtained results for the selected responses.
The statistical significance of factors effects on the responses was further assessed through the graphical interpretation of the experimental results. Both half-normal probability plots and Pareto charts [13,14,15] revealed the significant effects for each response and as presented in Figure 5 for AIMP5_LOQ and AIMP4_SL. Factor A (lamda parameter) proved to have a significant effect in all responses, while Factor B (p parameter) was found to be significant in the 3 out of 4 responses, with the exception of AIMP4_LOQ. The outcome regarding these 2 factors was somehow expected, as these parameters constitute the ‘nucleus’ of the procedure and are considered crucial for its performance. Therefore, many trials in various areas should be conducted prior to their application in order to select the most suitable values, and these values should be strictly kept throughout the assay. For contrast, as literature survey revealed, in the single study implementing ALS for baseline correction on chromatographic data [5], the ALS algorithm was affected only by factor p. Concerning factor C (time range), the results show that it had no impact on any response.
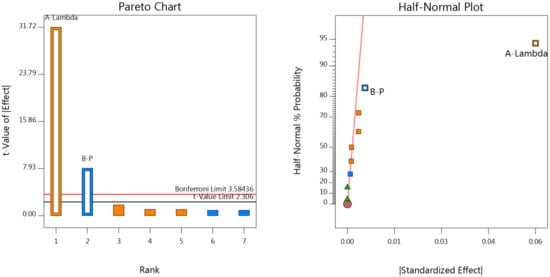
Figure 5.
Pareto chart and half-normal plot for AIMP5_LOQ (left) and AIMP4_SL (right), respectively.
4. Conclusions
In this study, we propose a step-by-step methodology for baseline correction and peak integration. The description of all sequential steps and the implementation of freely available software renders it an applicable method for any analyst facing baseline irregularities in his/her chromatographic data. Meanwhile, the selected strategy was validated with experimental liquid chromatographic data retrieved from our previous work. Comparing the two datasets of validation results of the two studies, the proposed method proved to be valid and reliable. However, the proposed methodology enables the automated integration of the chromatographic peaks and thus has an advantage over the classical procedure with manual integration for such cases. Finally, the method was tested for its robustness via a factorial experimental design concerning the selection of the time range of the chromatogram at the pre-processing stage and the parameters of ALS algorithm. Lambda and p parameters were found to be crucial for the total amount of the examined data, whereas time range did not affect the integration of peaks regardless of the concentration.
Supplementary Materials
The following are available online at https://www.mdpi.com/article/10.3390/analytica4010005/s1, Table S1: Steps for utilization of RStudio software for baseline correction.
Author Contributions
Conceptualization, E.G., Y.D. and A.M.; methodology, K.G., A.M. and I.D.; validation, K.G. and I.D.; writing-original draft preparation, K.G. and I.D.; writing-review and editing, E.G., Y.D. and A.M.; supervision, Y.D. All authors have read and agreed to the published version of the manuscript.
Funding
This research received no external funding.
Institutional Review Board Statement
Not applicable.
Informed Consent Statement
Not applicable.
Data Availability Statement
The data presented in this study are available in this article and Supplementary Material.
Conflicts of Interest
The authors declare no conflict of interest.
References
- Peng, J.; Peng, S.; Jiang, A.; Wei, J.; Li, C.; Tan, J. Asymmetric least squares for multiple spectra baseline correction. Anal. Chim. Acta 2010, 683, 63–68. [Google Scholar] [CrossRef] [PubMed]
- Gkountanas, K.; Malenovic, A.; Dotsikas, Y. Determination of Bupropion and Its Impurities via a Chaotropic Chromatography Method Following Analytical Quality-by- Design Principles for Method Development. Pharmaceuticals 2022, 15, 1196. [Google Scholar] [CrossRef] [PubMed]
- Gan, F.; Ruan, G.; Mo, J. Baseline correction by improved iterative polynomial fitting with automatic threshold. Chemom. Intell. Lab. Syst. 2006, 82, 59–65. [Google Scholar] [CrossRef]
- Shao, L.; Griffiths, P.R. Automatic baseline correction by wavelet transform for quantitative open-path fourier transform infrared spectroscopy. Environ. Sci. Technol. 2007, 41, 7054–7059. [Google Scholar] [CrossRef] [PubMed]
- Boelens, H.F.M.; Dijkstra, R.J.; Eilers, P.H.C.; Fitzpatrick, F.; Westerhuis, J.A. New background correction method for liquid chromatography with diode array detection, infrared spectroscopic detection and Raman spectroscopic detection. J. Chromatogr. A 2004, 1057, 21–30. [Google Scholar] [CrossRef] [PubMed]
- Cheung, W.; Xu, Y.; Thomas, C.L.P.; Goodacre, R. Discrimination of bacteria using pyrolysis-gas chromatography-differential mobility spectrometry (Py-GC-DMS) and chemometrics. Analyst 2009, 134, 557–563. [Google Scholar] [CrossRef] [PubMed]
- Shen, X.; Xu, L.; Ye, S.; Hu, R.; Jin, L.; Hu, H.; Liu, W. Automatic baseline correction method for the open-path Fourier transform infrared spectra by using simple iterative averaging. Opt. Express 2018, 26, A609–A614. [Google Scholar] [CrossRef] [PubMed]
- Cai, Y.; Yang, C.; Xu, D.; Gui, W. Baseline correction for Raman spectra using penalized spline smoothing based on vector transformation. Anal. Methods 2018, 10, 3525–3533. [Google Scholar] [CrossRef]
- Dagla, I.; Tsarbopoulos, A.; Gikas, E. A novel validated injectable colistimethate sodium analysis combining advanced chemometrics and design of experiments. Molecules 2021, 26, 1546. [Google Scholar] [CrossRef] [PubMed]
- Rstudio. Available online: https://posit.co/ (accessed on 2 December 2022).
- Fityk. Available online: https://fityk.nieto.pl/ (accessed on 2 December 2022).
- Crowther, J.B. Validation of pharmaceutical test methods. In Handbook of Modern Pharmaceutical Analysis; Ahuja, S., Scypinski, S., Eds.; Academic Press: New York, NY, USA, 2001; pp. 415–443. [Google Scholar]
- Kallinteris, K.; Gkountanas, K.; Karamitros, I.; Boutsikaris, H.; Dotsikas, Y. Development and Validation of a Novel HPLC Method for the Determination of Ephedrine Hydrochloride in Nasal Ointment. Separations 2022, 9, 198. [Google Scholar] [CrossRef]
- Vrachas, A.; Gkountanas, K.; Boutsikaris, H.; Dotsikas, Y. Development and Validation of a Novel RP-HPLC Method for the Determination of Cetrimide and Chlorhexidine Gluconate in Antiseptic Solution. Analytica 2022, 3, 79–91. [Google Scholar] [CrossRef]
- Neofotistos, A.-D.; Gkountanas, K.; Boutsikaris, H.; Dotsikas, Y. A Validated RP-HPLC Method for the Determination of Butamirate Citrate and Benzoic Acid in Syrup, Based on an Experimental Design Assessment of Robustness. Separations 2021, 8, 163. [Google Scholar] [CrossRef]
Disclaimer/Publisher’s Note: The statements, opinions and data contained in all publications are solely those of the individual author(s) and contributor(s) and not of MDPI and/or the editor(s). MDPI and/or the editor(s) disclaim responsibility for any injury to people or property resulting from any ideas, methods, instructions or products referred to in the content. |
© 2023 by the authors. Licensee MDPI, Basel, Switzerland. This article is an open access article distributed under the terms and conditions of the Creative Commons Attribution (CC BY) license (https://creativecommons.org/licenses/by/4.0/).