Article

Development of an Inexpensive and Comparable Microplastic Detection Method Using Fluorescent Staining with Novel Nile Red Derivatives

1
Wasser 3.0 gGmbH, Neufeldstr. 17a-19a, 76187 Karlsruhe, Germany
2
abcr GmbH, Im Schlehert 10, 76187 Karlsruhe, Germany
3
Entsorgungs-und Wirtschaftsbetrieb Landau, Georg-Friedrich-Dentzel-Straße 1, 76829 Landau, Germany
*
Author to whom correspondence should be addressed.
Analytica 2023, 4(1), 27-44; https://doi.org/10.3390/analytica4010004
Submission received: 13 December 2022 / Revised: 9 January 2023 / Accepted: 18 January 2023 / Published: 1 February 2023

Abstract

:
Fluorescent staining of microplastics as a detection method is consistently gaining importance in microplastics research, as it is fast, easy to use, and requires low technical effort. In this study, a complete procedure was developed, from sample collection to sample processing and detection, to measure microplastics with low cost and time requirements. The developed procedure was tested by measuring the microplastics in the effluent of a German wastewater treatment plant over a period of one year. The results show that the process is especially well suited to investigate temporal variations of microplastic contamination, which requires a large number of samples to be processed. Further, the precision and selectivity of the detection process could be improved by applying newly developed Nile red derivatives for fluorescent staining. A low budget modification of a microscope for fluorescent imaging is compared to a modification with precise optical bandpass filters. A script enabling automated microplastic detection and counting was developed, improving the accuracy and comparability of the process.

1. Introduction

One of the biggest challenges in microplastics research is the lack of standardized and affordable methods for microplastic detection [1,2,3,4]. Microplastic detection is essential to evaluate risk potentials and transport pathways of microplastics in the environment and in food or beverages for human consumption [2,4].
In environmental samples, natural particles exceed the number of microplastics by several orders of magnitude [1,5]. As they can have a similar appearance and carbon-based chemical structures, it is challenging to differentiate them from microplastics. In addition, microplastics comprise a high variety of plastic types with different chemical and structural compositions, making detection more complex [5,6]. The large variation of applied methods and lack of standardization make it almost impossible to compare results among different studies [4,7].
The detection of microplastics is divided into three main steps: sampling, sample preparation and detection [1,2,3]. Samples can be taken from different environmental compartments, such as water, air, soil, sediments, or biota. Water samples are mainly taken by pulling plankton nets through water or pumping water through sieve or filter cartridges. As there is no standardized procedure for sampling, mesh sizes can range from 1–500 µm. For example, when samples are taken with a 330 µm mesh net, the resulting microplastic contamination measured is much lower than when using a 10 µm filter cartridge, as smaller particles are not caught in the sample. Studies conducted using different sampling methods are thus hardly comparable [4,7].
In the sample preparation process, the number of natural particles is reduced while preserving microplastics in the sample [1,2,3,4]. Natural organic particles are reduced through a digestion step, primarily hydrogen peroxide, alkaline, or enzymatic digestion. Enzymatic digestion is the most gentle process, but requires a high processing time [8]. Thus, hydrogen peroxide is typically used for water or sediment samples and alkaline digestion for biota samples [9]. But there is no standardized digestion procedure, and a variety of methods are applied.
Density separation is used to remove sediment particles from the sample [1,2,3]. Samples are placed in high-concentration salt solutions; this causes the lighter microplastics to float and the heavy sediments (typical density of 2.4 g/cm3) to sink. Typical salt solutions are NaCl (1.2 kg/L), ZnCl2 (1.6 kg/L), or NaI (1.8 kg/L). Density separation can be applied using simple setups, such as separation funnels, but for higher separation efficiencies, more complex methods are required. One example is the “Munich Plastic Sediment Separator”. This applies air bubbles in a stainless-steel column equipped with different valves and filters. resulting in a much higher separation efficiency for small microplastics from sediment samples [10]. This demonstrates that the levels of microplastic contamination measured also depend on the density separation method used.
For the final detection, the most used methods are Py-GC/MS (Pyrolysis–gas chromatography-mass spectrometry), FTIR (Fourier-transform infrared spectroscopy) microscopy, and Raman microscopy [1,2,3,4]. FTIR and Raman microscopy can chemically characterize the particles in the sample and analyze both the particle number and polymer type. For Py-GC/MS, the sample is pyrolyzed and the resulting gases are chemically analyzed, yielding the polymer type and mass of the respective microplastics. These methods are well suited for microplastic analytics, but disadvantages include a high investment and operating cost, the fact that they require trained staff to operate them, and that they have long measurement times. Thus, there is a need for an inexpensive and fast method for the detection of microplastics.
Fluorescent staining of microplastics is one technique that is becoming increasingly popular in research, as it requires a low cost and low technical effort [11]. The fluorescent dye Nile red is the most used; it is a lipophilic fluorescent dye commonly used for the in-situ staining of lipids [12,13]. Nile red was successfully applied for staining microplastics in environmental samples for the first time in 2016 [14,15,16]. When stained with Nile red, microplastics show good fluorescence signals under a fluorescent microscope, while natural particles show weak fluorescence and do not glow. However, due to several drawbacks, fluorescent staining for microplastic detection is a highly debated method (Table 1) [11,17,18].
The biggest drawback of the method is the risk of false positives by natural polymers, which can also show a strong fluorescence when stained with Nile red [11,17]. Further, color pigments in microplastics can cause quenching and certain polymer types (e.g., PVC) are hardly detectable due to weak fluorescence signals.
Fluorescent staining of microplastics has already been used in several studies to measure microplastics in the environment and biota [19,20,21,22]. Additionally, it is well suited for contamination control in food and beverages [23,24,25]. Current research is addressing advanced processes such as automated particle counting, in-situ detection, or polymer type identification using fluorescence microscopy combined with phasor imaging [26,27,28]. This highlights the large potential of this method.
In this study, a standardized procedure for sampling, sample preparation, and microplastics detection using fluorescent imaging is developed and tested over a period of one year in a German wastewater treatment plant to determine its potential for producing comparable data. For fluorescent imaging, a low budget modification of the microscope using colored foils and a UV-flashlight was compared to an expensive modification using precise optical bandpass filters. To improve the fluorescent staining, chemically adapted Nile red derivatives were tested that improve fluorescence analysis, resulting in a higher selectivity for microplastics and a reduction in the risk of false positives by natural particles.

2. Materials and Methods

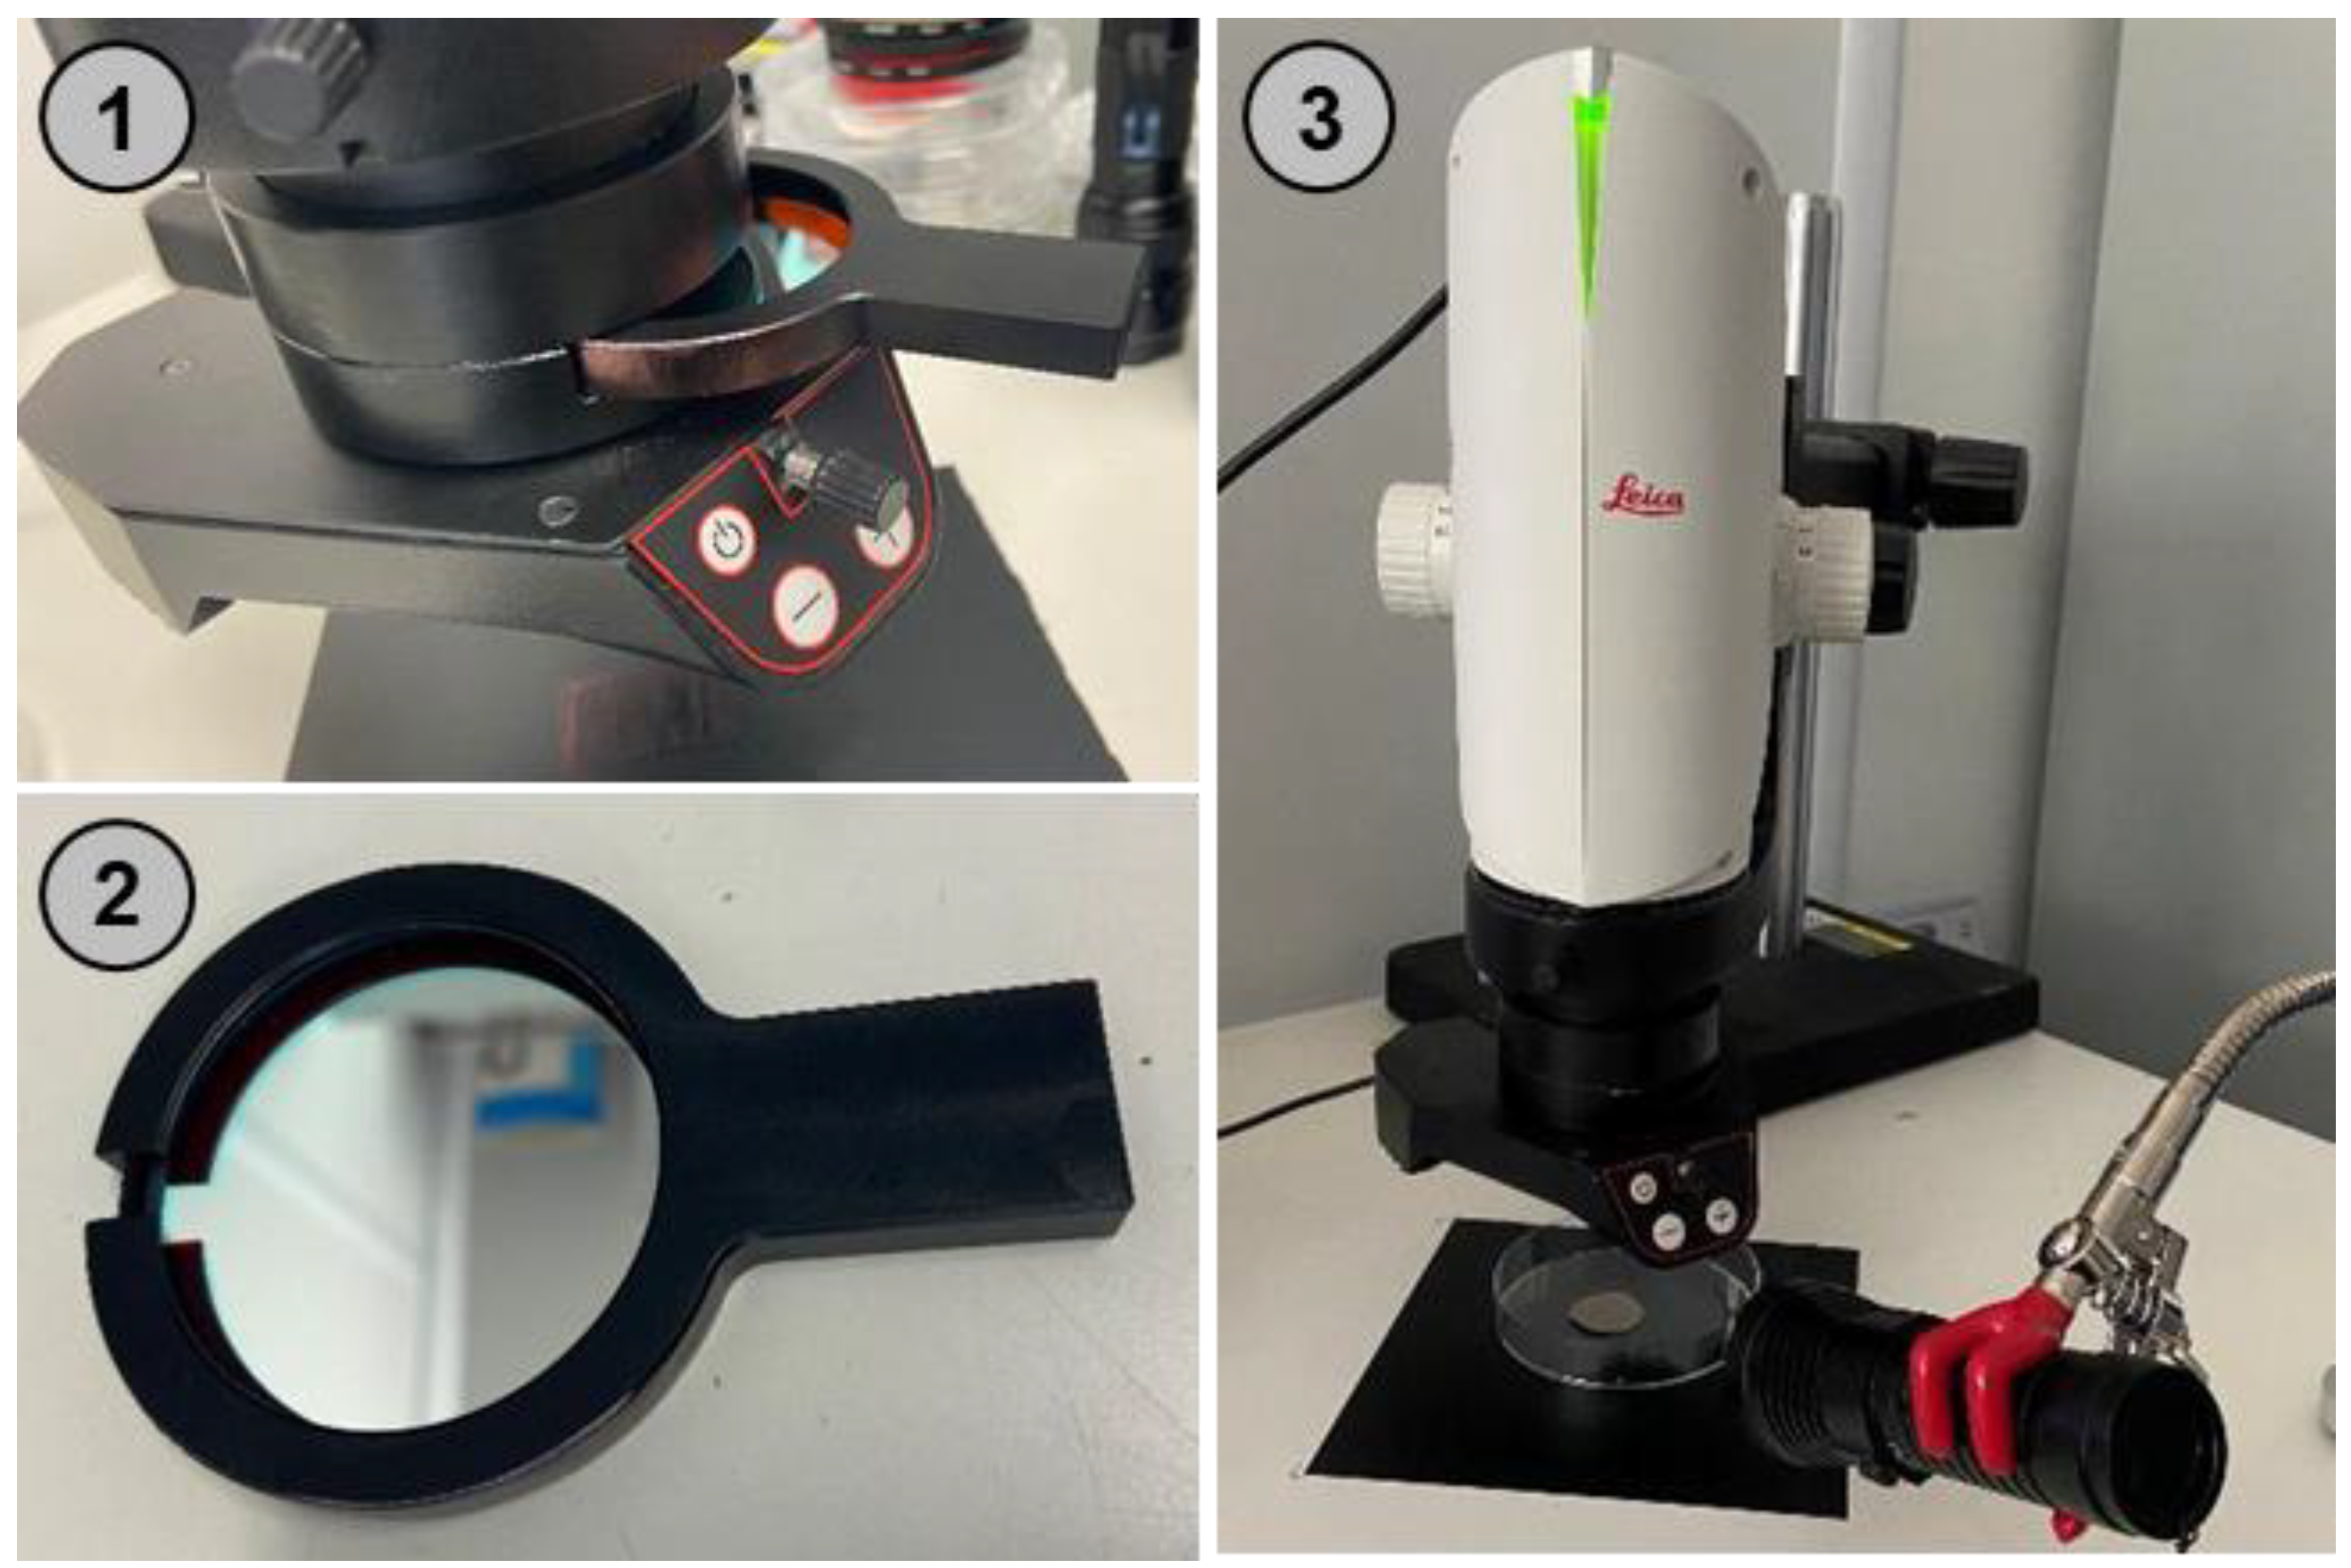
2.1. Modification of Microscope for Fluorescent Imaging

For fluorescent imaging the optical microscope Leica DMS300 (Leica Mikrosysteme Vertrieb GmbH, Wetzlar, Germany) together with the software LAS-X 3.0.1423224 was modified based on Labbe et al. 2020 (Figure 1) [29]. For fluorescence excitation, LED-Flashlights were used; the used flashlights can be found in Table 2. The flashlights were mounted using a flexible arm on a solid base plate (Flexklemme ROTILABO, Carl Roth GmbH + Co. KG, Karlsruhe, Germany).
To block the reflected light from the flashlights and only allow the light resulting from fluorescence to pass to the microscope, optical filters were mounted in front of the microscope lens using a custom-made mount (Bartmann Maschinenbau GmbH, Ruelzheim, Germany) (Figure 1). The performance of inexpensive color filters for photography was compared with expensive optical bandpass filters that are used in commercial fluorescent microscopes (Table 3).
The combination of lamps and filters and the respective microscope settings can be seen in Table 4. The green and blue flashlights required an additional excitation filter, as their wide range of emission wavelengths ranged beyond the transmissive area of the emission filter.

2.2. Investigation of Fluorescent Dyes for Microplastics Detection

Nile red and Nile red derivatives as well as process chemicals were purchased from abcr GmbH (Germany, Karlsruhe).
To investigate the suitability of NR0 and NR1 for the selective detection of microplastics, a selection of microplastic particles based on five different polymer types and three natural particles were stained and the resulting fluorescence properties examined by taking fluorescent images with the different filters. Table 5 shows the list of polymers and natural particles used in the experiment. Chitin, wood, and calcite (shell lime) were selected as examples for natural particles as they are particularly resistant to common digestion methods and are present in most environmental samples.
For the particle staining, 10 mg of the respective particles were put into 10 mL glass vials. The solution of NR0 or NR1 in water (1 mg/L) was added, shaken by hand for 5 min and left to rest at room temperature (RT) for 24 h. The sample was then transferred onto a Petri dish and the remaining water soaked up carefully with a pipet.

2.3. Recovery Rates—Comparison of Automated and Manual Particle Detection
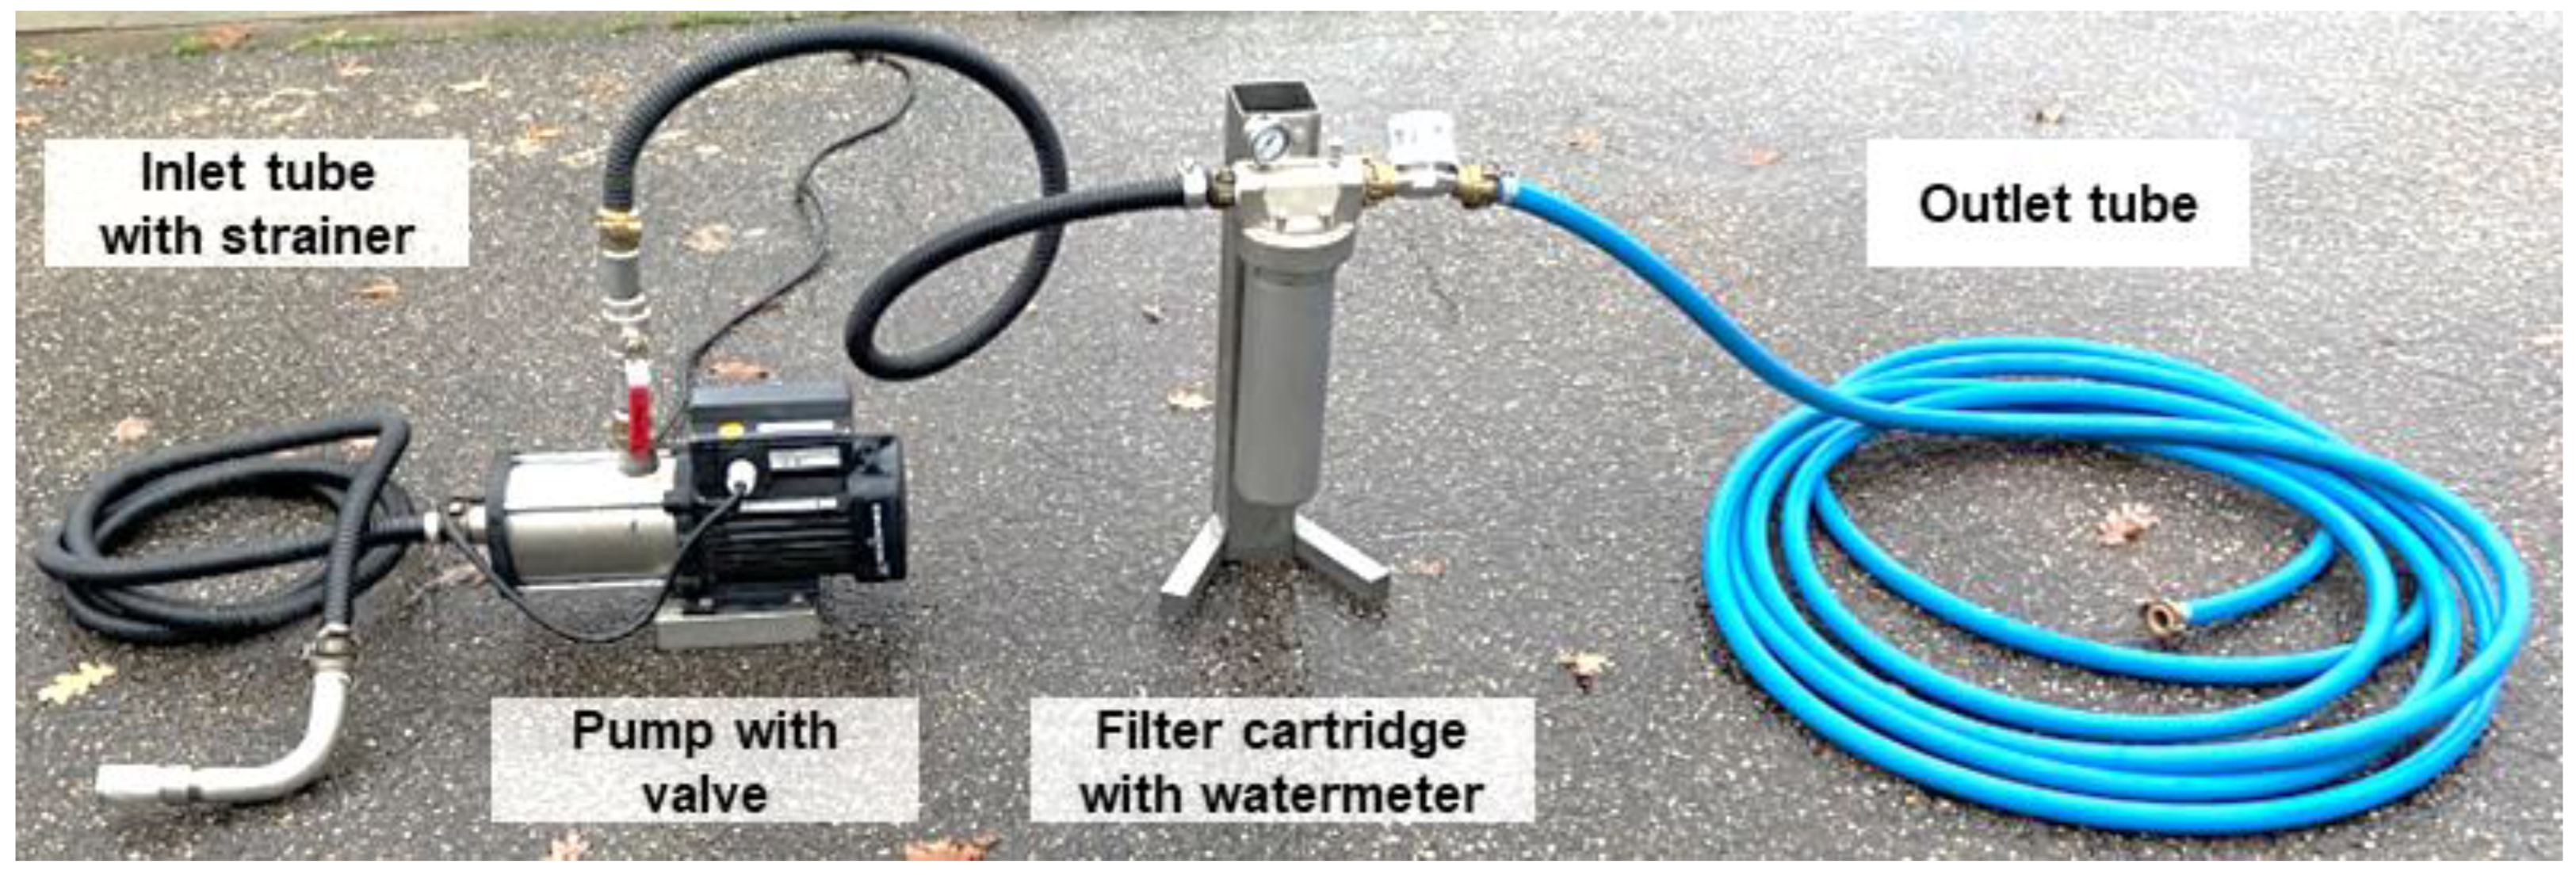
To determine the recovery rates, a fixed amount of microplastics or natural particles (Table 6) were added to filtered water. Subsequently, the sample preparation and staining process were performed (see Section 2.4).
For manual particle counting, the microplastic particles in the images were counted by hand. Reference images of the stained microplastics and natural particles served as orientation for the brightness threshold. Automated particle counting was performed using the microscope software LAS-X 3.0.1423224. Thresholding for the particles was based on the brightness (respective fluorescence intensity) of the stained particles in reference images. With a pixel size of 2.5 × 2.5 µm, the minimum size for microplastic particles was set to 16 pixels, equivalent to 100 µm² or a particle with a size of 10 × 10 µm. This setting was chosen, as the minimum retention size of the filter cartridge used in the sampling process and therefore the detection limit is 10 µm. A script for open-source adaptation of the particle counting using Image-J can be found in the supplementary materials.

2.4. Sampling

To develop, test and validate the sampling processes using environmental samples, the effluent of the wastewater treatment plant (WWTP) Landau-Moerlheim was studied over a period of one year. The WWTP Landau-Moerlheim has a capacity of 80,000 population equivalents. The primary treatment applies rakes, a sand trap, and a fat separator. This is followed by the secondary biological treatment and the tertiary phosphate elimination. The catchment area of the WWTP contains households, industry, and agriculture, mainly viticulture.
The sampling process was conducted using a stainless-steel filter cartridge with a mesh size of 10 µm (01WTGD, Wolftechnik Filtersysteme GmbH & Co., KG, Weil, Germany) and a 0.9 kW centrifugal pump (MG80B C-B-CMS1B, Grundfos, Erkrath, Germany). A hose with a pump strainer was put upstream into the WWTP effluent and connected to the pump inlet (Figure 2). The pump outlet is connected to a valve, to prevent the backflow of water after the pump has been switched off. The valve is then connected to a hose that is attached to the inlet of the filter cartridge. At the filter cartridge outlet, a water meter is used to measure the volume of sampled water, before the water is discharged through the outlet hose, downstream in the water body. The inflow hoses are made of black polyvinylchloride (PVC), which does not show a fluorescence signal when stained with Nile red and therefore does not contaminate the sample. It is recommended to clean the filter cartridge with a high-pressure cleaner when there is a noticeable decrease of the flowrate.
Before each sampling process, a tap water hose is connected to the outlet of the filter cartridge; the entire system is backflushed for 3 min. Subsequently, the valve is closed, the tap water hose removed, and the water meter and outlet hose are connected to the outlet of the filter cartridge. The pump is subsequently switched on and the valve opened. As the volume of tap water remaining in the system is 10 L, a total amount of 110 L water is filtered to receive a sample volume of 100 L.
After the filtration process, the hoses are disconnected from the filter cartridge and the water remaining in the filter cartridge is poured into a stainless-steel bowl. The filter is removed from the cartridge and rinsed into the stainless-steel bowl using a pressurized spray bottle. For transport and storage, the sample is transferred into a 2.5 L glass bottle.

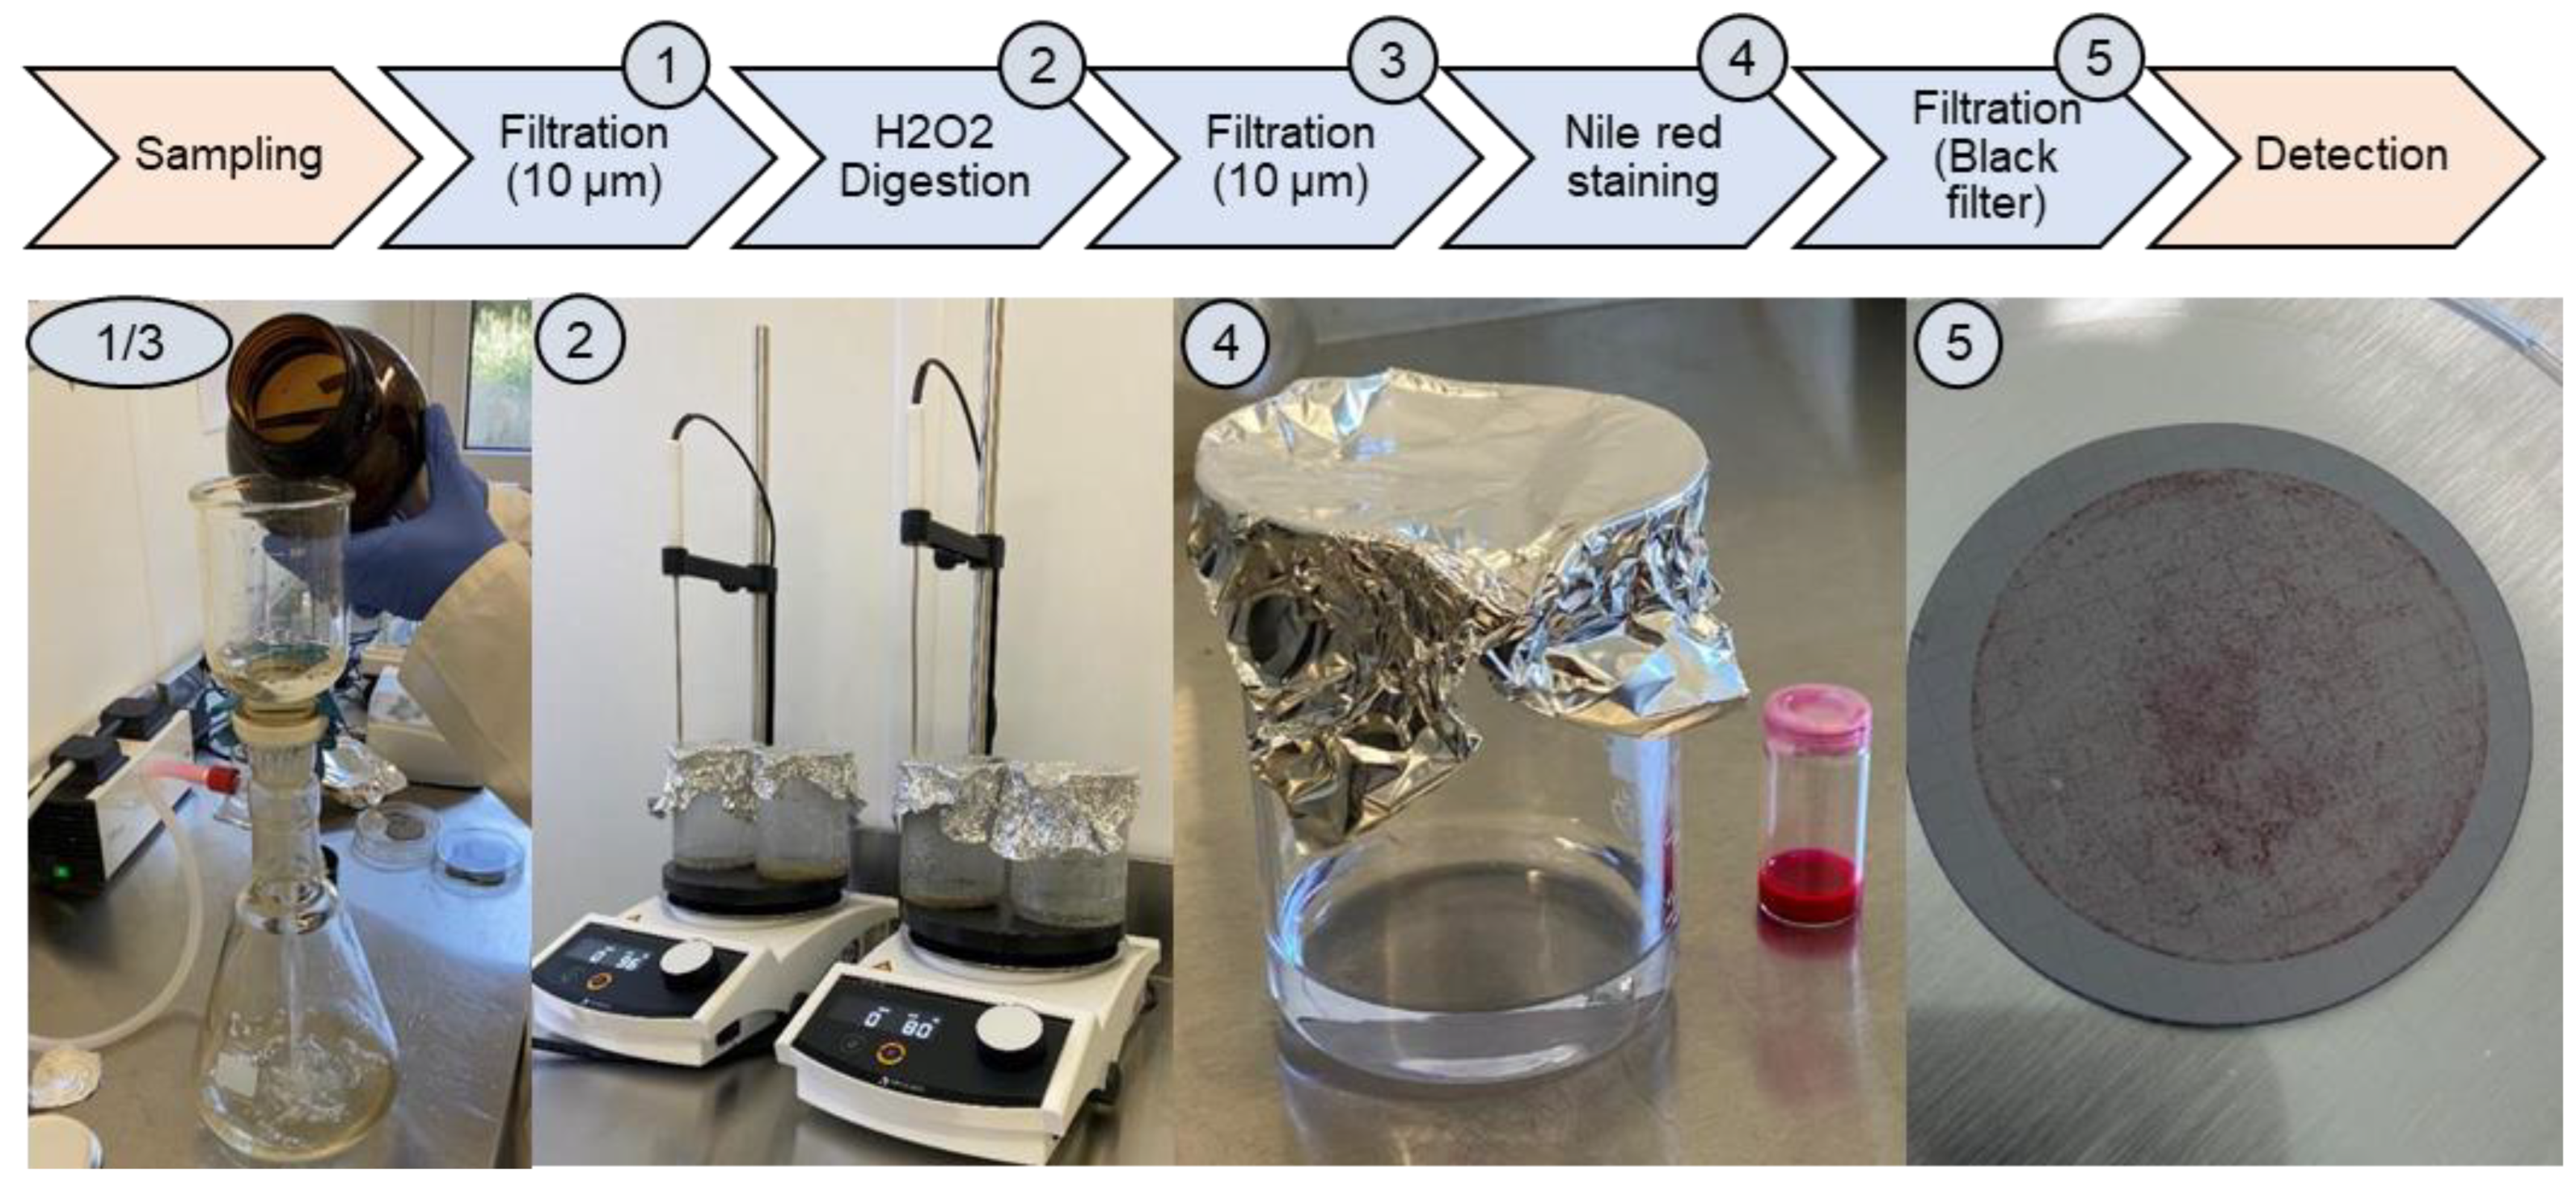
2.5. Sample Preparation

Figure 3 shows the scheme of the sample preparation in the laboratory. 500 mL of the sample are filtered over a 10 µm stainless steel sieve (custom-made, Ø 47 mm, Wolftechnik Filtersysteme GmbH & Co., KG, Weil, Germany). The stainless-steel sieves are enclosed in a metal ring so they can be sealed with black Viton sealing rings in the vacuum filtration system (DURAN® Filtering Apparatus, Cat. No. 257106304, DWK Life Sciences GmbH, Mainz, Germany), as shown in Figure S2.
To digest and reduce the number of natural particles in the sample, each sieve is placed in a 250 mL beaker and covered with 20 mL hydrogen peroxide. A total of 3–5 grains iron (II)-sulfate are added, and the hydrogen peroxide is heated up. As soon as it is brought to a boil, it is reduced to 80 °C for 4 h and subsequently left at RT for an additional 20 h.
Subsequently, the stainless-steel sieves are removed and rinsed carefully into the beaker containing the hydrogen peroxide. The mixture in the beaker is then filtered over the 10 µm stainless steel sieve, and flushed with 100 mL of water, to remove the digested organic materials. The particles from the sieve are washed from the surface of the sieve into the beaker and filled up to 100 mL with distilled water.
For the fluorescent staining, 100 µL of a 0.1 g/L Nile red stock solution in acetone is added to each beaker (c = 0.1 mg/L). After 24 h the sample is filtered over black disc filters (Metricel® Black PES Membrane Disc Filters, Pall Cooperation, Dreieich, Germany) and stored in glass petri dishes.

2.6. Laboratory Requirements and Contamination Control

To prevent contamination of the samples, only glass and metal equipment was used in the laboratory and beakers and vessels were always covered with aluminum foil [30]. The laboratory is regularly cleaned with lint free cotton cloths and a HEPA filter is operated to remove particles from the air. To prevent the entry of clothing fibers, a low-lint protective suit (4510M, 3M Deutschland GmbH, Ness, Germany) is worn and cleaned with a lint brush before entering the laboratory. Blanks were measured to control the contamination of the samples. An average blank value of 5.17 microplastics/L was subtracted from all results.

3. Results

3.1. Low Budget Modification of the Fluorescent Microscope

As explained in Section 2.1, a low budget modification of the fluorescent microscope is possible by applying a UV-Flashlight (365 nm) and a yellow-colored foil. This method was originally developed for student experiments or citizen science, to raise awareness on the topic of microplastics in the environment [29,31]. As seen in Figure S1, the colored foil has characteristics of a bandpass filter, with a less sharp transition between transmissive and blocked wavelength (edge steepness). This characteristic can vary strongly between different-colored foils and only applies for the one tested in this study.
For reliable detection, the microplastics must emit a strong fluorescence signal. Natural particles should fluoresce only weakly or not at all to prevent false positives [14]. Figure 4 shows the fluorescent images of microplastics, and natural particles stained with NR0 taken with the low budget modification of the microscope. With NR0, PA and PES show the strongest fluorescence, while PES and PE show a weaker fluorescence. PE shows the weakest fluorescence.
As natural particles show strong fluorescent signals, it is apparent that the detection of microplastics without hydrogen peroxide treatment is not possible using this method. For NR0, the digested natural particles shift their fluorescence to blue and lose their red or orange signals, a phenomenon likely caused by autofluorescence rather than Nile red staining [32,33,34]. Thus, it is easy to distinguish between microplastics and natural particles. As reliable results require a hydrogen peroxide digestion, this approach is not practicable without a basic laboratory, which makes it hardly applicable for citizen science.

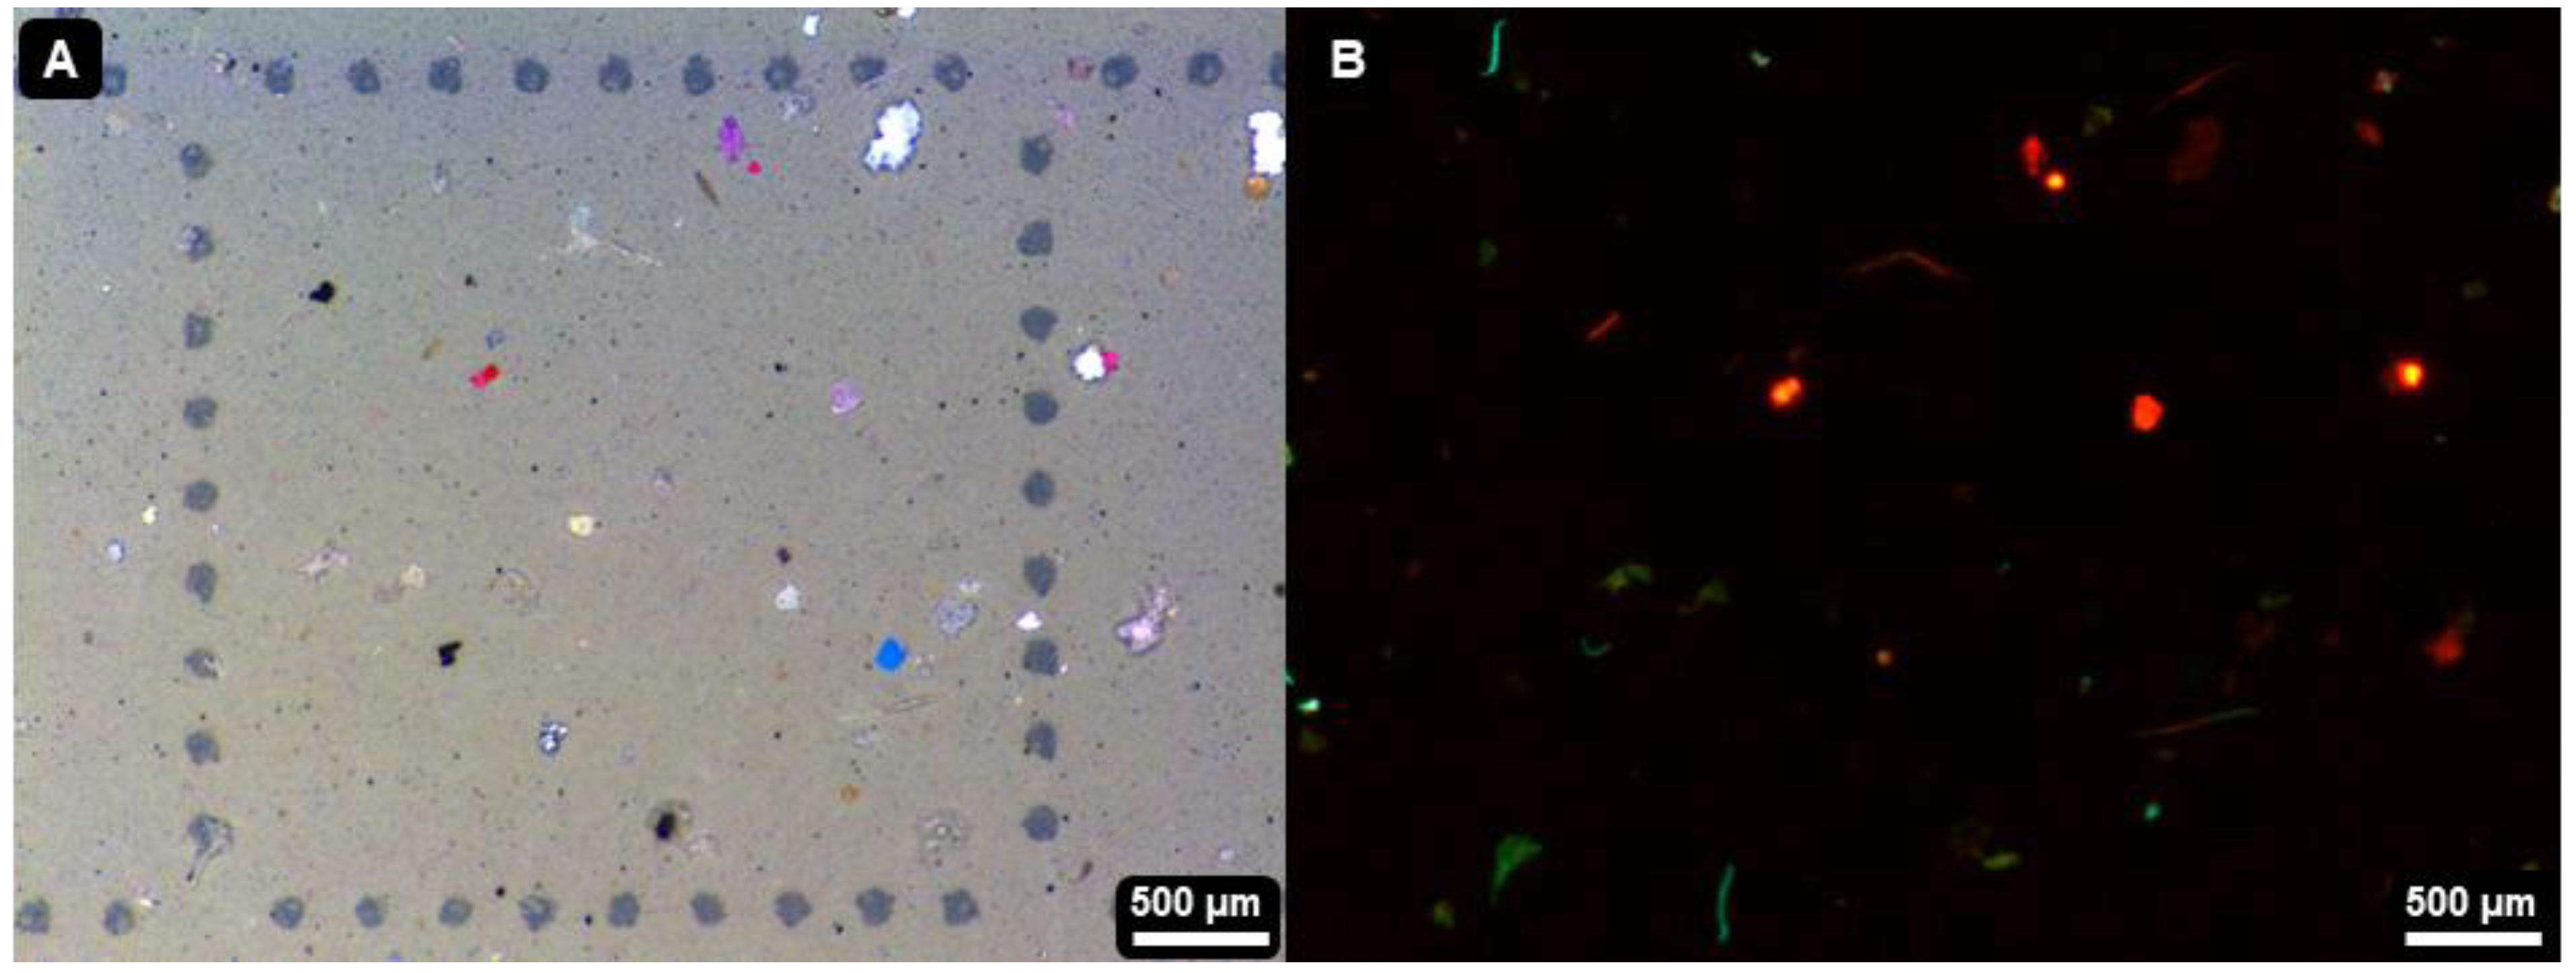
3.2. Sampling, Sample Preparation and Fluorescent Staining

The sampling process was robust and easy to apply with the developed procedure. Filtering 100 L of treated wastewater was possible even on days with high turbidity and particle loads. The time needed per sample was between 10–15 min. The only disadvantage of this method is that electricity is required.
For the sample preparation process, an essential element is a suitable filtration apparatus. Normal membrane-based filters made from polymers or paper were unsuitable in preliminary experiments, as particles and microplastics adhere strongly to the filter surface and cannot be removed completely from the filter surface. Additionally, polymeric or paper filters may contaminate the samples. Thus, stainless steel filters were implemented. The filters must be rimmed to ensure they can be sealed properly to the vacuum filtration apparatus.
For the hydrogen peroxide digestion, a relatively aggressive setting was chosen, with 35% H2O2, iron (II)-sulfate as a catalyzer and a temperature of 80 °C, [9,35]. Lower temperatures and hydrogen peroxide concentrations are less destructive to polymers sensitive to chemical digestion, such as polyamide, and for synthetic fibers [9,36]. But due to the high particle loads in the sampled wastewater, and because Nile red staining is prone to false positives caused by natural particles, the chosen setting was appropriate.
The fluorescent staining was performed in an aqueous solution, as previous studies have shown that this results in a better fluorescence intensity compared to organic solvents [37,38]. Typically, fluorescent dyes are applied by dropping the solutions onto the filters with the sample [11,39]. One major advantage of staining in water is a more even contact of the particles with the staining solution, especially for larger particles that are not evenly wetted when the staining solution is applied on the filter. Further, dropping the staining solution on the filter risks flushing the particles off the filter. Current research shows that higher staining temperatures could additionally increase the fluorescence signal [38].
The total working time needed for the sample preparation process was 10–15 min. As there is a 24-h waiting time for the hydrogen peroxide treatment and the staining process, results can be obtained within 2 days. Reducing these times would strongly accelerate the process.

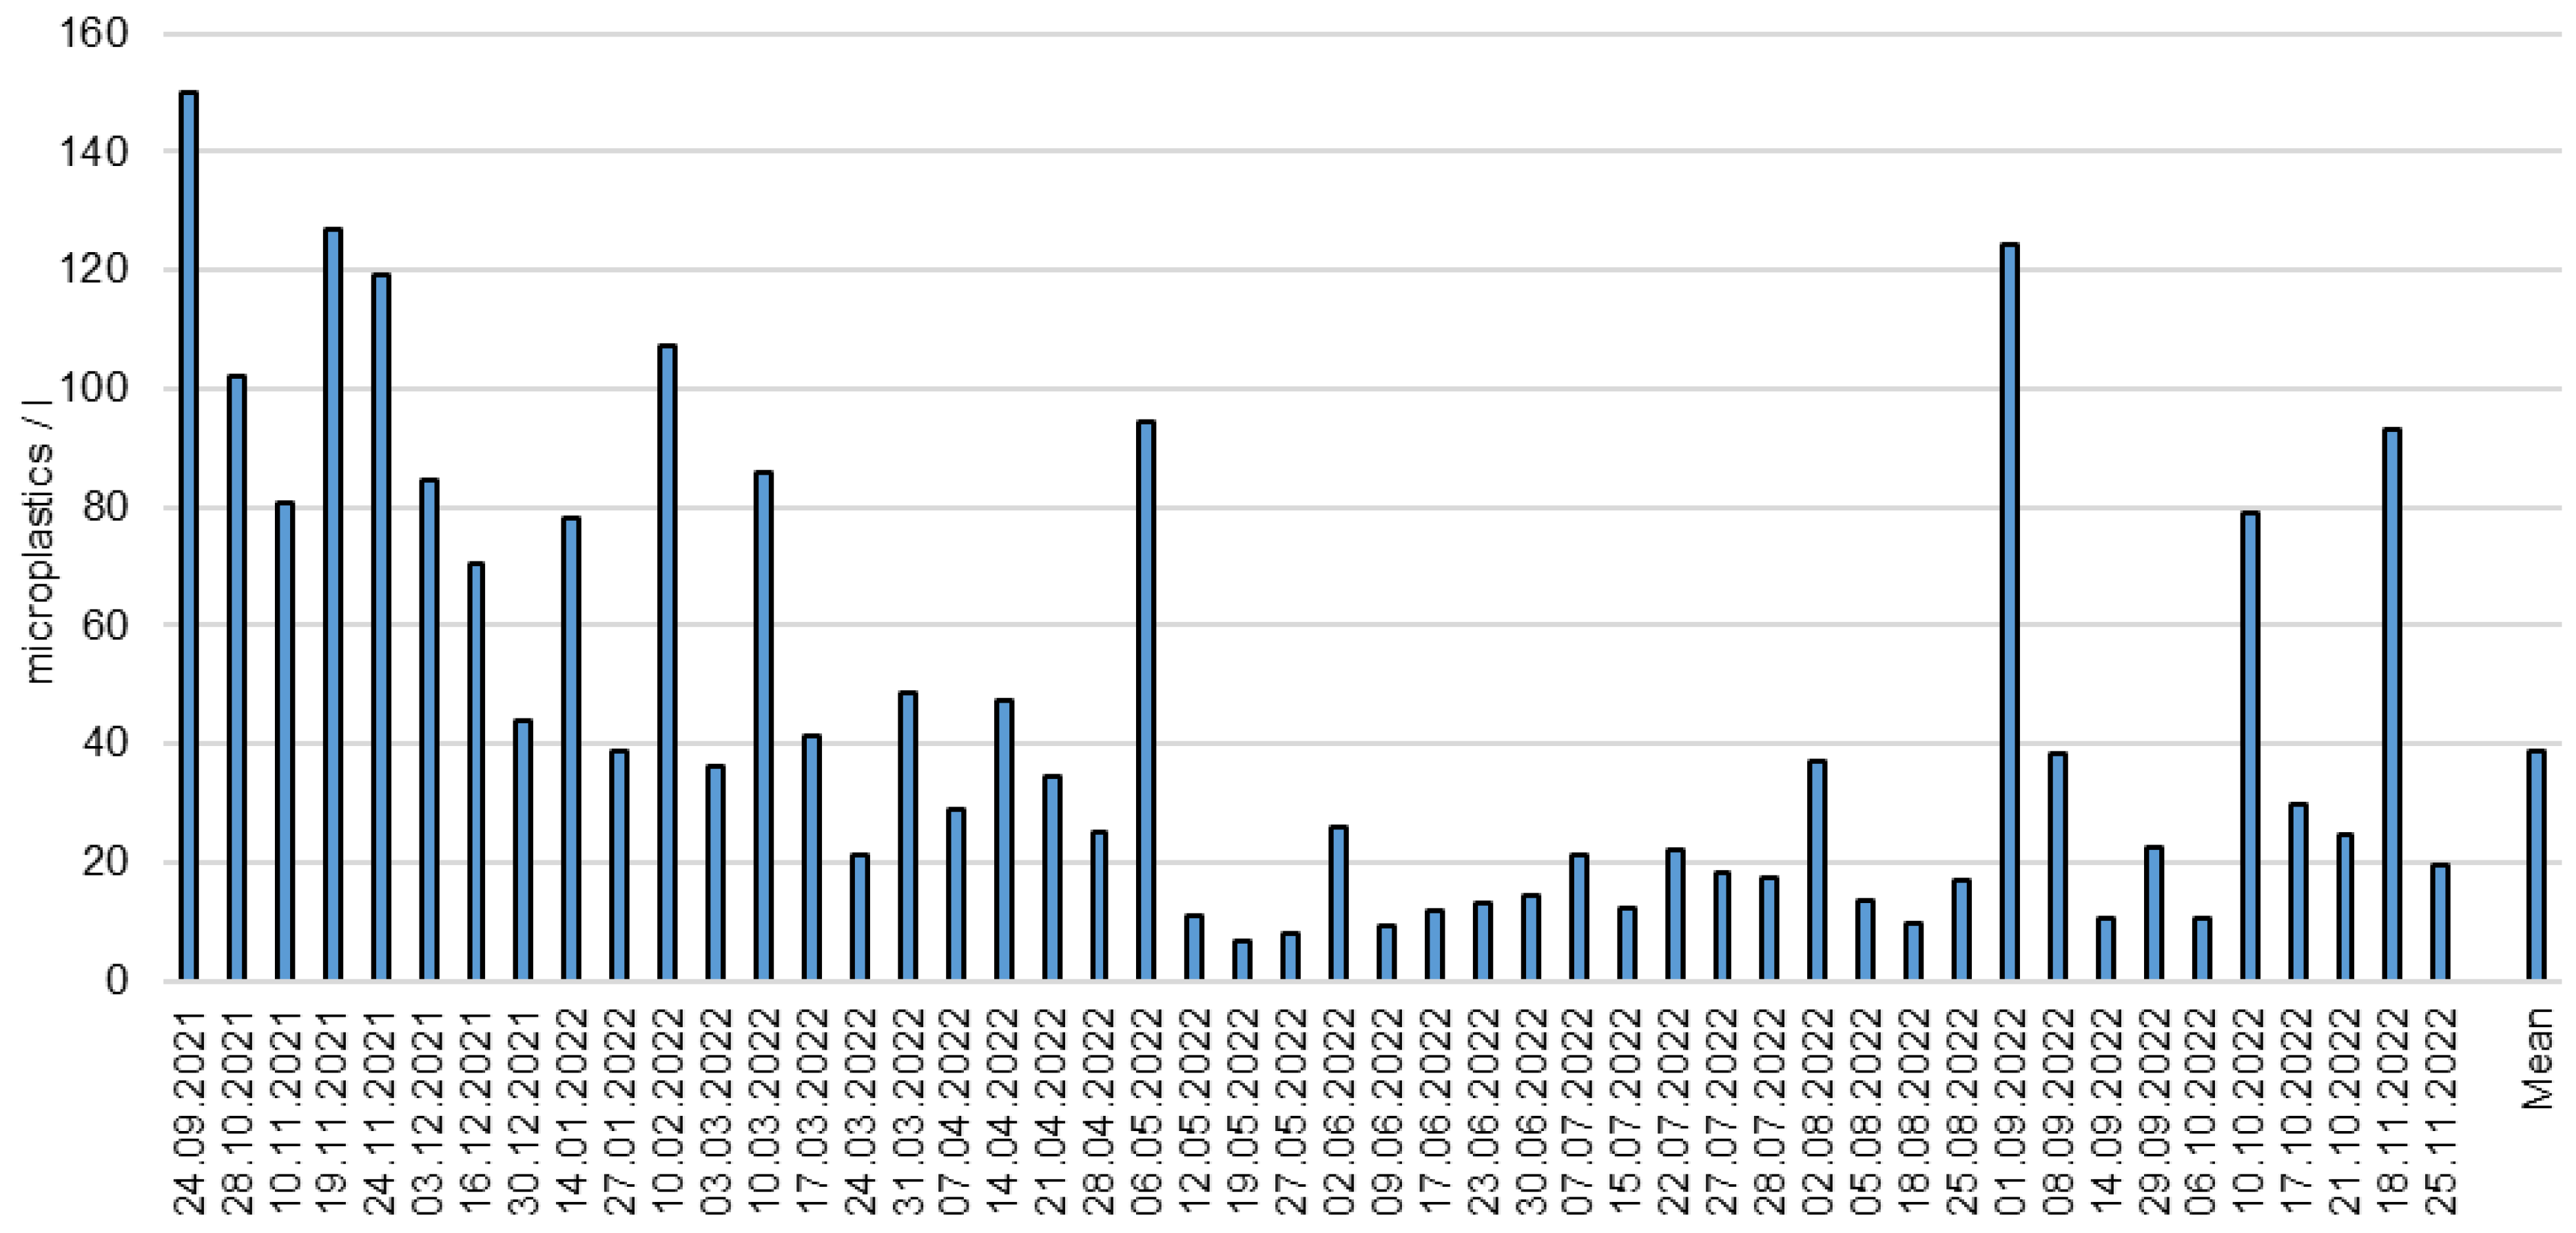
3.3. Long Time Monitoring of Microplastics in the Wastewater Treatment Plant Effluent

To test the methodology, the microplastic concentrations in the effluent of the WWTP Landau-Moerlheim were measured over a period of one year. For staining, NR0 was applied. For detection, the low budget method using the yellow-colored foil, UV lamp and manual counting was applied.
Looking at the images of the samples (Figure 5, Figures S7 and S8) the Nile red staining is helpful to identify microplastics, especially for samples with high particle numbers. Orange and yellow signals originate from microplastics, whereas blue signals are from digested organic material or from cotton or cellulose fibers.
The results of the long-term monitoring (Figure 6) show a high temporal variation in the microplastics abundance found in the WWTP effluent. The values range from 1 microplastic/L on 19 May 2022 to 145 microplastics/L on 24 September 2021. The mean is 41 microplastics/L with a relatively high standard deviation of 38 microplastics/L, due to the high variability of the microplastic contamination. The median of 24 microplastics/L shows that there are more values below rather than above the average. This demonstrates that single subsamples are unsuitable to control the microplastic emission of wastewater treatment plants. Regular sampling with a high number of samples is necessary to observe the temporal variations.
With an average water discharge of 17,260 m³/day and 6.3 million m³/year the average microplastic discharge amounts to 572 million microplastics/day and 209 billion microplastics/year. With a total of 55,000 inhabitants in the catchment area, this averages to 10,409 microplastics/inhabitant per day and 3.9 million microplastics/inhabitant per year.
Azizi et al. (2022) reviewed 407 studies of microplastics in wastewater treatment plants [40]. Reported concentrations were in the range of 0.003–447 microplastics/L in the effluent of tertiary wastewater treatment plants, with an average of 29 microplastics/L. Our results fall in the range of the reported contamination levels for wastewater, but due to the various sampling, sample preparation and detection methodologies across studies, the results are difficult to compare [41]. This demonstrates the need for standardized sampling, sample preparation and detection methods. Additional reasons for the observed variations in the composition of the incoming wastewater may include geographical location, social aspects, such as the use of plastics and microplastics of people living in the catchment area and industrial discharges [42].
The results of this study show a higher microplastic contamination during cold weather periods. However, seasonal variations are not yet fully understood. Some studies show lower concentrations in rainy seasons due to the dilution of the wastewater with rainwater [42,43]. Other studies reveal higher microplastic pollution in cold weather periods related to a higher input of road (surface) runoff that is contaminated by microplastics and a higher usage of washing machines [44,45]. Another factor affecting the microplastics found in the effluent is the hetero-aggregation with organic matter and thus the incorporation into the activated sludge, which affects the settling behavior [46]. The flock formation and resulting settling behavior is typically better during periods of warm weather.
It was notable that most samples taken before 6 May 2022 were contaminated with spherical microbeads, which were not detected after this date (Figure S6). These microbeads are typical for industrial processes, such as polishing or sand blasting, or may be due to the microbeads found within personal care products. Due to the abrupt change, whereby no more microbeads were detected, it can be assumed that the contributing industrial process was changed or shut down.
Temporal variations could also be seen within the sampling days. For example, the sample taken on 10 October 2022 (Figure S9) shows a strong variation of the contamination levels within a span of 15 min. Sample A (12:45) has a contamination of 13 microplastics/L and sample B (13:00) 135 microplastics/L, which is 10 × higher. This demonstrates that the temporal variations of microplastics also occur on a small-time scale, due to the heterogeneous distribution of suspended microplastics in water. Also, almost no fibers were found, which is unusual for WWTP effluents, which might be caused by the digestion of fibers during the hydrogen peroxide treatment [47,48]. Therefore, the concentrations are likely to be underestimated.

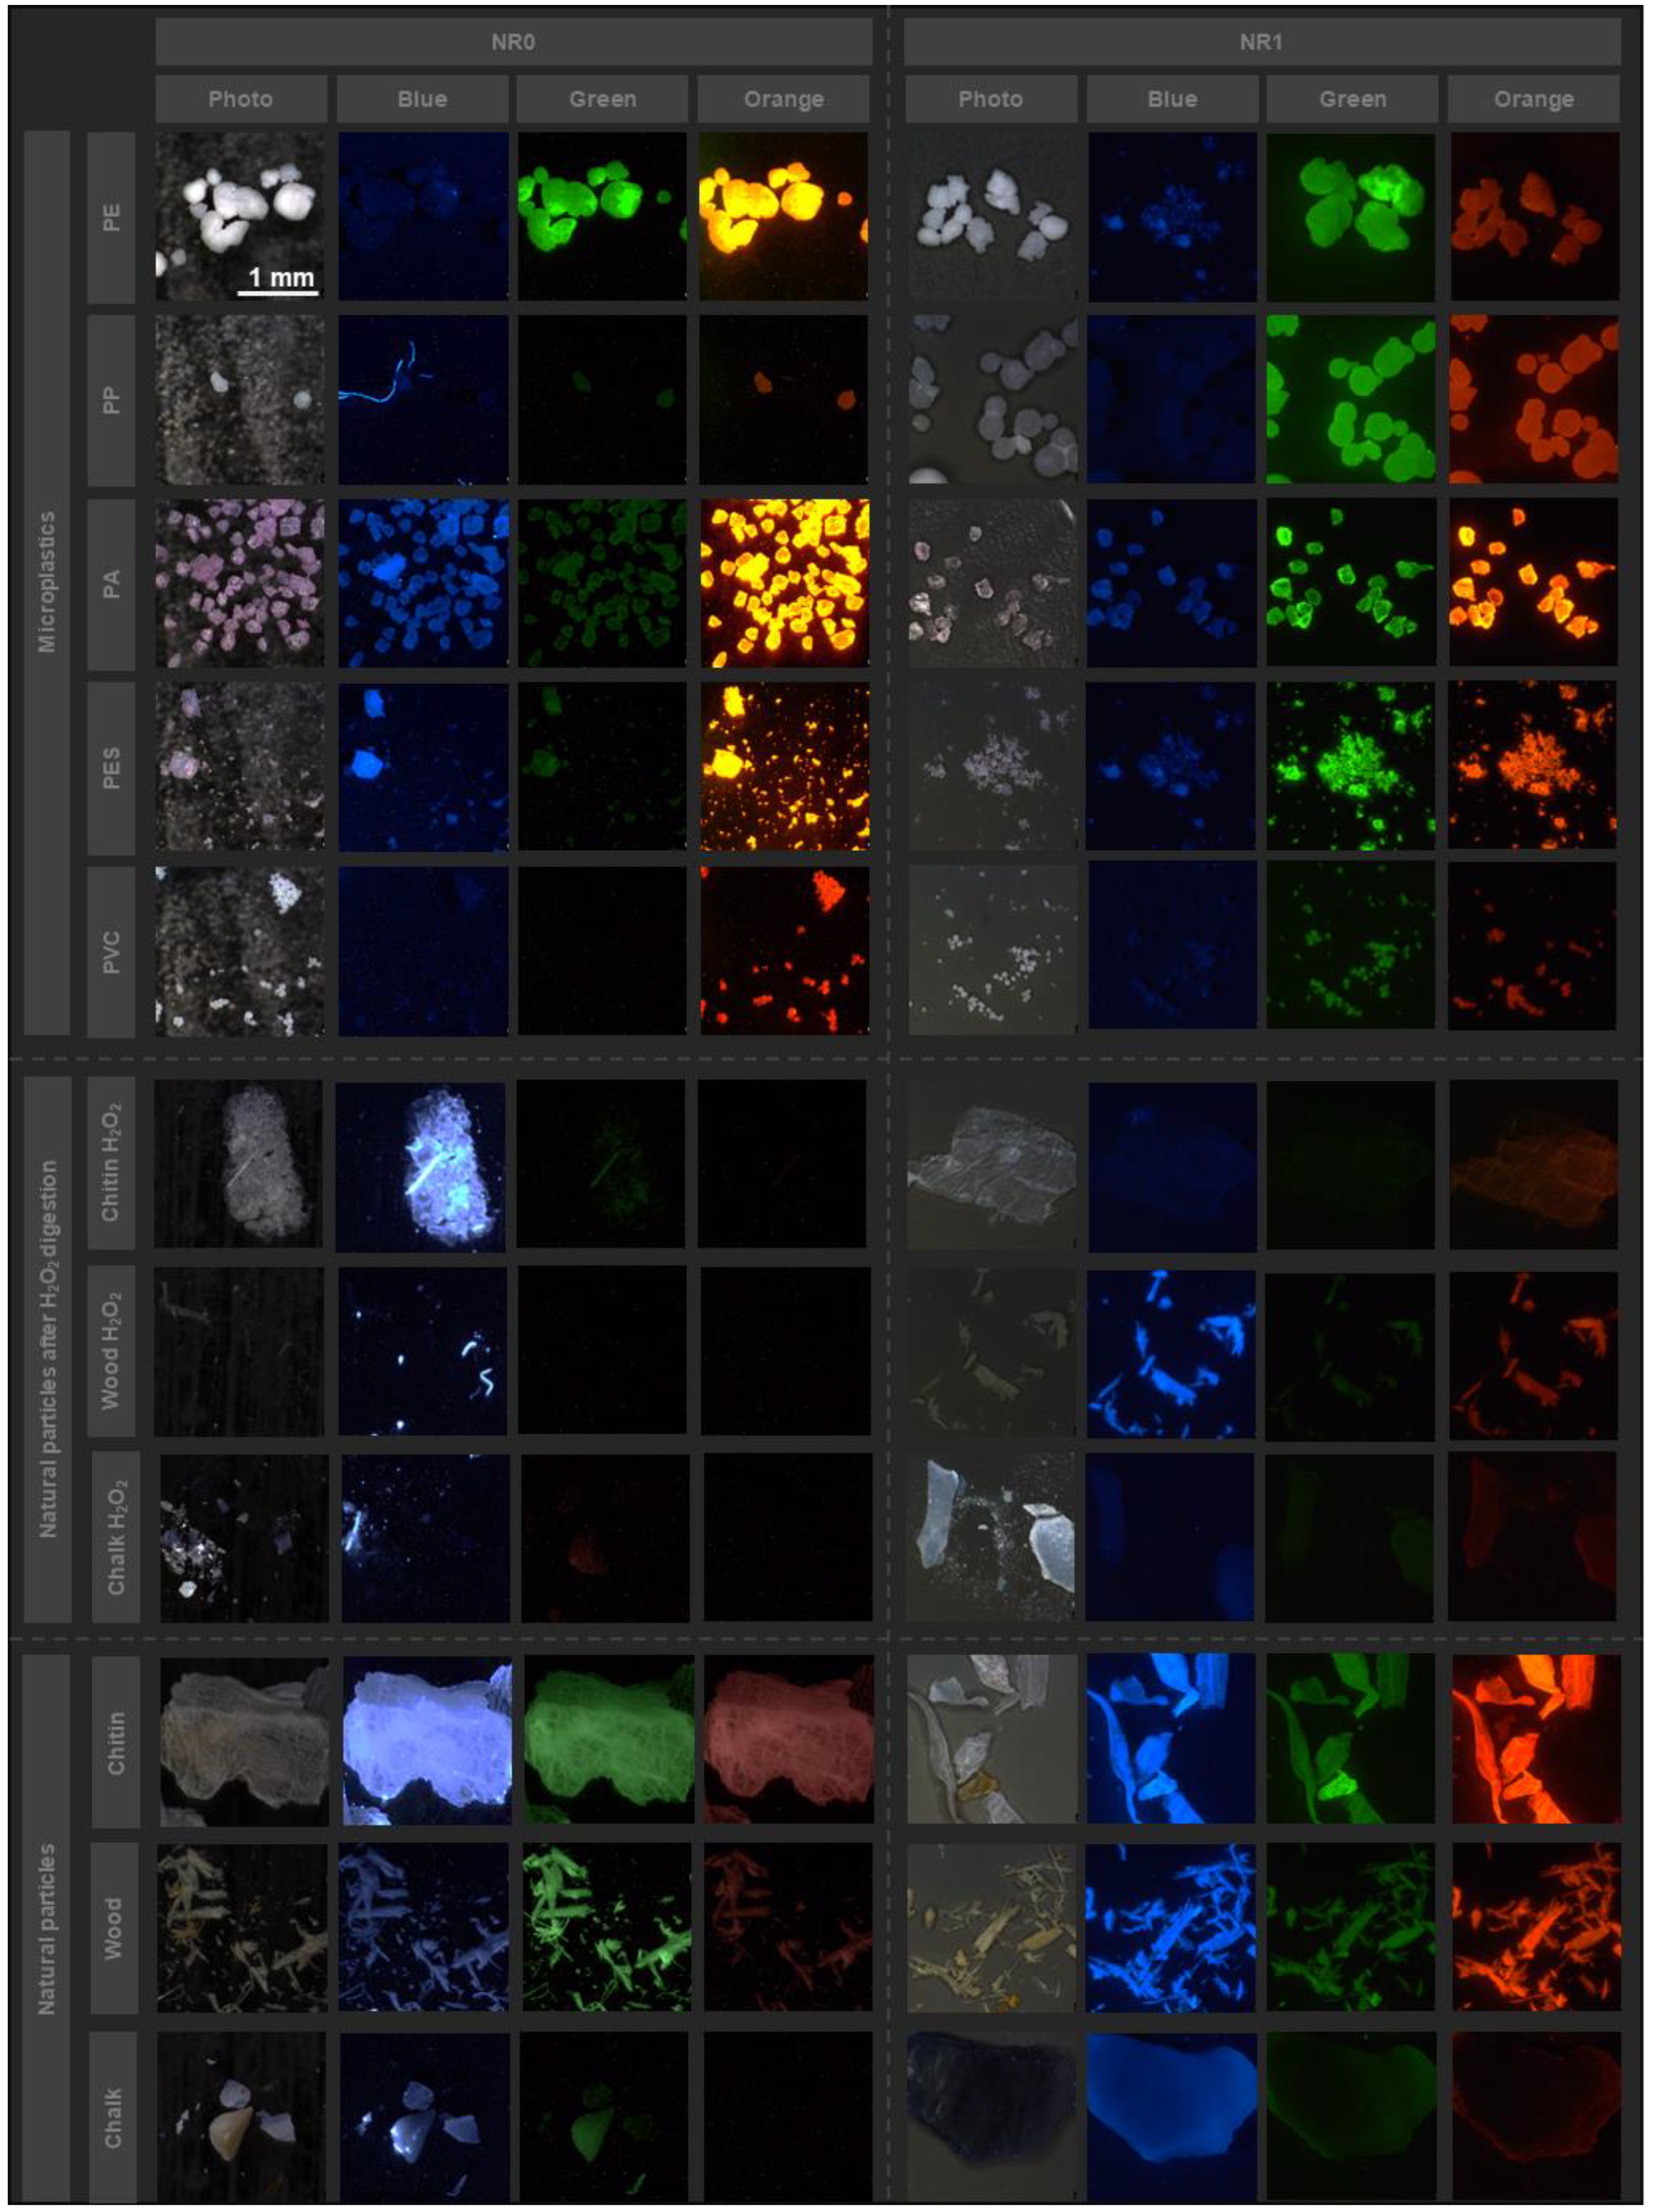
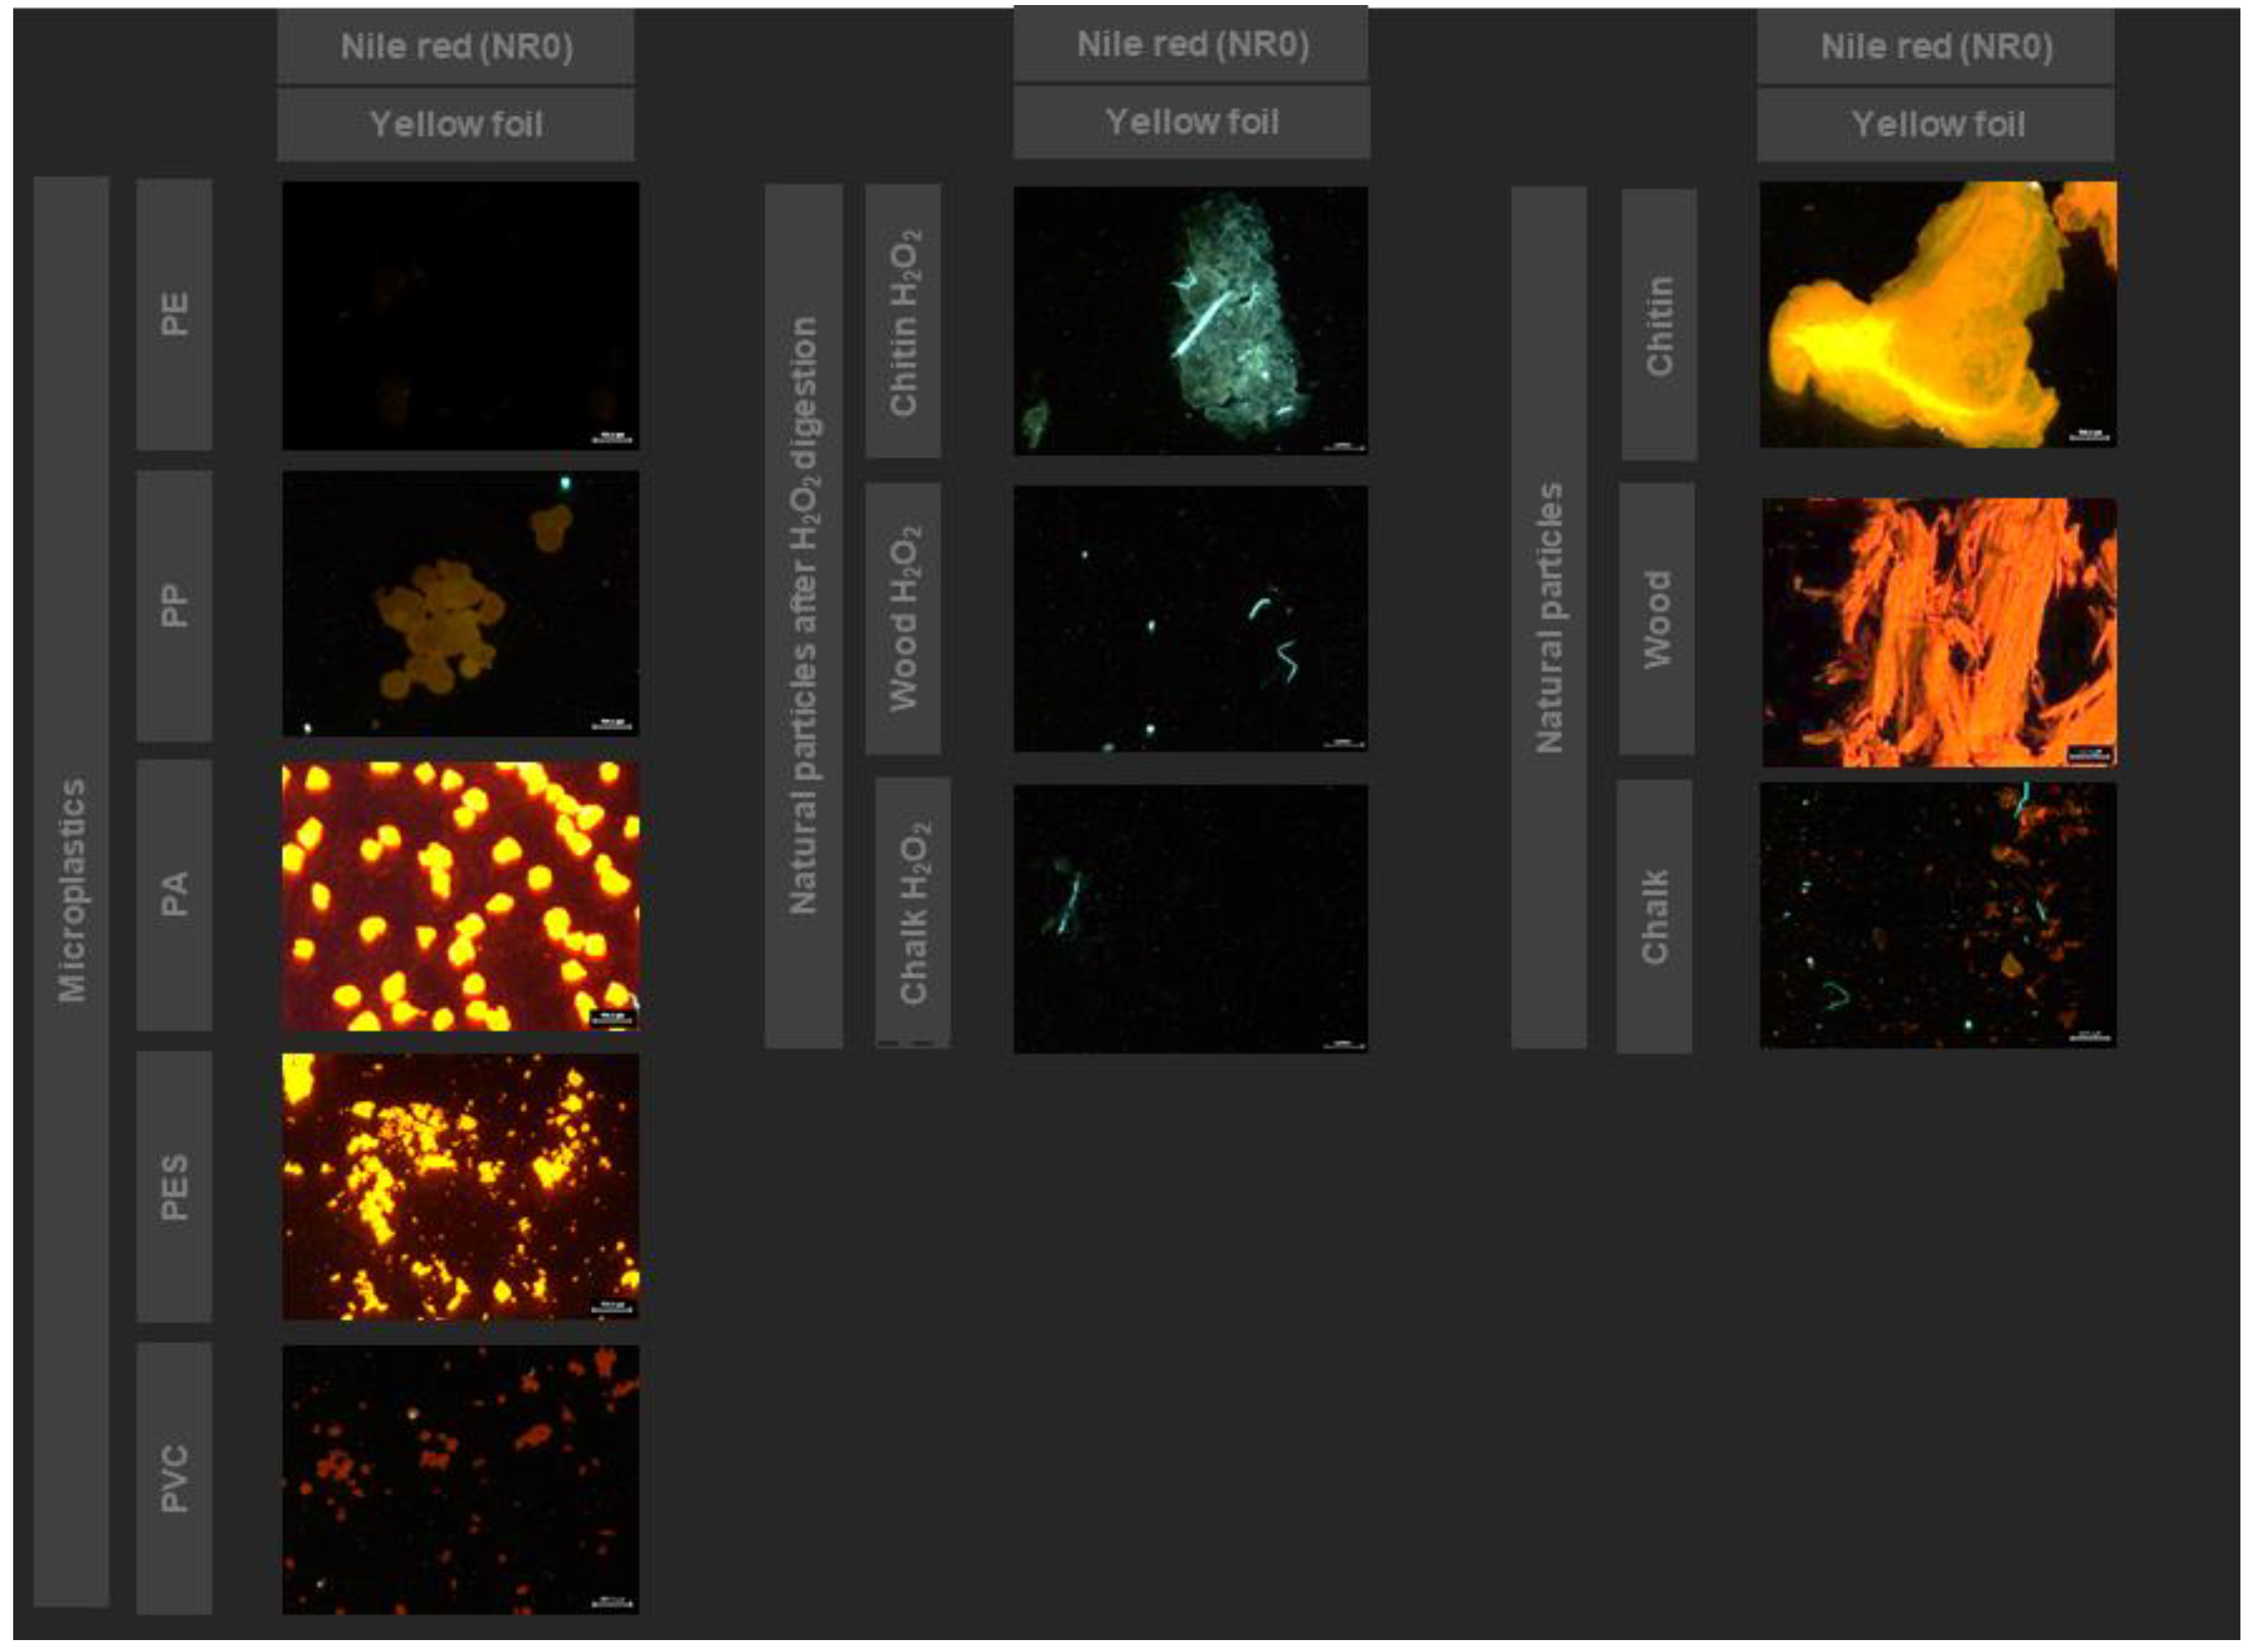
3.4. Investigation of the New Nile Red Derivatives for Microplastics Detection

The new Nile red derivatives (NR1), which were developed to make the detection process more precise through improved staining properties, are tested in Figure 7. Previous studies have shown that green fluorescence is best suited to avoid false positives by natural particles [37]. The NR1 show a strong increase in green fluorescence for PP, PA and PES, and a slight increase for PVC is visible. But hydrogen peroxide treatment of the samples is still necessary to avoid false positives by natural particles. NR0 with orange fluorescence also shows good fluorescence for all microplastics except PP, the second most produced plastic type, which shows only a weak fluorescence. For both NR0 and NR1, blue fluorescence is unsuitable to differentiate between natural particles and microplastics. Thus, the NR1 with green fluorescence show the best results for selective microplastic detection and the ability to distinguish them from natural particles.
Figure S10 shows the results of the fluorescent images taken with the low-budget modification. Compared to NR0, an increased fluorescence intensity can be observed for PE. PP and PA have a weaker fluorescence. The digested natural particles maintain their fluorescence color, but with a weaker signal. Thus, using the combination for the chosen low budget modification of the microscope and the NR1 is not suitable for reliable microplastics detection.
The differences between the various polymer types and natural particles are caused by the solvatochromic effect of the Nile red stain [49]. During the staining process the Nile red adsorbs to the polymer surface or into the polymeric network [37]. Depending on its polarity, the emission band of Nile red is altered. The emission of less polar polymers (PE, PP) is shifted towards green/yellow fluorescence, while the emission of more polar polymers (PA, PES, PVC) is shifted towards orange/red fluorescence. With modern fluorescent microscopes capable of phasor imaging and fluorescence lifetime imaging, these shifts in the emission spectra can also be used to determine the specific polymer type [26,50,51].
Previous studies have already shown that the chemical modification of Nile red can lead to an improved interaction with microplastics and a better selectivity and better fluorescence signals [37]. The modification of dyes offers an opportunity to significantly increase the potential of microplastics detection using fluorescent markers and to make the method more reliable. Also, other promising fluorescent dyes, such as 4-dimethylamino-4′-nitrostilbene, Rhodamine B, or 4′,6-diamidino-2-phenylindole (DAPI), are currently discussed in scientific literature, but less investigated than Nile red [52,53,54].
As microplastics can consist of a large number of polymer types, in further studies more polymer types, such as polyurethane, polycarbonate, polystyrene, polyethylene terephthalate or polytetrafluoroethylene should be tested [2,3,17]. It is expected that polymer types with low polarity as polystyrene or intermediate polarity as polyurethane, polycarbonate, polyethylene terephthalate are well detectable. Due to its halogenation polytetrafluoroethylene could lead to similar difficulties in detection as PVC.

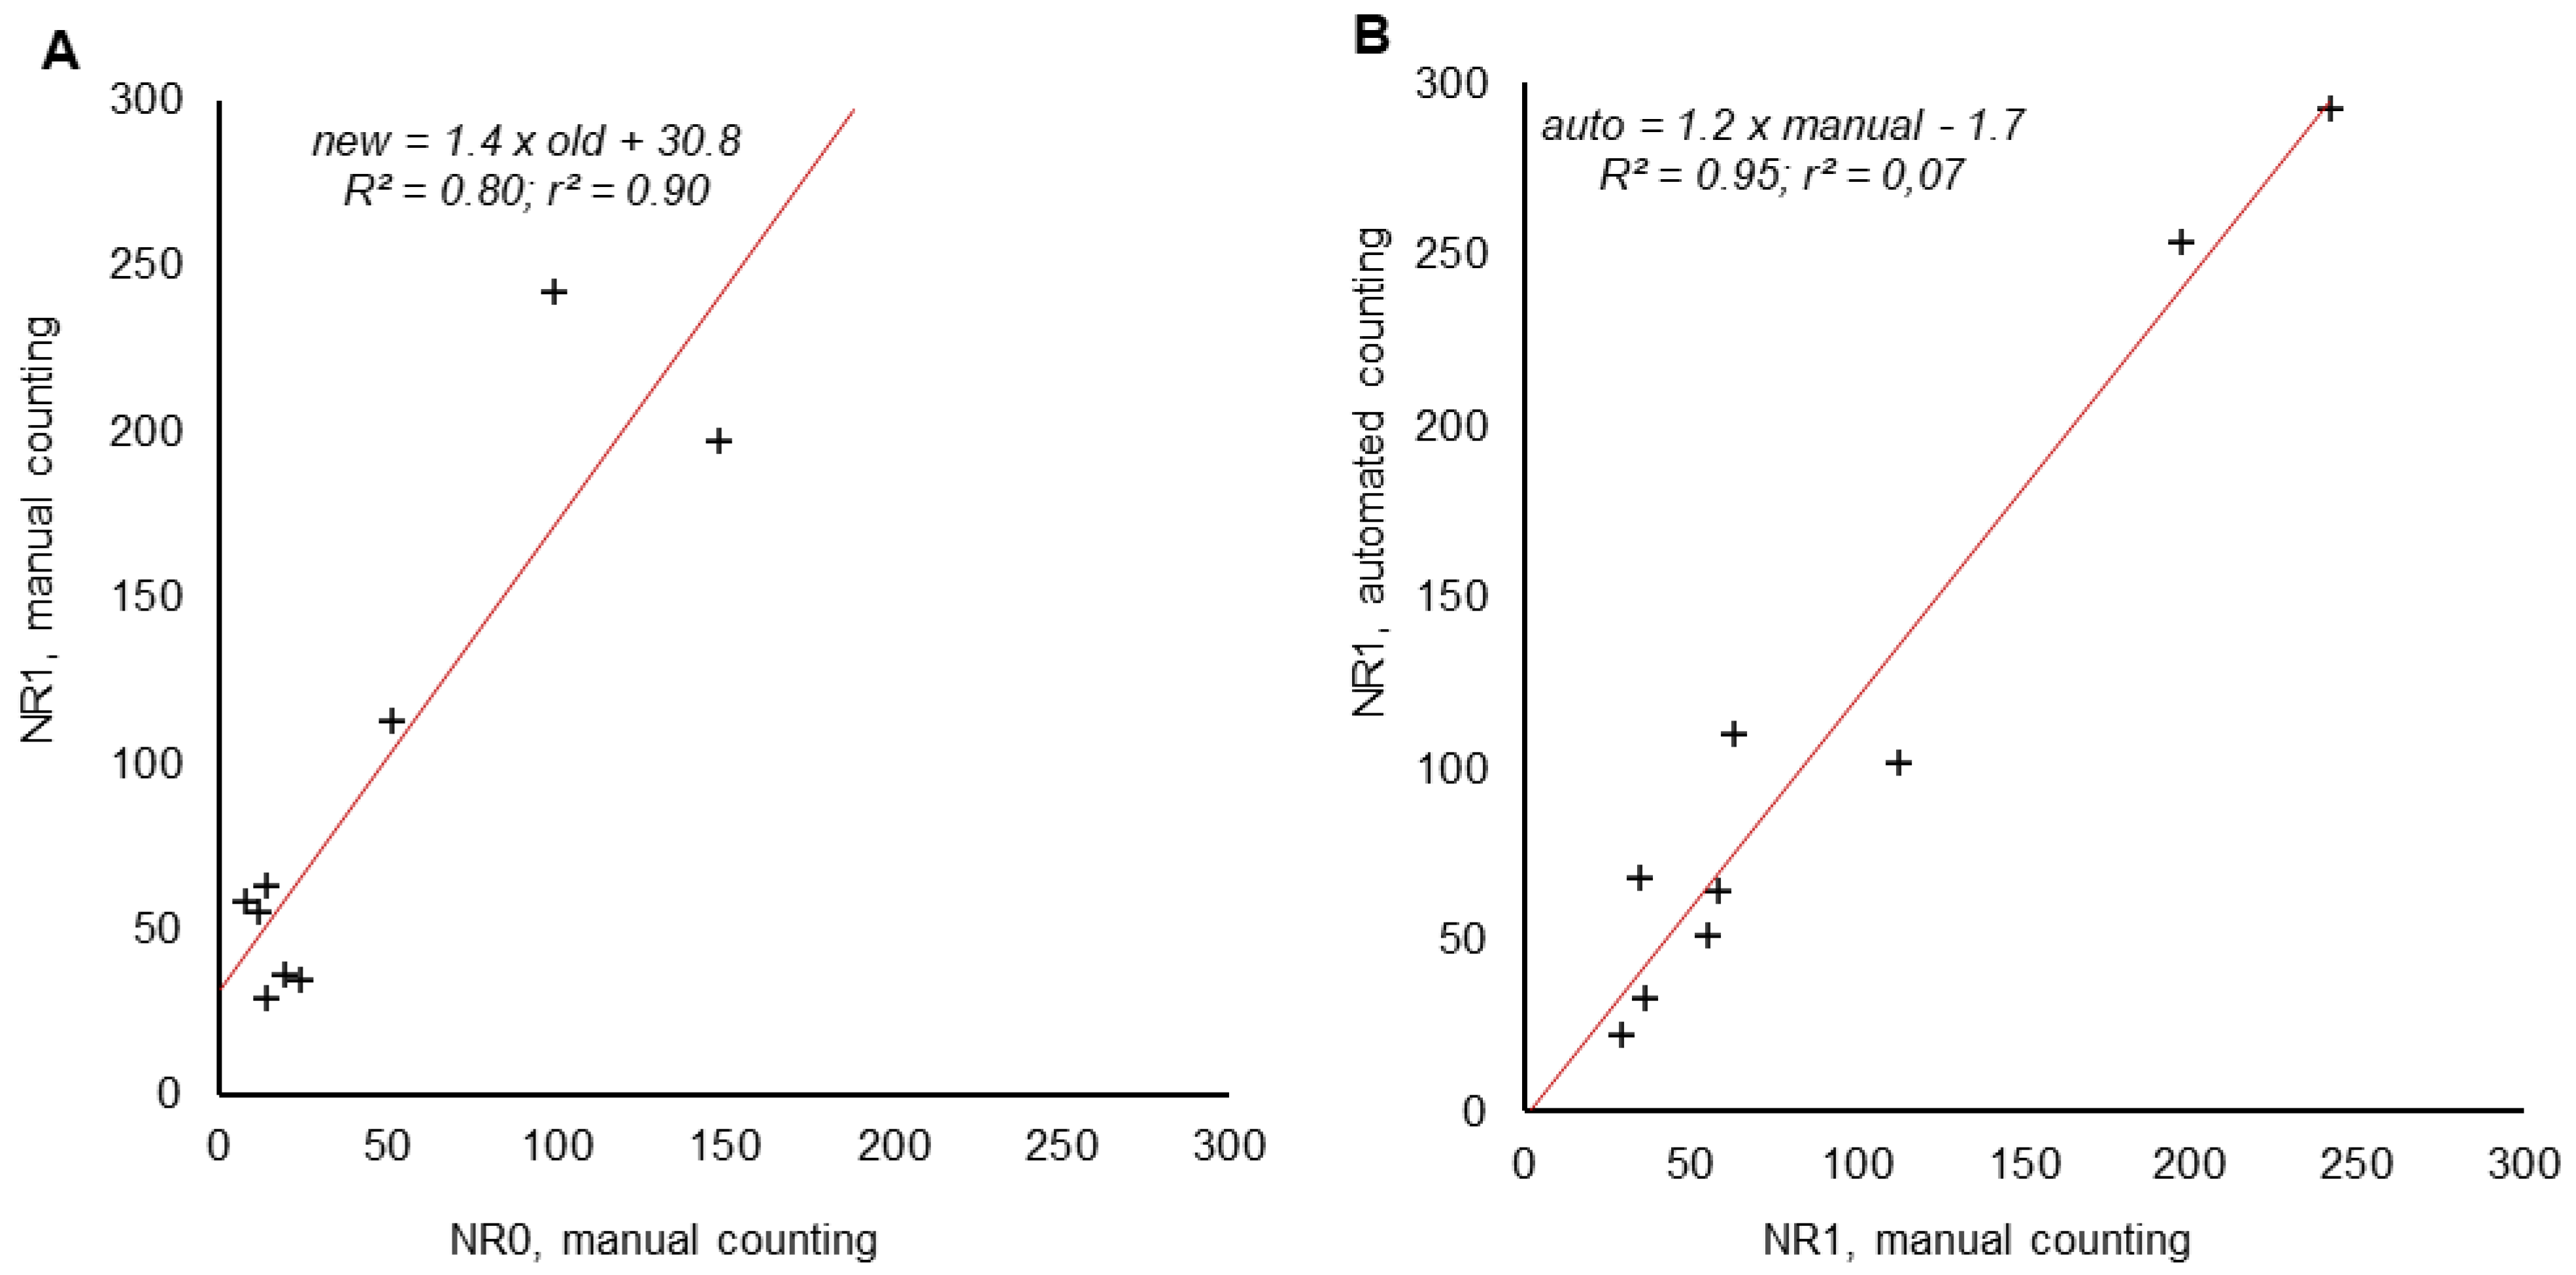
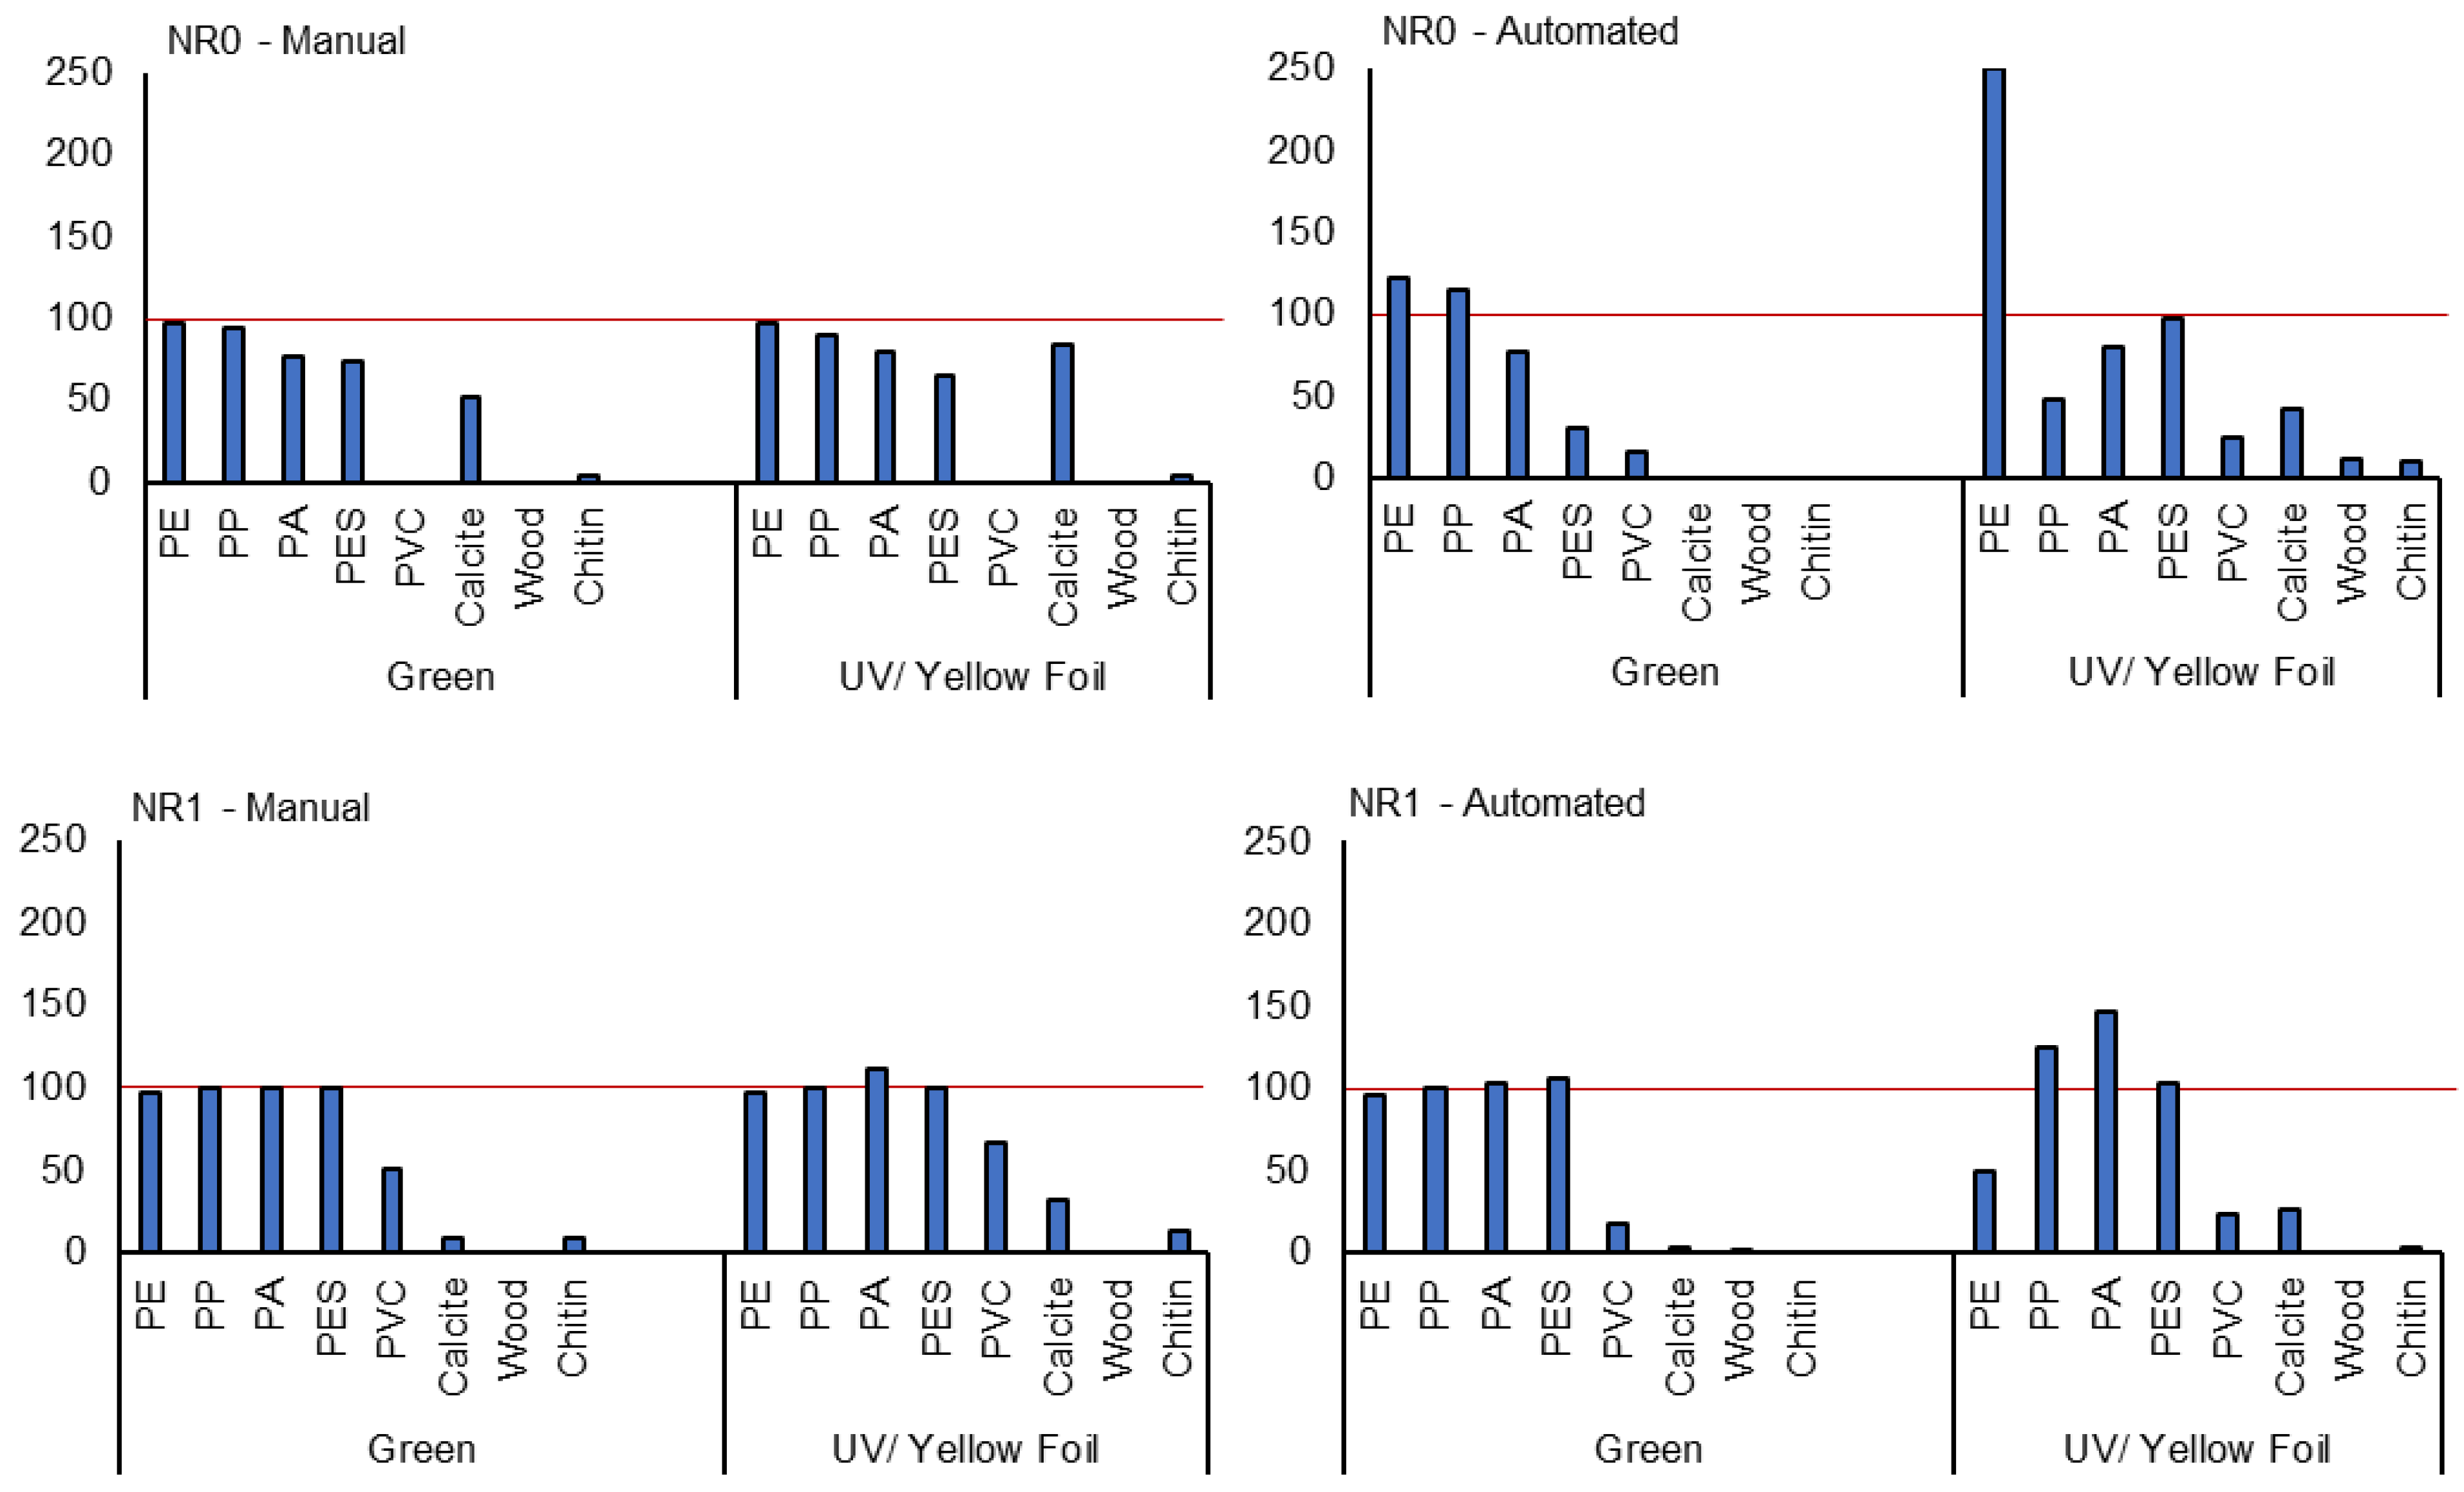
3.5. Recovery Rates and Comparison of Automated and Manual Particle Detection

To compare the performance and reliability of the developed methods, recovery rates of the NR0 and the NR1 were compared (Figure 8, Figures S3 and S4). Additionally, the more expensive modification for fluorescent imaging of the microscopes using the bandpass filters is compared with the low-budget method using color foils.
When comparing the results between the green fluorescence and the yellow color foil for the NR0 with manual counting, PE and PP can be well detected, while PES and PA are underestimated, and PVC cannot be detected. The biggest drawback is the risk of false positives by calcite. But comparing the two modifications (see Figure S5), the yellow-colored foil and UV lamp are a valid alternative as a low budget method for microplastic detection.
Comparing this to the NR1 and manual detection, the NR1 show a much more precise detection for PA und PES due to the improved fluorescence properties. Additionally, PVC can be partially detected. Due to higher brightness differences with NR1, the risk of false positives is reduced (see Figure 7). This illustrates the advantages of NR1 over the NR0.
Previous studies have shown that differences of the intensity of the fluorescence signals respective the brightness differences are essential for automated particle detection [17,55,56]. Looking at the automated particle detection, the best and most reliable results are reached using the NR1 with green fluorescence. Because of the improved fluorescence properties, it is easier to determine a suitable threshold where the software can distinguish between microplastics and natural particles [17,55].
For the fluorescence intensity or brightness, there are not only variations between different polytypes, but also variations within polymer types and even within single particles. This results in an uneven fluorescence emission and poses an additional challenge to determine reliable thresholds [17]. Overestimations, for example for PE using the yellow-colored foil and NR0, were caused by single particles with an uneven fluorescent brightness being detected as various particles. This effect is visible in the fluorescent images of the stained reference particles taken to determine the recovery rates (Figures S3 and S4).
The biggest advantage of automated particle counting is that it is a user-independent process and therefore comparable. Further, automated microplastic detection can be improved by combining different fluorescence wavelengths [56,57]. Currently, setups for continuous microplastic detection using in-situ fluorescent staining and imaging in flow cells are being tested [27,28]. This further highlights the potential of automated microplastic detection using fluorescent staining. New and more reliable fluorescence markers with improved fluorescence signals and better selectivity for microplastics are essential for this process. The final goal for in-situ fluorescent detection is to have fluorescent markers which have such a high selectivity for microplastics, but do not require a sample preparation or hydrogen peroxide treatment.

3.6. Comparison of Nile Red with the New Derivatives on Wastewater Samples

To compare these results of the monitoring using NR0 with the low budget-fluorescent microscope to the improved method using the NR1 with green fluorescence, the microplastic levels of nine samples were measured with both methods (Figure 9). The results show that on average, 3.1 times more microplastics are found when applying the NR1. Looking at the linear correlation, the slope is 1.4 with an offset of 30.8 microplastics. This may be due to the improved detection of polar polymers. Only five polymer types were investigated in this study, but the positive effects should also be transferable to the many other polymer types found in wastewaters and the environment, e.g., polystyrene, polyurethane, polycarbonate, or polyethylene terephthalate [58,59].
The ratio between manual and automated particle counting is 1.2. This is mainly caused by both smaller particles and particles with a brightness close to the threshold being underestimated in the manual counting. This indicates that automated particle counting is more reliable and comparable than manual particle counting.
Table 7 shows the amounts of microplastics which are extrapolated from the linear regression. The average discharge increases from 41 microplastics/L to 103 microplastics/L using the NR1 with green fluorescence and automated counting. Per day and per inhabitant, it is an increase from 10,409 microplastics to 27,211 microplastics. The chosen fluorescent dye, imaging and counting method all have a strong influence on the result. This shows how important it is to have standards for microplastics detection with fluorescent staining to obtain comparable results. Further research should focus on cross validation of this method, e.g., with Raman or FTIR microscopy to ensure its precision. Nevertheless, this method can be recommended to obtain an estimation of the contamination level and to investigate temporal variations, where high sample numbers are required. Also, it is applicable for specific use cases with known polymer types and background contamination, such as industrial wastewater or in beverages.

4. Discussion

Fluorescent staining with Nile red and the low budget modification of the microscope using the UV flashlight together with the yellow-colored foil is an alternative for inexpensive microplastic monitoring. The modification can be done with materials for less than EUR 30. The long-term monitoring at the WWTP showed that the sampling, sample preparation and detection method can be applied to obtain comparable results of microplastic contamination of waters. Including sampling, sample preparation and detection, the total working time amounts to 45 min per sample.
To improve the detection process, newly developed Nile red derivatives were tested. The results show that the chemical modification leads to an increased selectivity in the staining of microplastics and to a better fluorescence intensity. The recovery rates confirm these results. By applying green fluorescence microcopy, microplastics can be detected more reliably than with the NR0. WWTP effluent samples comparing the new derivatives with the standard Nile red show on average 3.1 times more microplastics. In addition, automated particle counting made the process more comparable and reliable, particularly for smaller microplastics.
This method is especially well suited for routine monitoring of microplastics where temporal variations need to be controlled and methods such as FTIR microscopy, Raman microscopy, or Py -GC-MS would result in high costs. It is also well suited for cases where the polymer composition and background contamination are known, e.g., beverages or industrial effluents.

Supplementary Materials

The following supporting information can be downloaded at: https://www.mdpi.com/article/10.3390/analytica4010004/s1, Figure S1: Transmission spectra of the yellow-colored foil used as emission filter; Figure S2: Setup of the vacuum filtration device for the filtration of the microplastics in the laboratory; Figure S3: Images taken to determine the recovery rate of microplastic, and natural particles stained with Nile red (NR0); Figure S4: Images taken to determine the recovery rate of microplastic, and natural particles stained with Nile red derivatives NR1; Figure S5: Comparison of the photos taken of processed wastewater samples stained with Nile red (NR0); Figure S6: Microscope images of the sample of the WWTP effluent from 10 October 2021; Figure S7: Microscope images of the sample of the WWTP effluent from 10 February 2022; Figure S8: Microscope images of the processed and stained wastewater samples; Figure S9: Fluorescent images of the of the processed and stained wastewater samples on 10 October 2022; Figure S10: Fluorescent images of microplastics and natural particles stained with Nile red (NR0) and the new derivatives (NR1).

Author Contributions

Conceptualization, M.T.S. and K.S.; methodology, M.T.S. and K.S.; validation, M.T.S. and A.K.; formal analysis, M.T.S.; investigation, M.T.S., D.S. and A.K.; data curation, M.T.S. and K.S.; Writing—Original draft preparation, M.T.S., E.M. and K.S.; Writing—Review and editing, M.T.S. and E.M.; visualization, M.T.S.; supervision, K.S. and M.T.S.; project administration, K.S.; funding acquisition, K.S. All authors have read and agreed to the published version of the manuscript.

Funding

The research projects of Wasser 3.0 (www.wasserdreinull.de, accessed on 28 January 2023) are conducted by sponsors and donors. Wasser 3.0 gGmbH is a non-profit company with strong focus on responsible research, education, and communication. The enterprise abcr GmbH (www.abcr.de, accessed on 28 January 2020) from Karlsruhe (GERMANY) is directly involved in the project as an industrial partner. This work is partly funded by Vector Stiftung/GERMANY (project REC-MP, identification number: P2021-0092) and by the Veolia Foundation/GERMANY. Further, this study was part of a funding of the Ministry of Climate Protection, Environment, Energy and Mobility Rhineland-Palatinate/GERMANY identification number: 4-3660.

Data Availability Statement

All data are provided in the Supplementary Part.

Acknowledgments

The authors thank EW Landau (GERMANY), Nordic Water GmbH (GERMANY), Van Remmen UV Technology (NETHERLANDS) and NOURYON (Sweden) for the project-related support and provision of the pilot plants. The authors additionally acknowledge special support from Elena Sergeeva, Truong Giang Do, Vitalii Petryk, Sergey Sergeev and Daniel Fürniß from abcr service lab for the fruitful discussion about fluorescent dyes and their application.

Conflicts of Interest

The authors declare no conflict of interest.

References

  1. Yusuf, A.; Sodiq, A.; Giwa, A.; Eke, J.; Pikuda, O.; Eniola, J.O.; Ajiwokewu, B.; Sambudi, N.S.; Bilad, M.R. Updated review on microplastics in water, their occurrence, detection, measurement, environmental pollution, and the need for regulatory standards. Environ. Pollut. 2022, 292, 118421. [Google Scholar] [CrossRef] [PubMed]
  2. Zhang, Y.; Wu, H.; Xu, L.; Liu, H.; An, L. Promising indicators for monitoring microplastic pollution. Mar. Pollut. Bull. 2022, 182, 113952. [Google Scholar] [CrossRef] [PubMed]
  3. Adhikari, S.; Kelkar, V.; Kumar, R.; Halden, R.U. Methods and challenges in the detection of microplastics and nanoplastics: A mini-review. Polym. Int. 2022, 71, 543–551. [Google Scholar] [CrossRef]
  4. Sangeetha, D.; Shivani, A.; Anusha, J.; Ranjitha, J.; Narayanan, V. A Critical Review on Separation, Identification, Quantification and Removal of Microplastics in Environmental Samples: Developments and Challenges. In Microplastics Pollution in Aquatic Media; Sillanpää, M., Khadir, A., Muthu, S.S., Eds.; Springer: Singapore, 2022; pp. 115–135. ISBN 978-981-16-8439-5. [Google Scholar]
  5. Ivleva, N.P. Chemical Analysis of Microplastics and Nanoplastics: Challenges, Advanced Methods, and Perspectives. Chem. Rev. 2021, 121, 11886–11936. [Google Scholar] [CrossRef] [PubMed]
  6. Vivekanand, A.C.; Mohapatra, S.; Tyagi, V.K. Microplastics in aquatic environment: Challenges and perspectives. Chemosphere 2021, 282, 131151. [Google Scholar] [CrossRef]
  7. van Mourik, L.M.; Crum, S.; Martinez-Frances, E.; van Bavel, B.; Leslie, H.A.; de Boer, J.; Cofino, W.P. Results of WEPAL-QUASIMEME/NORMANs first global interlaboratory study on microplastics reveal urgent need for harmonization. Sci. Total Environ. 2021, 772, 145071. [Google Scholar] [CrossRef]
  8. Löder, M.G.J.; Imhof, H.K.; Ladehoff, M.; Löschel, L.A.; Lorenz, C.; Mintenig, S.; Piehl, S.; Primpke, S.; Schrank, I.; Laforsch, C.; et al. Enzymatic Purification of Microplastics in Environmental Samples. Environ. Sci. Technol. 2017, 51, 14283–14292. [Google Scholar] [CrossRef]
  9. Prata, J.C.; da Costa, J.P.; Girão, A.V.; Lopes, I.; Duarte, A.C.; Rocha-Santos, T. Identifying a quick and efficient method of removing organic matter without damaging microplastic samples. Sci. Total Environ. 2019, 686, 131–139. [Google Scholar] [CrossRef]
  10. Imhof, H.K.; Schmid, J.; Niessner, R.; Ivleva, N.P.; Laforsch, C. A novel, highly efficient method for the separation and quantification of plastic particles in sediments of aquatic environments. Limnol. Oceanogr. Methods 2012, 10, 524–537. [Google Scholar] [CrossRef]
  11. Shruti, V.C.; Pérez-Guevara, F.; Roy, P.D.; Kutralam-Muniasamy, G. Analyzing microplastics with Nile Red: Emerging trends, challenges, and prospects. J. Hazard. Mater. 2021, 423, 127171. [Google Scholar] [CrossRef]
  12. Chen, W.; Zhang, C.; Song, L.; Sommerfeld, M.; Hu, Q. A high throughput Nile red method for quantitative measurement of neutral lipids in microalgae. J. Microbiol. Methods 2009, 77, 41–47. [Google Scholar] [CrossRef] [PubMed]
  13. Fowler, S.D.; Greenspan, P. Application of Nile red, a fluorescent hydrophobic probe, for the detection of neutral lipid deposits in tissue sections: Comparison with oil red O. J. Histochem. Cytochem. 1985, 33, 833–836. [Google Scholar] [CrossRef]
  14. Erni-Cassola, G.; Gibson, M.I.; Thompson, R.C.; Christie-Oleza, J.A. Lost, but Found with Nile Red: A Novel Method for Detecting and Quantifying Small Microplastics (1 mm to 20 μm) in Environmental Samples. Environ. Sci. Technol. 2017, 51, 13641–13648. [Google Scholar] [CrossRef] [PubMed]
  15. Maes, T.; Jessop, R.; Wellner, N.; Haupt, K.; Mayes, A.G. A rapid-screening approach to detect and quantify microplastics based on fluorescent tagging with Nile Red. Sci. Rep. 2017, 7, 44501. [Google Scholar] [CrossRef] [PubMed]
  16. Shim, W.J.; Song, Y.K.; Hong, S.H.; Jang, M. Identification and quantification of microplastics using Nile Red staining. Mar. Pollut. Bull. 2016, 113, 469–476. [Google Scholar] [CrossRef] [PubMed]
  17. Nel, H.A.; Chetwynd, A.J.; Kelleher, L.; Lynch, I.; Mansfield, I.; Margenat, H.; Onoja, S.; Goldberg Oppenheimer, P.; Sambrook Smith, G.H.; Krause, S. Detection limits are central to improve reporting standards when using Nile red for microplastic quantification. Chemosphere 2021, 263, 127953. [Google Scholar] [CrossRef]
  18. Shim, W.J.; Hong, S.H.; Eo, S.E. Identification methods in microplastic analysis: A review. Anal. Methods 2017, 9, 1384–1391. [Google Scholar] [CrossRef]
  19. Patchaiyappan, A.; Dowarah, K.; Zaki Ahmed, S.; Prabakaran, M.; Jayakumar, S.; Thirunavukkarasu, C.; Devipriya, S.P. Prevalence and characteristics of microplastics present in the street dust collected from Chennai metropolitan city, India. Chemosphere 2021, 269, 128757. [Google Scholar] [CrossRef]
  20. de Guzman, M.K.; Andjelković, M.; Jovanović, V.; Jung, J.; Kim, J.; Dailey, L.A.; Rajković, A.; de Meulenaer, B.; Ćirković Veličković, T. Comparative profiling and exposure assessment of microplastics in differently sized Manila clams from South Korea by μFTIR and Nile Red staining. Mar. Pollut. Bull. 2022, 181, 113846. [Google Scholar] [CrossRef]
  21. Maxwell, S.H.; Melinda, K.F.; Matthew, G. Counterstaining to Separate Nile Red-Stained Microplastic Particles from Terrestrial Invertebrate Biomass. Environ. Sci. Technol. 2020, 54, 5580–5588. [Google Scholar] [CrossRef]
  22. Prata, J.C.; Godoy, V.; da Costa, J.P.; Calero, M.; Martín-Lara, M.A.; Duarte, A.C.; Rocha-Santos, T. Microplastics and fibers from three areas under different anthropogenic pressures in Douro river. Sci. Total Environ. 2021, 776, 145999. [Google Scholar] [CrossRef]
  23. Chen, S.; Li, Y.; Mawhorter, C.; Legoski, S. Quantification of microplastics by count, size and morphology in beverage containers using Nile Red and ImageJ. J. Water Health 2021, 19, 79–88. [Google Scholar] [CrossRef]
  24. Dowarah, K.; Patchaiyappan, A.; Thirunavukkarasu, C.; Jayakumar, S.; Devipriya, S.P. Quantification of microplastics using Nile Red in two bivalve species Perna viridis and Meretrix meretrix from three estuaries in Pondicherry, India and microplastic uptake by local communities through bivalve diet. Mar. Pollut. Bull. 2020, 153, 110982. [Google Scholar] [CrossRef] [PubMed]
  25. Vitali, C.; Peters, R.J.B.; Janssen, H.-G.; Undas, A.K.; Munniks, S.; Ruggeri, F.S.; Nielen, M.W.F. Quantitative Image Analysis of Microplastics in Bottled Water Following Nile Red Staining and Fluorescence Microscopy. ChemRvix 2022. [Google Scholar] [CrossRef]
  26. Sancataldo, G.; Avellone, G.; Vetri, V. Nile Red lifetime reveals microplastic identity. Environ. Sci. Process. Impacts 2020, 22, 2266–2275. [Google Scholar] [CrossRef]
  27. Zhang, Y.; Zhang, M.; Fan, Y. Assessment of microplastics using microfluidic approach. Environ. Geochem. Health 2022. [Google Scholar] [CrossRef]
  28. Mesquita, P.; Gong, L.; Lin, Y. A Low-Cost Microfluidic Method for Microplastics Identification: Towards Continuous Recognition. Micromachines 2022, 13, 499. [Google Scholar] [CrossRef]
  29. Labbe, A.B.; Bagshaw, C.R.; Uttal, L. Inexpensive Adaptations of Basic Microscopes for the Identification of Microplastic Contamination Using Polarization and Nile Red Fluorescence Detection. J. Chem. Educ. 2020, 97, 4026–4032. [Google Scholar] [CrossRef]
  30. Bogdanowicz, A.; Zubrowska-Sudol, M.; Krasinski, A.; Sudol, M. Cross-Contamination as a Problem in Collection and Analysis of Environmental Samples Containing Microplastics—A Review. Sustainability 2021, 13, 12123. [Google Scholar] [CrossRef]
  31. Cyvin, J.B. Can We to a Greater Extent Involve Citizens in Environmental Research? Front. Environ. Sci. 2022, 10, 142422. [Google Scholar] [CrossRef]
  32. Shah, K.G.; Yager, P. Wavelengths and Lifetimes of Paper Autofluorescence: A Simple Substrate Screening Process to Enhance the Sensitivity of Fluorescence-Based Assays in Paper. Anal. Chem. 2017, 89, 12023–12029. [Google Scholar] [CrossRef] [PubMed]
  33. Kalita, E.; Nath, B.K.; Agan, F.; More, V.; Deb, P. Isolation and characterization of crystalline, autofluorescent, cellulose nanocrystals from saw dust wastes. Ind. Crops Prod. 2015, 65, 550–555. [Google Scholar] [CrossRef]
  34. Reinhardt, K.; Breunig, H.G.; König, K. Autofluorescence lifetime variation in the cuticle of the bedbug Cimex lectularius. Arthropod Struct. Dev. 2017, 46, 56–62. [Google Scholar] [CrossRef]
  35. Razeghi, N.; Hamidian, A.H.; Mirzajani, A.; Abbasi, S.; Wu, C.; Zhang, Y.; Yang, M. Sample preparation methods for the analysis of microplastics in freshwater ecosystems: A review. Environ. Chem Lett 2022, 20, 417–443. [Google Scholar] [CrossRef]
  36. Maw, M.M.; Boontanon, N.; Fujii, S.; Boontanon, S.K. Rapid and efficient removal of organic matter from sewage sludge for extraction of microplastics. Sci. Total Environ. 2022, 853, 158642. [Google Scholar] [CrossRef] [PubMed]
  37. Sturm, M.T.; Horn, H.; Schuhen, K. The potential of fluorescent dyes-comparative study of Nile red and three derivatives for the detection of microplastics. Anal. Bioanal. Chem. 2021, 413, 1059–1071. [Google Scholar] [CrossRef]
  38. Gao, Z.; Wontor, K.; Cizdziel, J.V. Labeling Microplastics with Fluorescent Dyes for Detection, Recovery, and Degradation Experiments. Molecules 2022, 27, 7415. [Google Scholar] [CrossRef]
  39. Liu, S.; Shang, E.; Liu, J.; Wang, Y.; Bolan, N.; Kirkham, M.B.; Li, Y. What have we known so far for fluorescence staining and quantification of microplastics: A tutorial review. Front. Environ. Sci. Eng. 2022, 16, 1704. [Google Scholar] [CrossRef]
  40. Azizi, N.; Nasseri, S.; Nodehi, R.N.; Jaafarzadeh, N.; Pirsaheb, M. Evaluation of conventional wastewater treatment plants efficiency to remove microplastics in terms of abundance, size, shape, and type: A systematic review and Meta-analysis. Mar. Pollut. Bull. 2022, 177, 113462. [Google Scholar] [CrossRef]
  41. Prata, J.C.; da Costa, J.P.; Duarte, A.C.; Rocha-Santos, T. Methods for sampling and detection of microplastics in water and sediment: A critical review. TrAC Trends Anal. Chem. 2019, 110, 150–159. [Google Scholar] [CrossRef]
  42. Jiang, F.; Wang, M.; Ding, J.; Cao, W.; Sun, C. Occurrence and Seasonal Variation of Microplastics in the Effluent from Wastewater Treatment Plants in Qingdao, China. JMSE 2022, 10, 58. [Google Scholar] [CrossRef]
  43. Kittipongvises, S.; Phetrak, A.; Hongprasith, N.; Lohwacharin, J. Unravelling capability of municipal wastewater treatment plant in Thailand for microplastics: Effects of seasonality on detection, fate and transport. J. Environ. Manag. 2022, 302, 113990. [Google Scholar] [CrossRef] [PubMed]
  44. Ben-David, E.A.; Habibi, M.; Haddad, E.; Hasanin, M.; Angel, D.L.; Booth, A.M.; Sabbah, I. Microplastic distributions in a domestic wastewater treatment plant: Removal efficiency, seasonal variation and influence of sampling technique. Sci. Total Environ. 2021, 752, 141880. [Google Scholar] [CrossRef]
  45. Roscher, L.; Halbach, M.; Nguyen, M.T.; Hebeler, M.; Luschtinetz, F.; Scholz-Böttcher, B.M.; Primpke, S.; Gerdts, G. Microplastics in two German wastewater treatment plants: Year-long effluent analysis with FTIR and Py-GC/MS. Sci. Total Environ. 2022, 817, 152619. [Google Scholar] [CrossRef]
  46. Bayo, J.; Olmos, S.; López-Castellanos, J. Microplastics in an urban wastewater treatment plant: The influence of physicochemical parameters and environmental factors. Chemosphere 2020, 238, 124593. [Google Scholar] [CrossRef] [PubMed]
  47. Munno, K.; Helm, P.A.; Jackson, D.A.; Rochman, C.; Sims, A. Impacts of temperature and selected chemical digestion methods on microplastic particles. Environ. Toxicol. Chem. 2018, 37, 91–98. [Google Scholar] [CrossRef] [PubMed]
  48. Wiggin, K.J.; Holland, E.B. Validation and application of cost and time effective methods for the detection of 3-500 μm sized microplastics in the urban marine and estuarine environments surrounding Long Beach, California. Mar. Pollut. Bull. 2019, 143, 152–162. [Google Scholar] [CrossRef] [PubMed]
  49. Jee, A.-Y.; Park, S.; Kwon, H.; Lee, M. Excited state dynamics of Nile Red in polymers. Chem. Phys. Lett. 2009, 477, 112–115. [Google Scholar] [CrossRef]
  50. Monteleone, A.; Schary, W.; Wenzel, F.; Langhals, H.; Dietrich, D.R. Label-free identification and differentiation of different microplastics using phasor analysis of fluorescence lifetime imaging microscopy (FLIM)-generated data. Chem. Biol. Interact. 2021, 342, 109466. [Google Scholar] [CrossRef]
  51. Zhou, F.; Wang, X.; Wang, G.; Zuo, Y. A Rapid Method for Detecting Microplastics Based on Fluorescence Lifetime Imaging Technology (FLIM). Toxics 2022, 10, 118. [Google Scholar] [CrossRef]
  52. Tong, H.; Jiang, Q.; Zhong, X.; Hu, X. Rhodamine B dye staining for visualizing microplastics in laboratory-based studies. Environ. Sci. Pollut. Res. 2021, 28, 4209–4215. [Google Scholar] [CrossRef]
  53. Sancataldo, G.; Ferrara, V.; Bonomo, F.P.; Chillura Martino, D.F.; Licciardi, M.; Pignataro, B.G.; Vetri, V. Identification of microplastics using 4-dimethylamino-4’-nitrostilbene solvatochromic fluorescence. Microsc. Res. Tech. 2021, 84, 2820–2831. [Google Scholar] [CrossRef] [PubMed]
  54. Stanton, T.; Johnson, M.; Nathanail, P.; Gomes, R.L.; Needham, T.; Burson, A. Exploring the Efficacy of Nile Red in Microplastic Quantification: A Costaining Approach. Environ. Sci. Technol. Lett. 2019, 6, 606–611. [Google Scholar] [CrossRef]
  55. Prata, J.C.; Reis, V.; Matos, J.T.V.; da Costa, J.P.; Duarte, A.C.; Rocha-Santos, T. A new approach for routine quantification of microplastics using Nile Red and automated software (MP-VAT). Sci. Total Environ. 2019, 690, 1277–1283. [Google Scholar] [CrossRef] [PubMed]
  56. Prata, J.C.; Alves, J.R.; da Costa, J.P.; Duarte, A.C.; Rocha-Santos, T. Major factors influencing the quantification of Nile Red stained microplastics and improved automatic quantification (MP-VAT 2.0). Sci. Total Environ. 2020, 719, 137498. [Google Scholar] [CrossRef] [PubMed]
  57. Meyers, N.; Catarino, A.I.; Declercq, A.M.; Brenan, A.; Devriese, L.; Vandegehuchte, M.; de Witte, B.; Janssen, C.; Everaert, G. Microplastic detection and identification by Nile red staining: Towards a semi-automated, cost- and time-effective technique. Sci. Total Environ. 2022, 823, 153441. [Google Scholar] [CrossRef]
  58. Mintenig, S.M.; Int-Veen, I.; Loder, M.G.J.; Primpke, S.; Gerdts, G. Identification of microplastic in effluents of waste water treatment plants using focal plane array-based micro-Fourier-transform infrared imaging. Water Res. 2016, 108, 365–372. [Google Scholar] [CrossRef]
  59. Lu, H.-C.; Ziajahromi, S.; Neale, P.A.; Leusch, F.D.L. A systematic review of freshwater microplastics in water and sediments: Recommendations for harmonisation to enhance future study comparisons. Sci. Total Environ. 2021, 781, 146693. [Google Scholar] [CrossRef]
Figure 1. Modified digital microscope for fluorescent imaging. (1) Mounting bracket for emission filters. (2) Emission filter in holder. (3) Modified digital microscope with emission filter mounting bracket and LED flashlight.
Analytica 04 00004 g001
Figure 2. Setup for sampling microplastics in water bodies.
Analytica 04 00004 g002
Figure 3. Scheme for the sample preparation procedure. The procedure consists of filtration steps (1/3), hydrogen peroxide digestion (2), Nile red staining (4) and a transfer of the stained sample to a black filter membrane (5).
Analytica 04 00004 g003
Figure 4. Fluorescent images of microplastics and natural particles stained with NR0 (Nile red) taken with the low budget modification of the microscope Additionally, for the natural particles, the effect of the hydrogen peroxide treatment (see Section 2.5) is visualized.
Analytica 04 00004 g004
Figure 5. Microscope image of the processed and stained wastewater samples from 10.02.2022: (A) normal photo, (B) fluorescent image.
Analytica 04 00004 g005
Figure 6. Results of the long-term monitoring of the microplastic contamination in the WWTP effluent. The samples were measured in duplicates and the average was calculated.
Analytica 04 00004 g006
Figure 7. Fluorescent images of microplastics and natural particles stained with Nile red (NR0) and the new derivatives (NR1). Blue, green and orange fluorescence are compared. Additionally, the effect of the hydrogen peroxide treatment on the natural particles (see Section 2.4) is visualized.
Analytica 04 00004 g007
Figure 8. Measured recovery rates of microplastic and natural particles stained with Nile red (NR0, 1 mg/L) and the newly developed derivatives NR1 (1 mg/L). Green fluorescence: Ex: 420–470 nm; Em: 500–570 nm; yellow colored foil: Ex: UV-Lamp, Peak 365 nm; Em: Figure S1.
Analytica 04 00004 g008
Figure 9. Correlation between the microplastics found in wastewater samples (A) with the Nile red (NR0) and the new Nile red derivatives (NR1) and (B) the new Nile red derivatives (NR1) with automated and manual particle counting.
Analytica 04 00004 g009
Table 1. Advantages and disadvantages of fluorescent staining for microplastic detection.
AdvantageDisadvantage
  • Easy to apply, only basic laboratory and fluorescent imaging tools are required
  • No strong background knowledge necessary
  • Cheap and low processing time for detection
  • Risk of false positives due to natural particles
  • Underestimation of polymers with weak fluorescence (e.g., PVC)
  • Possible quenching by color pigments.
  • Not standardized (e.g., solvents, times for staining, fluorescent imaging, thresholding)
Table 2. List of flashlights used for fluorescence excitation.
FlashlightPeak WavelengthSupplier
UV365 nmTATTU U3S, Tattu, unknown, Germany
Blue470 nmULTRAFIRE H-B3, Hakka Trade US Inc Suwanee, GA 30024, USA
Green520–535 nmUltrafire H-G3, Hakka Trade US Inc Suwanee, GA 30024, USA
Table 3. Overview of tested emission filters.
FilterTransmissive AreaSupplier
Yellow-colored foilSee Transmission Spectra Figure S1Shenzhen Neewer Technology Co., Ltd., Shenzhen, China
Blue bandpass filter420–470 nmEdmund Optics GmbH, Mainz, Germany
Green bandpass filter500–570 nm
Orange bandpass
filter
570–540 nm
Red bandpass filter660–710 nm
Table 4. Combination of lamps and filters used for fluorescent imaging.
CombinationFlashlightExcitation FilterEmission FilterMicroscope Setting
1—Low Budget modificationUVNoneYellow-colored foilExposure time 0.5 s
Gain: 4
2—Blue fluorescenceUVNoneBlue bandpass
3—Green fluorescenceBlueBlue bandpass Green bandpass
4—Orange fluorescenceGreenGreen bandpass Orange bandpass
5—Red fluorescenceGreenOrange bandpass Red bandpass
Table 5. List of chemicals used in the experiments.
NameAB NumberPurchased From
NR 0 (Nile red)AB 139346abcr GmbH
NR 1 (abcr eco Wasser 3.0 detect mix MP-1)AB 930015abcr GmbH
Hydrogen peroxide (35%)AB 171423abcr GmbH
AcetoneAB 178997abcr GmbH
Table 6. Microplastics and natural particles used for the investigation of the selectivity of the new Nile red derivatives.
PolymerAbbreviationMean Size [µm]Supplier/Preparation
PolyethylenePE303 ± 249LyondellBasell, Basell Polyolefine GmbH, Frankfurt, Germany
PolypropylenePP337 ± 301LyondellBasell, Basell Polyolefine GmbH, Frankfurt, Germany
CopolyamidePA357 ± 60EMS-Grilltech, Switzerland
CopolyesterPES54 ± 87EMS-Grilltech, Switzerland
PolyvinylchloridePVC110 ± 25Sigma-Aldrich, Germany
Wood- Fine shavings of Quercus spec.
Calcite- Ground shell of Mytilidae
Chitin- Ground exoskeleton of Pandalus borealis
Table 7. Extrapolated results for the improved detection methods. Average values measured with NR0, the low-budged modification of the microscope and manual counting in the long-term monitoring of microplastics in the effluent of the WWTP Landau were extrapolated using the linear regressions, as shown in Figure 9.
Average DischargeNR0
Low Budged Modification, Manual Counting
NR1
Green Fluorescence, Manual Counting
NR1
Green Fluorescence,
Automated Counting
per liter4187103
per day572 million 1269 million1497 million
per year209 billion 351 billion586 billion
Per day and inhabitant10,40923,06727,211
Per year and inhabitant3.9 million 8.4 million9.9 million
Disclaimer/Publisher’s Note: The statements, opinions and data contained in all publications are solely those of the individual author(s) and contributor(s) and not of MDPI and/or the editor(s). MDPI and/or the editor(s) disclaim responsibility for any injury to people or property resulting from any ideas, methods, instructions or products referred to in the content.

