1. Introduction
Aluminum Carbide (Al
4C
3) is a carbide of the group of methanogenic carbides. It is formed when materials containing aluminum and carbon are exposed to temperatures above 500 °C [
1,
2,
3,
4] according to Equation (1).
These conditions occur during the production or welding of Metal Matrix Composites (MMCs) [
5,
6]. Therefore, it is often a product of interfacial reactions in the production process of Si-Al-C materials, where the formation of Al
4C
3 can also occur according to Equation (2) [
5,
7].
Al
4C
3 has possible applications in electronic fields [
8,
9] or as reinforcement of Al-matrix materials [
10].
However, it plays a major role in corrosion processes due to its affinity for hydrolysis. This reaction already occurs at room temperature with ambient humidity [
7]. Hydrolysis leads to the formation of Aluminum hydroxide (Al(OH)
3) and methane (CH
4) according to Equation (3) [
7,
11,
12].
The process results in a volume expansion, causing internal stress and fractures in the material [
12,
13]. Therefore, the degradation of Al
4C
3 influences the mechanical and thermal properties of a material [
11,
14].
Many groups working on compound materials are aware of this problem and, therefore, many publications regarding favorable production conditions and avoiding the formation of Al
4C
3 can be found [
6,
15]. Nowadays, there are also artificial intelligence and machine learning based approaches for optimizing production conditions [
16].
The formation of Al
4C
3 also happens in MgO-C bricks containing aluminum (Al) as an antioxidant at temperatures above the melting point of Al. Its hydrolyzation leads to fracturing, changes of shape and disintegration, limiting storage stability [
13,
17].
However, information on quantification methods for it are scarce [
18]. Current analysis techniques mainly include X-ray diffraction (XRD), light microscopy and scanning electron microscopy (SEM). These methods are limited by small sample sizes or high limits of quantification. Therefore, they are commonly used for semi-quantitative analysis, microstructure observations and identification of phase transitions [
7,
13,
18]. X-ray photoelectron spectroscopy (XPS) may also give qualitative and quantitative information but is also limited to small sample sizes in addition to being surface sensitive [
19].
Methods utilizing methane measurement by gas chromatography (GC) or gas chromatography coupled with mass spectroscopy (GC-MS) were also published. While these methods have low limits of quantification and very high precision, they also require expensive analytical equipment, controlled ambient conditions, and are limited to small sample sizes (0.5–1.5 g). Additionally, all found publications make use of electrolysis, NaOH, or acids for disintegration and converting Al
4C
3 to CH
4 [
18,
20,
21,
22].
Furthermore, due to necessary operating conditions, these methods are not applicable as at-line analytics in industrial environments due to vibrations or dust.
Recent advances, mainly driven by the area of environmental analytics, led to the development of robust and cheap detection systems for CH
4 analytics. The measurement of CH
4 is relevant in several fields, ranging from livestock production [
23] to measurements of methane emissions in the oil and gas sector [
24,
25]. These systems are mainly based on optical measurement in the infrared spectrum. They enable the usage of new combinations to make quality control as well as Al
4C
3 quantification viable in industrial environments.
Therefore, this paper aims to show a simple possibility of quantifying Al
4C
3 contents in the mg range with fast, robust, standardized, easy-to-handle, and relatively cheap equipment. This is achieved by combining an autoclave with an NDIR detector calibrated for CH
4 measurement. The concepts of previous works [
26,
27] are adapted and simplified to enable the measurement of powder samples containing Al
4C
3. The only additional chemical needed is distilled water, which makes the process favorable regarding working safety. The usage of an autoclave enables sample amounts of up to a few grams of powder sample as stated by Zefferer [
26] and Janz [
27].
The completeness of the reaction as well as the reproducibility of the device need to be evaluated to get an idea of possible applications. Furthermore, the kinetics of the reaction in the proposed reactor needs to be evaluated to ensure that further optimizations in reaction speed can be achieved at higher temperatures. This would result in shorter analysis times and higher sample throughput by utilizing the autoclave’s ability to operate at temperatures above 100 °C.
This indicates that the proposed method, in a modified form, might be an applicable extension to already existing methods for quality control, raw material analysis, and analysis of recycling material. These materials often come in great quantities and the inhomogeneous dispersion of Al4C3 necessitates the analysis of larger sample amounts.
2. Materials and Methods
2.1. Sample Material
The analyzed samples consisted of commercially available Aluminum Carbide (Al4C3) produced by Starck (AB 13560, Lot# 26113/15). The samples were stored in PP tubes filled with argon and sealed with parafilm. The sealed tubes were placed in a desiccator filled with argon to protect them from unwanted hydrolyzation by ambient humidity.
2.2. Thermogravimetric Analysis Coupled with Infrared Gas Detection (TGA-IR)
TGA analysis was performed on a Jupiter STA 449C by Netzsch. The device was equipped with a platinum oven for temperatures up to 1500 °C. The heating curve was linear with a slope of 5 °C/min up to 1300 °C. The analyses were performed using 60 mL/min dry technical air. Weight constancy of the used crucibles was achieved by annealing at 1400 °C prior to the TGA measurement. For each measurement, 10–20 mg Al4C3 powder was weighed in a 20 µL Al2O3 crucible. Buoyancy correction was carried out by subtracting the curve of an empty crucible with identical measurement conditions from the actual sample measurement. The exhaust gas was tempered to 200 °C and analyzed in a Bruker Tensor II fourier transformation infrared (FT-IR) spectrometer. CO2 was measured at 2360 cm−1, H2O at 1500 cm−1, and CH4 at 3013 cm−1.
2.3. XRD Analysis
The powder samples were characterized by XRD with a Brucker D8 Advanced with LynxEye Detector with a Cu tube as X-Ray source and a Ni filter. The divergence slit was set to 0.4° fix, and the anti-scattering slit to 8 mm. The detector slit setting was 2.5° and the measurement range was 6 to 70° with 0.009° and 0.5 s per step. The samples were prepared via back loading into a sample ring. Data acquisition and evaluation was conducted using the Bruker DIFFRACplus Basic EVA Software.
2.4. Total Carbon Analysis
The analysis of total carbon was conducted with a LECO CS 744. A total of 20–50 mg of Al4C3 sample were weighed in porcelain crucibles and covered with Lecocel. The sample was then combusted in an oxygen stream above 2000 °C. The reaction gases were analyzed with NDIR detectors.
2.5. Free Carbon Analysis
For measuring the free carbon (non-Al4C3-Carbon), approximately 100 mg of sample were weighed in porcelain crucibles, covered, and combusted in an oxygen stream at 850 °C for 300 s. The reaction gases were measured using NDIR detectors. This method is similar to DIN 51075-2 for silicon carbide measurement, but instead of a Coulomat, the C analyzer LECO RC 612 was used.
2.6. SEM Analysis
SEM analyses were conducted with a JEOL JSM-7900F field emission gun scanning electron microscope at 10 kV acceleration voltage, a probe current of 2.00 nA, and an 11 mm working distance. The images were acquired using Aztec software.
2.7. Particle Size Measurement
The measurement was conducted with a Helos device (R3) equipped with a Rodos/L unit for dry dispersion and a Vibri dosing unit. Approximately 20 g samples were fed into the dispersing unit at a flow rate of 30% with a gap width of 15 mm. The dispersion unit was set to 3 bar with a negative pressure of 41 mbar. The starting point was set to Copt (optical concentration) ≥ 1% and the end point to Copt ≤ 1% for 5 s. Data acquisition and calculations were done with PAQXOS 3.0.2 software.
2.8. Gas Analytics
The autoclave system consisted of a 200 mL reaction vessel coated with PTFE on the inside. The device was able to measure pressure and temperature. The lid of the autoclave was equipped with needle valves for liquid sampling, gas insertion and gas sampling. The system was equipped with an adjustable bypass from the inlet to the outlet valve to enable baseline correction of the sensors as well as slower pressure relieve. Heating and stirring was performed by using a magnetic stirring plate connected to a temperature controller. The gas measuring system consisted of a Bronckhorst thermal mass flow meter for measuring the N
2 (5.0) stream. A constant dry gas stream was ensured by using a cooling pump. For methane detection, a non-dispersive infrared (NDIR) analyzer, measuring ppmV CH
4, was used. An additional flowmeter acting as a pressure release valve was installed (
Scheme 1). The measurements were conducted by preheating the vessel and the distilled water. Around 100 mg of Al
4C
3 were weighed and inserted in the PTFE liner. The PTFE liner was put in the reaction vessel and all valves were opened. After flushing the autoclave with N
2, all valves were closed and the liner was heated up. The N
2 flowrate was adjusted to approximately 1 L
n/min (normal liter,
T = 273.15 K,
p = 101,325 Pa). When the detector showed a stable zero signal and the autoclave had reached trial temperature, the preheated water was injected via the liquid input valve, which was closed afterwards. The gas input and output valves were opened, the bypass was closed, and the data acquisition program was started. The stirring was activated at 1000 rpm and the reaction was continuously monitored in one second intervals until the methane content in the N
2 stream dropped below 10 ppmV. Data acquisition was done via LabView.
Calculation of the methane volume produced by the sample was conducted according to Equation (4).
V(CH4)x…Volume CH4 at point x (normal cubic meter = m3n; T = 273.15 K, p = 101,325 Pa)
tx… time at point x (s)
… normal volumetric flow rate of N2 at point x (Ln/min)
w(CH4)… measured concentration of CH4 at point x (ppmV)
As the flowmeter detects the volume flow rate of N
2 in normal liters per minute and the measurements were conducted at ambient conditions, the ideal gas equation was used to calculate the amount of CH
4 (Equation (5)).
n(CH4)x… amount of substance of CH4 at point n (mol)
p… pressure (101,325 Pa)
R… universal gas constant (8.314 J/mol*K)
T… Temperature (273.15 K)
The calculated amount of CH
4 was used to determine the amount of Al
4C
3 needed for its production according to Equation (6).
Recovery was calculated as the ratio of Al
4C
3 divided by the amount of Al
4C
3 weighed in Equation (7).
The conversion was calculated analogically, summing up the measured masses until the respective point of interest (y) and dividing it by the total measured mass according to Equation (8).
2.9. Preparation of Treated Samples
For TGA-IR, XRD, SEM, and carbon analysis after treatment, 2 g of Al4C3 powder were weighed in. After treatment with 100 mL distilled water at 70 °C for 4 h in the constantly N2-flushed autoclave, the solution was evaporated at 105 °C for 12 h
3. Results and Discussion
3.1. Principle of the Measurement
The measurement is based on the CH
4 concentration in the N
2 stream.
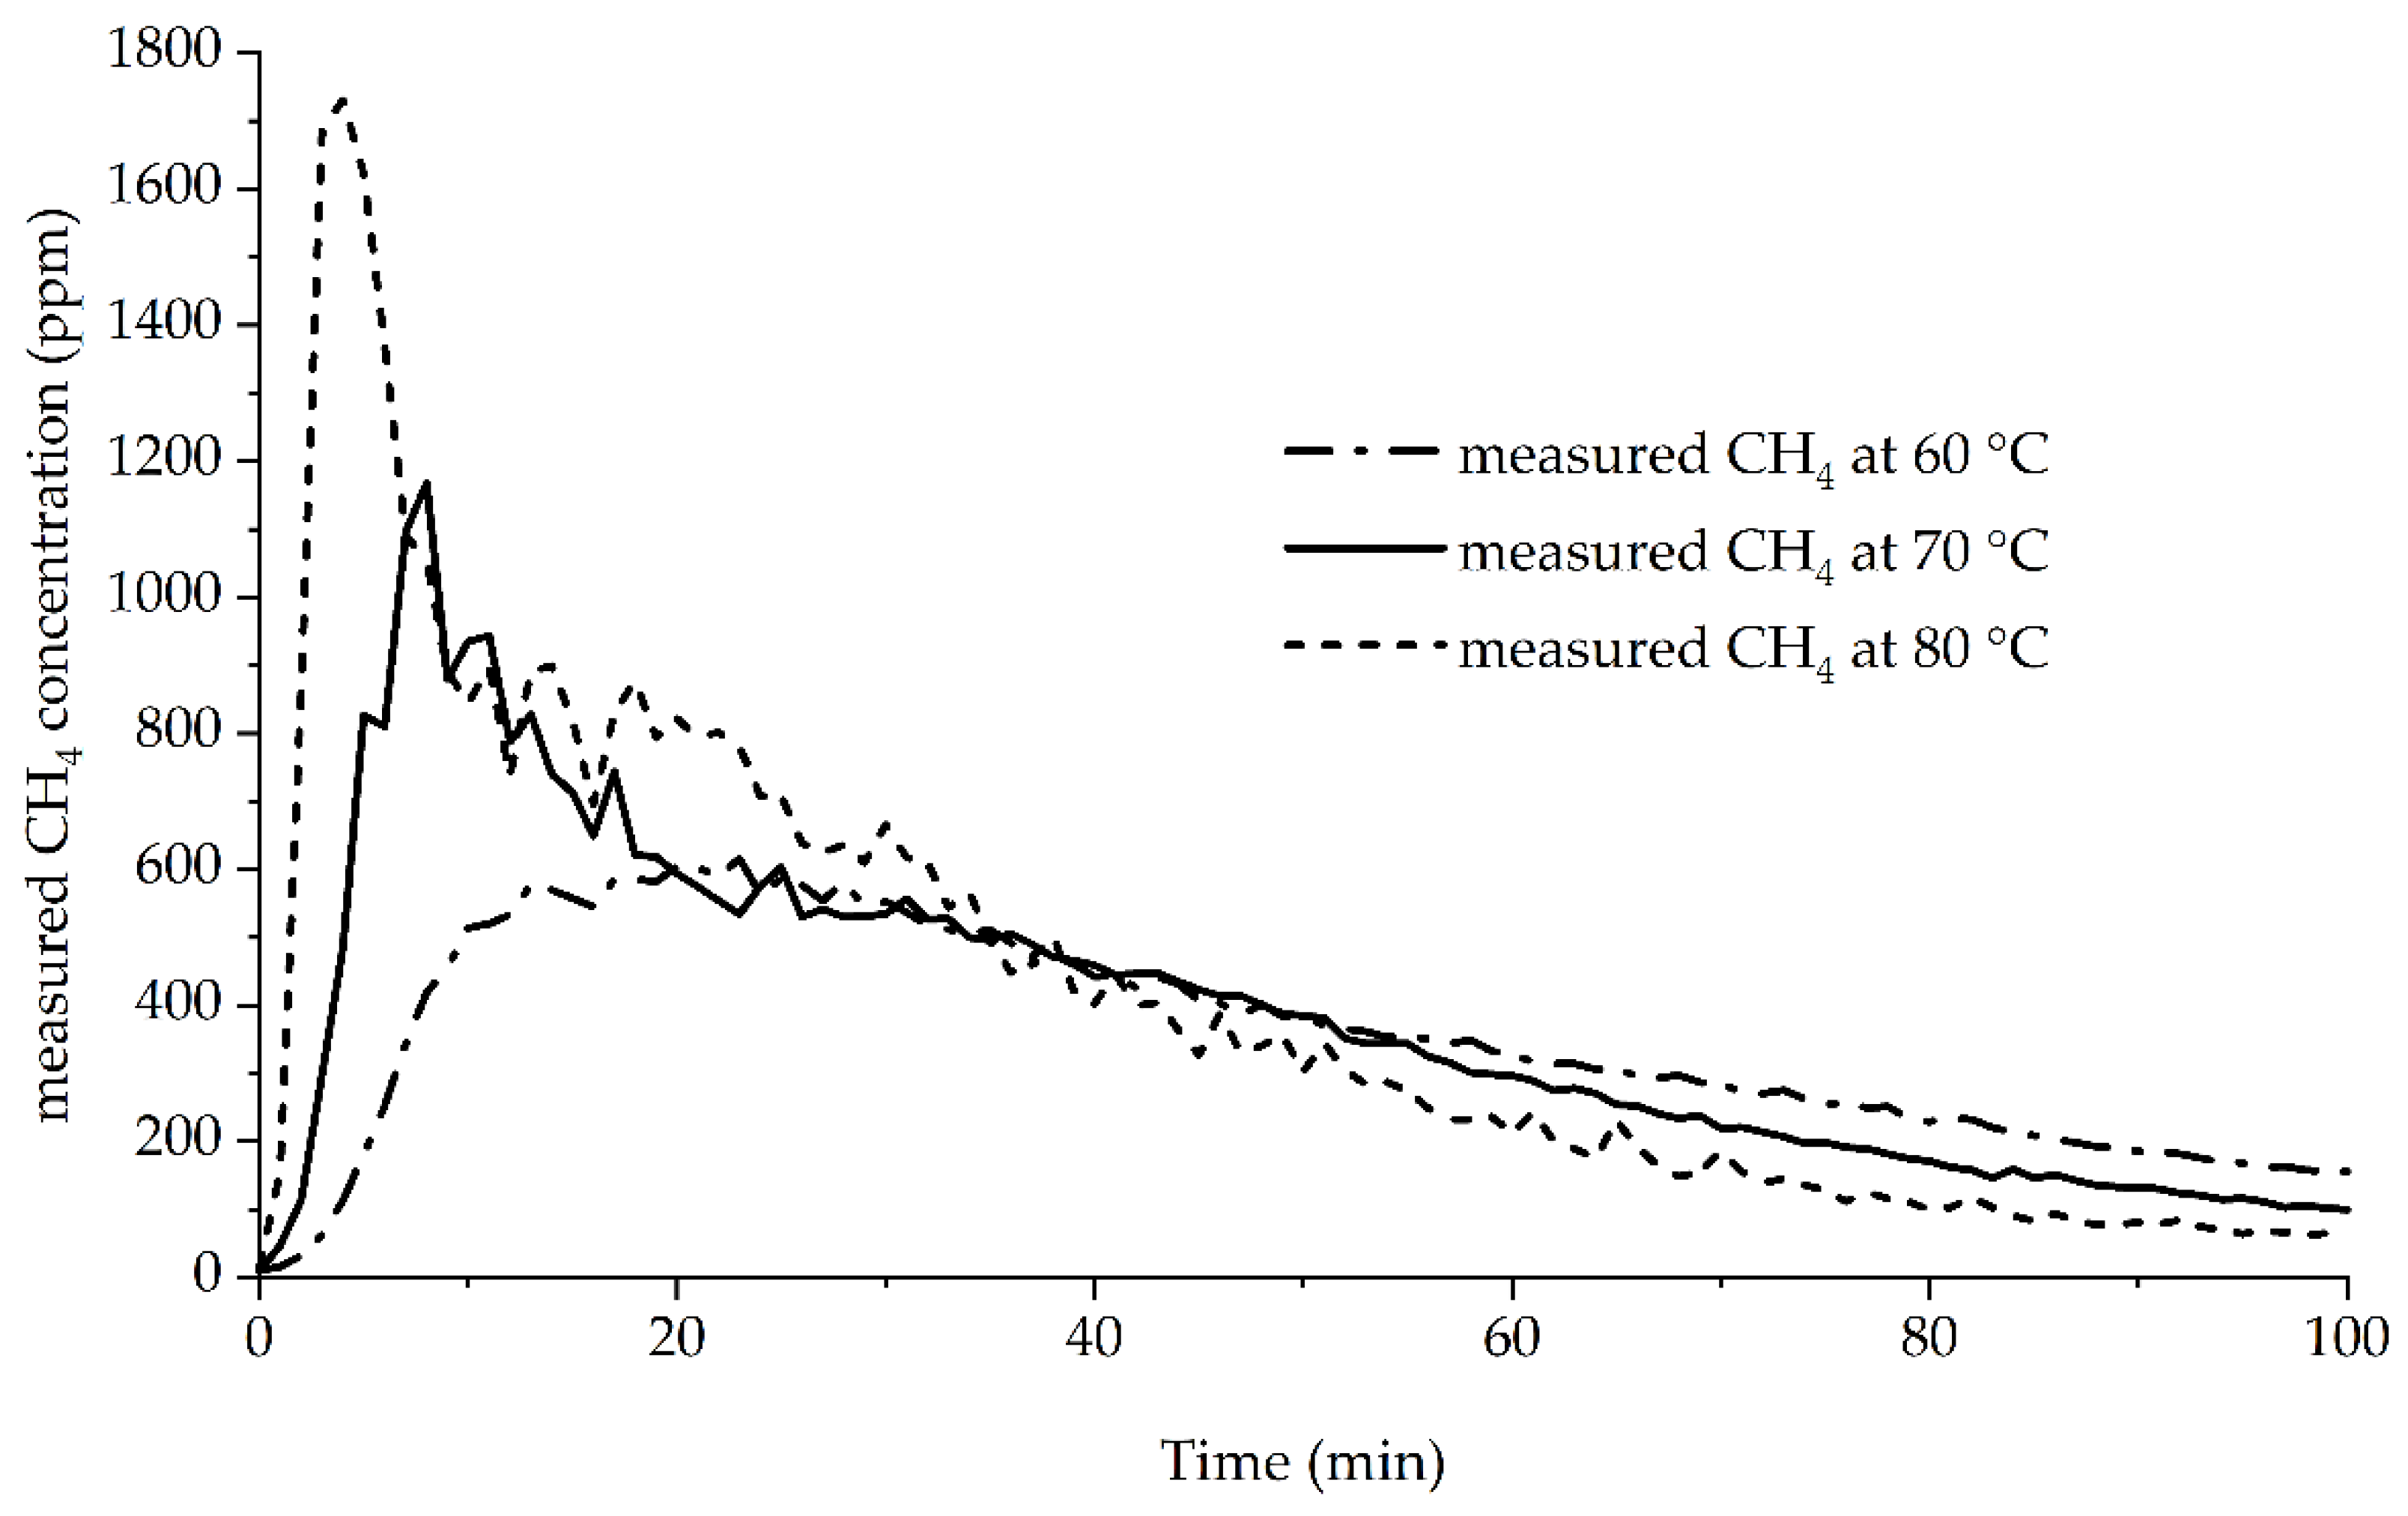
Figure 1 shows the progress of the average measured methane concentration in the N
2 stream versus the time. The temperatures of 60 to 80 °C were chosen based on pretrials showing a much slower conversion from room temperature to 40 °C. This was also supported by the findings of Nýblová et al. [
12], indicating the time needed for total hydrolysis in water at room temperature to be in the area of days. These temperatures would result in trial times without any practical applicability.
The graphs show that the measured maximum concentrations decreased with lower temperatures from 1730 ppm at 80 °C to 615 ppm at 60 °C. The time needed to reach the maximum concentration increased from 4 min at 80 °C to 23 min at 60 °C. All curves showed a rapid initial increase. The 70 and 80 °C curves reached a peak before a plateau followed by decrease. The 60 °C showed a plateau before decreasing. The curves crossed at approximately 40 min. From then onward, all curves showed a steady decrease to below 10 ppm. The methane production showed an initial lag phase with no CH
4 production, followed by a fast reaction step, making it comparable to the reaction of mechanically activated metallic Al in hot water, producing H
2 [
28]. The initial lag phase also showed a temperature dependency, gradually decreasing from 60 to 80 °C. Therefore, the assumption that a further increase in temperature leads to even shorter times until complete conversion can be made. This would result in even shorter analysis times.
The measured methane concentrations from each trial were used to calculate the recovery of Al
4C
3 according to Equations (4)–(7), shown in
Figure 2.
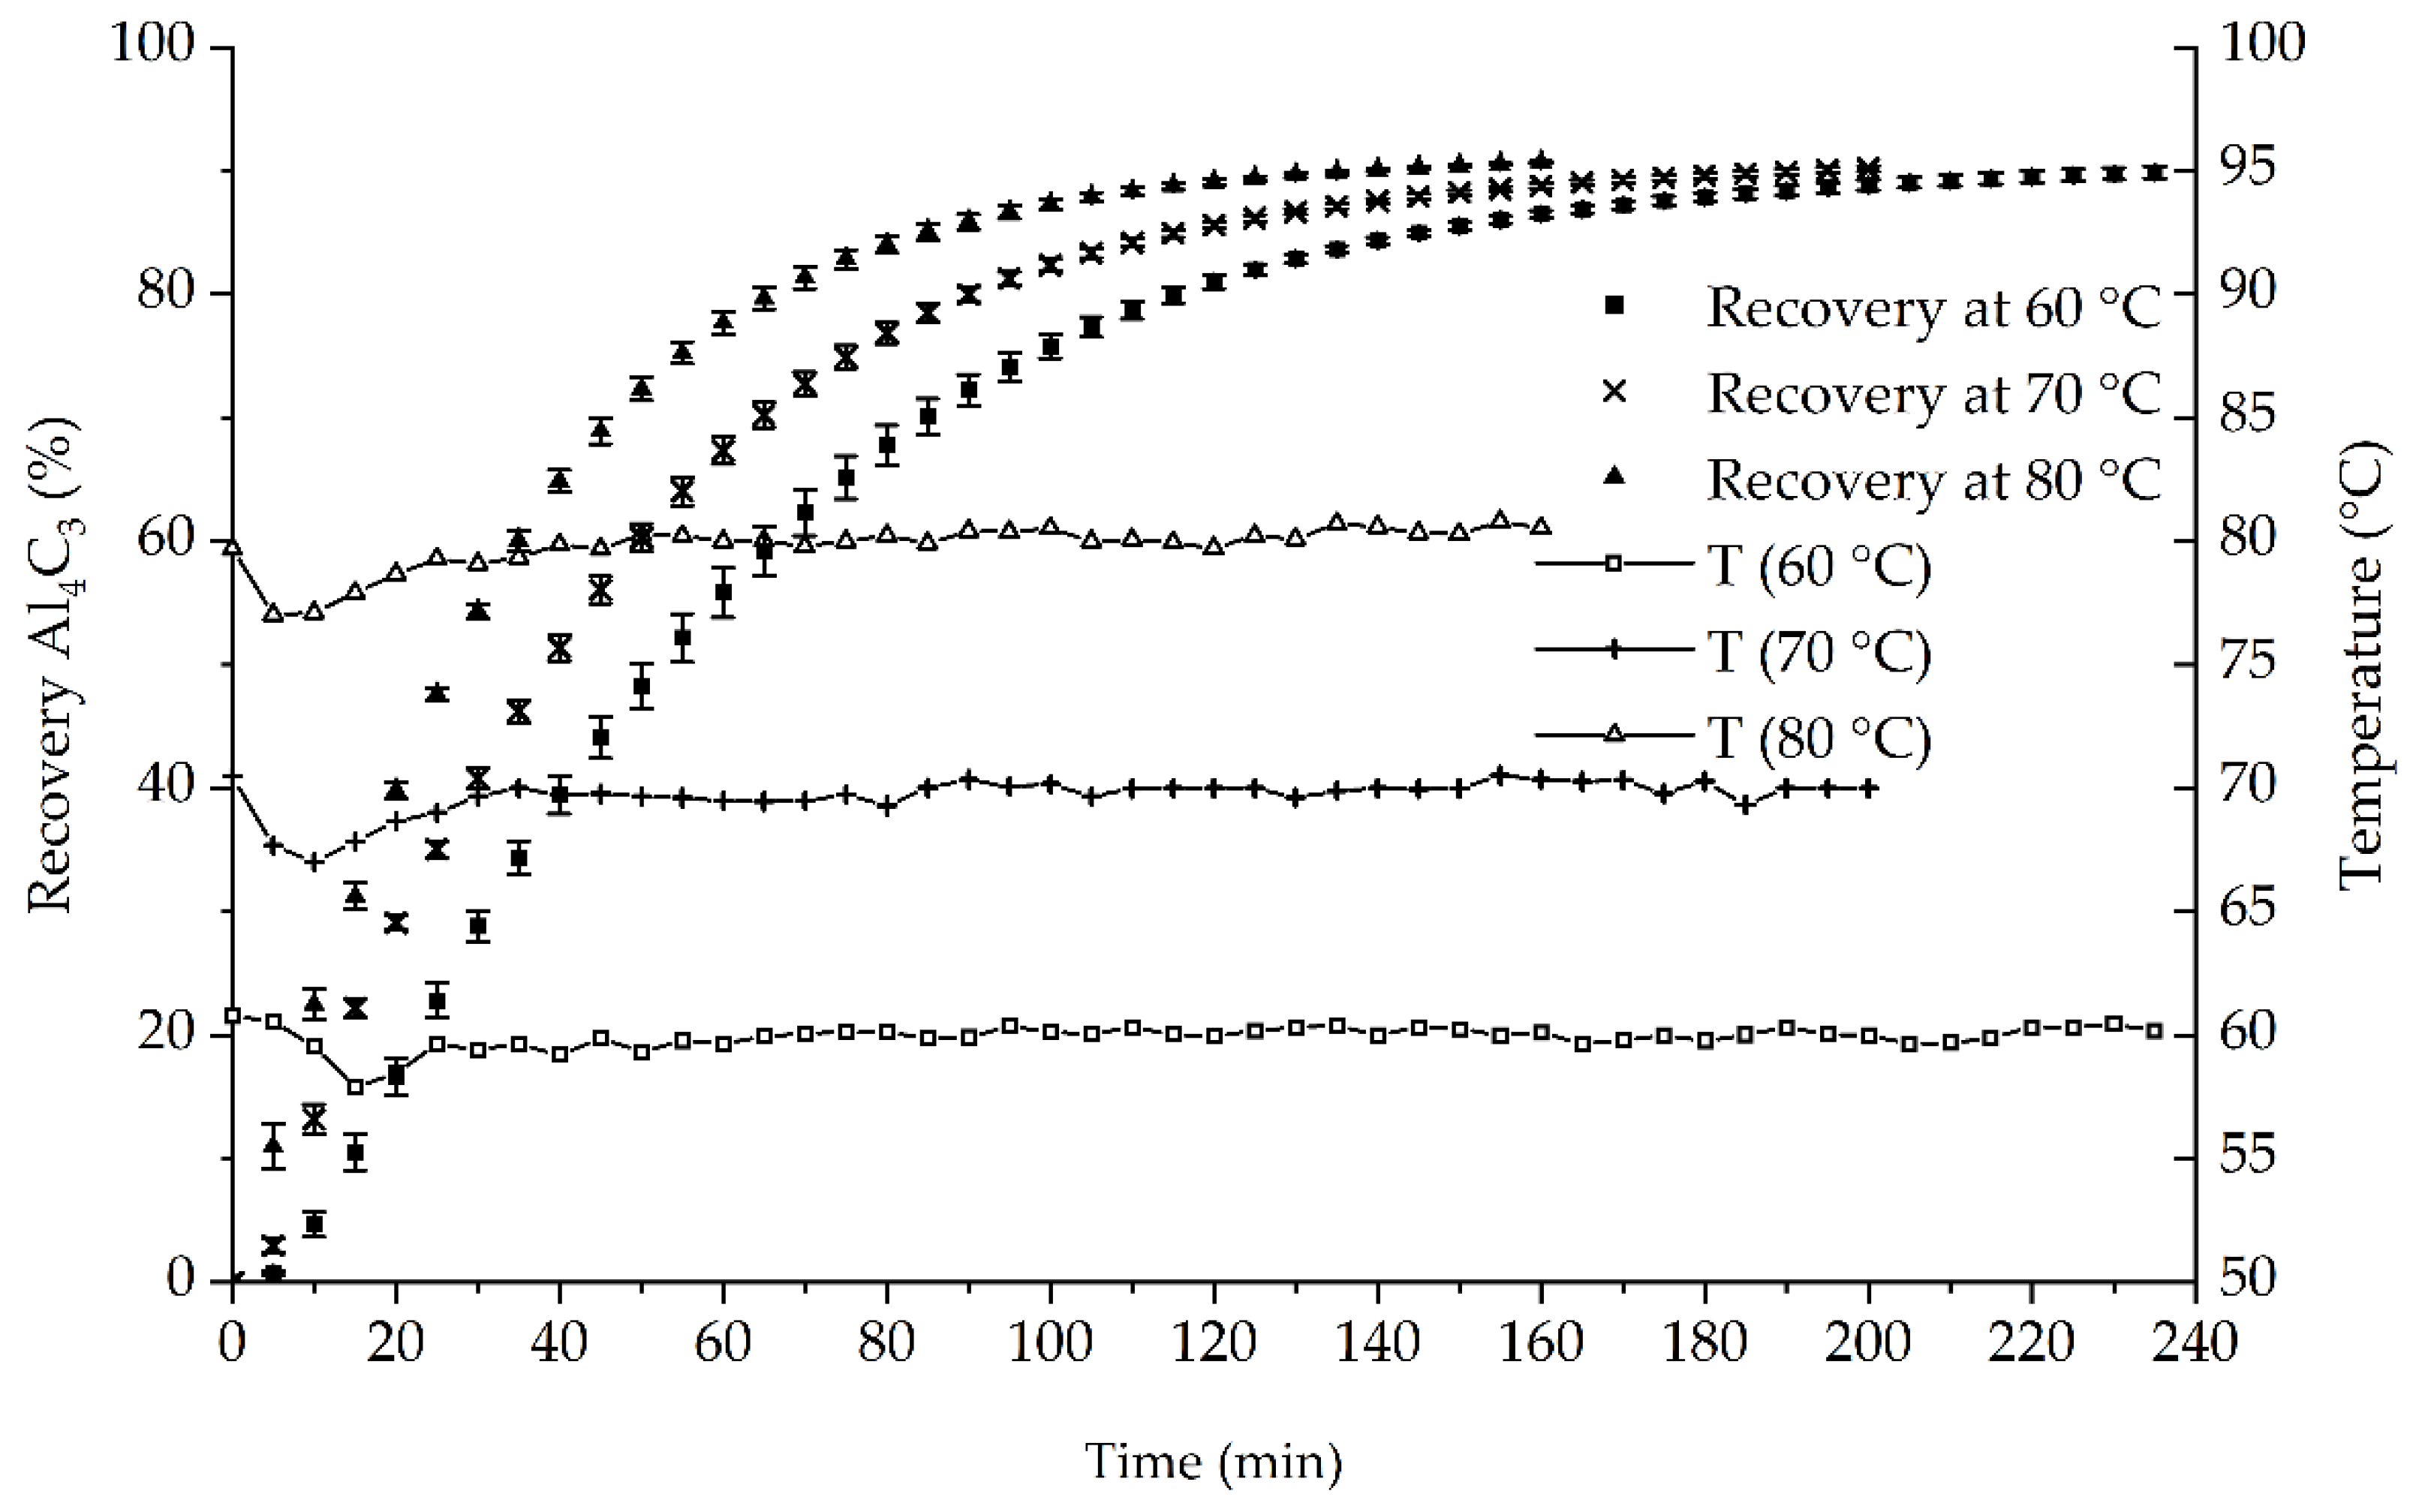
3.2. Recovery and Repeatability
Analytical methods for quantification need to be able to produce repeatable results. Therefore, the next chapter will cover this topic.
Figure 2 shows the temperature dependency of the recovery and the temperature during the trials. Both are plotted in 5-min steps. All markers are the averages of triplicates. Additionally, error indicators are shown for the recovery.
The temperature for each trial was kept at +/− 3 °C around the nominal value. After the initial settling phase during the first 20–30 min of each trial, the temperature remained constant.
The recovery is used as an indicator for the reaction velocity. Recovery curves show that the time of the lag phase of the reaction decreased with higher temperatures. The Al
4C
3 recovery also showed that the reaction speed positively correlates with increased temperature. The times needed for the CH
4 detector to signal the end of the measurement (<10 ppm) decreased from 240–245 min at 60 °C to 160–175 min at 80 °C (
Table 1).
The average recoveries at the end point are shown in
Table 1 and ranged from 90% at 60 °C to 90.8% at 80 °C. The standard deviations below 1% indicate the method’s precision. For this study, this is equal to standard deviations of approximately 1 mg Al
4C
3, making it comparable to the method proposed by Yan et al. [
18]. However, this method is less precise than GC methods, achieving results in the µg area [
20,
22].
The produced gas is injected in the N2 stream after the flowmeter. Therefore, the total volume led to the detector is higher than the measured volume. This leads to lower recovery and higher standard deviations. The concentrations of CH4 in the N2 stream were below 1% (v/v) and thereby led to a decrease of <1%. These deviations were neglected in the present study. Injecting the produced gas before measuring the volume flow is difficult as changes in heat capacities caused by fluctuating gas composition would influence the measurement.
As the average recoveries were nearly equal and small standard deviations were achieved for all temperatures, the method seems to be able to repeatably quantify Al4C3. Furthermore, the maximum conversion seems to be independent from temperature.
The selectivity and specificity of the method are ensured by the usage of the NDIR detector for CH4 measurement.
3.3. Morphology of the Particles
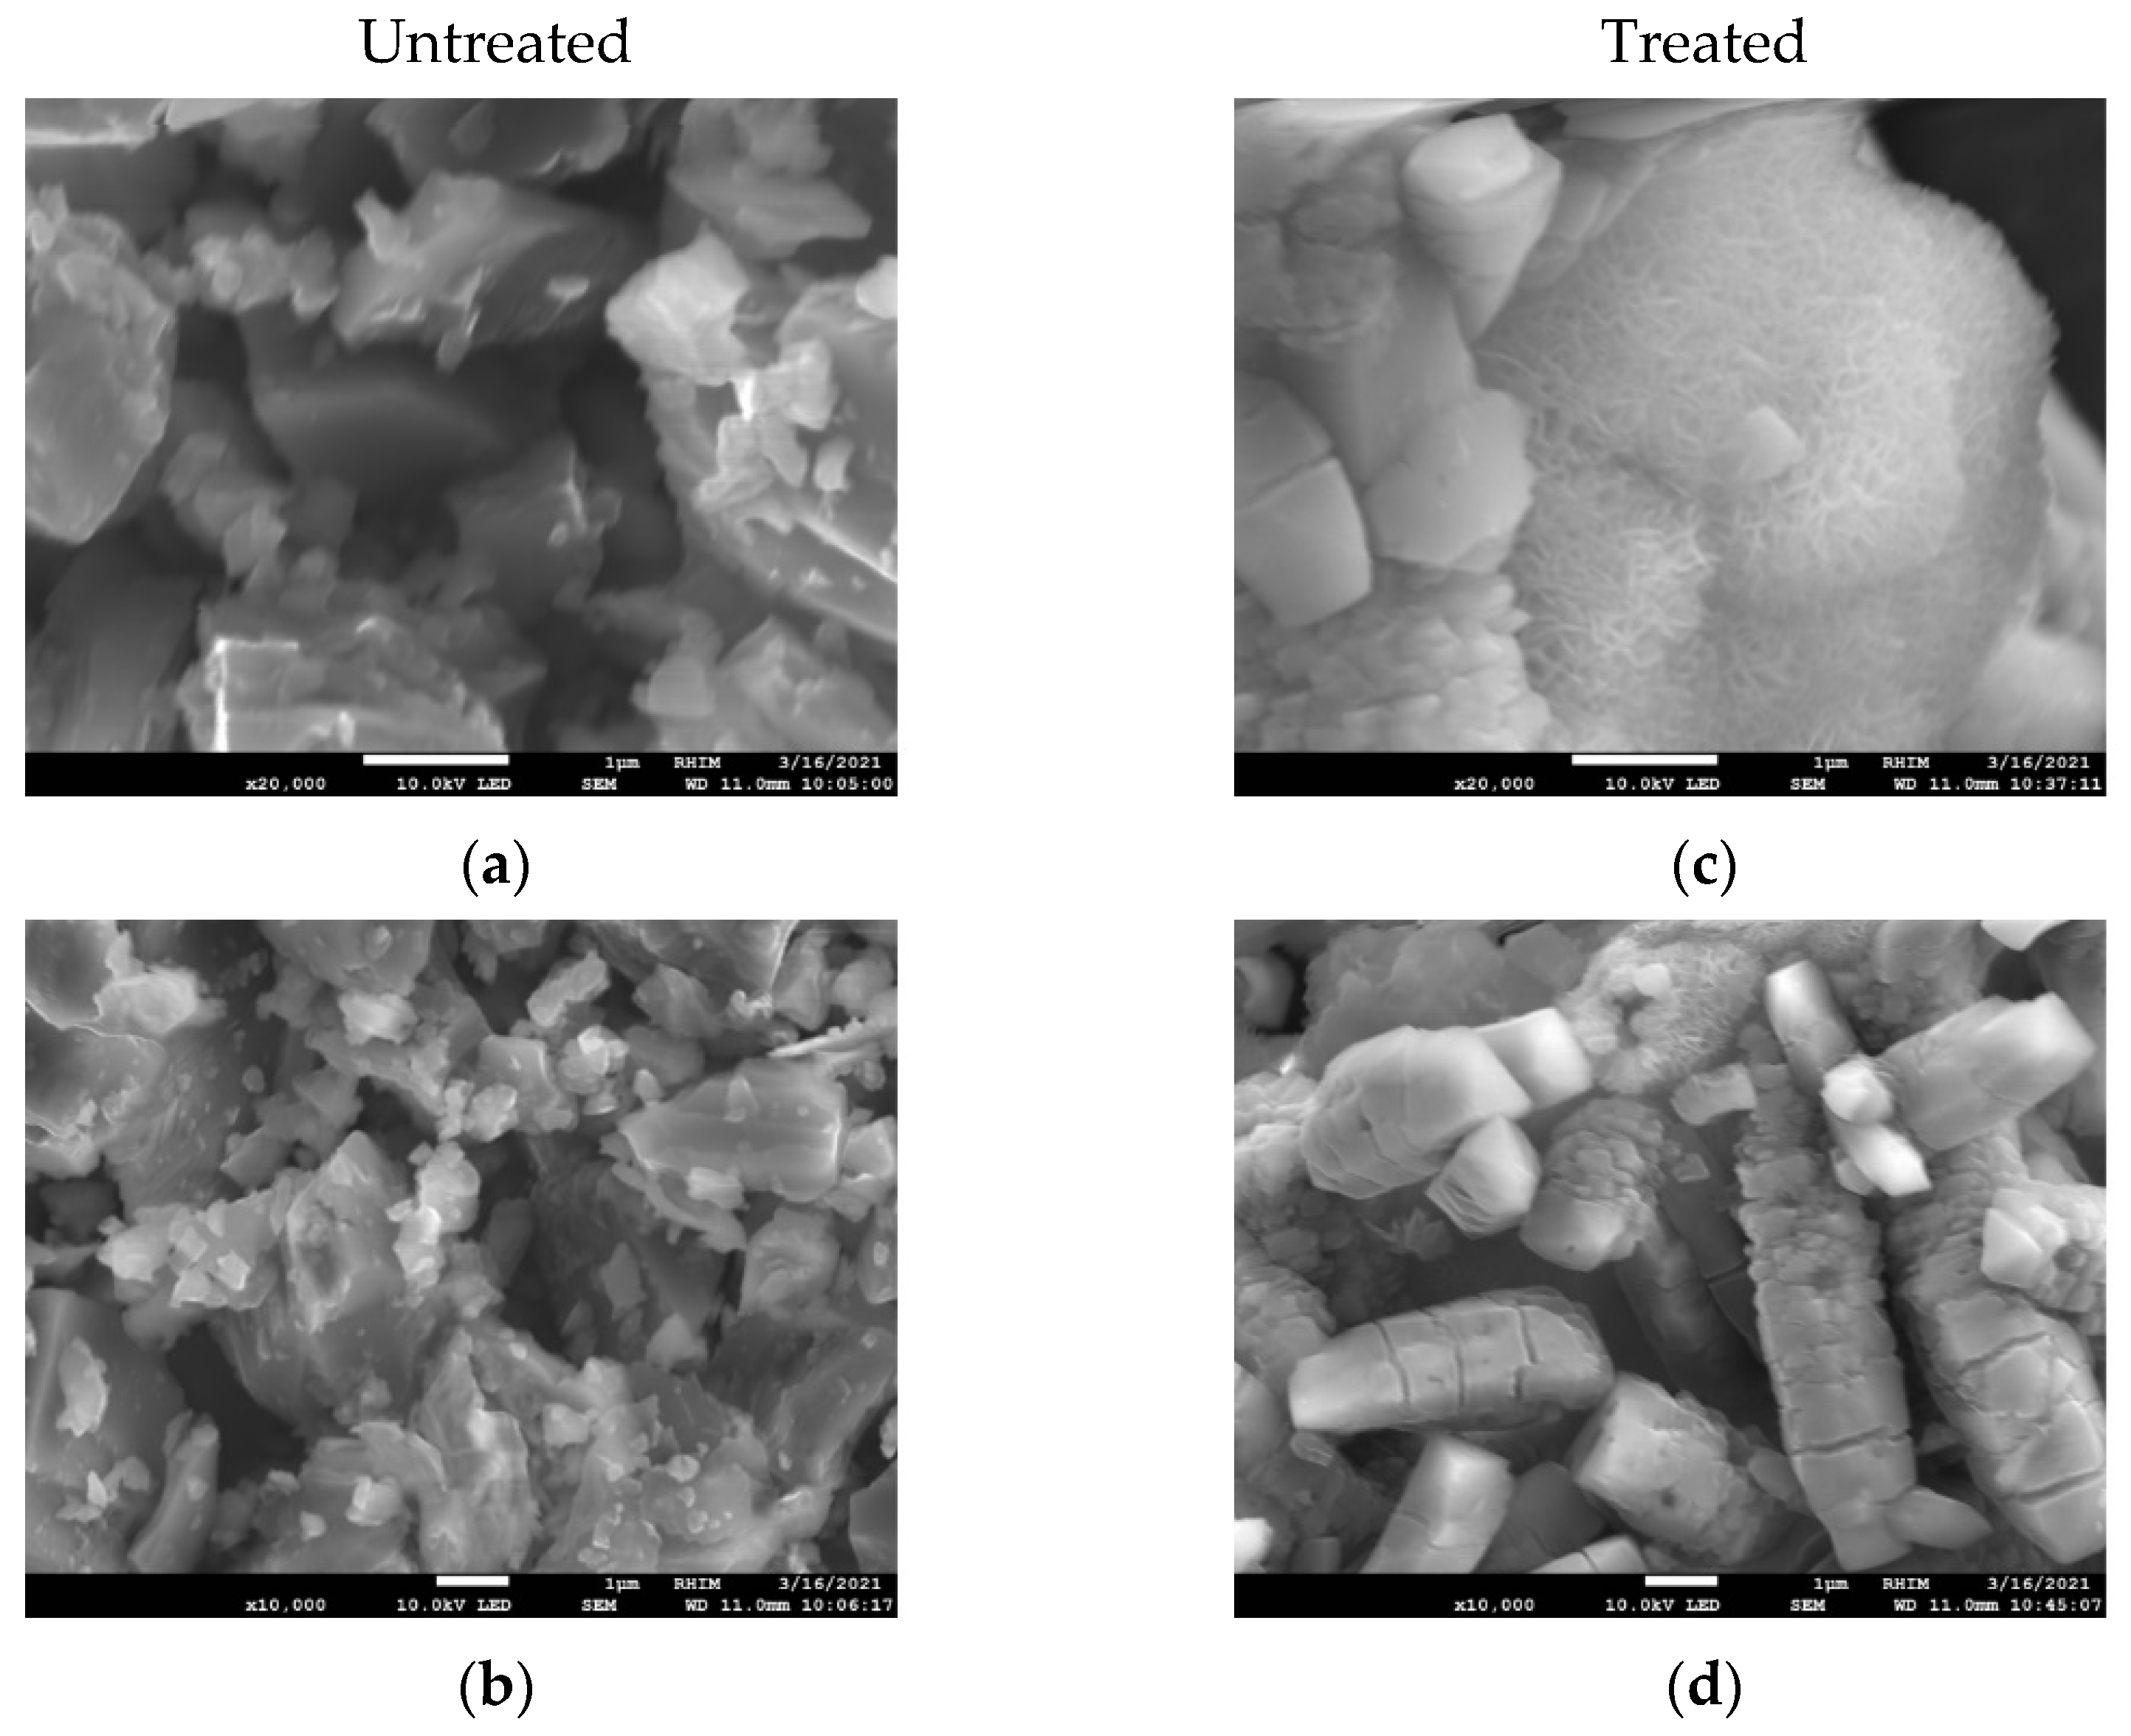
The SEM pictures (
Figure 3) showed mostly polygonal particles before and cylindrical particles after the treatment. The untreated samples (
Figure 3a,b) showed smooth surfaces as well as sharp edges. While the treatment (70 °C, 4 h in water) did not dissolve the particles (
Figure 3c,d), the surfaces underwent changes, resulting in a cotton-like appearance. Another noticeable difference is that the surfaces of the untreated sample (
Figure 3b) have no visible cracks or fracturing, whereas the surfaces of the treated samples (
Figure 3d) have visible cracks. The absence of cracks in the cotton-like particle in
Figure 3c might be explained by it being metallic Al, indicated by LECO-C analysis deviating from theoretical stoichiometry. This led to different hydrolysis behavior, resulting in differences in appearance. This hypothesis requires further research for confirmation.
The morphological changes can be attributed to the formation of Bayerite (Al(OH)
3) and Boehmite (AlO(OH)). This was confirmed by XRD and TGA-IR, and is in accordance with Nýblová et al. [
12]. Their study found that Al
4C
3 samples mainly consisted of Al(OH)
3 with small fractions of γ-AlO(OH) after hydrolyzing it in water for 34 days.
3.4. Completion of the Reaction
LECO-C analysis of the untreated sample resulted in total carbon concentrations of 24.1% (w/w) (n = 1). The determination of organic carbon at lower temperatures resulted in 0.9% (w/w) (n = 1). This leads to a concentration of carbon from Al4C3 of 23.2% (w/w). As the theoretical concentration of carbon in Al4C3 is 25% (w/w), there is a deviation leading to lower maximum possible recoveries of 92.8%.
The treated samples resulted in 0.6% (w/w) (n = 1) total carbon and 0.4% (w/w) (n = 1) organic carbon. This shows that there is a small amount of carbon left in the sample, which mainly originates from organic carbon.
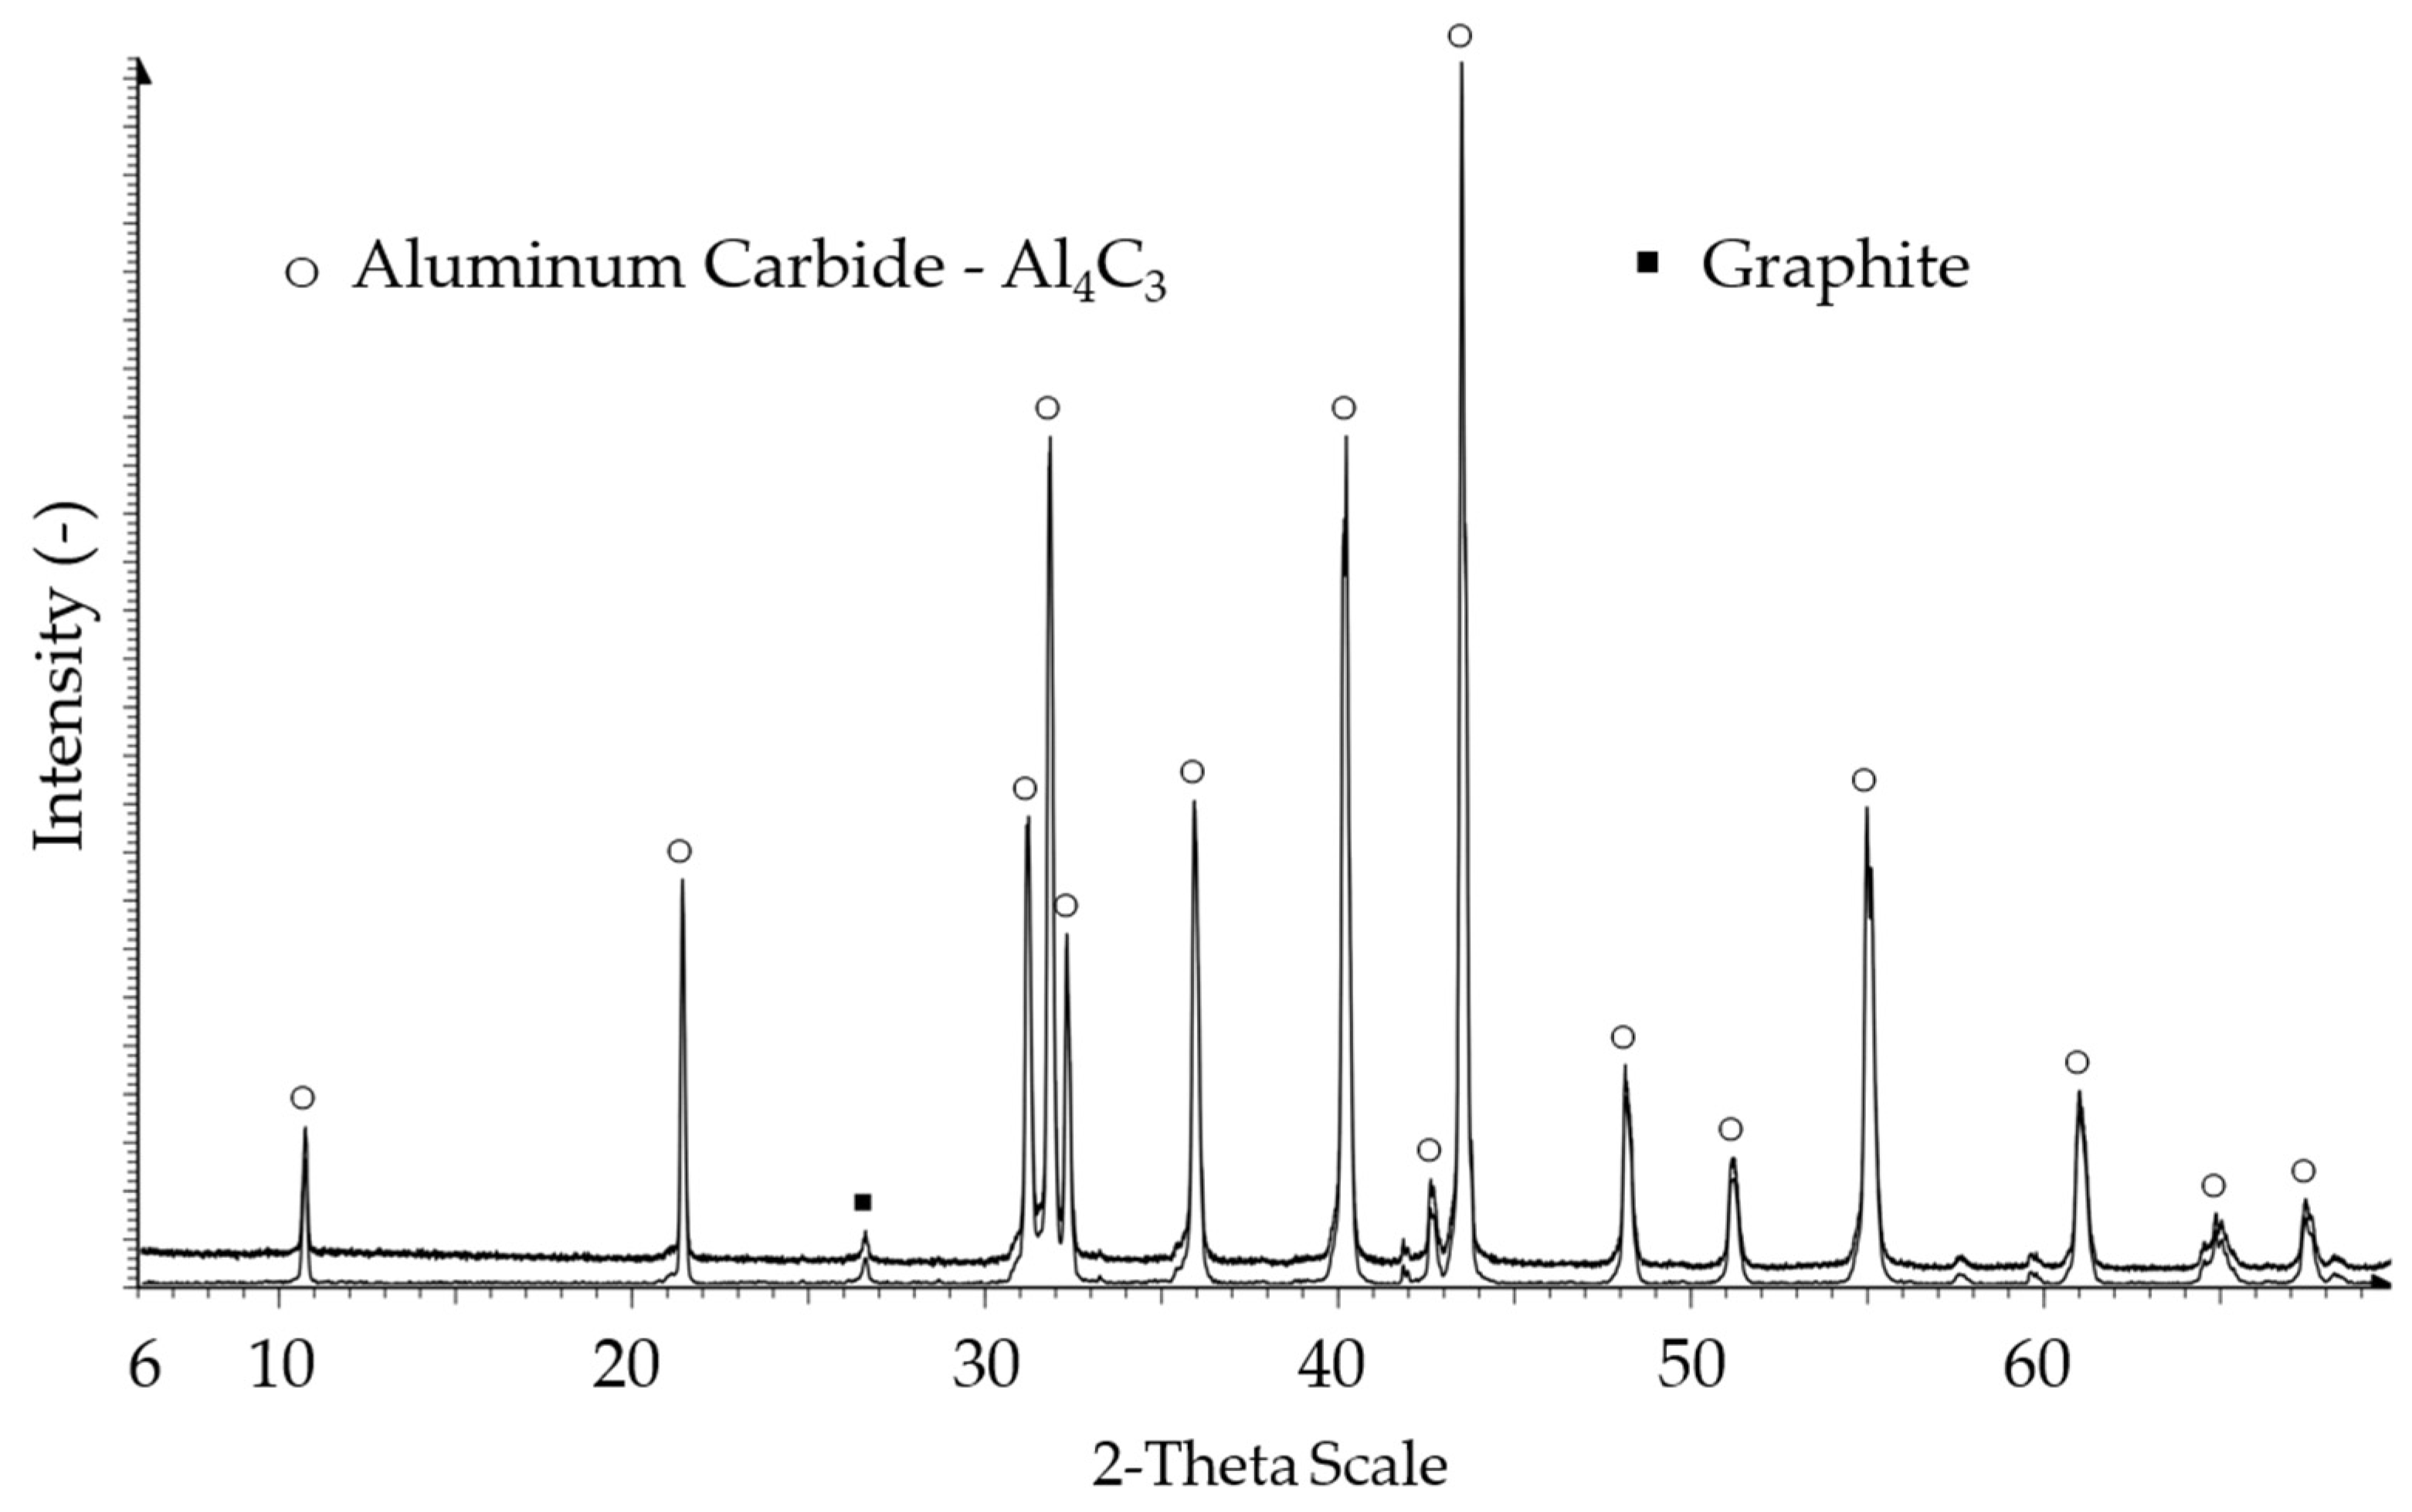
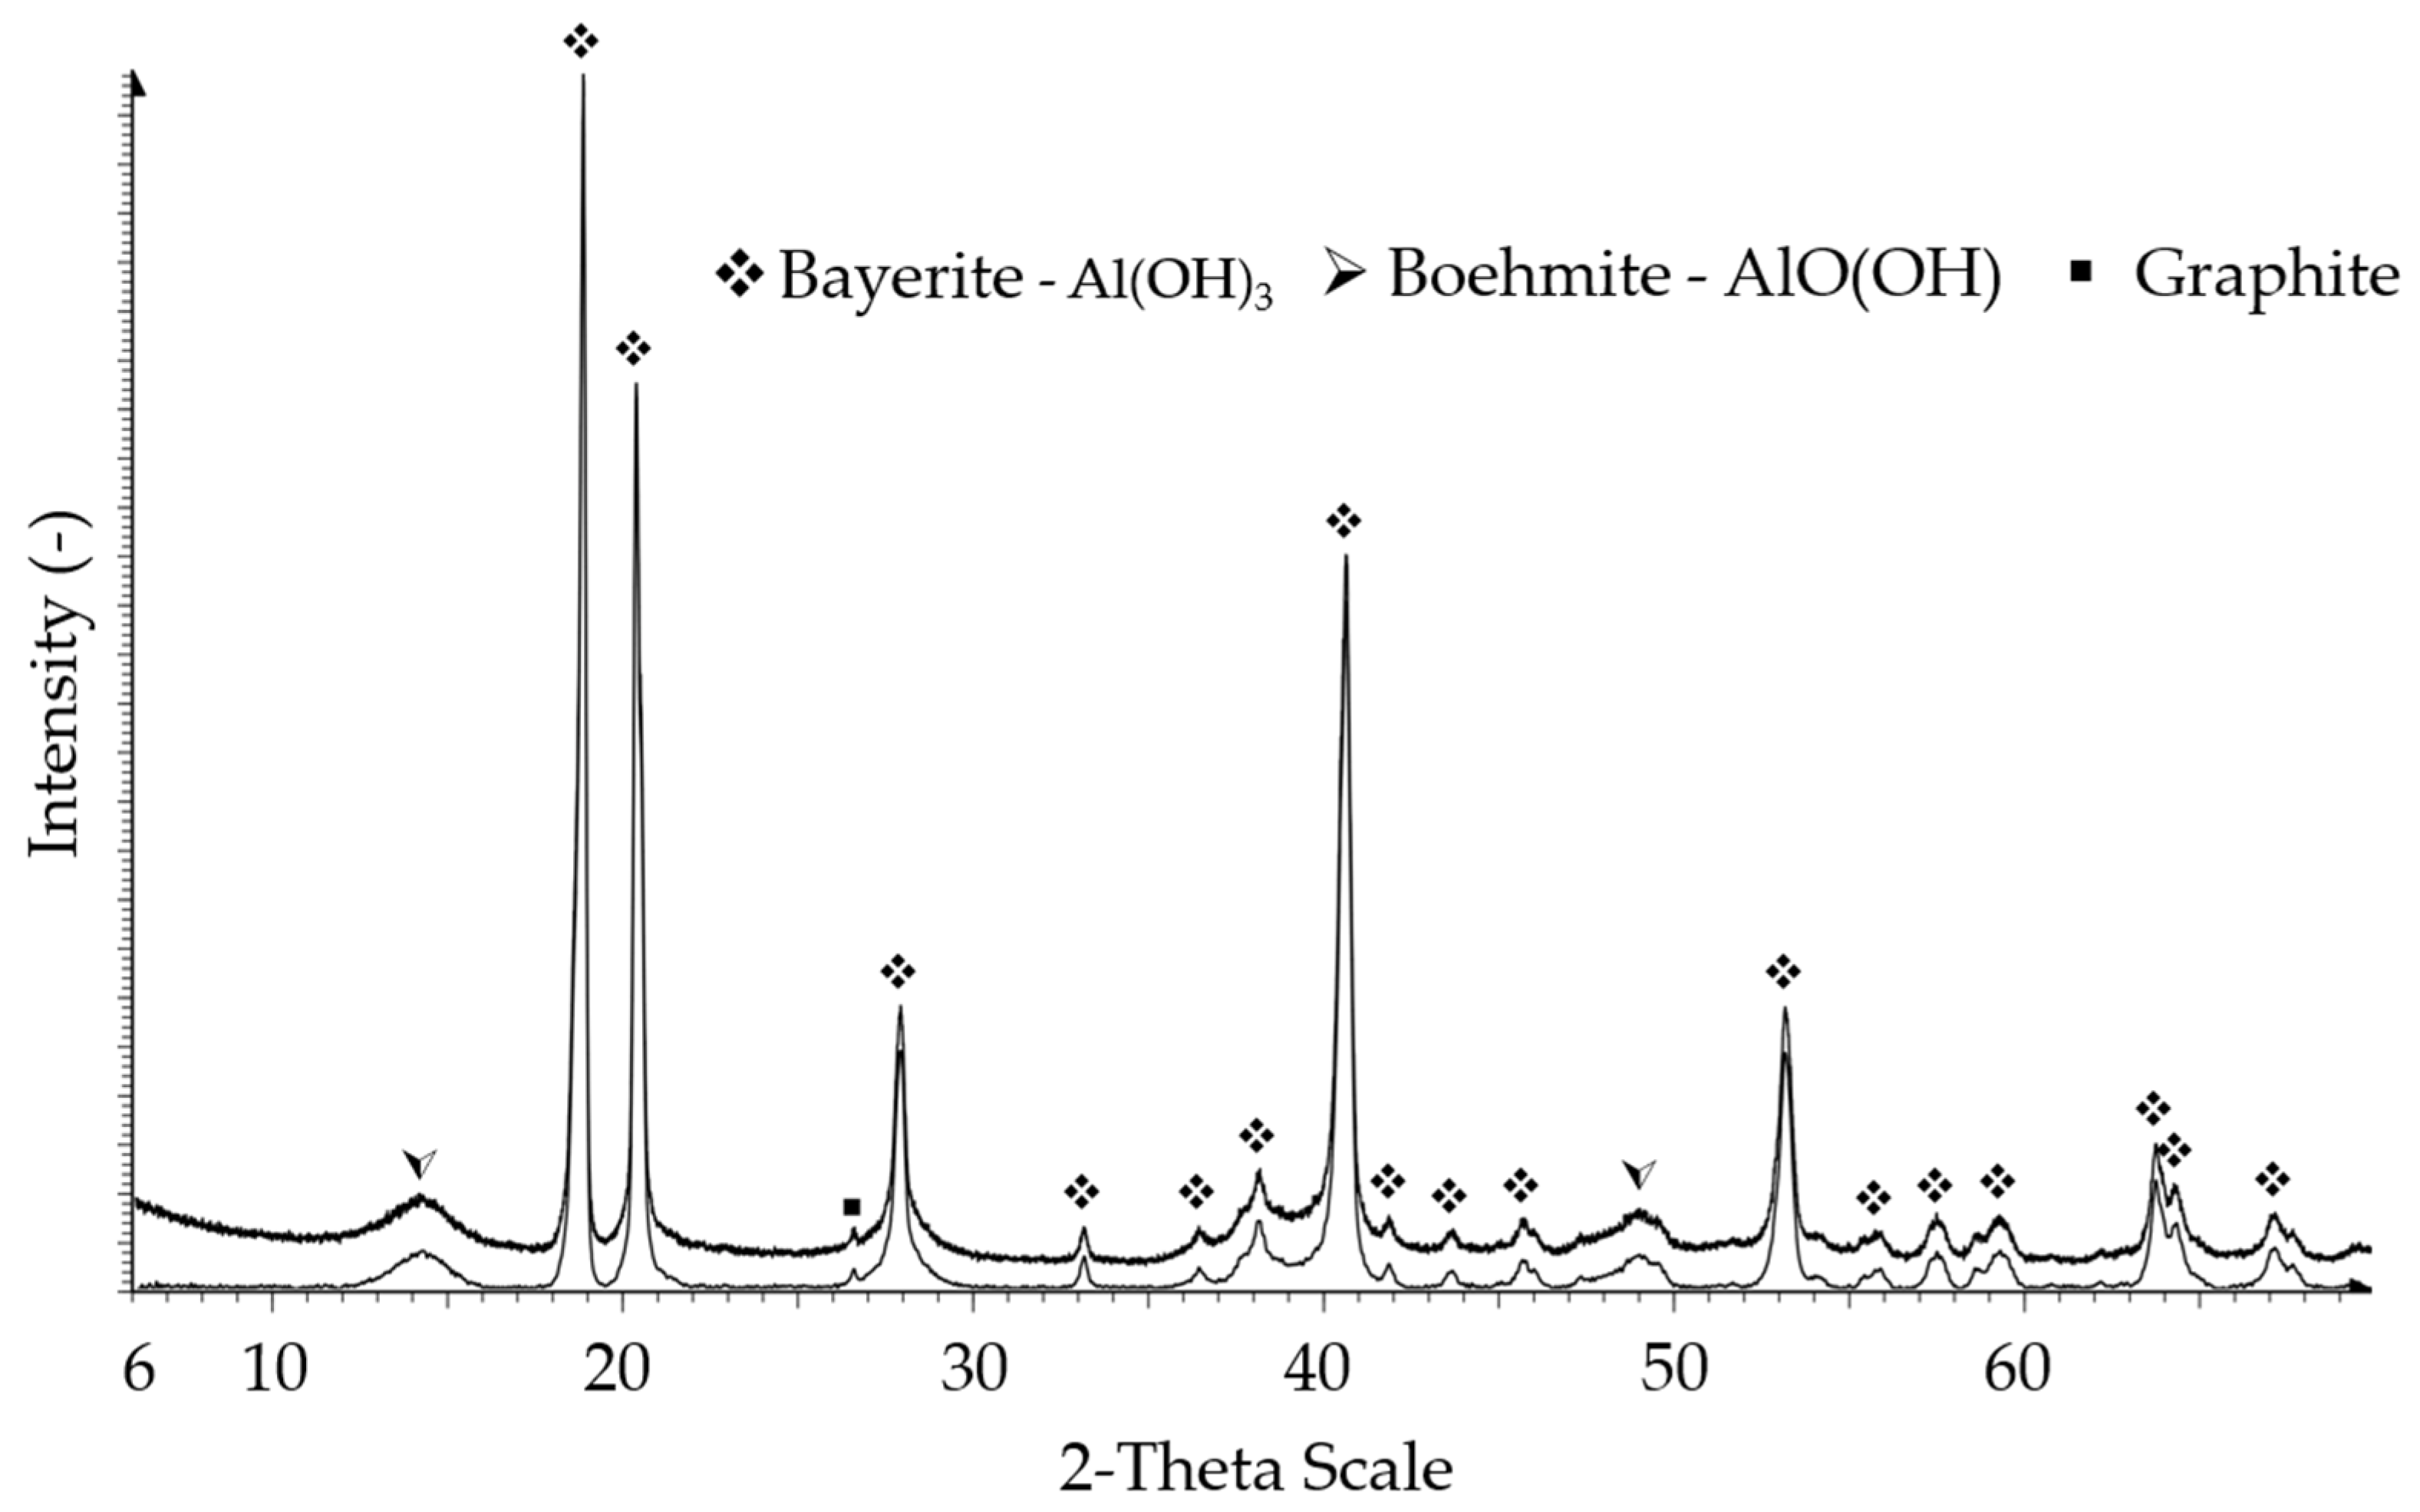
XRD analysis of the untreated sample (
Figure 4) showed a Graphite fraction (26.5 2-Theta) in addition to the diffraction pattern of Al
4C
3. As amorphous phases were present, the graphs were baseline corrected to lower noise and obtain more accurate results. The sample treated for 4 h at 70 °C in water (
Figure 5) showed that the Al
4C
3 had mainly changed to Al(OH)
3, but also a Boehmite AlO(OH) fraction had formed. The XRD pattern of the treated sample does not show residual Al
4C
3. This indicates that the concentration of Al
4C
3 in the powder reached a level below the detection limit of XRD, at approximately 2% (
w/
w). The hydrolysis at elevated temperatures led to an increase in amorphous fraction. The graphite fraction (26.5 2-Theta) was still present as it remained unchanged during the treatment. The marked 2-Theta angles are attached in the
Supplementary data file.
In this study, no distinction between effects of autoclave treatment and drying can be made for treated samples. As the effects were caused by distilled water at similar temperatures and recovery of Al4C3 showed nearly complete conversion according to gas analytics, this was deemed neglectable.
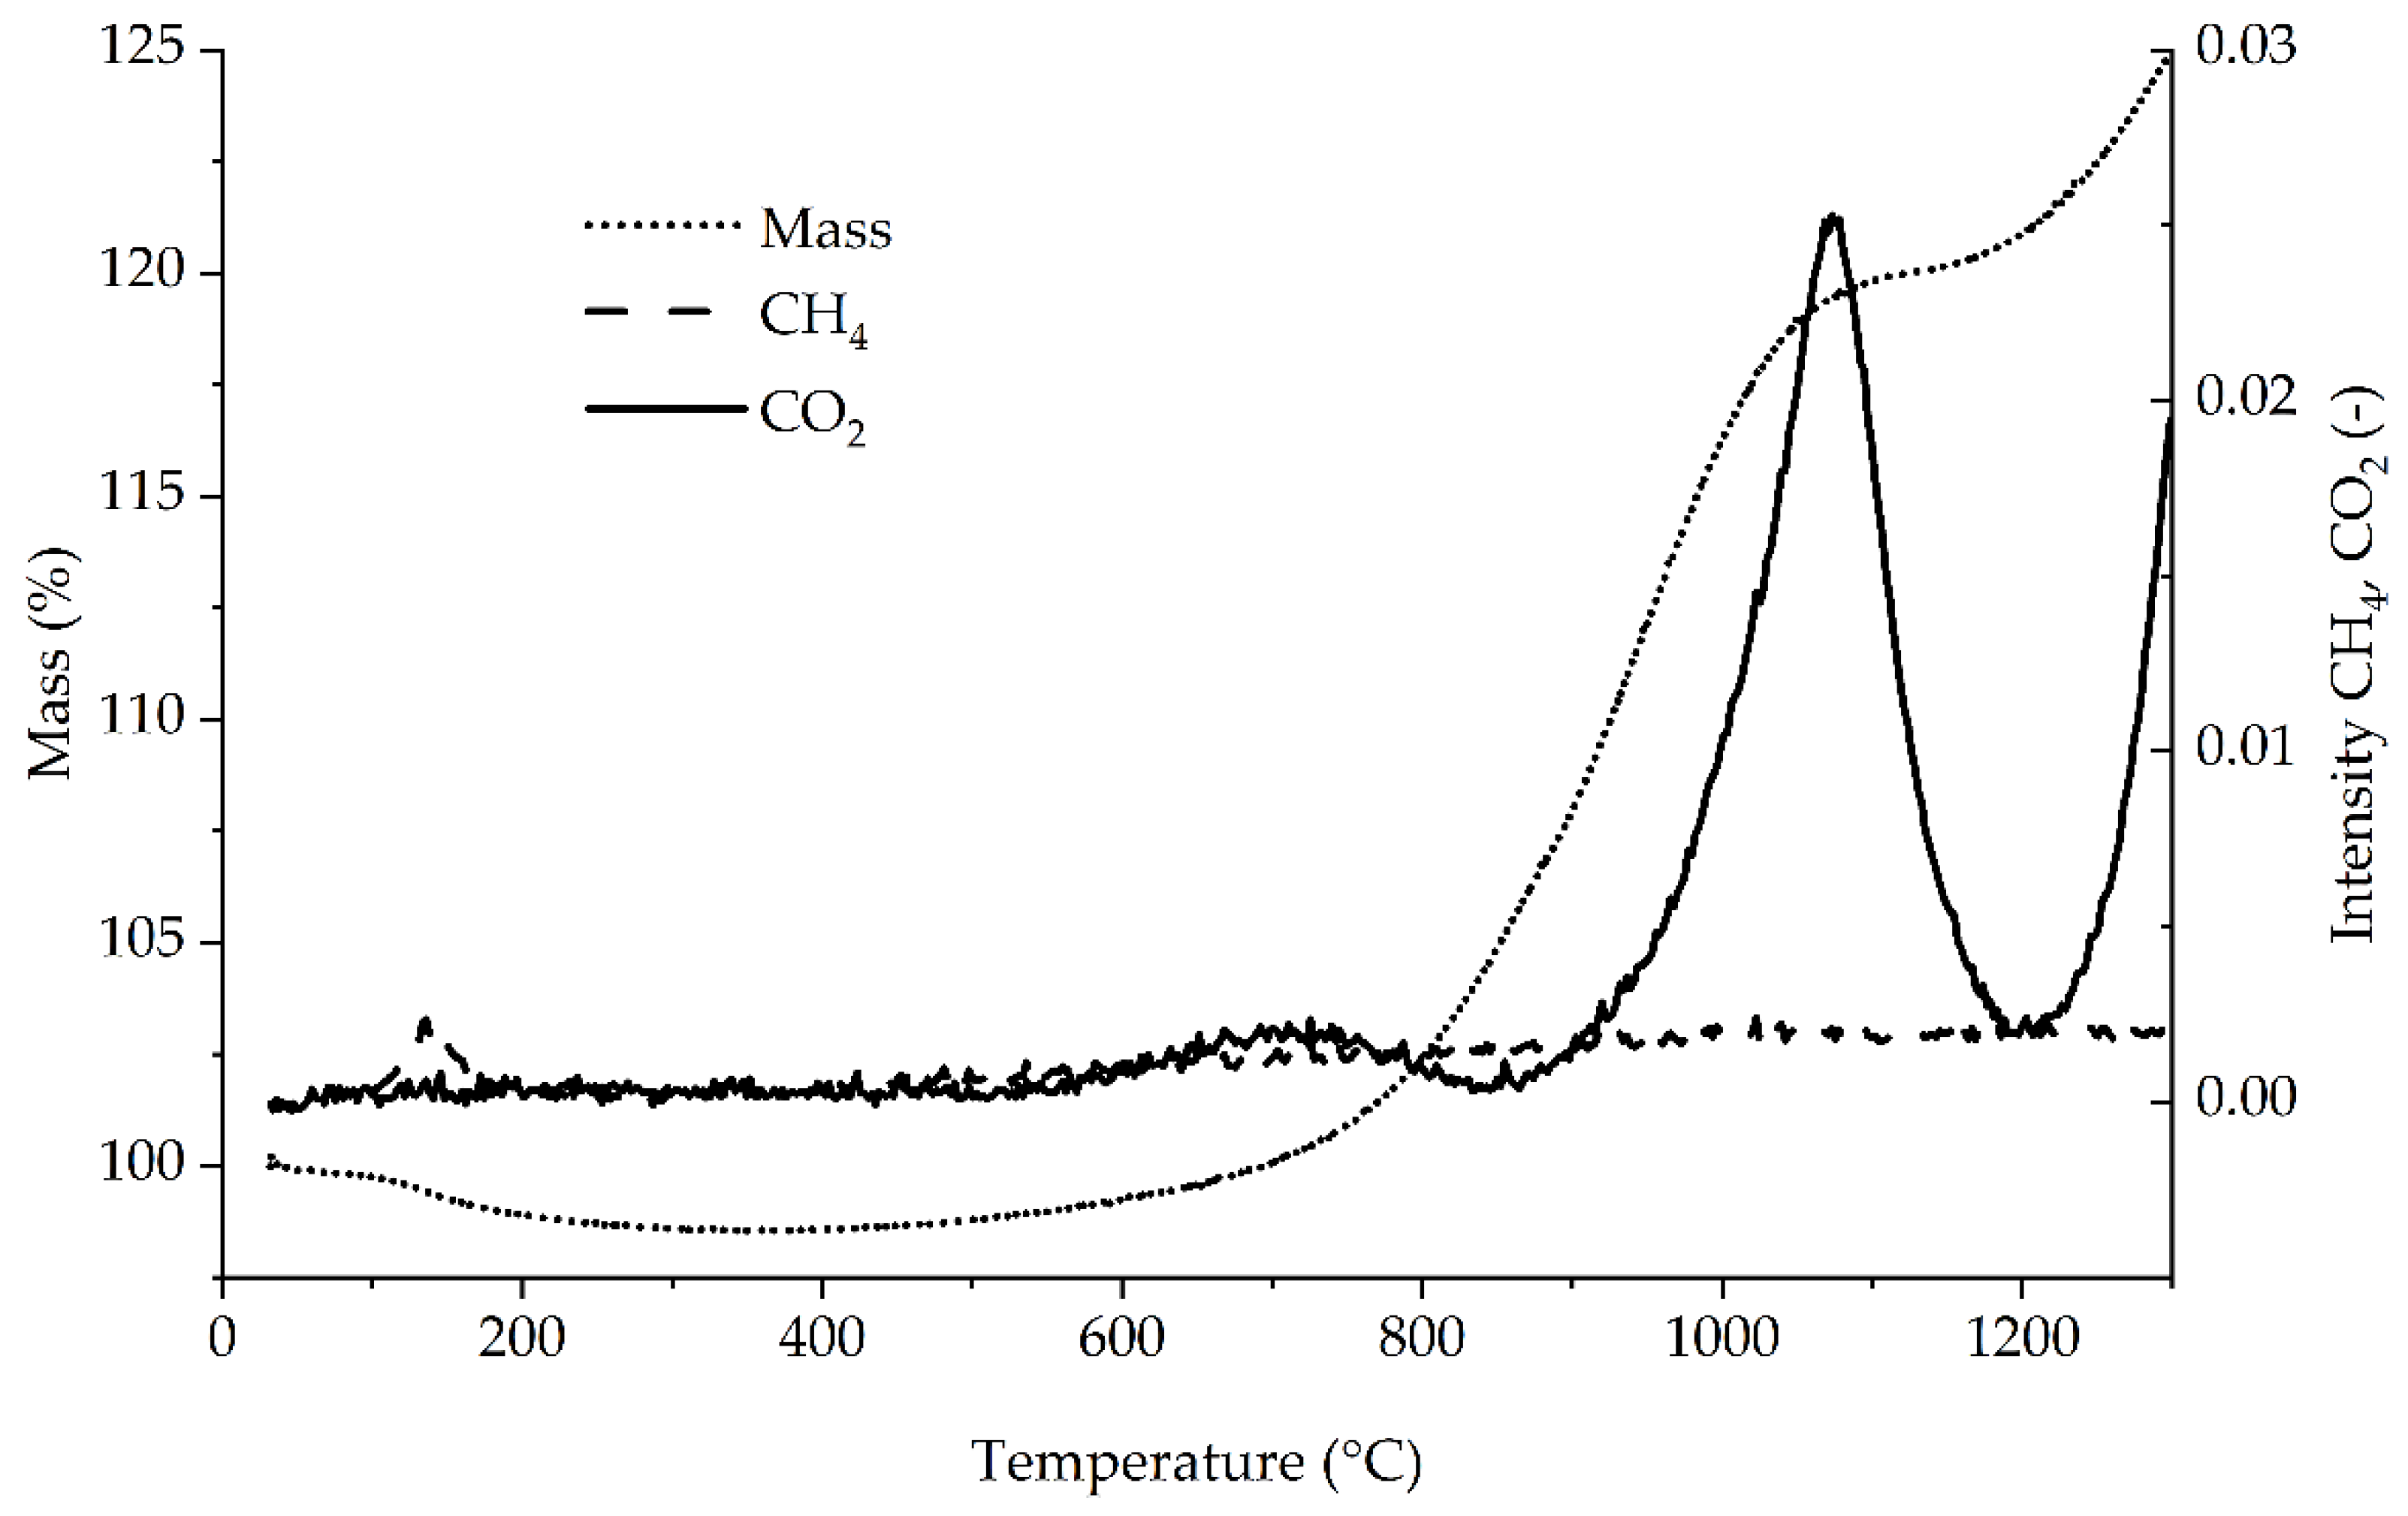
TGA analysis of the untreated sample (
Figure 6) showed an initial mass reduction of 1.57% (m/m) at 364 °C. This was probably caused by contact with humidity during the sample preparation, leading to methane formation peaking at 135 °C and a decrease in mass at 100–150 °C. In the area of 600–800 °C, an increase in CO
2 concentration occurred. In this temperature area, the free carbon was analyzed via LECO-C, indicating the oxidation of organic carbon. The increase in mass above 800 °C to nearly 120% indicates the start of Al
4C
3 oxidation to Al
2O
3. This correlates with IR analysis, showing an increase in the CO
2 concentration. Above 1200 °C, a second increase in mass occurs together with CO
2 formation.
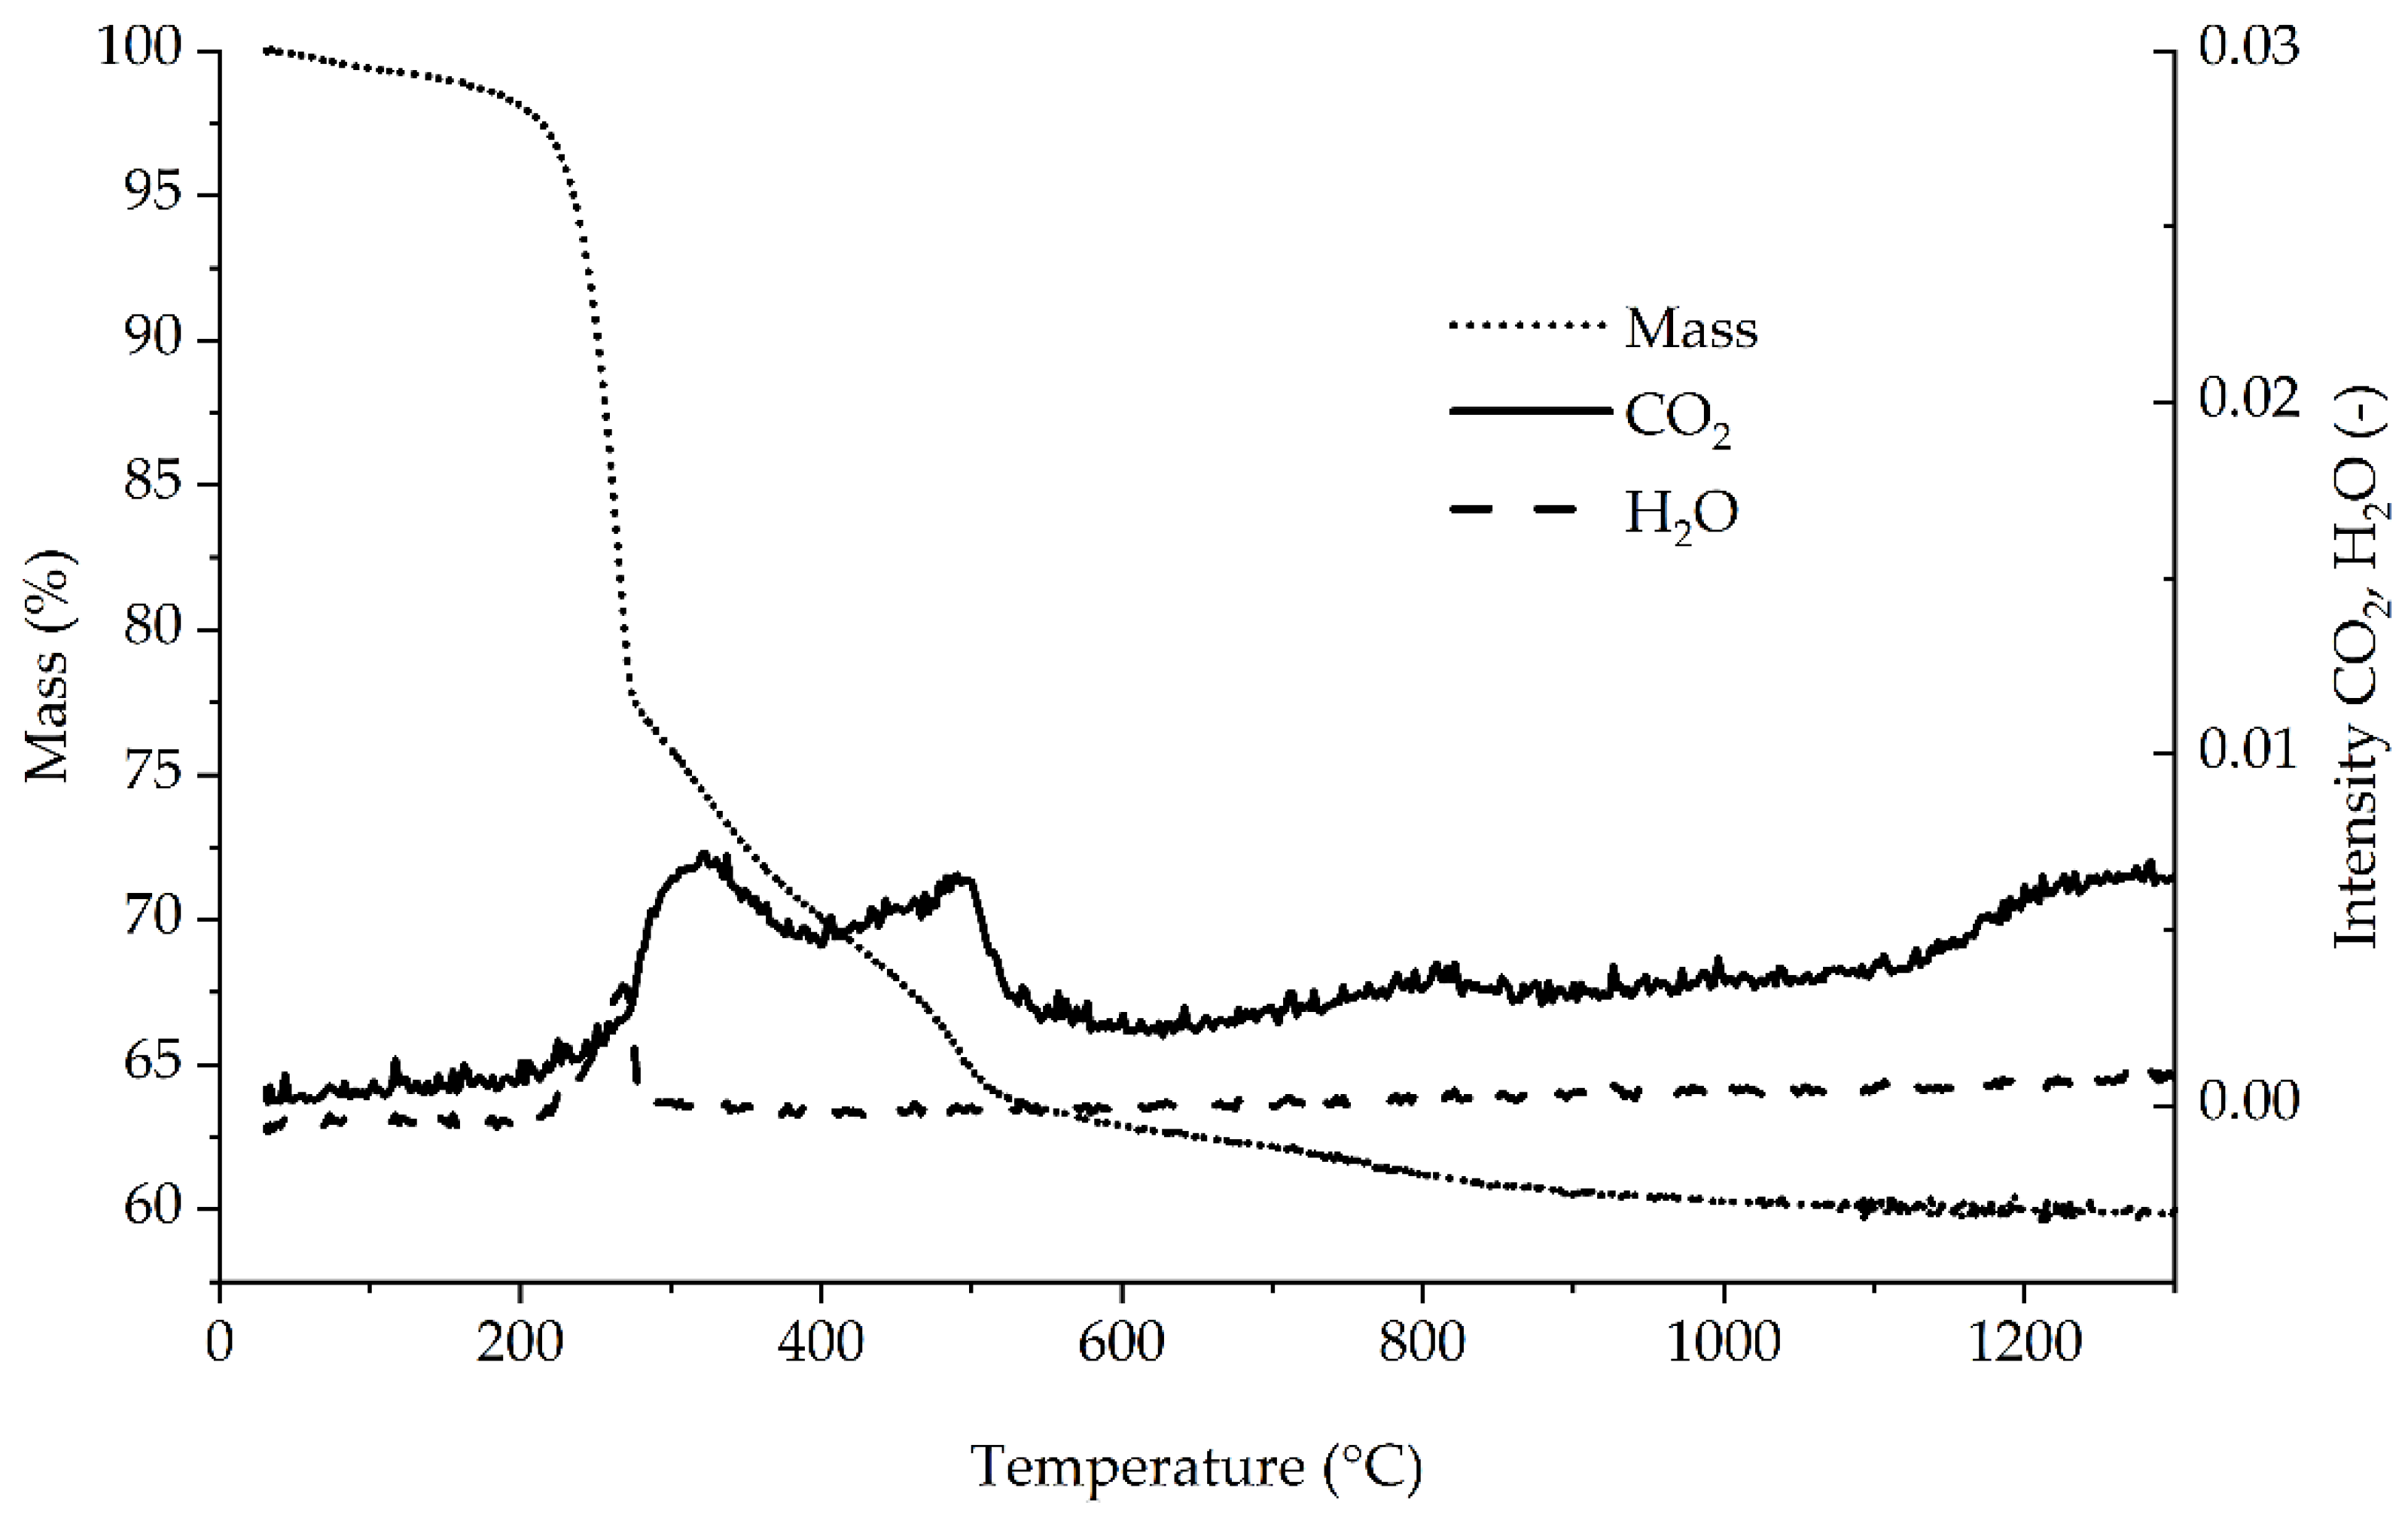
The treated sample (
Figure 7) initially showed a slight decrease in mass combined with CO
2 formation up to 200 °C. Slightly above 200 °C, there was a sharp decrease in mass to 78% at 273 °C, and vapor was detected. This indicates the release of crystal water. From 273 °C to slightly below 520 °C, the mass decrease slowed down until the mass reached approximately 63%. The CO
2 formation in this stage indicates oxidation of organic carbon. The double peak shape could not be explained during this study. The CO
2 concentration suddenly decreased at 520 °C, correlating with an even slower decrease in mass above 520 °C. The mass decreased further to about 60% at 1300 °C. IR analysis showed a steady increase in CO
2 concentration after the drop at 520 °C. The TGA curves were in accordance with the data of Koga and Yamada [
29], who analyzed synthetic Bayerite under vacuum.
Possible explanations for the CO
2 curve could be that the oxidation of free carbon starts at lower temperatures and lasts longer, as seen by the increasing CO
2 concentration at higher temperatures or the formation of unknown, carbon-containing fractions during the reaction similar to the behavior of MgO-C bricks [
13]. This would explain the slightly lower recovery as well. Additional research regarding the formed compounds is necessary. This might be conducted by phase identification, such as XRD, or surface identification, such as XPS, with special sample pretreatment.
3.5. Kinetics and Modelling
Understanding the kinetics of a reaction is an important step in deciding factors for improvements. Therefore, the next section will try to give a basic concept of the reaction kinetics of the researched reaction.
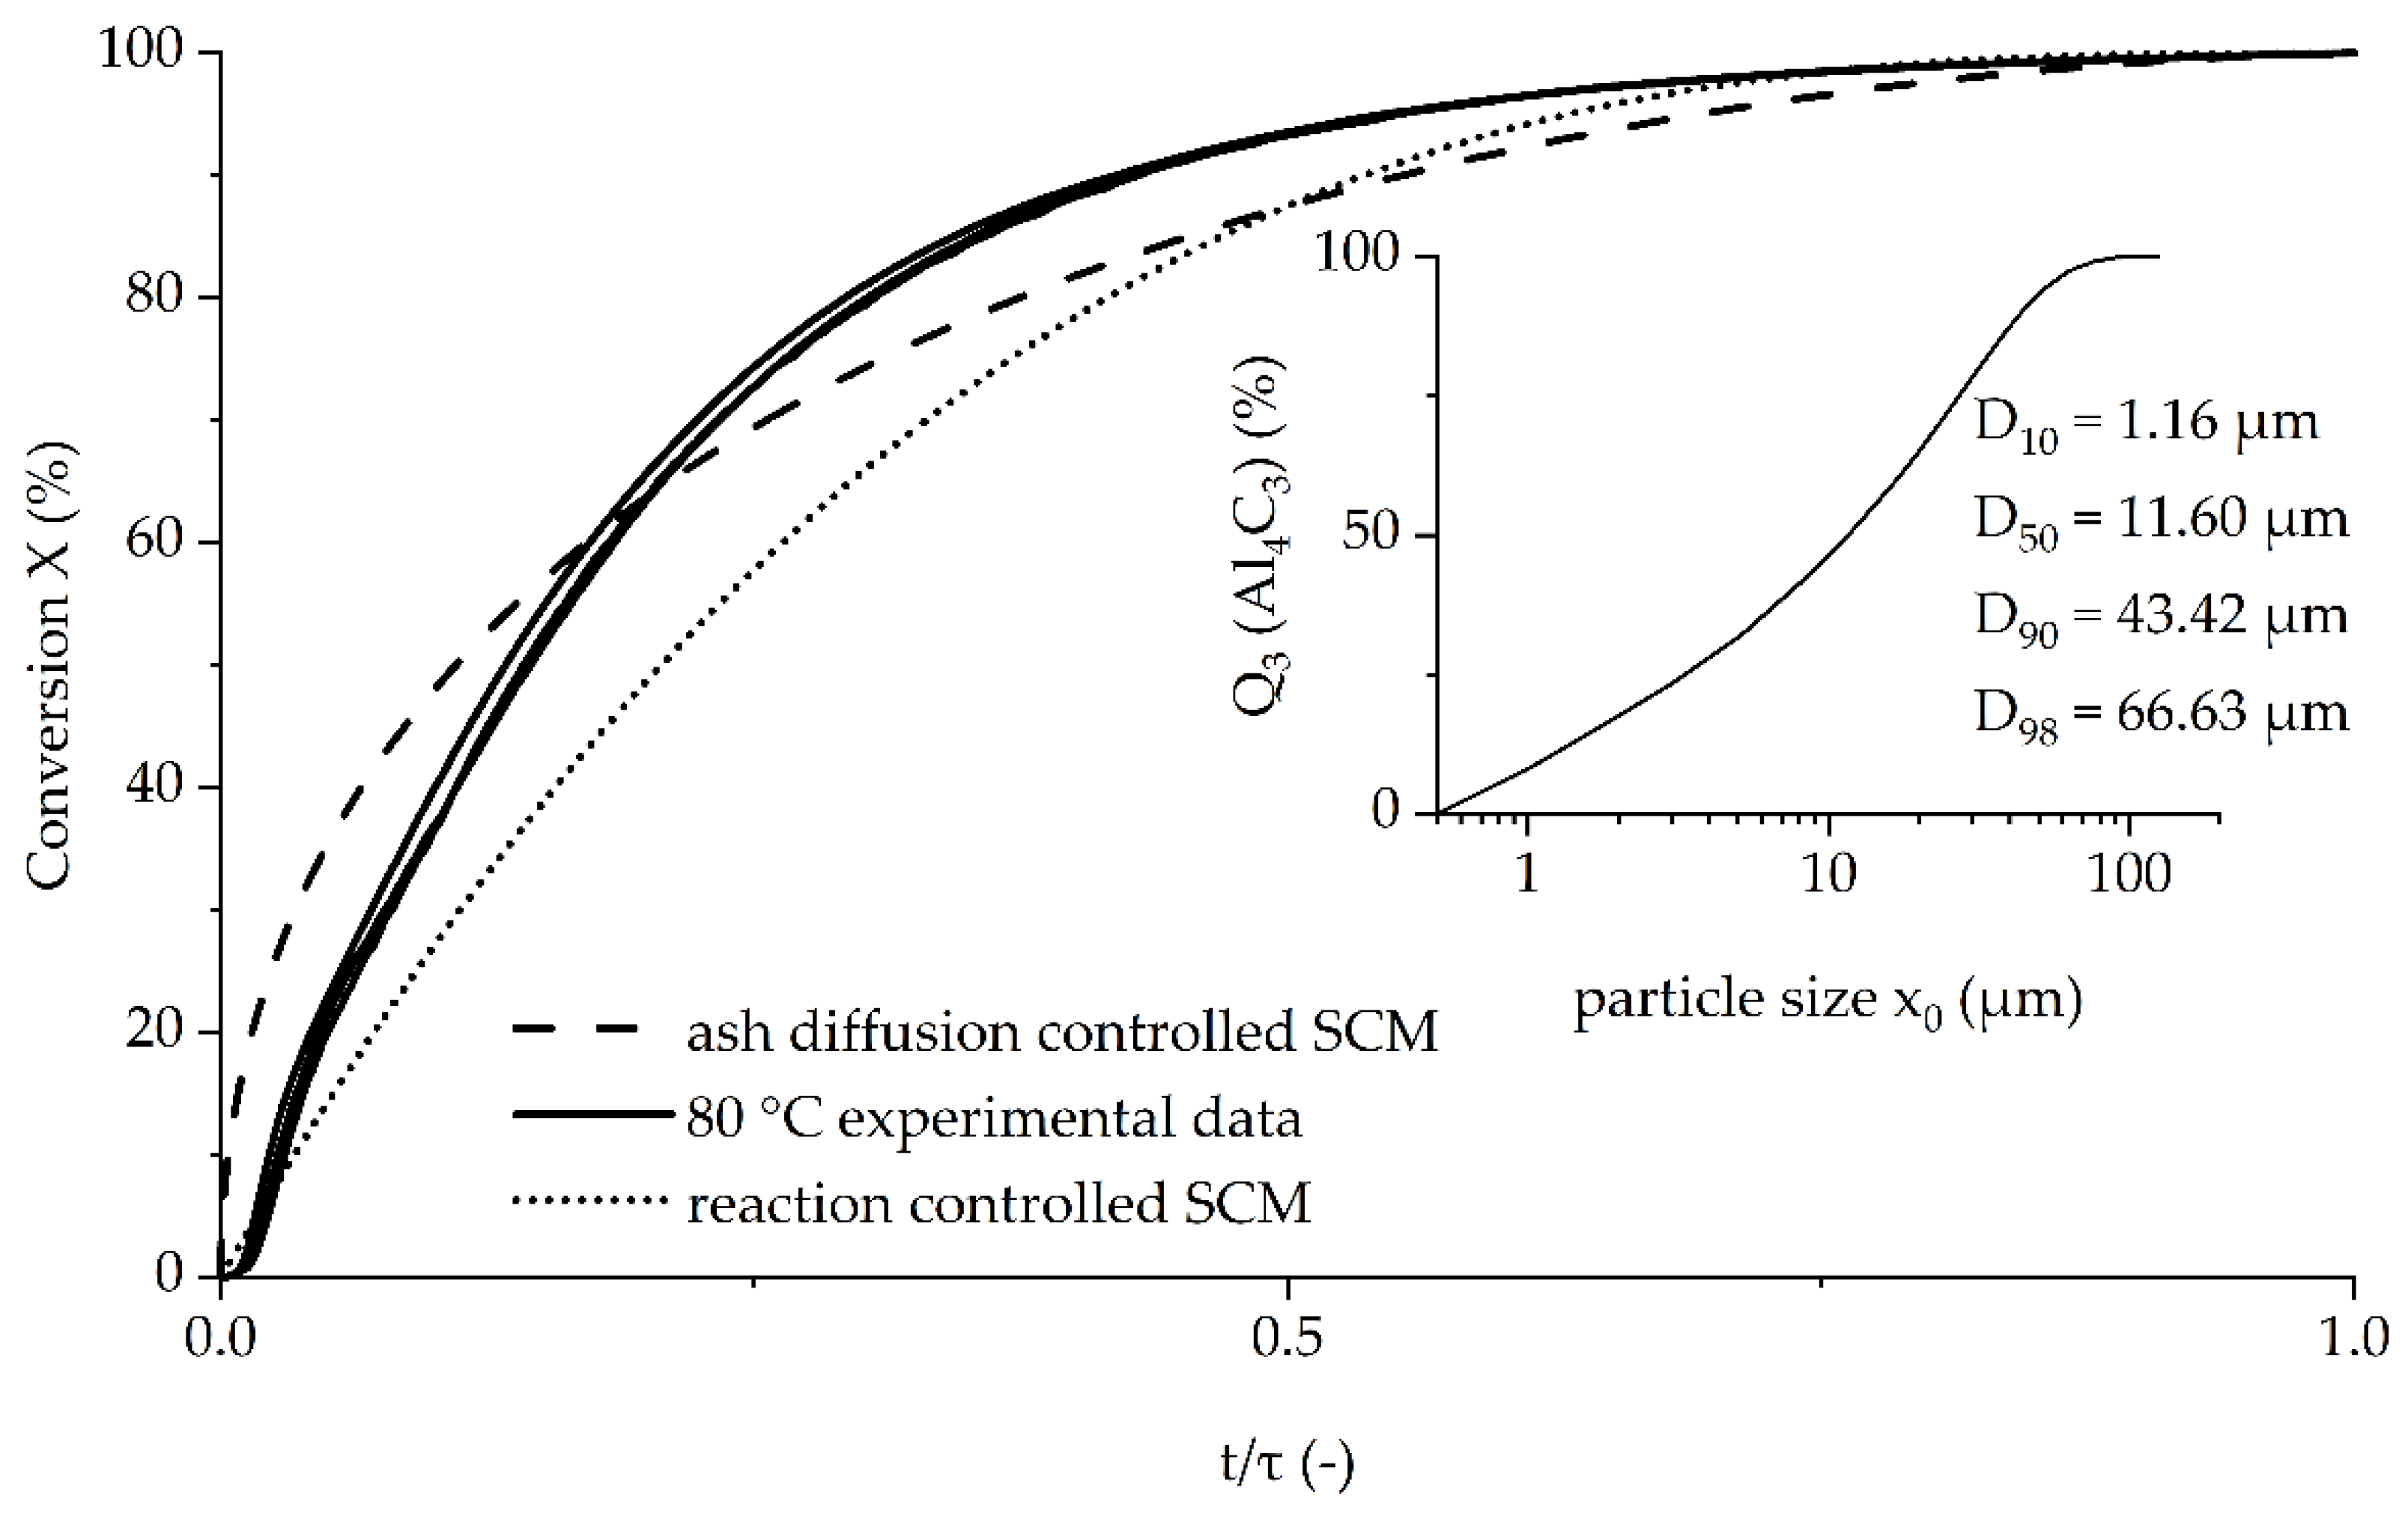
As the particles remain undissolved, it can be assumed that the reaction happens from the outside to the inside, leading to a core–shell structure. Therefore, the modelling approach of basic shrinking core models (SCM) with reaction or ash diffusion control was used [
30].
Figure 8 shows the model curve of a shrinking core model with either reaction or ash diffusion as the controlling steps and the curves of the trials conducted at 80 °C. The curves of these trials were chosen because they showed nearly no initial lag phase.
Since the exact initial concentration, and thereby the maximum conversion and conversion time, were unknown, simplifying assumptions were made:
The figure shows that the trials are reproducible. The experimental data was between the initially faster ash diffusion-controlled model (Equation (9), dashed line) and the initially slower reaction-controlled model (Equation (10), dotted line) until approximately 60% conversion. Thereafter, the experimental data showed a faster conversion than suggested by either model. This indicates that some simplifications made in the shrinking core model, such as spherical particles (
Figure 3) and very narrow particle distributions (inlet
Figure 8), cannot be applied [
30].
The particle size distribution measurement showed that the Al4C3 powder consisted of 10% particles smaller than 1.16 µm up to 10% particles larger than 43.42 µm, leading to different diffusion pathway lengths during the reaction.
The kinetic modelling, either ash diffusion- or reaction-controlled, was not able to accurately describe the experimental data at 80 °C. As Razavi-Tousi and Szpunar [
31] conclude in their study about a modified shrinking core model for the reaction of activated Al particles with hot water, several simplifications made by the model are not applicable. This seems to be the case for the presented reaction as well. The first deviation regarding the shape of the particles can be seen in
Figure 3, proving the assumption of spherical particles wrong. Furthermore, the particle size also shows great variation (inlet
Figure 8). The diffusion coefficient is also very unlikely to remain constant during the reaction, which can be assumed by the cracks in the treated particles as seen in
Figure 3, which are probably formed as a result of gas production during the reaction. As the reaction also leads to formation of an Al(OH)
3 shell, growing of particles due to stochiometric and density differences can be expected to happen as well [
28]. An additional factor is the solubility of methane in water [
32], which also leads to changes in the kinetic curves.
Summarizing, the following results were obtained:
The conversion time of 100 mg Al4C3 to CH4 with only H2O can be accelerated from 240 min to 160 min by elevating the temperature from 60 to 80 °C.
The maximum recovery of 90–91% (w/w) appears to be independent from temperature in the area from 60 to 80 °C and can be considered complete.
The proposed device can repeatably quantify Al4C3 in the range of 100 mg (standard deviation of triplicates < 1%).
The particles are not dissolved during the treatment, but surface changes occur due to conversion to Al(OH)3 and AlO(OH).
A shrinking core approach controlled by either reaction or ash diffusion cannot accurately describe the experimental data.
4. Conclusions
In this study, an autoclave device was coupled with NDIR process analytics to provide a solution for quantifying Al4C3 without the use of hazardous chemicals in industrial environments.
Experiments with pure Al4C3 showing the complete conversion to mainly Al(OH)3 with a smaller AlO(OH) fraction were successfully conducted. This was additionally checked by XRD, SEM, and TGA-IR.
The recovery, reproducibility, and precision of the device were successfully quantified and deemed appropriate for the intended use as a quality control tool for bigger sample sizes.
After the creation of a standard operating procedure, method validation at different concentrations of analyte must be carried out. This provides access to additional important parameters, such as limit of detection, limit of quantification, linearity, working range, and sensitivity.
Kinetic curves were recorded, and a basic modelling approach was proposed. However, neither basic reaction-controlled nor ash diffusion-controlled modelling led to sufficient agreement. Therefore, kinetic modelling requires closer examination of several parameters, such as particle shape and size, as well as SEM cross section analysis of partially converted particles to estimate the geometric aspects of conversion and the formation of cracks influencing the diffusion coefficient. Another approach might be to conduct experiments at pH values below 2 or above 11 where, as stated by Razavi-Tousi and Spunar [
28] the Al(OH)
3 layer becomes soluble in order to obtain information on kinetic values without the effects of diffusion. Diffusion could then be considered in additional experiments.
Possibilities for further improvement of analysis time were shown. Separating the reaction from the analyzing step utilizes the potential of the autoclave system, enabling reaction temperatures above 100 °C. The analyzing step could be conducted after a cooling phase.
The main intended applications can be seen as bulk materials containing Al4C3 where analyte concentrations are in the mg area and bigger sample sizes are beneficial due to inhomogeneity. As industrial ambient conditions are mostly rougher, cheaper and more robust equipment that is easier to handle is preferred. In cases of processes causing Al4C3 formation, controlling the quantity of Al4C3 might lead to optimization of production parameters. This leads to less structural damage caused by hydrolyzation. In the case of Al4C3 being used as raw material, the quantification of Al4C3 enables the exact dosing of needed Al4C3 to prevent problems caused by unreacted Al4C3.
Therefore, the device intends to be an extension to the already existing GC and GC-MS methods, combining conversion and gas analytical measurement in one device.


