Abstract
Background/Objectives: Visceral adipose tissue (VAT) may play a direct role in the development of metabolic dysfunction-associated steatotic liver disease (MASLD) and its progression to metabolic dysfunction-associated steatohepatitis (MASH). In this study, we employed untargeted proteomics analyses on paired biopsies from VAT and liver tissues of patients with obesity, MASLD, and MASH. Our objective was to investigate tissue-specific protein expression patterns in search of a potential proteomic signature associated with MASH in both VAT and liver tissue. Methods: VAT and liver tissue were collected from 70 subjects with severe obesity (SWOs) and nine control study subjects without obesity (CON). SWOs were stratified on the basis of liver histology into LS− (no liver steatosis), LS+ (liver steatosis), and MASH. Peptides were extracted from frozen tissue and were analyzed by liquid chromatography coupled to tandem mass spectrometry (LC-MS/MS). Raw files were analyzed with Spectronaut, proteins were searched against the human FASTA Uniprot database, and the significantly expressed proteins in the two tissues were analyzed. The p-values were false discovery rate (FDR) corrected. Results: A total of 59 VAT and 42 liver proteins were significantly differentially expressed between the four groups: LS−, LS+, MASH, and CON. The majority were upregulated, and many were related to lipid metabolism. In VAT, only one protein, the mitochondrial sulfide:quinone oxidoreductase (SQOR), was significantly downregulated in the MASH group only. In liver tissue from patients with MASH, six proteins were significantly altered compared with the three other groups. Correlation analyses between the top 10 positive VAT and liver proteins were dominated by inflammatory and detoxification proteins. Conclusions: The presence of MASH was not reflected in the VAT proteome, and both the VAT and the liver proteome were generally affected more by the presence of obesity than by MASLD severity. Several immunomodulating proteins correlated significantly between VAT and liver tissue and could reflect common pathophysiological characteristics.
1. Introduction
The harmful impact of the excessive deposition of visceral adipose tissue (VAT) on the risk of metabolic disease, type 2 diabetes (T2DM), and cardiovascular disease has been recognized for decades [1,2]. Adipose tissue has major metabolic as well as endocrine functions. Adipose tissue-derived adipocytokines and fat-derived metabolites such as free fatty acids affect the physiology of other organs [3,4,5], but VAT in particular is associated with metabolic disease risk. In clinical practice, waist circumference, which correlates with truncal VAT mass, is central to identifying patients at increased risk of metabolic comorbidities including metabolic dysfunction-associated steatotic liver disease (MASLD) and metabolic dysfunction-associated steatohepatitis (MASH) [6,7,8]. An expansion of visceral fat mass negatively impacts adipose tissue physiology and function as the resulting rise in metabolic and oxidative stress contributes to peripheral insulin resistance and disrupts the overall homeostasis of VAT [1]. These alterations are exerted, in part, through changes in the secretion of adipokines and proinflammatory cytokines with the subsequent creation of an inflammatory and metabolic dysfunctional milieu with resultant adipocyte death and fibrosis deposition within the adipose tissue with infiltration and proliferation of macrophages contributing to obesity-associated adipose tissue inflammation [9,10,11,12,13].
In MASLD, triglycerides accumulate within the hepatocytes and cause liver steatosis; the condition may progress to MASH, which is characterized by necroinflammation of the liver tissue and formation of liver fibrosis [14]. In MASLD, the changes that occur in VAT and liver tissue seem to share some pathophysiological characteristics. In addition, mesenteric and omental VAT are venously drained to the liver via the portal vein. According to the portal vein theory, free fatty acid adipocytokines and inflammatory cytokines derived from the VAT access the liver and could contribute to the development of liver steatosis and perhaps impact the progression of MASLD to MASH and liver fibrosis [15].
Mass spectrometry (MS)-based proteomic analyses offer fast and large-scale analyses of the proteomes and can identify alterations in protein abundance in relation to disease. MS-based proteomics could serve as a tool for the identification of proteins that are upregulated or downregulated in patients with MASLD and MASH. However, untargeted proteomics has been applied to adipose tissue in other metabolic diseases, particularly T2DM [16,17].
MASLD remains more unexplored in this context, and most studies have focused on the plasma proteome in relation to MASLD and MASH [18,19,20,21,22], in search of diagnostic markers of MASLD severity. Liver tissue proteomics has previously been applied in human MASLD [23,24], but to a much lesser extent, some studies with focus on MASH associated hepatocarcinogenesis [25,26] and MASH fibrosis [27]. Very limited data exist on the proteomic pattern in adipose tissue in the context of MASLD.
Consequently, the concomitant assessment of VAT and liver tissue allows for a detailed evaluation of the changes that occur in patients with obesity, MASLD, and MASH, and tissue proteomics analyses could provide important information about the underlying pathophysiology of MASLD.
In this cross-sectional study, we conducted tissue proteomics analysis on paired biopsies from omental visceral adipose tissue (VAT) and liver tissues in 70 patients with severe obesity. These patients were categorized based on the presence or absence of varying stages of MASLD and MASH. Additionally, we included nine control subjects without obesity.
Our primary aims were to describe the protein patterns in liver and visceral adipose tissue with increasing severity of MASLD and to explore the potential overlap of proteins that are significantly upregulated or downregulated in both liver tissue and VAT. By identifying potential shared protein changes, we sought to uncover a distinct proteome signature specific to MASH in both tissue types.
2. Materials and Methods
2.1. Cohort and Study Investigations
We collected omental VAT and liver tissue from 70 SWOs undergoing laparoscopic bariatric surgery and control study subjects without obesity (CON) undergoing planned laparoscopic cholecystectomy at Copenhagen University Hospital Hvidovre between December 2016 and October 2019. Tissue samples were collected immediately after induction of anesthesia and trocar placement, before the actual surgical procedure.
After sampling, the VAT was trimmed and cut into smaller pieces of 50–100 mg and immediately snap frozen in liquid nitrogen before storage in a −80-degree freezer until analysis. The liver tissue was similarly trimmed; the capsule was removed; and it was cut into pieces of 50 mg, snap frozen, and stored as described above. In addition, part of the liver biopsy underwent fixation in paraformaldehyde for later paraffin embedment and histological analysis.
The study was conducted according to the Declaration of Helsinki and was approved by the Regional Ethics Committee of Capital Region, Denmark (H-16030784 and H-16020782). All study subjects gave oral and written consent.
2.2. Liver Histology and Grouping of Study Subjects
Liver histology was assessed by three pathologists. The MASLD activity score the (referred to as the NAFLD activity score, NAS) was used to group patients with obesity as follows:
- (1)
- No liver steatosis (LS−): no liver steatosis present in liver biopsies;
- (2)
- Liver steatosis present (LS+): liver steatosis present but without MASH (NAS score < 5);
- (3)
- MASH: NAS ≥ 5 with points from all subcategories (steatosis, inflammation, and ballooning).
2.3. Sample Preparation for MS Analysis
Frozen liver and VAT biopsies were homogenized on a Precellys24 homogenizer (Bertin Technologies, Montigny-le-Bretonneux, France) in 300 µL SDC reduction and alkylation buffer (PreOmics GmbH, Martinsried, Germany) containing 1× Roche phosphatase inhibitor with ceramic beads (2.8 and 1.4 mm zirconium oxide beads, Precellys). Approximately 15 mg of liver and 50 mg of VAT were processed as the starting material. The homogenates were incubated at 95 °C for 10 min (1200 rpm) and subsequently transferred to a new 1.5 mL Eppendorf tube, from which 45 µL of homogenate was further transferred to a 96-well plate and sonicated for 5 min using the Covaris Adaptive Focused Acoustics (AFA) sonication system (Covaris, Woburn, MA, USA). The protein content was determined by Tryptophan assay, and an aliquot of 50 µg was digested overnight with LysC and trypsin at a 1:50 ratio (μg of enzyme to μg of protein) at 37 °C (1700 rpm). Peptides were acidified to a final concentration of 0.1% trifluoroacetic acid (TFA). Approximately 20 µg of peptides were loaded on Stage-Tips and washed with isopropanol/1% TFA (200 μL) and then 0.2% TFA (200 μL). Peptides were eluted with 60 μL of elution buffer (80% acetonitrile/1% ammonia) and dried at 60 °C using a SpeedVac centrifuge Concentrator plus) (Eppendorf, Hamborg, Germany) Dried peptides were dissolved and sonicated in 5% acetonitrile/0.1% TFA, and the concentration was measured using Nanodrop. Peptide mixtures were stored at −80 °C until further analysis. Quality control samples of pooled tissue homogenate were included for measuring the workflow variation.
2.4. LC-MS/MS Analysis (Liquid Chromatography-Mass Spectroscopy/Mass Spectrometry Analysis)
Samples were measured using LC-MS instrumentation consisting of an EASY-nLC 1200 system (Thermo Fisher Scientific, San Jose, CA, USA) interfaced online with a Q Exactive HF-X Orbitrap (Thermo Fisher Scientific, Bremen, Germany). Purified peptides were separated on 42.5 cm HPLC columns (ID: 75 µm; in-house packed into the tip with ReproSil-Pur C18-AQ 1.9 µm resin (Dr. Maisch GmbH)). Approximately 500 ng of peptides were injected for each LC-MS/MS analysis. Peptides were loaded in buffer A (0.1% formic acid) and eluted with a linear 82 min gradient of 3–23% of buffer B (0.1% formic acid, 80% (v/v) acetonitrile), followed by an 8 min increase to 40% of buffer B. The gradients then increased to 98% of buffer B within 6 min, which was maintained for 4 min. Flow rates were maintained at 350 nL/min. Re-equilibration was performed for 4 μL of 0.1% buffer A at a pressure of 700 bar. The column temperature was kept at 60 °C.
For liver tissue samples, MS spectra were acquired using the data-independent acquisition (DIA) mode, enabled by MaxQuant. Live [28], in which the scan protocol was defined. Each acquisition cycle consisted of a survey scan at resolution of 60,000 with an automatic gain control target (AGC) of 3 × 10⁶ and a maximum injection time of 100 ms, followed by 66 DIA cycles at a resolution of 15,000 with an AGC of 3 × 10⁶/22 ms IT at a range of 300–1650 m/z. Higher-energy collisional dissociation (HCD) fragmentation was set to a normalized collision energy of 27%. In all scans, PhiSDM [29] was enabled with 100 iterations, and the spectra type was set to centroid. For adipose tissue samples, the DIA-MS method consisted of an MS1 scan from the 350–1650 m/z range (AGC target of 3 × 10⁶, maximum injection time of 60 ms) at a resolution of 60,000 and 32 DIA segments (Dataset EV1, AGC target of 3 × 10⁶, maximum injection time of 45 ms). The acquisition of samples was randomized to avoid bias.
2.5. Quantification and Statistical Analysis: Raw Data Processing and Analysis
All raw files were analyzed with Spectronaut Pulsar X (version 13.10) with default settings except that the “quantification” data filtering parameter “Q-value” was set to “complete”. The DIA hybrid spectra were searched against in-house generated libraries for human liver and adipose tissue using the same LC setup searching against the human FASTA Uniprot database (version 201801, containing 93k entries). Proteins with more than 30% of missing values were discarded. Samples with fewer than 2500 quantified proteins were also discarded. Normalization based on the median protein intensity of each sample was performed. The remaining missing values of the dataset were imputed by drawing random samples from a normal distribution (down-shifted mean by 1.8 standard deviation (SD)) and scaled SD (0.3) relative to that of the proteome abundance distribution, with which we performed the statistical analysis. Statistical and bioinformatics analyses were performed with the Perseus software (version 1.6.5.0) and Python software (version 3.8.2). Specifically, one-way ANOVA was performed using the Python open-source statistical package “pingouin” (https://pingouin-stats.org/) corrected for multiple hypothesis testing by Benjamini-Hochberg at 5% FDR (false discovery rate), followed by Tukey’s HSD (honestly significant difference) test. Pair-wise correlation between VAT and liver tissue protein levels was performed with the pingouin. pairwise_correlation module with a significance level of Benjamini-Hochberg-corrected FDR at 5b% (q-value). For the proteomics analyses, a q-value < 0.05 was considered statistically significant.
Before filtering for 70% (meaning that a given protein must be expressed/detectable in 70% of the samples within the specific tissue type), we detected 3200 protein groups (17,570 peptides) in VAT and 5151 protein groups in liver tissue (35,965 peptides).
The following databases were used to characterize the function, cellular compartment, and tissue distribution/expression of the significant proteins: uniprot.org, proteinatlas.org, metabolicatlas.org, genecards.org, and omim.org.
Clinical and anthropometrical data were presented as the mean (SD). p-values were one-way ANOVA with Bonferroni correction or Chi square/Fischer’s exact test. p < 0.05 was considered statistically significant.
Illustrations were made in Perseus software (version 1.6.5.0) and with the use of biorender.com (accessed on 15 December 2024).
See Figure 1 for a schematic overview of the study workflow.
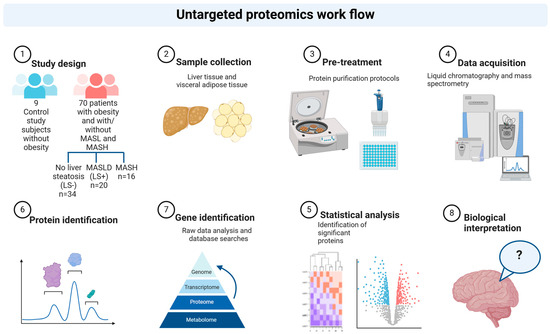
Figure 1.
Study workflow. Schematic illustration of the proteomics workflow in liver and visceral adipose tissue sampled from control study subjects and from patients with obesity and increasing severity of MASLD. Created in BioRender. Pedersen, J. (2025) https://www.biorender.com/, accessed on 15 December 2024.
3. Results
Table 1 depicts the clinical characteristics of the three MASLD groups (LS−, n = 34; LS+, n = 20; and MASH, n = 16) and controls (CON, n = 9). The number of patients with T2DM in each group was three (LS−), seven (LS+), and nine (MASH). Insulin resistance evaluated by HOMA-IR was progressively worsened from CON to MASH of about four-fold. In the MASLD groups the BMI ranged from 41.8 to 44.6 kg/m2 compared with 24.4 kg/m2 in the CON group.

Table 1.
Clinical, anthropometrical, and biochemical data at baseline in study subjects with obesity undergoing bariatric surgery and stratified by histological MASLD severity (LS−, LS+, and MASH) and control study subjects without obesity (CON).
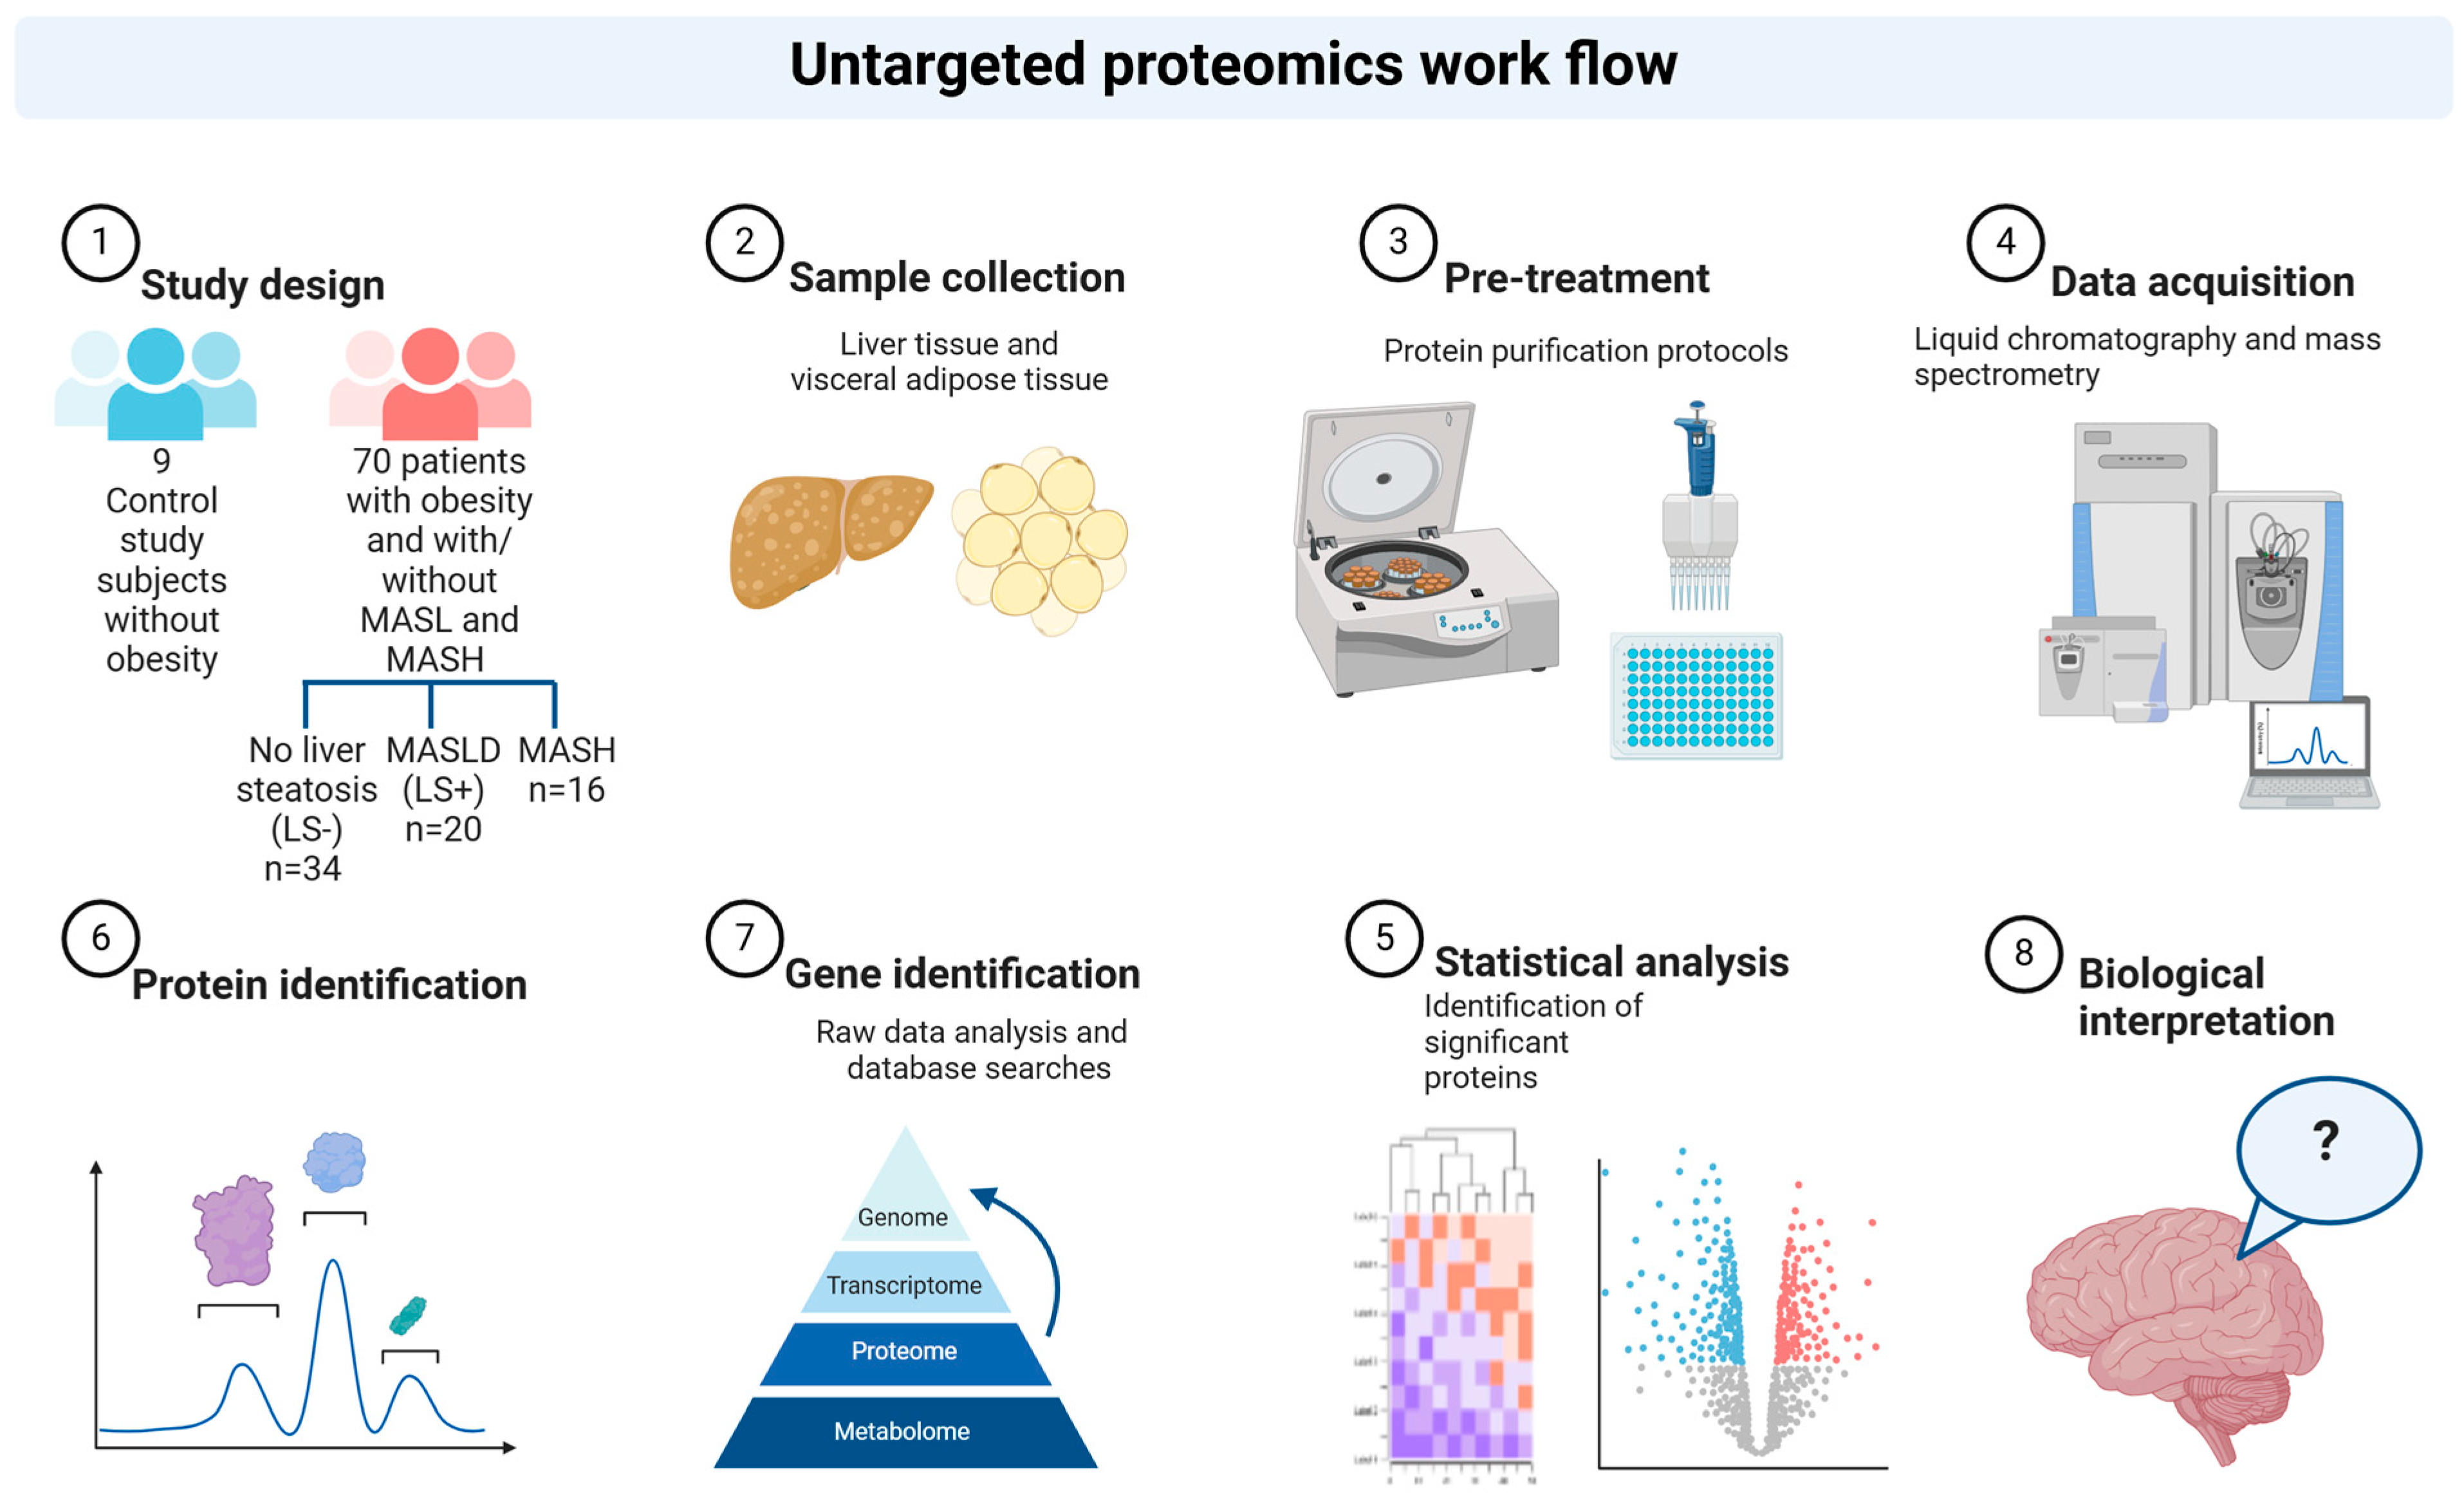
3.1. Liver Tissue
In liver tissue we detected 32 differentially expressed proteins (DEPs) with significant upregulation or downregulation between the four groups (Table 2 and Figure 2). Of these, 18 were upregulated, and 14 were downregulated in the MASLD groups when compared with CON.
Table 2.
Differentially expressed proteins in liver tissue in CON, LS−, LS+, and MASH identified by untargeted proteomics analyses.

Figure 2.
Heat map of significant liver proteins with increasing severity of histological MASLD. The heat map shows the 32 (out of 5151 liver protein groups in total) differentially expressed liver proteins (q value (FDR-adjusted p-value) < 0.05) in CON, LS−, LS+, and MASH. Eighteen proteins were generally upregulated (red color) in MASLD compared with CON, and 14 proteins were downregulated (blue color) in MASLD compared with CON. The specific log2 intensities of a given liver protein and the significance patterns between the four groups for a given protein can be found in Table 3. * q-value (FDR adjusted p-value) < 0.05 compared with CON. † q-value (FDR adjusted p-value) < 0.05 compared with LS−. Created in BioRender. Pedersen, J. (2025) https://BioRender.com/ori5dw6, accessed on 15 December 2024.
Six of the fourteen downregulated proteins and three of the eighteen upregulated proteins were “liver specific”, indicating an impaired synthesis of proteins in the liver
The DEPs were grouped primarily in three predominant significance patterns: (1) significant upregulation or downregulation in the MASLD groups (12 proteins) vs. CON with otherwise no significance among the four groups, (2) significant upregulation or downregulation between LS+ or MASH vs. CON and/or LS− (ten proteins), and (3) significant upregulation or downregulation between LS+ and MASH combined vs. CON and/or LS− (seven proteins).
Six proteins were significantly altered in the MASH group compared with LS+, LS−, and CON. One protein was upregulated (mevalonate kinase (MVK)), and five proteins were downregulated (hydroxysteroid 17-beta dehydrogenase 11 (HSD17B11), cyclin-dependent kinase inhibitor 1B (CDKN1B), death associated protein (DAP), methionine adenosyltransferase 1A (MAT1A), and VAMP associated protein A (VAPA)). Four proteins were significantly altered in the LS+ group compared with remaining groups; one was upregulated (archain 1 (ARCN1)), and three were downregulated (cytochrome P450 family 3 subfamily A member 4 (CYP3AB), sideroflexin-2 (SFXN2), and heat shock protein family A (Hsp70) member 1B (HSPA1B)).
3.2. Differentially Expressed Upregulated Liver Proteins (Table 2 and Figure 2)
Among the 18 upregulated proteins, 12 proteins showed the highest intensities in the MASH group, and 6 proteins showed the highest intensities in the LS+ group. None of the proteins expressed the highest intensity in the LS− group.
When we sorted the upregulated proteins according to their main biological functions, the “metabolism” group (proteins associated with primary cellular metabolic functions) comprised the highest number of proteins (eight seven proteins, including isocitrate dehydrogenase 2 (IDH2), Glycerol-3-phosphate dehydrogenase 1 (GPD1), OBG like ATPase 1 (OLA1), ACLY (ATP citrate lyase), (mevalonate kinase (MVK), 15-hydroxyprostaglandin dehydrogenase (HPGD), Perilipin 1 (PLIN1), and perilipin 2 (PLIN2)). As previously mentioned, MVK was the only upregulated DEP in MASH.
The perilipins (PLIN1 and PLIN2) coat lipid droplets and are otherwise known to be highly expressed in adipocytes [30]. Out of the 32 hepatic DEPs, PLIN1 and PLIN2 were the proteins with highest fold changes (around three), whereas PLIN1 was three-fold higher in LS+ and MASH compared with CON (q-value = 0.006); for PLIN2 this three-fold increase was observed between LS+/MASH and LS−, with no statistical significance when compared with CON.
Other liver proteins with significant upregulation were grouped as “intracellular transport proteins” (four proteins) and proteins related to the cytoskeleton, intracellular signal transduction, and extracellular matrix formation (five proteins). In the former group we found apolipoprotein 3 (APOL3), a lipid transporter which showed a 1- to 2.5-fold increase in the MASLD groups. Two proteins from the latter group, moesin (MSN) and radixin (RDX), were significantly upregulated in all three MASLD groups. Together with the protein “ezrin”, MSN and RDX were recognized as the “ezrin/radixin/Moesin (ERM) family” [31]. Last, tumor protein p53 inducible protein 3 (TP53I3) was a highly upregulated protein with tripled intensity in MASH and LS+ and doubled intensity in LS− when compared with CON.
3.3. Differentially Expressed Downregulated Liver Proteins (Table 2 and Figure 2)
Among the downregulated DEPs, 50% had the lowest intensities in MASH, and 50% had the lowest intensities in LS+. None of the downregulated proteins had the lowest intensities in LS−.
The largest groups of proteins (eight proteins; Glycerate kinase (GLYCKTK), Glyoxylate hydroxypyrovate dehydrogenase (GRHDR), GTP cyclohydrolase I feedback regulator (GCHFR), Methionine adenosyltransferase 1A (MAT1A), Adenosylhomocysteinase (ACHY), Hydroxysteroid 17-beta dehydrogenase 2 (HSD17B2), Hydroxysteroid 17-beta dehydrogenase 11 (HSD17B11), and Cytochrome P450 family 3 subfamily A member 4 (CYP3A4)) belonged to the “metabolism” group. GLYCKTK, which is involved in the catabolism of serine and the metabolism of fructose, was significantly downregulated in all three MASLD groups. CYP3A4 was significantly downregulated in LS+.
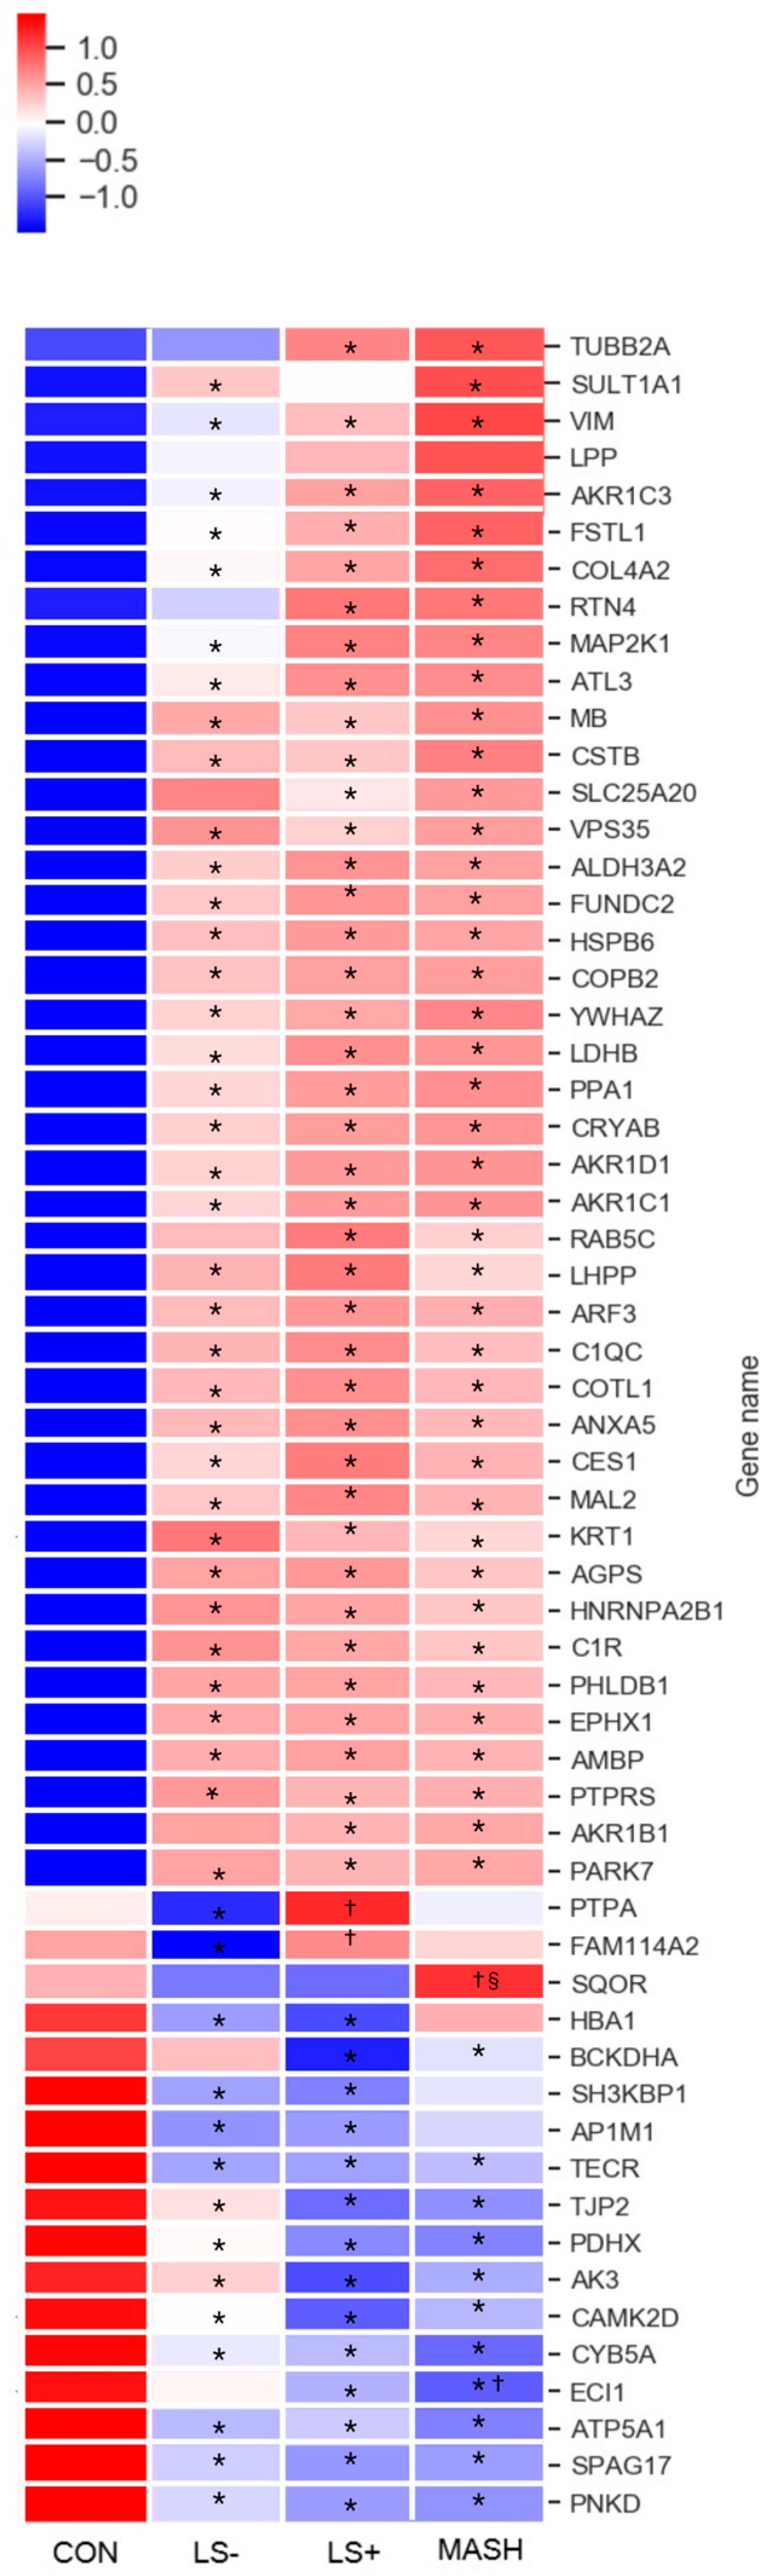
3.4. Visceral Adipose Tissue
In VAT we found 59 DEPs between the four groups (Table 3 and Figure 3). In VAT, 42 proteins (71%) were upregulated, and 17 proteins (29%) were significantly downregulated. Moreover, we observed considerable differences in protein intensities with up to 8.5-fold higher or lower intensities between groups (primarily CON vs. one or more of the MASLD groups) for specific proteins. Significant differences for a given DEP between the groups were predominantly observed between the MASLD groups collectively and CON (34 upregulated and 9 downregulated), followed by significance between MASH/LS+ and LS−/CON (4 upregulated and 2 downregulated) with the rest of the proteins (4 upregulated and 5 downregulated) showing other significance patterns.
Table 3.
Differentially expressed proteins in visceral adipose tissue identified by untargeted proteomics analysis in CON, LS−, LS+, and MASH.
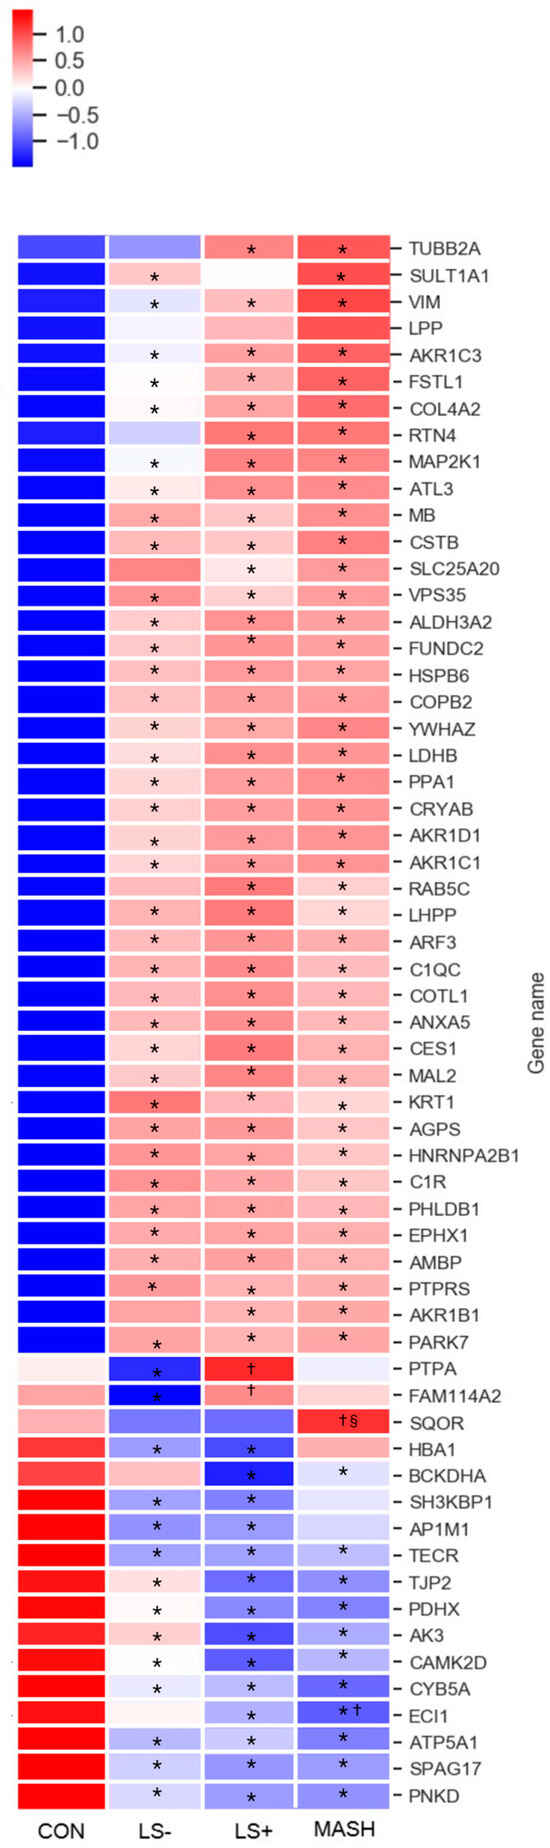
Figure 3.
Heat map of significant VAT proteins with increasing severity of histological MASLD. The heat map shows the 59 (out of 3200 VAT protein groups in total) differentially expressed VAT proteins (q-value (FDR adjusted p-value) < 0.05) in CON, LS−, LS+, and MASH. A total of 42 proteins were generally upregulated (red color) in MASLD compared with CON, and 17 proteins were downregulated (blue color) in MASLD compared with CON. The specific log2 intensities of a given VAT protein and the significance patterns between the four groups for a given protein can be found in Table 3. * q-value (FDR adjusted p-value) < 0.05 compared with CON, † q-value (FDR adjusted p-value) < 0.05 compared with LS−, § q-value (FDR adjusted p-value) < 0.05 compared with LS+. Created in BioRender. Pedersen, J. (2025) https://BioRender.com/nbub800, accessed on 15 December 2024.
Only a single protein, the mitochondrial sulfide:quinone oxidoreductase (SQOR), was exclusively
downregulated in MASH. LS+ had significant upregulation of the serine/threonine-protein phosphatase 2A activator (PTBA), a chaperone protein governing DNA repair and protein folding.
3.5. Differentially Expressed Upregulated VAT Proteins (Table 3 and Figure 3)
Upregulated proteins were grouped according to main function and are depicted in Table 3. Nine of the upregulated proteins were involved in lipid metabolism. Notably, four of these (hydroxysteroid dehydrogenase (AKR1C1), steroid 5β-reductase (AKR1D1), aldose reductase (AKR1B1), hydroxysteroid dehydrogenase (AKR1C3)) belonged to the aldo-keto reductase family.
We found upregulation of the complement system through complement C1 subcomponents C1r and C1q. They assembled with subcomponent C1s to form the C1 complex, which was the first component in the serum complement system and the activator of the classical (antigen–antibody) component pathway.
Other proteins with significant upregulation included intracellular signaling, cytoskeletal, and extracellular matrix proteins and proteins related to cell/organelle quality including several chaperones (heat shock protein beta-6 (HSPB6), crystallin alpha B (CRYAB), parkinsonism associated deglycase (PARK7), and coactosin-like protein (COTL1)). Of these, HSPB6 also functions as a stress sensor [32].
Notably, myoglobin (MB), a protein found primarily in muscle with excellent oxygen binding and reservoir capacities, showed prominent upregulation with four to six times higher expression in MASLD groups than CON. Last, several proteins aiding angiogenesis (e.g., tyrosin-3 monooxygenase (YWHAZ), reticulon 4 (RTN4), and heat shock protein beta-6 (HSPB6)) were upregulated in MASLD groups.
3.6. Differentially Expressed Downregulated VAT Proteins (Table 3 and Figure 3)
The 17 downregulated proteins were scattered over several groups.
Five proteins were mitochondrial proteins and included the ATP synthase subunit alpha (ATP5A1), which is one of the core components of the ATP synthase complex in the electron transport chain.
In addition, the mitochondrial 2-oxoisovalerate dehydrogenase subunit alpha (BCKHDA) was also significantly downregulated in LS+ and in MASH by two-fold compared with CON. BCKHDA is the alpha subunit of the decarboxylase component of the branched chain dehydrogenase (BCKD) complex that catalyzes the second and irreversible step in the catabolism of branched chain amino acids valine, leucine, and isoleucine.
3.7. Associations Between VAT and Liver Tissue in MASLD: Correlation Data (Table 4)
Table 4.
The 24 significant FDR-adjusted proteins by correlation analysis between VAT and liver tissue.
Twenty-four proteins correlated significantly between VAT and liver tissue (Table 4). Of these, 22 correlated positively, and 2 correlated negatively. The protein with the highest correlation coefficient was Hemoglobin subunit gamma-1 (HBG1), which is the gamma chain of fetal hemoglobin (α2γ2) (Pearson’s r = 0.71). Interestingly, angiotensinogen (AGT), the precursor of angiotensin, was the protein with the second-strongest correlation coefficient.
Four of the ten proteins with the highest correlation coefficients were related to the immune system; two were immunoglobulins (immunoglobulin heavy constant alpha 2 (IGHA2) and immunoglobulin heavy constant mu (IGHM)), and two belonged to the complement cascade, namely, complement C4-A (C4A) and complement C4-B (C4B). The latter two are the components of the complement component C4, a central component of the classically activated pathway in the complement cascade.
Ribosyldihydronicotinamide dehydrogenase [quinone] (NQO2), glutathione S-transferase theta-1 (GSTT1), and NAD(P)HX epimerase (NAXE), proteins with the third-, fourth-, and fifth-highest correlation coefficients, are all involved in oxidative defense, detoxification, and/or repair mechanisms.
4. Discussion
4.1. No Overlapping DEPs in VAT and Liver Tissue in Subjects with Obesity, MASLD, and MASH
This study presents a comprehensive human investigation analyzing the distinct protein signatures of the liver and VAT in 70 individuals with obesity and varying degrees of MASLD severity. It also explores the relationships between the proteomes of these two tissues. To our knowledge, this represents the largest human MASLD proteomics dataset to date featuring paired liver and VAT biopsies.
We initially hypothesized that certain proteins would be simultaneously and significantly upregulated or downregulated in both tissues; however, no such proteins were identified. We also found no evidence of a MASH-specific proteome in VAT.
These findings challenge our assumption of a unified proteomic signature linking VAT dysfunction with liver pathology in MASLD/MASH and our hypothesis that MASLD progression involves shared proteomic alterations across metabolic tissues such as VAT.
Overall, the protein expression patterns showed minimal differences between the MASLD groups. For instance, we did not find inflammatory proteins in VAT to be generally more upregulated in MASH than in LS+. Surprisingly, we found merely a single VAT protein, which was significantly upregulated in MASH only, namely, SQOR. SQOR catalyzes the primary step in the metabolism of hydrogen sulfide (H2S) within the mitochondria [33]. H2S is a gasotransmitter, which is toxic in high concentrations and at low concentrations acts cytoprotectively and is involved in many different biological functions including anti-inflammatory and proinflammatory abilities [34]. We can only speculate if SQOR is upregulated due to high H2S levels in the VAT of MASH patients, but due to the descriptive nature of this study we can draw no conclusions if this is, in fact, the case.
It is possible that the absence of overlapping DEPs may be due to the inherent heterogeneity between liver and adipose tissues as each exhibits tissue-specific metabolism and protein turnover. It is well established that certain proteins show strong tissue specificity (e.g., adipocytokines in VAT and albumin in the liver). In addition, there are indeed notable metabolic differences between the two tissues, such as the liver being a key site for protein degradation, where hepatocytes break down proteins into amino acids for various liver-specific metabolic pathways, but this study measured intact proteins rather than amino acids or degradation products. Therefore, our data reflect proteins actively synthesized in the tissue, representing gene expression through to translation. However, we cannot from this study determine the ultimate fate of individual proteins—whether they are secreted or rapidly degraded intracellularly.
Although tissue heterogeneity could partly explain the lack of overlapping DEPs between the liver and VAT, it does not explain the lack of a more distinct MASH-specific proteome in VAT. This may instead be attributed to the overall limitations of the study, which are discussed later, or it could be that MASH is not specifically represented in VAT, as the VAT proteome is instead overshadowed by the presence of obesity.
Based on the protein expression patterns, we generally observed the tendency of CON and LS− to group together and LS+ and MASH to group together or that the significance of a given protein (e.g., AKR1B1, SLC25A20, RTN4, BCKDHA, and ECI1) was found between LS+ and MASH vs. CON but not LS− vs. CON. Yet, the log2 intensities for the given protein were often still numerically much higher or lower in LS− compared with CON and thus may indicate a distinct biological difference—probably obesity—between these groups despite the absence of histological liver steatosis in both groups. The observed expression patterns in VAT therefore appear to reflect the metabolic deterioration that is associated with central obesity. The severity of MASLD is linked to the degree of metabolic dysregulation [35]. Our analyses were unable to determine if the observed differences reflected common risk factors or if there was a direct link between metabolic dysfunction in VAT and MASLD severity. Of note, among the included participants, those with MASH and LS+ were more likely to have T2DM, and they had a higher HOMA-IR and had higher levels of plasma liver enzymes. This was, however, not clearly reflected in the VAT DEPs.
Up until very recently [24,36], no human studies had specifically compared VAT and liver tissue proteomics in relation to MASLD severity. In the very recent study by Boel and colleagues [24], 58 liver and 27 VAT samples from an MASLD cohort similar to ours were available for analyses. However, the proteomics data were integrated with liver single-cell analyses and plasma proteomics analyses, making specific comparison with our findings difficult.
Castané et al. [36] performed proteomics analyses of liver and VAT in patients with MASH, but the analyses were also coupled with transcriptomics, plasma, and genetics. Yet, proteomics analyses were only applied in 18 VAT and liver tissue biopsies. Through enrichment analyses of proteomics and lipidomics, they found an association between MASH and mitochondrial dysfunction in VAT. We found similar downregulation of several mitochondrial proteins in VAT, which is discussed in more detail below.
4.2. Changes in the VAT Proteome in Obesity, T2DM, and MASLD
Numerous studies have explored the human obese VAT proteome in relation to T2DM [37,38,39], in metabolically healthy vs. unhealthy subjects with obesity [40], as well as differences between SAT and VAT from individuals with obesity [41]. Several of the other VAT upregulated DEPs found in our study have been identified in other human obesity/T2DM studies, e.g., annexin (ANXA5) [37,42], liver carboxyl esterase 1 (CES1) [42], Complement C1r C1QC [42], and myoglobin (MB) [43]. Moesin (MSN), which we found upregulated in the liver has similarly been found upregulated in VAT and SAT in subjects with obesity [37]. In addition, we found that C1QC, which is the c-chain of the human complement subcomponent C1q, was significantly upregulated in all three MASLD groups and pointed toward general upregulation of the completement cascade, which is an active innate immune response and promotes inflammation. It is difficult in interpret the latter finding as we have come across no studies for comparison. We also found upregulation of the perilipins PLIN1 and PLIN2 in the liver tissue but not in the VAT. PLIN1 is believed to function as a lipid droplet protector that modulates the action of the hormone sensitive lipase in adipose tissue and thus helps regulate lipid metabolism. In its absence, leanness is promoted at the expense of insulin resistance in PLIN1 knock-out mice [44]. PLIN1 and especially PLIN2 have previously been associated with the development of MASLD in rodent models and human [45,46].
We also note the relative “overrepresentation” of downregulated DEPs related to mitochondrial function and metabolism—e.g., BCKDHA, ATP5A1, PDHX, AK3, and SQOR, the latter being the single VAT DEP significant in MASH only. Prominent downregulation of mitochondrial proteins and proteins related to the respiratory machinery in obesity has recently been recognized in a diet-induced obesity mouse model [47] and in the study by Castañé et al. [36], but more systematic human data are lacking. Our finding of significant downregulation of BCKDHA is interesting as plasma levels of branched chain amino acids (leucine, isoleucine, and valine) have been reported to be increased in insulin resistant individuals with obesity. In addition, adipose tissue is recognized as an important site for BCAA catabolism [48]. Other studies have also reported significant downregulation in obese adipose tissue of the enzymes responsible for BCAA catabolism [49], including the branched chain ketoacid dehydrogenase complex (BCKDHC) of which the BCKDHA is a subunit and that catalyzes the irreversible catabolic step in BCAA breakdown.
4.3. Correlation Analyses Pinpoint Inflammatory and Detoxification Proteins
In the correlation analyses between VAT and liver, the top 10 positive correlations were dominated by inflammatory proteins and proteins involved in oxidative defense mechanisms and detoxification processes. This could point toward simultaneous upregulation and overlapping pathophysiology in the two tissues. It could be argued that the high abundance of secretory proteins (Table 4) among the proteins with high correlation scores represents “contamination” of plasma and blood vessels in the two tissues. However, we would then have expected to see high correlation scores of other plasma proteins with very high abundance in plasma, e.g., albumin or hemoglobin subunit A (normal hemoglobin). But this was not the case. Rather, the finding of IGHA2, IGHM, C4A, and C4B was probably reflective of synergy in intrahepatic and intra-adipose tissue antibody production as a systemic response to regulation of immune homeostasis and inflammation.
The protein with the highest correlation score was fetal hemoglobin gamma chain (HBG1). Under normal physiological conditions (except pregnancy), fetal hemoglobin only exists in very limited amounts in adults, comprising < 0.6% of total hemoglobin [50]. The synthesis of fetal hemoglobin, which has higher oxygen affinity than hemoglobin, is confined to a population of erythrocytes termed the F-cells [50]. The presence of HBG1 and the high correlation score of 0.717 between the two tissues can only be speculative as there are very limited data on adult fetal hemoglobin in conditions other than β-thalassemia and sickle cell anemia. Also, we have not investigated the specific intensities of HBG1 between MASLD groups and CON in VAT and liver. We can only speculate as to whether severe obesity and/or metabolic disease perhaps induce an increase in F-cell erythrocytes that are capable of producing hemoglobin gamma-chains. Further research into this finding is warranted.
4.4. Changes in the Liver Proteome in Relation to Obesity and MASLD
In the liver tissue we found a couple of DEPs that were upregulated or downregulated in MASH and LS+ exclusively, but it was difficult to conclude on any specific patterns as the DEPs were very heterogenous in both function and cellular compartment. However, we did observe a tendency of the upregulated proteins to be related to lipid and cholesterol metabolism (OLA1, ACLY, MVK, HPGD, APOL3, PLIN1, and PLIN2) and to cytoskeleton and ECM reorganization (COL18A1, RDX, and MSN). Upregulation of ECM proteins in MASLD has been recognized in a study by Yuan and colleagues, who analyzed the liver tissue proteome from 12 patients with obesity classified as metabolically healthy but with obesity and 44 patients with obesity and MASLD according to liver histology [23]. By gene ontology analysis, they furthermore report significant downregulation of mitochondrial oxidative phosphorylation through downregulation of components of the complex I (NADH dehydrogenase complex) and complex IV (cytochrome c oxidase) in MASLD subjects. In comparison, we found significant downregulation of complex III (CYC1), but this downregulation was equal in all MASLD groups compared with CON.
We have previously investigated the plasma proteome in a study cohort comprising 48 individuals with and without MASLD and liver cirrhosis and validated a promising panel of plasma proteins in a mouse model [18]. Among the promising proteins we found the polymeric immunoglobin receptor PIGR to be significantly upregulated in MASLD and to increase with increase in liver disease (individuals with obesity but without MASLD, T2DM with MASLD, and patients with cirrhosis). PIGR is a transmembrane glycoprotein, a Fc receptor, that enables transcytosis of immunoglobulins from the basolateral to the apical surface of epithelial cells, thus mediating the secretion of IgA and IgM [51]. We did not confirm the findings of upregulated PIGR in the present data in either liver or adipose tissue. However, we did discover MAL proteolipid protein 2 (MAL2) to be roughly eight-fold increased in all three MASLD groups compared with CON. MAL2 was the protein showing the biggest difference in intensities between groups. This is interesting because MAL2 is an essential component of the transcytotic machinery [52,53] and has previously been implicated in PIGR-mediated transcytosis, where depletion of MAL2 blocked polymeric immunoglobulin receptor transcytosis in liver cells (the hep g2 cell line) [52]. Although data derived from cell lines should be evaluated with some caution, the potential association between MAL2 in VAT and PIGR found in plasma in two different MASLD cohorts is still noteworthy. Adding to this notion, the proteins with the second and the sixth strongest correlations between VAT and liver tissue were the heavy chains of precisely IgA and IgM (IGHA2 and IGHM, respectively).
4.5. Strengths and Limitations
We wanted to explore potential overlapping DEPs in MASH between VAT and liver and to characterize the VAT proteome in MASH. The rationale was to assess common pathophysiological traits in the two tissues. However, this exploratory approach has limitations, which may hinder the true answer(s) to the hypotheses. In addition, as this is a descriptive, cross-sectional study, no causal associations can be made. By stratifying the study cohort based on liver histology and applying one-way ANOVA, we may also have missed interesting and significant proteins.
There are also some inherent drawbacks in proteomics studies in general. For instance, the generated data depend on the subjective threshold set for DEPs. In addition, the analysis discards most of the proteins and as a result focuses on the significant DEPs, which comprise only <0.1% of the analyzed total proteome in the respective tissues. Furthermore, by filtering for 70% (meaning that only proteins that are detectable in 70% of the samples enter the analysis), there is an inherent risk of filtering out proteins that were indeed significant in one group only. We may therefore have missed important proteins in one or more of the groups. Finally, the grouping of the study subjects according to the histopathological MASLD severity may pinpoint the weaknesses of the NAFLD activity score as we observe very little difference in protein expression between the MASLD groups, particularly between LS+ and MASH.
Proteomics studies and the generated data herein are in general difficult to compare due to significant heterogeneity in endpoints, grouping, analytical methodology (e.g., targeted vs. untargeted approach), and data acquisition (use of FDR and considerations regarding significance). In addition, many studies have very low values of n, down to 4 per group [39], but typically, n is around 10 per group. In comparison, our cohort consisted of 79 study subjects, and the applied LC-MS analyses performed were of very high quality and robustness.
5. Conclusions
This study represents the largest human investigation to date evaluating the proteome profiles of visceral adipose tissue (VAT) and liver tissue in individuals with obesity, MASLD, and MASH. Contrary to our hypothesis, we did not identify overlapping DEPs between VAT and liver tissue, nor did we find a VAT-specific proteomic signature that clearly distinguished MASLD severity. Instead, the proteomic patterns in VAT appeared to reflect metabolic dysfunction associated with obesity rather than MASLD progression. Notably, while some inflammatory and metabolic proteins showed significant correlations between VAT and liver, these did not translate into a unified proteomic profile linking the two tissues in MASLD pathology. The identification of proteins such as SQOR and MAL2 raises interesting mechanistic questions, particularly in relation to mitochondrial function and immune regulation, warranting further investigation. Given the heterogeneity of proteomic findings across MASLD groups and the potential influence of methodological constraints, future studies with refined proteomic analyses and larger, more targeted cohorts will be critical for uncovering definitive biomarkers and elucidating the complex metabolic interplay between VAT and liver in MASLD and MASH progression.
Author Contributions
Conceptualization, J.S.P. and N.J.W.A.; formal analysis, J.S.P. and L.N.; funding acquisition, T.H. and F.B.; investigation, J.S.P., V.B.K., I.M.P. and R.R.S.; methodology, J.S.P., L.N., V.B.K., R.R.S., L.L.G. and F.B.; project administration, J.S.P., T.H. and F.B.; resources, L.L.G. and F.B.; software, L.N. and N.J.W.A.; supervision, T.H., L.L.G., S.M. and F.B.; validation, L.N. and N.J.W.A.; visualization, L.N.; writing—original draft, J.S.P.; writing—review and editing, J.S.P., L.N., N.J.W.A., V.B.K., I.M.P., R.R.S., T.H., L.L.G., S.M. and F.B. All authors have read and agreed to the published version of the manuscript.
Funding
This research was funded by a Challenge Grant “MicroBLiver” (grant number NNF15OC0016692) from the Novo Nordisk Foundation.
Institutional Review Board Statement
The study protocols were approved by the Regional Scientific Ethics Committee (H-16030784 and H-16030782) in the Capital Region of Denmark and the Danish Data Protection Agency.
Informed Consent Statement
The study was conducted in accordance with the Declaration of Helsinki. Oral and written informed consent were obtained from all study participants.
Data Availability Statement
The data presented in this study are available on request from the corresponding author. The data are not publicly available due to restrictions set by the Danish Data Protection Agency.
Acknowledgments
We would like to thank the MicroBLiver Research Consortium and project nurse Karen Lisa Hilsted.
Conflicts of Interest
The authors declare no conflicts of interest.
References
- Rosen, E.D.; Spiegelman, B.M. What We Talk About When We Talk About Fat. Cell 2014, 156, 20–44. [Google Scholar] [CrossRef]
- Ohlson, L.-O.; Larsson, B.; Svärdsudd, K.; Welin, L.; Eriksson, H.; Wilhelmsen, L.; Björntorp, P.; Tibblin, G. The Influence of Body Fat Distribution on the Incidence of Diabetes Mellitus: 13.5 Years of Follow-up of the Participants in the Study of Men Born in 1913. Diabetes 1985, 34, 1055–1058. [Google Scholar] [CrossRef]
- Nielsen, S.; Guo, Z.; Johnson, C.M.; Hensrud, D.D.; Jensen, M.D. Splanchnic lipolysis in human obesity. J. Clin. Investig. 2004, 113, 1582–1588. [Google Scholar] [CrossRef] [PubMed]
- Tilg, H.; Moschen, A.R. Adipocytokines: Mediators linking adipose tissue, inflammation and immunity. Nat. Rev. Immunol. 2006, 6, 772–783. [Google Scholar] [CrossRef] [PubMed]
- Fontana, L.; Eagon, J.C.; Trujillo, M.E.; Scherer, P.E.; Klein, S. Visceral Fat Adipokine Secretion Is Associated with Systemic Inflammation in Obese Humans. Diabetes 2007, 56, 1010–1013. [Google Scholar] [CrossRef] [PubMed]
- Eckel, R.H.; Grundy, S.M.; Zimmet, P.Z. The metabolic syndrome. Lancet 2005, 365, 1415–1428. [Google Scholar] [CrossRef]
- Vanni, E.; Bugianesi, E.; Kotronen, A.; De Minicis, S.; Yki-Järvinen, H.; Svegliati-Baroni, G. From the metabolic syndrome to NAFLD or vice versa? Dig. Liver Dis. 2010, 42, 320–330. [Google Scholar] [CrossRef]
- Yki-Järvinen, H. Non-alcoholic fatty liver disease as a cause and a consequence of metabolic syndrome. Lancet Diabetes Endocrinol. 2014, 2, 901–910. [Google Scholar] [CrossRef]
- Hotamisligil, G.S.; Shargill, N.S.; Spiegelman, B.M. Adipose expression of tumor necrosis factor-alpha: Direct role in obesity-linked insulin resistance. Science 1993, 259, 87–91. [Google Scholar] [CrossRef]
- Sun, K.; Kusminski, C.M.; Scherer, P.E. Adipose tissue remodeling and obesity. J. Clin. Investig. 2011, 121, 2094–2101. [Google Scholar] [CrossRef]
- Goossens, G.H. The role of adipose tissue dysfunction in the pathogenesis of obesity-related insulin resistance. Physiol. Behav. 2008, 94, 206–218. [Google Scholar] [CrossRef]
- Xu, H.; Barnes, G.T.; Yang, Q.; Tan, G.; Yang, D.; Chou, C.J.; Sole, J.; Nichols, A.; Ross, J.S.; Tartaglia, L.A.; et al. Chronic inflammation in fat plays a crucial role in the development of obesity-related insulin resistance. J. Clin. Investig. 2003, 112, 1821–1830. [Google Scholar] [CrossRef] [PubMed]
- Weisberg, S.P.; McCann, D.; Desai, M.; Rosenbaum, M.; Leibel, R.L.; Ferrante, A.W. Obesity is associated with macrophage accumulation in adipose tissue. J. Clin. Investig. 2003, 112, 1796–1808. [Google Scholar] [CrossRef]
- Younossi, Z.M.; Blissett, D.; Blissett, R.; Henry, L.; Stepanova, M.; Younossi, Y.; Racila, A.; Hunt, S.; Beckerman, R. The economic and clinical burden of nonalcoholic fatty liver disease in the United States and Europe. Hepatology 2016, 64, 1577–1586. [Google Scholar] [CrossRef] [PubMed]
- Item, F.; Konrad, D. Visceral fat and metabolic inflammation: The portal theory revisited: Visceral fat and metabolic inflammation. Obes. Rev. 2012, 13, 30–39. [Google Scholar] [CrossRef]
- Arderiu, G.; Mendieta, G.; Gallinat, A.; Lambert, C.; Díez-Caballero, A.; Ballesta, C.; Badimon, L. Type 2 Diabetes in Obesity: A Systems Biology Study on Serum and Adipose Tissue Proteomic Profiles. Int. J. Mol. Sci. 2023, 24, 827. [Google Scholar] [CrossRef]
- Chen, Z.-Z.; Gao, Y.; Keyes, M.J.; Deng, S.; Mi, M.; Farrell, L.A.; Shen, D.; Tahir, U.A.; Cruz, D.E.; Ngo, D.; et al. Protein Markers of Diabetes Discovered in an African American Cohort. Diabetes 2023, 72, 532–543. [Google Scholar] [CrossRef]
- Niu, L.; Geyer, P.E.; Wewer Albrechtsen, N.J.; Gluud, L.L.; Santos, A.; Doll, S.; Treit, P.V.; Holst, J.J.; Knop, F.K.; Vilsbøll, T.; et al. Plasma proteome profiling discovers novel proteins associated with non-alcoholic fatty liver disease. Mol. Syst. Biol. 2019, 15, e8793. [Google Scholar] [CrossRef]
- Sanyal, A.J.; Williams, S.A.; Lavine, J.E.; Neuschwander-Tetri, B.A.; Alexander, L.; Ostroff, R.; Biegel, H.; Kowdley, K.V.; Chalasani, N.; Dasarathy, S.; et al. Defining the serum proteomic signature of hepatic steatosis, inflammation, ballooning and fibrosis in non-alcoholic fatty liver disease. J. Hepatol. 2023, 78, 693–703. [Google Scholar] [CrossRef]
- Bell, L.N.; Theodorakis, J.L.; Vuppalanchi, R.; Saxena, R.; Bemis, K.G.; Wang, M.; Chalasani, N. Serum proteomics and biomarker discovery across the spectrum of nonalcoholic fatty liver disease. Hepatology 2010, 51, 111–120. [Google Scholar] [CrossRef]
- Govaere, O.; Hasoon, M.; Alexander, L.; Cockell, S.; Tiniakos, D.; Ekstedt, M.; Schattenberg, J.M.; Boursier, J.; Bugianesi, E.; Ratziu, V.; et al. A proteo-transcriptomic map of non-alcoholic fatty liver disease signatures. Nat. Metab. 2023, 5, 572–578. [Google Scholar] [CrossRef] [PubMed]
- Luo, Y.; Wadhawan, S.; Greenfield, A.; Decato, B.E.; Oseini, A.M.; Collen, R.; Shevell, D.E.; Thompson, J.; Jarai, G.; Charles, E.D.; et al. SOMAscan Proteomics Identifies Serum Biomarkers Associated with Liver Fibrosis in Patients With NASH. Hepatol. Commun. 2021, 5, 760–773. [Google Scholar] [CrossRef] [PubMed]
- Yuan, X.; Sun, Y.; Cheng, Q.; Hu, K.; Ye, J.; Zhao, Y.; Wu, J.; Shao, X.; Fang, L.; Ding, Y.; et al. Proteomic analysis to identify differentially expressed proteins between subjects with metabolic healthy obesity and non-alcoholic fatty liver disease. J. Proteomics 2020, 221, 103683. [Google Scholar] [CrossRef]
- Boel, F.; Akimov, V.; Teuchler, M.; Terkelsen, M.K.; Wernberg, C.W.; Larsen, F.T.; Hallenborg, P.; Lauridsen, M.M.; Krag, A.; Mandrup, S.; et al. Deep proteome profiling of metabolic dysfunction-associated steatotic liver disease. Commun. Med. 2025, 5, 56. [Google Scholar] [CrossRef]
- Kakehashi, A.; Stefanov, V.E.; Ishii, N.; Okuno, T.; Fujii, H.; Kawai, K.; Kawada, N.; Wanibuchi, H. Proteome Characteristics of Non-Alcoholic Steatohepatitis Liver Tissue and Associated Hepatocellular Carcinomas. Int. J. Mol. Sci. 2017, 18, 434. [Google Scholar] [CrossRef]
- Nakamura, N.; Hatano, E.; Iguchi, K.; Sato, M.; Kawaguchi, H.; Ohtsu, I.; Sakurai, T.; Aizawa, N.; Iijima, H.; Nishiguchi, S.; et al. Elevated levels of circulating ITIH4 are associated with hepatocellular carcinoma with nonalcoholic fatty liver disease: From pig model to human study. BMC Cancer 2019, 19, 621. [Google Scholar] [CrossRef] [PubMed]
- Younossi, Z.M.; Karrar, A.; Pierobon, M.; Birerdinc, A.; Stepanova, M.; Abdelatif, D.; Younoszai, Z.; Jeffers, T.; Felix, S.; Jeiran, K.; et al. An exploratory study examining how nano-liquid chromatography–mass spectrometry and phosphoproteomics can differentiate patients with advanced fibrosis and higher percentage collagen in non-alcoholic fatty liver disease. BMC Med. 2018, 16, 170. [Google Scholar] [CrossRef]
- Wichmann, C.; Meier, F.; Virreira Winter, S.; Brunner, A.-D.; Cox, J.; Mann, M. MaxQuant.Live Enables Global Targeting of More Than 25,000 Peptides. Mol. Cell. Proteomics MCP 2019, 18, 982–994. [Google Scholar] [CrossRef]
- Grinfeld, D.; Aizikov, K.; Kreutzmann, A.; Damoc, E.; Makarov, A. Phase-Constrained Spectrum Deconvolution for Fourier Transform Mass Spectrometry. Anal. Chem. 2017, 89, 1202–1211. [Google Scholar] [CrossRef]
- Greenberg, A.S.; Egan, J.J.; Wek, S.A.; Garty, N.B.; Blanchette-Mackie, E.J.; Londos, C. Perilipin, a major hormonally regulated adipocyte-specific phosphoprotein associated with the periphery of lipid storage droplets. J. Biol. Chem. 1991, 266, 11341–11346. [Google Scholar] [CrossRef]
- Karvar, S.; Ansa-Addo, E.A.; Suda, J.; Singh, S.; Zhu, L.; Li, Z.; Rockey, D.C. Moesin, an Ezrin/Radixin/Moesin Family Member, Regulates Hepatic Fibrosis. Hepatology 2019, 72, 1073–1084. [Google Scholar] [CrossRef] [PubMed]
- Li, F.; Xiao, H.; Zhou, F.; Hu, Z.; Yang, B. Study of HSPB6: Insights into the Properties of the Multifunctional Protective Agent. Cell. Physiol. Biochem. 2017, 44, 314–332. [Google Scholar] [CrossRef]
- Jackson, M.R.; Melideo, S.L.; Jorns, M.S. Human sulfide: Quinone oxidoreductase catalyzes the first step in hydrogen sulfide metabolism and produces a sulfane sulfur metabolite. Biochemistry 2012, 51, 6804–6815. [Google Scholar] [CrossRef]
- Paul, B.D.; Snyder, S.H. H2S: A novel gasotransmitter that signals by sulfhydration. Trends Biochem. Sci. 2015, 40, 687. [Google Scholar] [CrossRef]
- Younossi, Z.M.; Koenig, A.B.; Abdelatif, D.; Fazel, Y.; Henry, L.; Wymer, M. Global epidemiology of nonalcoholic fatty liver disease—Meta-analytic assessment of prevalence, incidence, and outcomes. Hepatology 2016, 64, 73–84. [Google Scholar] [CrossRef]
- Castañé, H.; Jiménez-Franco, A.; Hernández-Aguilera, A.; Martínez-Navidad, C.; Cambra-Cortés, V.; Onoiu, A.-I.; Jiménez-Aguilar, J.M.; París, M.; Hernández, M.; Parada, D.; et al. Multi-omics profiling reveals altered mitochondrial metabolism in adipose tissue from patients with metabolic dysfunction-associated steatohepatitis. eBioMedicine 2025, 111, 105532. [Google Scholar] [CrossRef] [PubMed]
- Fang, L.; Kojima, K.; Zhou, L.; Crossman, D.K.; Mobley, J.A.; Grams, J. Analysis of the Human Proteome in Subcutaneous and Visceral Fat Depots in Diabetic and Non-diabetic Patients with Morbid Obesity. J. Proteomics Bioinform. 2015, 8, 133–141. [Google Scholar] [CrossRef] [PubMed]
- Kim, S.-J.; Chae, S.; Kim, H.; Mun, D.-G.; Back, S.; Choi, H.Y.; Park, K.S.; Hwang, D.; Choi, S.H.; Lee, S.-W. A Protein Profile of Visceral Adipose Tissues Linked to Early Pathogenesis of Type 2 Diabetes Mellitus. Mol. Cell. Proteomics MCP 2014, 13, 811–822. [Google Scholar] [CrossRef]
- Gómez-Serrano, M.; Camafeita, E.; García-Santos, E.; López, J.A.; Rubio, M.A.; Sánchez-Pernaute, A.; Torres, A.; Vázquez, J.; Peral, B. Proteome-wide alterations on adipose tissue from obese patients as age-, diabetes- and gender-specific hallmarks. Sci. Rep. 2016, 6, 25756. [Google Scholar] [CrossRef]
- Alfadda, A.A.; Masood, A.; Al-Naami, M.Y.; Chaurand, P.; Benabdelkamel, H. A Proteomics Based Approach Reveals Differential Regulation of Visceral Adipose Tissue Proteins between Metabolically Healthy and Unhealthy Obese Patients. Mol. Cells 2017, 40, 685–695. [Google Scholar] [CrossRef]
- Insenser, M.; Montes-Nieto, R.; Vilarrasa, N.; Lecube, A.; Simó, R.; Vendrell, J.; Escobar-Morreale, H.F. A nontargeted proteomic approach to the study of visceral and subcutaneous adipose tissue in human obesity. Mol. Cell. Endocrinol. 2012, 363, 10–19. [Google Scholar] [CrossRef] [PubMed]
- Murri, M.; Insenser, M.; Bernal-Lopez, M.R.; Perez-Martinez, P.; Escobar-Morreale, H.F.; Tinahones, F.J. Proteomic analysis of visceral adipose tissue in pre-obese patients with type 2 diabetes. Mol. Cell. Endocrinol. 2013, 376, 99–106. [Google Scholar] [CrossRef]
- Shang, C.; Sun, W.; Wang, C.; Wang, X.; Zhu, H.; Wang, L.; Yang, H.; Wang, X.; Gong, F.; Pan, H. Comparative Proteomic Analysis of Visceral Adipose Tissue in Morbidly Obese and Normal Weight Chinese Women. Int. J. Endocrinol. 2019, 2019, 2302753. [Google Scholar] [CrossRef] [PubMed]
- Tansey, J.T.; Sztalryd, C.; Gruia-Gray, J.; Roush, D.L.; Zee, J.V.; Gavrilova, O.; Reitman, M.L.; Deng, C.X.; Li, C.; Kimmel, A.R.; et al. Perilipin ablation results in a lean mouse with aberrant adipocyte lipolysis, enhanced leptin production, and resistance to diet-induced obesity. Proc. Natl. Acad. Sci. USA 2001, 98, 6494–6499. [Google Scholar] [CrossRef]
- Orlicky, D.J.; Libby, A.E.; Bales, E.S.; McMahan, R.H.; Monks, J.; Rosa, F.G.; McManaman, J.L. Perilipin-2 promotes obesity and progressive fatty liver disease in mice through mechanistically distinct hepatocyte and extra-hepatocyte actions. J. Physiol. 2019, 597, 1565–1584. [Google Scholar] [CrossRef]
- Straub, B.K.; Stoeffel, P.; Heid, H.; Zimbelmann, R.; Schirmacher, P. Differential pattern of lipid droplet-associated proteins and de novo perilipin expression in hepatocyte steatogenesis. Hepatology 2008, 47, 1936–1946. [Google Scholar] [CrossRef]
- Schöttl, T.; Pachl, F.; Giesbertz, P.; Daniel, H.; Kuster, B.; Fromme, T.; Klingenspor, M. Proteomic and Metabolite Profiling Reveals Profound Structural and Metabolic Reorganization of Adipocyte Mitochondria in Obesity. Obesity 2020, 28, 590–600. [Google Scholar] [CrossRef] [PubMed]
- Newgard, C.B.; An, J.; Bain, J.R.; Muehlbauer, M.J.; Stevens, R.D.; Lien, L.F.; Haqq, A.M.; Shah, S.H.; Arlotto, M.; Slentz, C.A.; et al. A Branched-Chain Amino Acid-Related Metabolic Signature that Differentiates Obese and Lean Humans and Contributes to Insulin Resistance. Cell Metab. 2009, 9, 311–326. [Google Scholar] [CrossRef]
- She, P.; Van Horn, C.; Reid, T.; Hutson, S.M.; Cooney, R.N.; Lynch, C.J. Obesity-related elevations in plasma leucine are associated with alterations in enzymes involved in branched chain amino acid (BCAA) metabolism. Am. J. Physiol. Endocrinol. Metab. 2007, 293, E1552–E1563. [Google Scholar] [CrossRef]
- Rochette, J.; Craig, J.E.; Thein, S.L.; Rochette, J. Fetal hemoglobin levels in adults. Blood Rev. 1994, 8, 213–224. [Google Scholar] [CrossRef]
- Brandtzaeg, P. Transport models for secretory IgA and secretory IgM. Clin. Exp. Immunol. 1981, 44, 221–232. [Google Scholar] [PubMed]
- De Marco, M.C.; Martín-Belmonte, F.; Kremer, L.; Albar, J.P.; Correas, I.; Vaerman, J.P.; Marazuela, M.; Byrne, J.A.; Alonso, M.A. MAL2, a novel raft protein of the MAL family, is an essential component of the machinery for transcytosis in hepatoma HepG2 cells. J. Cell Biol. 2002, 159, 37–44. [Google Scholar] [CrossRef] [PubMed]
- De Marco, M.C.; Puertollano, R.; Martínez-Menárguez, J.A.; Alonso, M.A. Dynamics of MAL2 during glycosylphosphatidylinositol-anchored protein transcytotic transport to the apical surface of hepatoma HepG2 cells. Traffic Cph. Den. 2006, 7, 61–73. [Google Scholar] [CrossRef] [PubMed]
Disclaimer/Publisher’s Note: The statements, opinions and data contained in all publications are solely those of the individual author(s) and contributor(s) and not of MDPI and/or the editor(s). MDPI and/or the editor(s) disclaim responsibility for any injury to people or property resulting from any ideas, methods, instructions or products referred to in the content. |
© 2025 by the authors. Licensee MDPI, Basel, Switzerland. This article is an open access article distributed under the terms and conditions of the Creative Commons Attribution (CC BY) license (https://creativecommons.org/licenses/by/4.0/).