Article

The 863C>A and 1031T>C Single Nucleotide Polymorphisms (SNPs) in the Tumor Necrosis Factor Alpha (TNF-α) Promoter Gene May Not Be Putative Predictors of HBV Endemicity

1
Department of Microbiology, College of Health Sciences, Makerere University, Kampala P.O. Box 7062, Uganda
2
Department of Medical Microbiology, Habib Medical School, Faculty of Health Sciences, Islamic University in Uganda, Kampala P.O. Box 7689, Uganda
3
Department of Plant Sciences, Microbiology and Biotechnology, College of Natural Sciences, Makerere University, Kampala P.O. Box 7062, Uganda
4
Department of medicine, College of Health Sciences, Makerere University, Kampala P.O. Box 7062, Uganda
5
Department of Biomolecular Resources & Biolab Sciences (BBS), College of Veterinary Medicine, Animal Resources and Biosecurity (COVAB), Makerere University, Kampala P.O. Box 7062, Uganda
6
Department of Molecular Biology and Immunology, College of Health Sciences, Makerere University, Kampala P.O. Box 7062, Uganda
7
Department of Physiology, Habib Medical School, Faculty of Health Sciences, Islamic University in Uganda, Kampala P.O. Box 7689, Uganda
8
Department of Biological Sciences, Faculty of Science, Islamic University in Uganda, Mbale P.O. Box 2555, Uganda
*
Author to whom correspondence should be addressed.
Livers 2023, 3(4), 545-561; https://doi.org/10.3390/livers3040037
Submission received: 12 August 2023 / Revised: 4 September 2023 / Accepted: 5 September 2023 / Published: 22 September 2023

Abstract

:
Background: Genetic polymorphisms within the gene loci of the promoter region of tumor necrosis factor (TNF) alpha have been associated with the pathogenesis of hepatitis B virus (HBV) infection. In Uganda, there is a wide variation in the HBV endemicity, ranging from low endemicity, through moderate endemicity, to hyper-endemicity. However, the underlying reasons for this disparity in HBV burden are not fully elucidated. Thus, we aimed to test the hypothesis that the TNF-α-863C/A and -1031T/C polymorphic sites may have an effect on the difference between the burden of HBV in our country. We screened 384 participants, from which a sample of 134 was drawn, to determine the HBV, TNF-α-863C/A, and TNF-α-863T/C genotypes. The nucleotide BLAST was used to match the unknown targeted sequence obtained from the Sanger sequence against the known deposited sequence. This process unveiled the base substitution mutation and the HBV genotypes. The odds ratio (OR) and Chi-square test of proportions were used for the analysis. All the analyses were performed using SPSS version 26.0 and MedCalc software version 20.010 at 95% CI. A p < 0.05 was considered statistically significant. Results: The prevalence of both the TNF-α-863C/A and the TNF-α-1031T/C genotypes and their alleles did not differ significantly by endemicity (p > 0.05). However, the prevalence of the nucleotide substitution mutations for TNF-α-863C>A and TNF-α-1031T>C was significantly low for all the study groups (p < 0.05). Conclusion: The TNF-α gene promoter at the TNF-α-863C/A and 1031T/C positions is conserved in our population and may not affect the endemicity of HBV infection. However, future research should focus on the use of nationwide samples in order to reach concreate determinations regarding the role of the TNF-α polymorphisms in the risk/resolution of HBV infections in an African or Black population.

1. Introduction

The susceptibility to infection and the clinical profile during HBV infection varies according to individual, population and region [1]. Consequently, the risk of infection, the clearance of the infection, the severity of the infection and the progression to chronic infection differs among individuals, communities, populations, ethnicities, and races [2,3]. These differences partly originate from genetic differences at the loci of the promoter regions of the immune modulatory molecules including the tumor necrosis factor (TNF)-α.
The influence of the TNF-α gene promoter polymorphisms on the persistence or clearance of HBV has been reported in various populations such as the Chinese, Indians, Iranians, and the Egyptians. For example, Xia et al. [2] and Zhang et al. [3], in their systematic review and meta-analyses of case control studies, reported that the TNF-α gene may be associated with either the clearance or persistence of the HBV infection, depending on the single nucleotide substitution mutation and its location within the promoter region of the gene. Consistent reports have been provided in case control studies by Panigrahi et al. [4], among Indians; Azar et al. [5], among Iranians; and Talaat et al. [6], among Egyptians.
The TNF-α is an inflammatory cytokine which is upregulated following HBV infection [5]. The effects of the upregulation of TNF-α have been associated with both poor and good prognosis during HBV infection. For example, poor prognosis has seen due to the acceleration of liver cirrhosis [7,8], as well as in the expression levels of the major histocompatibility complex (MHC) class II molecules, which has an effect on the hepatitis B viral antigen presentation [9]. In contrast, good prognosis has been observed in the inhibition of both the transcription of the HBV core promoter gene and HBV replication in the liver, inducing viral clearance [10]. Furthermore, TNF-α has been reported to induce the production of reactive oxygen species and free radicals. This leads to oxidative stress, implicated in accelerating mutations and chromosomal aberrations that lead to hepatocellular carcinoma (HCC) progression among persons chronically infected with HBV [11].
The expression of TNF-α is tightly regulated at both the transcriptional and post-transcriptional levels and is under the control of the genes within the promoter region [12]. Therefore, any polymorphisms within this region alter the expression levels of TNF-α. This, in turn, will affect its effector mechanism [13]. Moreover, failure to express adequate amounts of TNF-α has been shown to influence the process of HBV chronicity in experimental models [14].
Several single nucleotide polymorphic sites located within the promoter region of the TNF-α gene have been highlighted. These include: -163G/A, -238G/A, -244A/G, -308G/A, -376G/A, -575A/G, -857C/T, -863C/A, -1031T/C, -1125G/C, and -1196C/T, located downstream of the transcription initiation site [3,15,16]. Among these, the TNF-α-863C/A and 1031TT/C gene loci have been well studied, and their role in the risk of HBV infection [3,4,17,18] has been highlighted [2,3,19]. Furthermore, Shin et al. [20] observed an increased number of survival years post-HBV HCC treatment among those with the TNF-α-1031TT wild-type genotype compared to those with the TNF-α-1031CC mutant genotype. In contrast, Xia et al. [2] did not observe any association between the TNF-α-1031TT wild-type genotype and the risk of HBV infection or resolution of the infection. Additionally, the recent meta-analysis by our research team has shown that TNF-α-863C/A and -1031T/C may be putative markers of HBV disease prognosis among Caucasians [21]. However, the TNF-α-1031TT wild-type genotype has been significantly associated with protection against HBV infection or resolution of the infection [21]. Other diseases implicated in regards to TNF-α-1031T/C polymorphisms include polycystic ovary syndrome [22] and endometriosis [23].
Although the results are controversial, as highlighted by the previous studies taken from the literature, the effector mechanism of TNF-α-863 C/A SNPs is thought to act by influencing the expression levels of the TNF-α gene. For example, Higuchi et al. [24] and Soga et al. [25] observed increased expression levels, while Yang et al. [26] and Laddha et al. [27] reported decreased expression levels. At the molecular level, TNF-α-863 C/A was shown by Skoog et al. [28] to influence the binding of the nuclear proteins to the promoter region of the TNF-α gene, which in turn affects the expression levels of the gene causing variations in the plasma concentrations of TNF-α.
Unfortunately, the data regarding the role of TNF-α-863C/A and TNF-α-1031T/C in the prognosis of HBV infection among Blacks is limited. Therefore, our study aimed at establishing the effect of the TNF-α-863C>A and TNF-α-1031T>C single nucleotide substitution mutations in influencing the risk of HBV infection. This was achieved by comparing the prevalence of the TNF-α-863C>A and TNF-α-1031T>C single nucleotide mutations among the HBsAg seronegative and the HBsAg seropositive study participants from the low and high endemic regions of Uganda. The findings of the study will guide future research in establishing a plausible explanation for the differences in the endemicity of the virus in our country. Most importantly, our results will inform health care providers when designing interventions that can bridge the HBV endemicity gap in Uganda. This will provide a cornerstone in the journey towards the elimination of the virus by 2030, as highlighted by the United Nations Sustainable Development Goals [29].

2. Methods and Materials

2.1. Study Design and Population

This was a cross-sectional study conducted among hospital attendees from two hospitals purposively chosen to represent the high endemic regions and the low endemic regions. For the high endemic region, participants were recruited from Kitgum General Hospital in Kitgum District and the surrounding districts (Pader, Agago, Lamwo, Karenga, and Kotido districts). For the low endemic region, participants were recruited from Kibuku Health Center IV in Kibuku District and the neighboring districts (Butebo, Budaka, Butaleja, Namutumba, and Pallisa). The national prevalence in the general population in Uganda is 4.3%. The Northern Region is comprised, in part, of Kitgum District and its neighboring districts; this area has the highest HBV prevalence of 4.6%, while the Mid-Eastern Region, made up partly of Kibuku and its surrounding districts, has an HBV prevalence of 2.3% and was therefore considered as representing the low endemic region [30]. The research was conducted between September 2020 to August 2021.

2.2. Sample Size Determination

A consecutive sample of 384 participants was considered, following the suggestions made by Cochran to obtain an SNP prevalence of 50% at the 95% confidence interval and a margin of error of 5% [31]. For SNP analysis, the assumptions provided by Eun Pyo Hong and Ji Wan Park [32] were used. We assumed the frequency of 5% for the minor allele, 4.3% HBV prevalence in the general population, complete linkage disequilibrium (1:1 exposed to non-exposed ratio), and 5% types I error rate to arrive at a sample size of 134 for both the exposed and non-exposed participants from the low and high endemic regions.

2.3. Data Collection Tools and Procedures

To collect the demographic data, a face-to-face questionnaire interview was administered by a nurse. A patient request form was designed to collect the results of the HBsAg, HBsAb, HBeAg, HBeAb, and HBcAb serostatus. A one-day training session was provided to the research nurses and the laboratory technologists for instructions regarding the collection of the data and the testing of the HBV serological markers.

2.4. Sample Collection

Four millimeter blood samples were collected aseptically from each participant by a trained laboratory technologist in disposable sodium heparin vacutainers and labeled with a sample identifier number. The samples were kept on ice and transported by cold chain to the laboratory for storage at −80 °C pending DNA extraction for single nucleotide polymorphism (SNP) analysis and HBV genotyping. Another four millimeter blood sample was collected from each participant, aseptically, in red-top containers. The blood was centrifuged at 3000 revolutions per minute. The serum was separated from the cells by Pasteur pipetting and kept in vials labeled with the sample identifier number. The serum was also kept on ice in a cool box prior to its transport to the research laboratories, where it was stored at −20 °C pending its use for downstream assays.

2.5. Serology and Viral Load Testing

For serological evaluation, two tests were used; first, the HBsAg RDT (Healgen Scientific LLC Ltd., Houston, TX, USA) and second, the HBV One Step Combo Test Device(BIOZEK, Medical; Apeldoorn, The Netherlands). The former, which uses the principle of lateral flow chromatographic immunoassay, was used for screening the HBsAg serostatus. The latter, which uses the double-antibody sandwich technique, was used to confirm the HBsAg serostatus and to test for the other markers of HBV exposure (HBeAg, HBeAb, HBsAb, and HBcAb) (Figure 1).
For the viral load evaluation, the Roche HBV PCR assay (Abbott Molecular, Des Plaines, IL, USA), which runs on the automated cobas® 4800 System that detects and quantifies HBV DNA, was used. This platform has a limit of detection of 10 IU/mL and detects hepatitis B virus in the serum, regardless of the polymorphisms or genotype. The protocol previously described by Chevaliez et al. [33] was used; this protocol expresses the HBV DNA levels in international units per milliliter. The cutoff of 20,000 IU/mL has been adopted by the Ugandan Ministry of health to determine whether or not to treat the patient was used in our study [34]. This cutoff is used in tandem with the guidelines of the World Health Organization for the monotoring and treatment of the hepatitits B virus [35].
The serological assays and viral load evaluations were performed in the laboratory of the Kibuli Muslim Hospital, the teaching hospital of the Habib Medical School (HMS), Faculty of Health Sciences (FHS), Islamic University in Uganda (IUIU), and the Central Public Health Reference Laboratories/Uganda National Health Reference Laboratories (CPHL/UNHL), respectively.

2.6. DNA Isolation and PCR Amplification of the Human TNF-Alpha Gene

The protocol for the total DNA extraction has been described in our previous work using the QIAamp® DNA extraction kit (QIAGEN, Mannheim, Germany) [36]. The extracted DNA was PCR amplified to obtain the 450 bp fragment of the human TNF-α gene using Platinum Taq high fidelity DNA Polymerase (Invitrogen, Waltham, USA. The position spanning the 862 and 1031 regions was amplified, and the primers (TNF 1031-863 Forward: 5′-ATCCTGGGGTCC CTGATTTT-3′ and TNF 1031-863 Reverse 5′-CTG, TGGGGA GAACAAAAGGAT-3′) previously described by Ga et al. [37] for the detection of mutations at 863 A/C and 1031T/C were used. The reaction mixture was a total of 25 µL, with the following constituents: 12.5 µL of 2× Kapa HiFi PCR whole mix from Roche (0.5 Unit/µL hot-Start buffered DNA polymerase, 5nM MgCl2, and 0.6 mM dNTPs, plus stabilizers), 1.0 µL for each primer; 5 µL of human genomic DNA, and 5.5 µL of water free from the nuclease enzyme. The following PCR conditions were used: 15 min of initial denaturation at 95 °C; 30 s at 94 °C of denaturation for 30 cycles; 90 s at 62 °C for annealing; 90 s of extension; and 10 min of final extension. The products from the PCR reaction were electrophoresed on a 1.5% agarose gel (Thermo Fisher Scientific, Waltham, MA, USA) stained with ethidium bromide and viewed under ultraviolet light.

2.7. DNA Isolation and PCR Amplification of the HBV Polymerase Gene

The QIAamp® extraction kit was used to extract the total DNA from 200 µL of the whole blood, following the manufacturer’s guidelines. The details of the protocol have been highlighted in our previous study [36]. The product was amplified by polymerase chain reaction using Platinum Taq DNA Pol (Life technologies, Waltham, USA). The HBV pol gene was amplified by nested PCR with two rounds of amplification using the protocol describe in our study [36]. The first-round primers were: Forward: 5′-CAAGGTATGTTGCCCGTTTG-3′ and Reverse: 5′-CCCAACTCCTCCCAGTCCTTAA-3′ [38], which yielded an amplicon size of 1290. The second-round primers were: Forward: 5′-CTGTATTCCCATCCCATCATC-3′ and Reverse: 5′-GACCCACAATTCGTTGACATAC-3′ [39], which provided an amplicon of 400 bp. The amplification was performed on the BioRad T100 Thermal cycler (Bio-Rad Laboratories Inc., Singapore) platform. The following conditions were used for the first round PCR: initial denaturation of 5 min at 95 °C; 45 s at 94 °C for 30 cycles of denaturation; 30 s at 60 °C of annealing; 1 min at 72 °C of elongation; and a final extension of 10 min at 72 °C. The second round PCR was performed using 20 pM for each of the forward and reverse primers under the following conditions: 5 min of initial denaturation at 94 °C; 45 s at 94 °C for 30 cycles of denaturation; 30 s at 55 °C of annealing; 30 s at 72 °C of elongation; and 10 min of final extension at 72 °C. The first and second PCR products were run on 1% and 2% agarose gels, respectively, stained with 0.5 μg/mL ethidium bromide, electrophoresed at 120 V, and visualized under ultraviolet light.

2.8. DNA Purification and Sequencing of the Human TNF-Alpha and HBV Polymerase Genes

The PCR products were cleaned using exonuclease I shrimp alkaline phosphatase-IT (ExoSAP-IT) from Applied Bio systems, per the manufacturer ‘s protocol, in a total volume of 7 µL. Briefly, 2 µL of the ExoSAP were mixed separately with 5 µL of the cleaned polymerase chain reaction products in a reaction tube, incubated for 15 min at 37 °C, and then held at 80 °C for 1 min to terminate the reaction. Thereafter, cycle sequencing was conducted using chain termination on a BigDye Terminator platform version 3.1 from Applied Biosystems, per the instructions from the manufacturer. Furthermore, the products from the cycle sequencing were cleaned with the Big Dye X Terminator platform, in accordance with the guidelines of the producer (Applied Biosystems, Foster City, CA, USA). Finally, the cleaned products were sequenced on the SeqStudio genetic Analyser platform available at https://www.thermofisher.com/ug/en/home/life-science/sequencing/sanger-sequencing/genetic-analyzers/models/seqstudio.html (accessed on 14 August 2022)

2.9. Determination of the TNF-α (863C/A and 1031T/C) and HBV Genotypes

The National Center for Biotechnology Information (NCBI) genotyping tool was used for determining both the hepatitis B virus genotypes and the Single Nucleotide Polymorphisms TNF-α-863C/A and TNF-α-1031T/C genotypes of the TNF-α gene. This tool is available at the following site: http://www.ncbi.nlm.nih.gov/projects/genotyping (accessed on 5 July 2022). In order to verify the relatedness between the known deposited sequence, the FASTA format files were selected from BioEdit software (Version 7.2) and pasted into nucleotide BLAST. This was used to match the unknown targeted sequence obtained from the Sanger sequence against the known sequence deposited in the database.

2.10. Statistical Analysis

The competed questionnaires used for collecting the demographic characteristics and the predictors of HBV infection were checked for completeness and consistency. The data were then entered in SPSS version 26, which was used to create a summary of the data and its analysis. The categorical data were cross-tabulated and analyzed as proportions of participants exhibiting the mutations from the low and high endemic regions. For statistical significance, the crude odds ratios (CORs) with their 95% confidence intervals were estimated using binary logistic regression. These were used to test for the association between the dependent and independent variables for samples from both low and high endemic regions. Furthermore, the comparison between the prevalence of the dominant and recessive alleles, genotypes, and the SNPs among the cases and controls was evaluated by using the Chi-square test of proportion. All analyses were performed at a 95% level of significance, and a p < 0.05 was considered statistically significant.

3. Results

3.1. Screening of Participants

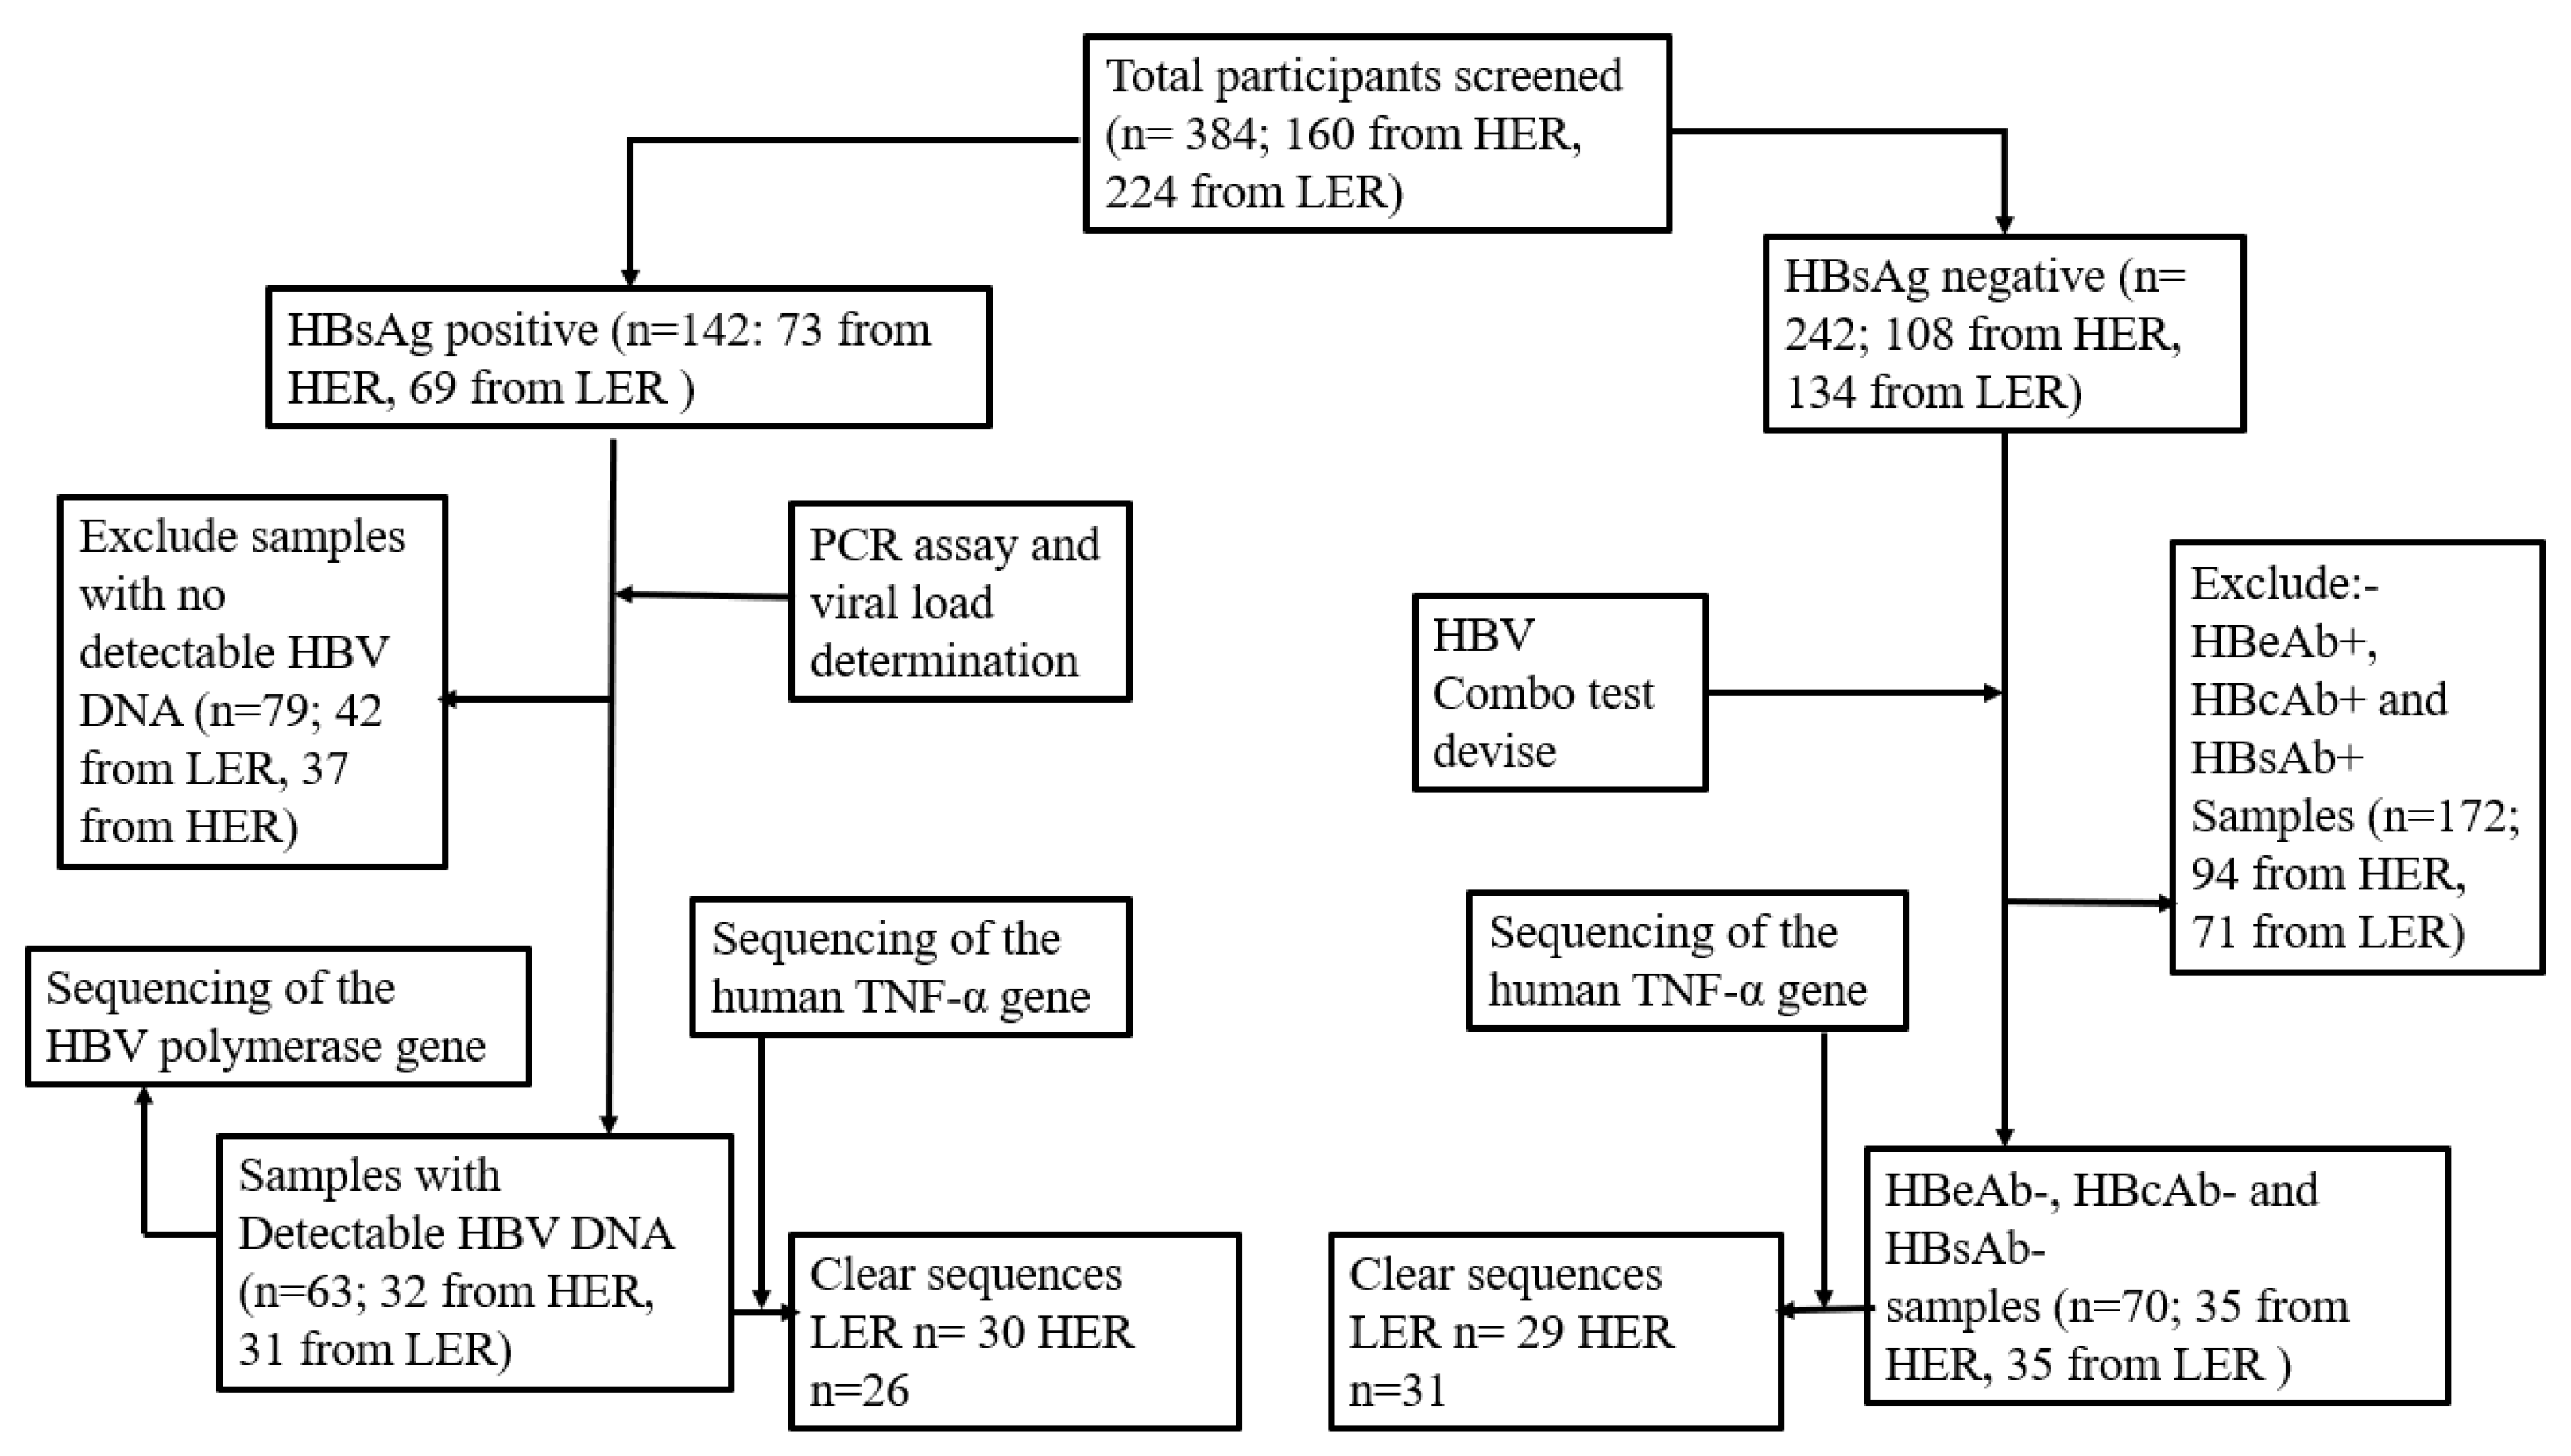
Overall, we screened 384 participants—160 (41.7%) from the high endemic region and 224 (58.3%) from the low endemic region. The difference in the number of study participants was rationalized on the basis of representation, since the low endemic region has proportionately more people living there than does the high endemic region [33]. Of the 384 participants, 142 (36.9%) were HBsAg seropositive—73 (51.4%) from the high endemic region and 69 (48.6%) from the low endemic region. In contrast, 242 (63.1%) were HBsAg seronegative—108 (44.6%) from the high endemic region and 132 (55.4%) from the low endemic region. Out of the 142 HBsAg seropositive, 79 (55.6%) samples were excluded because they did not have detectable HBV DNA—42 (54.4%) from the low endemic region and 37 (46.8%) from the high endemic region. On the other hand, 172 (71.1%) samples out of the 242 HBsAg seronegative samples—94 (54.7%) from the high endemic region and 71 (45.3%) from the low endemic region—were excluded because of the presence of the following markers of HBV exposure: HBeAb, HBcAb, and HBsAb (Figure 2).

3.2. Socio-Demographic Characteristics

Most of our participants were middle aged, in the range 31–59 years, from both the low (49.2%) and high (56.1%) endemic regions, were married, and had attained a primary level of education. The male/female ratio was approximately 1:1 to control for confounding by gender (Table 1).

3.3. Viral Load, Genotypes, Sub-Genotypes, and Recombinant Genotypes

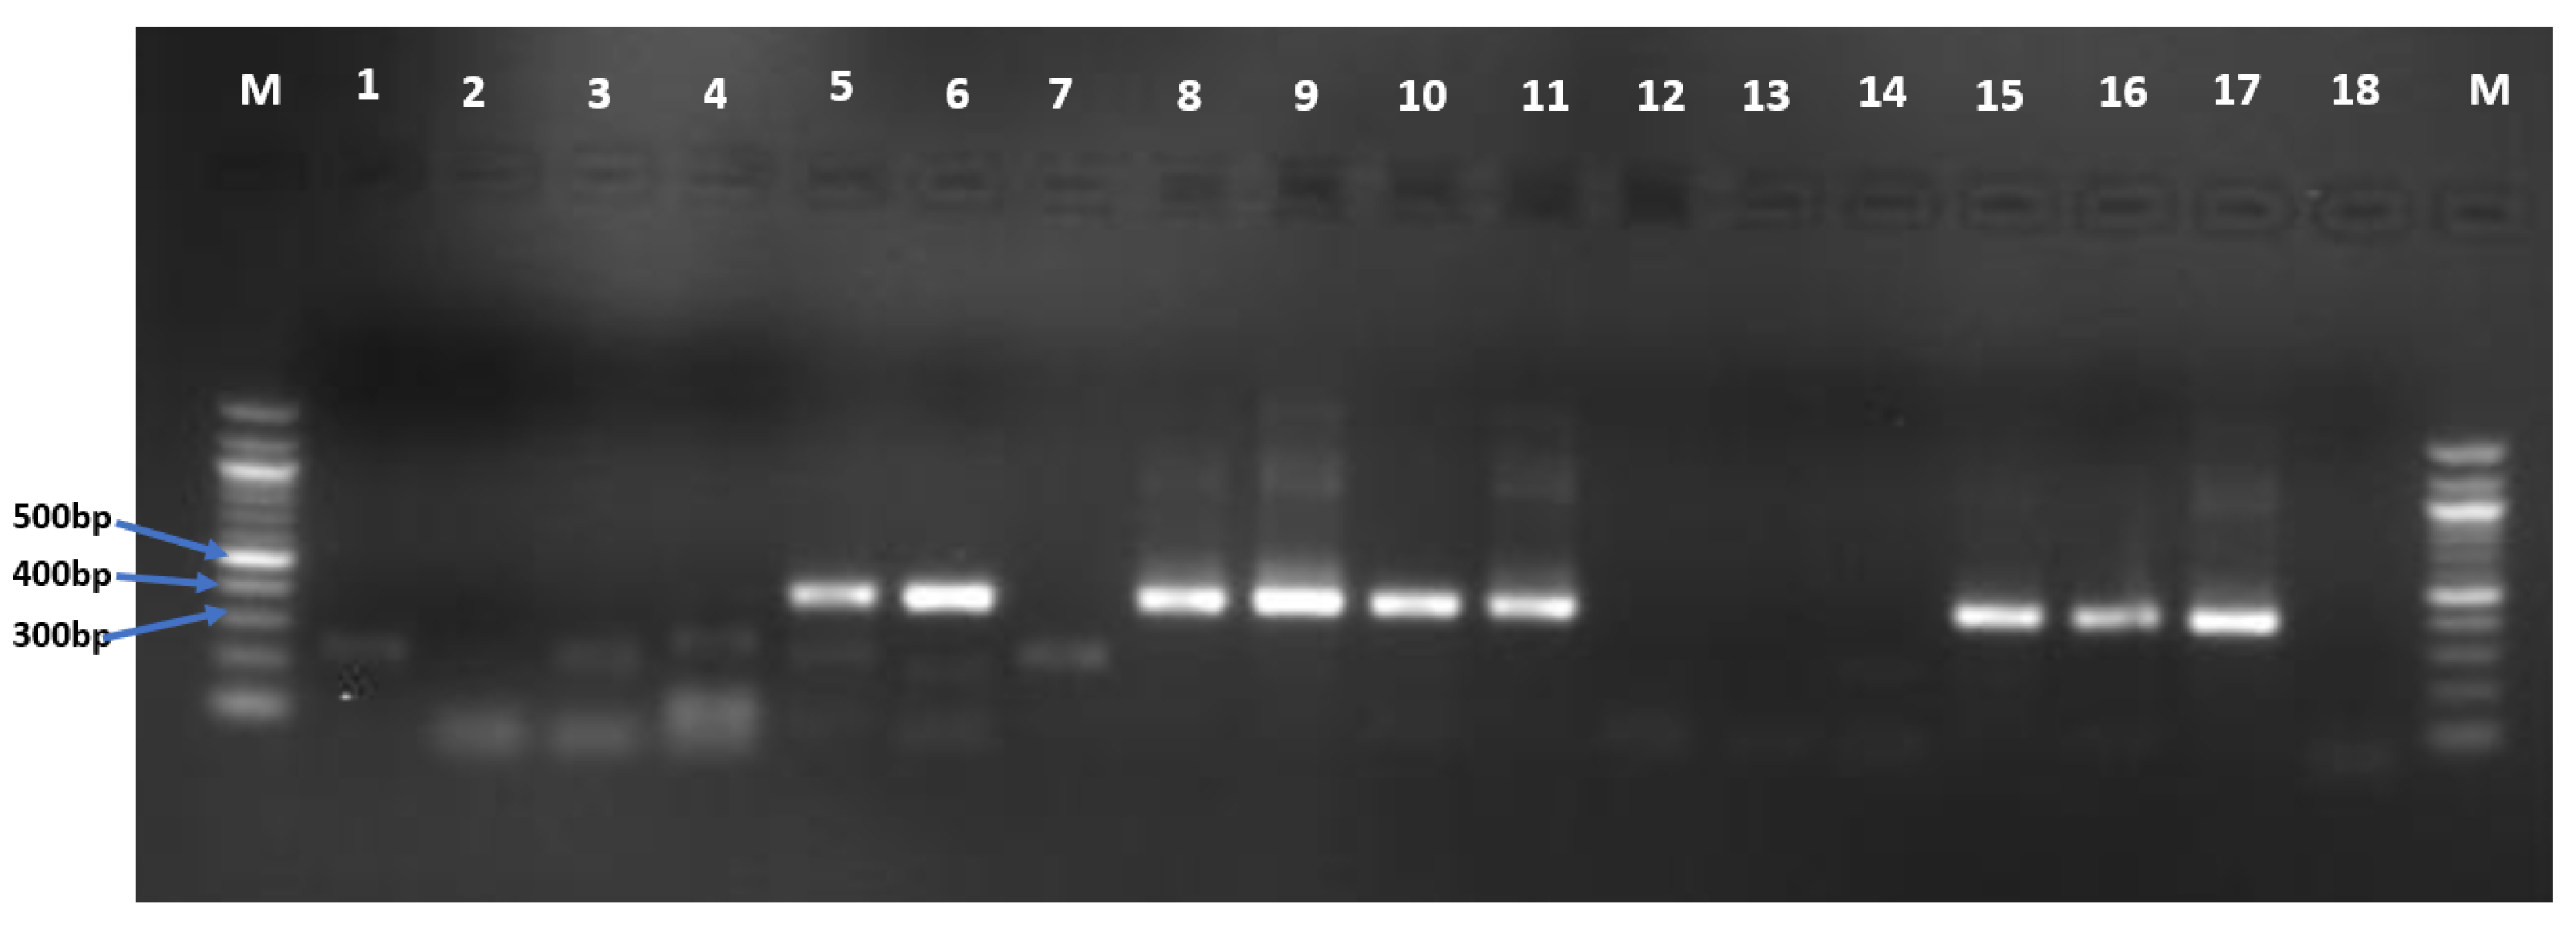
Out of the 142 samples, only 60 (42.3%) had detectable viral load. Of these, 29 (48.3%) were from the low endemic region, and 31 (51.7%) were from the high endemic region. Similarly, 63 (44.4%) samples generated a 400 bp PCR amplification product PCR (Figure 3).
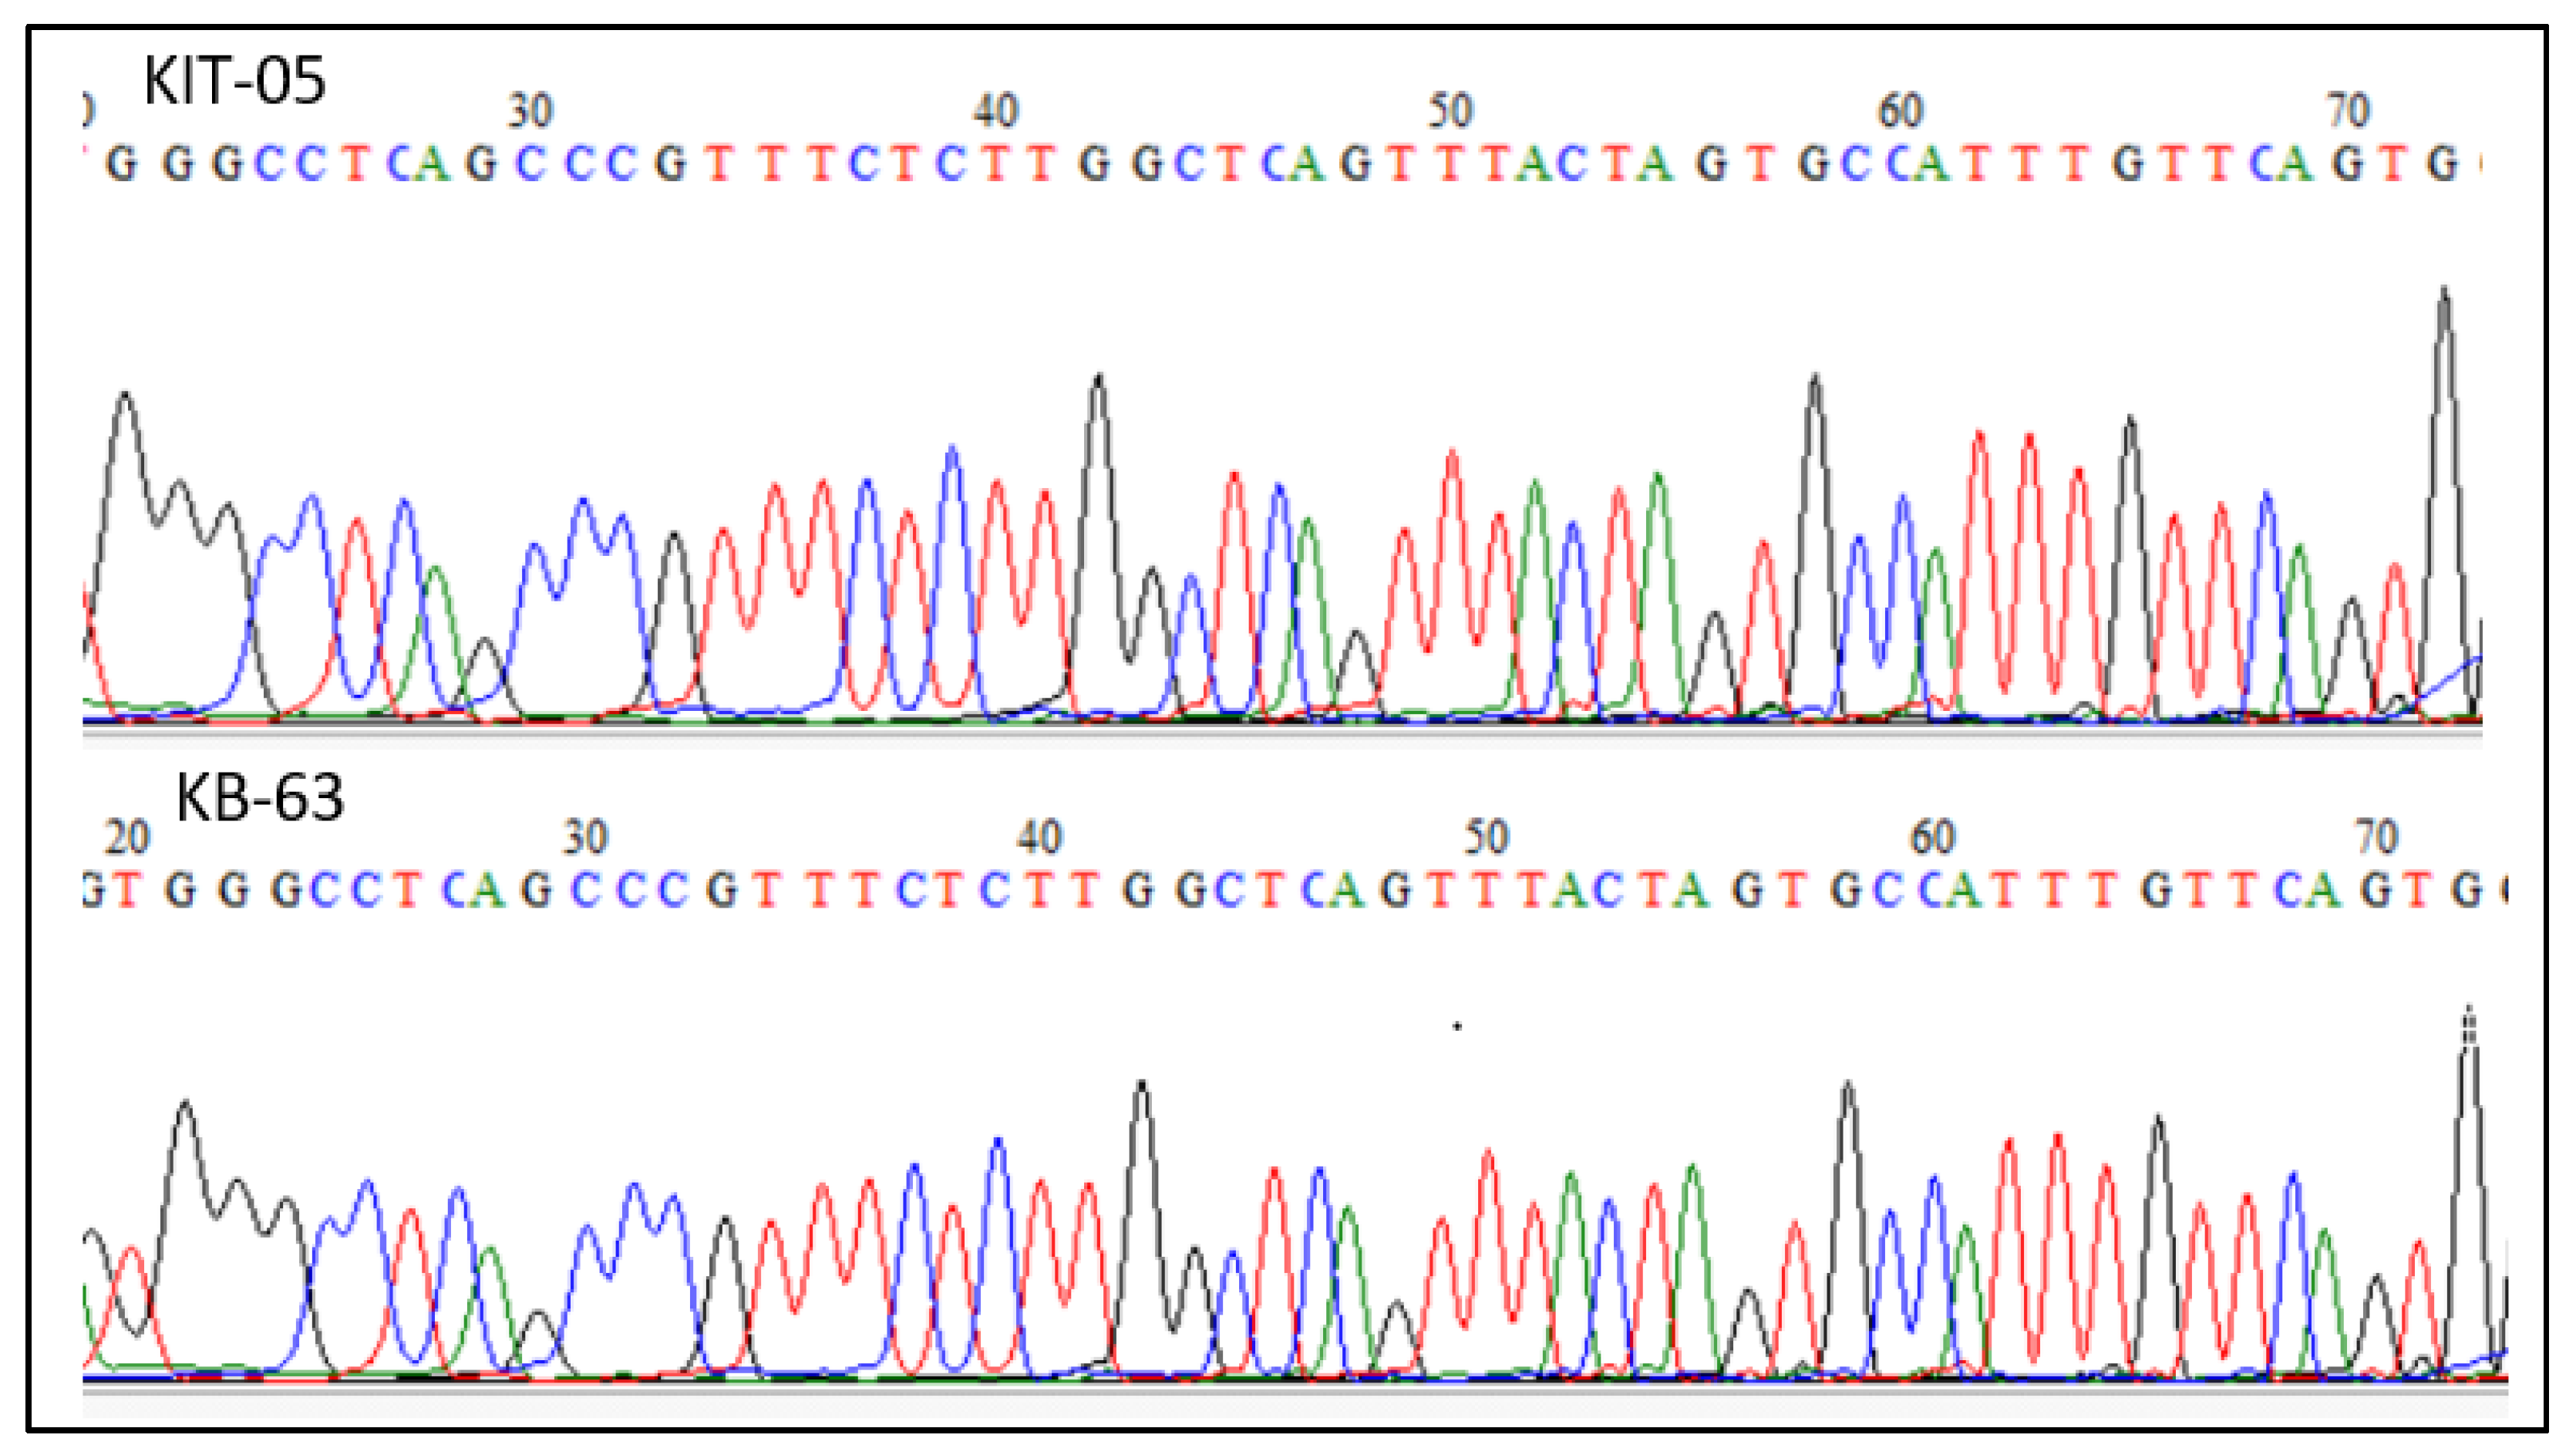
Out of the 63 samples with detectable HBV DNA, 60 (95.2%)—29 (48.3%) from the low endemic region and 31 (51.7%) from the high endemic region—were successfully sequenced and genotyped to obtained the HBV genotypes (Figure 4).
Our study has reported two genotypes, A (28.3%) and D (26.6%); two sub-genotypes, A1 (21.7%) and D4 (1.7%); and one mixed genotype, D/E (21.7%). The prevalence of genotypes A (10, 32.3%) and D (11, 35.5%) was higher in the high endemic region than in the low endemic region. In contrast, the prevalence of sub-genotypes A1 (8, 27.6%) and the mixed genotype D/E (9, 31.0%) was higher in the low endemic region compared to the high endemic region. Finally, genotype D had one sub-genotype, D4, and it was only observed in the high endemic region. These genotypes were compared with the polymorphisms in the TNF-α-863C/A and TNF-α-1031T/C gene loci to establish the candidate alleles/genotypes linked to different genotypes (Supplementary Material Table S1).
We observed a significantly greater number of participants exhibiting a viral load ≥ 20,000IU/mL from the high endemic region than from the low endemic region [OR = 4.07; 95% CI = 1.3661 to 12.1431; p = 0.0117]. Hence, the HBV seropositive participants were 4 times more likely to exhibit a viral load ≥ 20,000 IU/mL (Table 2).

3.4. The TNF-α-863C>A and TNF-α-1031T>C Single Nucleotide Substitutions

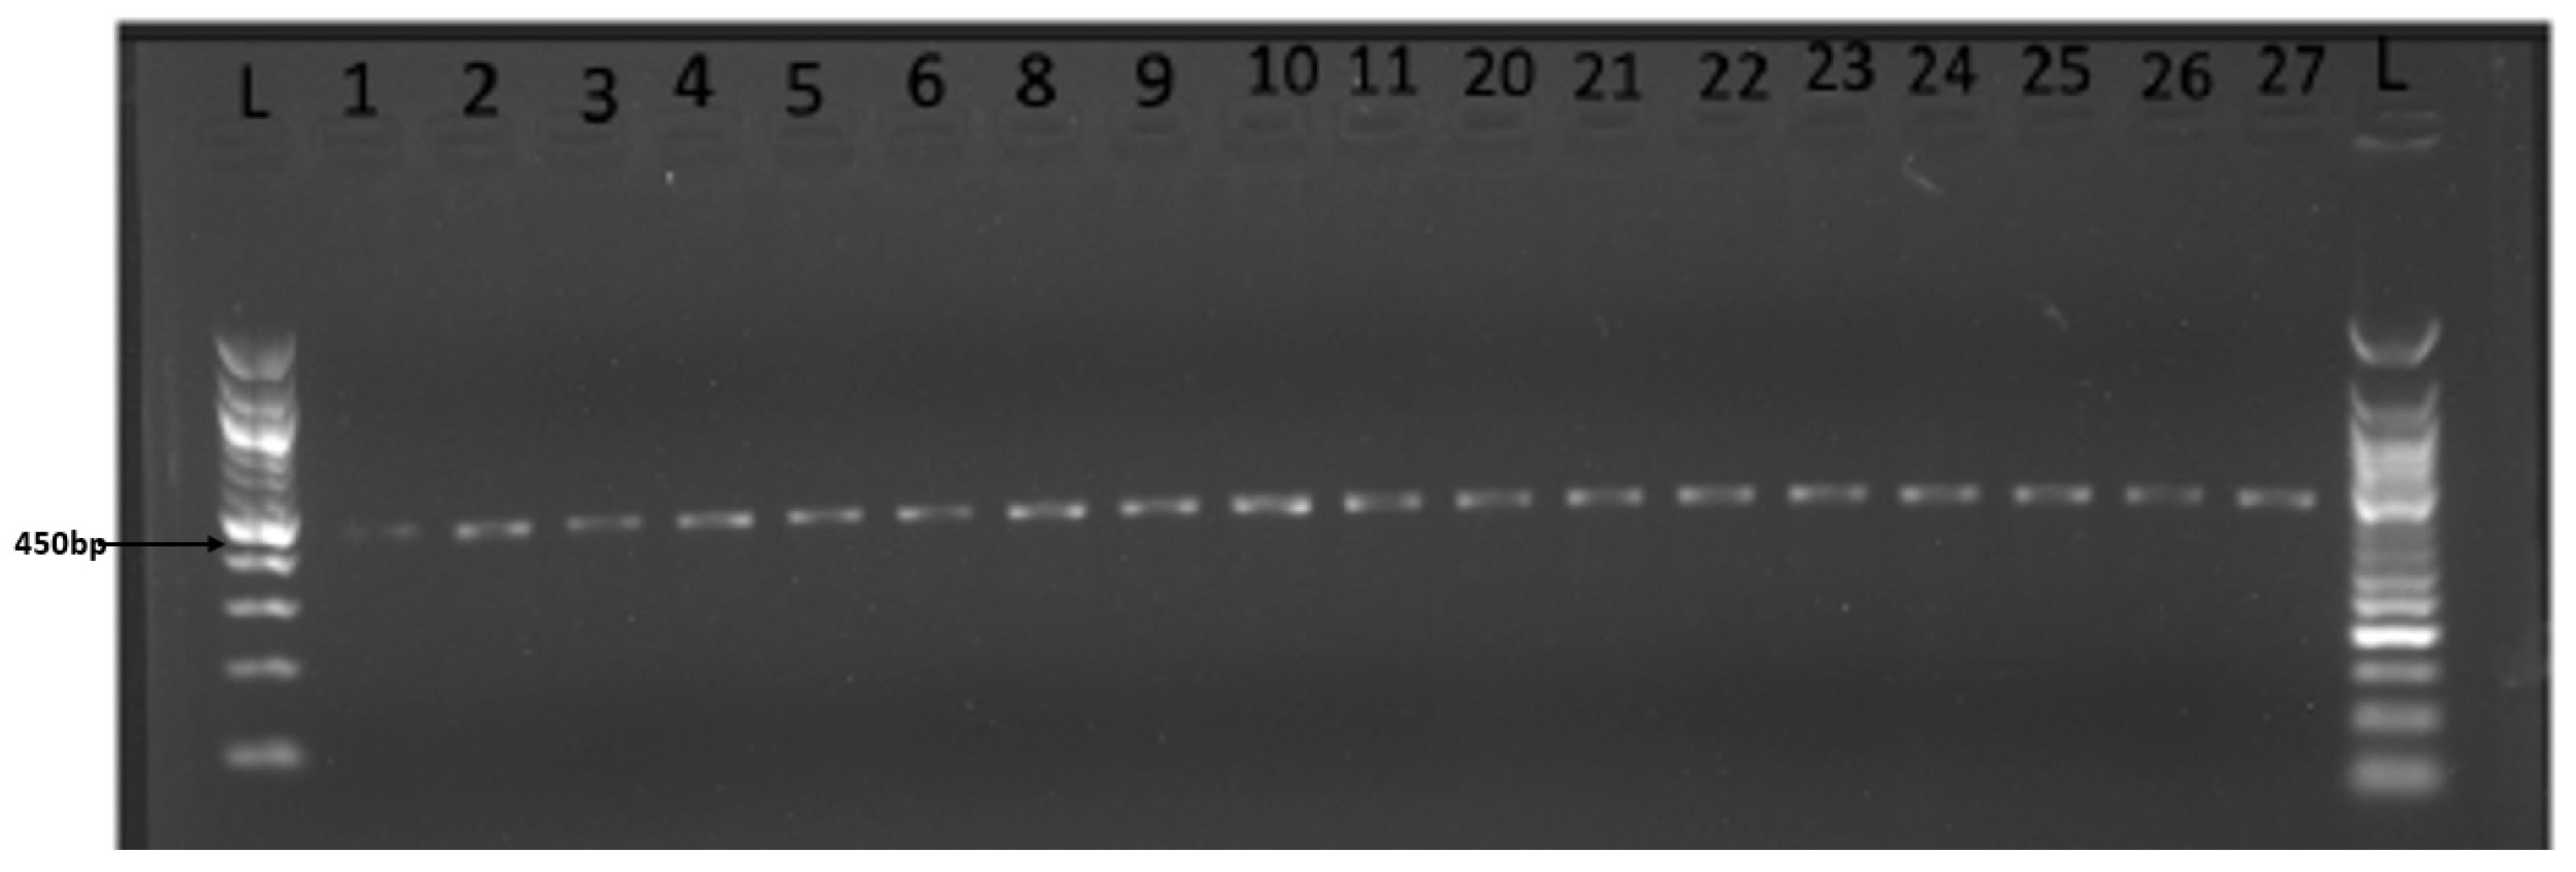
The human TNF-alpha gene spanning positions 862 through 1031 generated a 450 bp PCR amplification product. All 133 (100.0%) yielded clear bands after electrophoresis on gels stained with ethidium bromide and visualized under ultraviolet light (Figure 5).
These samples were cleaned using an Exonuclease I Shrimp alkaline phosphatase (ExoSAP) enzymatic clean up and sent for sequencing. A total of 125 (94.0%) of these samples yielded sequences. However, 9 (7.2%) of the sequences were unusable, and further analysis of the polymorphisms in the TNF-α gene was not possible. Thus, a total of 116 (92.8%) sequence were clear, and downstream analysis was performed to determine the prevalence of mutations in the TNF-α gene at the 863 and 1031 sites. Figure 6 shows a representative scheme of the sequence analysis.
As expected, the TNF-α gene promoter is highly conserved in our study population. The majority of the participants had wild-type alleles for both the TNF-α-1031 and TNF-α-863 positions, showing the wild-type genotypes TT and CC, respectively. However, for participants from the high endemic region, sequence analysis revealed four cases with mutations at the 1031 position and two cases with mutations at position 863. The TNF-α-1031T>C single nucleotide substitution mutations, when disaggregated by HBsAg serostatus, revealed that there were two from HBsAg seropositive and two from HBsAg seronegative participants. Thus, our results have shown that among the high endemic region participants in the study, four of them exhibited the TNF-α-1031C>A substitution mutation. The TNF-α-863C>A single base substitution mutations were also equally distributed; one HBsAg seropositive and one HBsAg seronegative. Similarly, for participants from the low endemic region, sequence analysis revealed only two cases of TNF-α-863C>A base substitution mutations; one being HBsAg positive and one HBsAg negative, and three cases of the TNF-α-1031T>C single base substitution mutations; two HBsAg positive and one HBsAg negative (Table 3).
As presented in Table 3 above, the TNF-α-863C>A nucleotide substitution mutation rate was low (3.2 to 7.7%) among the HBsAg seronegative and positive participants, respectively, from the low and high endemic regions. However, the TNF-α-1031T>C mutation rate was slightly higher among both the HBsAg seronegative and seropositive participants from the high endemic region (in the range of 3.3–11.1%). When we disaggregated the allele and genotype frequencies by HBsAg serostatus, there was no significant association between HBsAg serostatus and allele/genotype frequency (p > 0.05). However, the odds of the association of TNF-α-1031TT or the its allele T were higher among the HBsAg seronegative participants from the low endemic region. Thus, the HBsAg-participants were 2 times more likely to display TNF-α-1031TT or the its allele T compared to the HBsAg+ participants (Table 3). In contrast, the wild-type allele/genotype frequency was significantly higher than the mutant allele for both TNF-α-863C/A and TNF-α-1031T/C for participants from both the low and high endemic regions (p < 0.05). Most importantly, the allele frequencies were in Hardy–Weinberg equilibrium, since the sum of the frequency of the wild-type allele and the mutant allele was 100%, suggesting that the population from which the sample was obtained was in genetic equilibrium (Table 4).

3.5. The TNF-α-863C>A and TNF-α-1031T>C Single Nucleotide Polymorphisms and the HBV Genotypes

When we compared the relationship between the HBV genotypes and the TNF-α-863C>A and 1031T>C single nucleotide substitution, the following observations were noted. First, one case of TNF-α-863C>A single nucleotide substitution was seen among the chronic hepatitis B (CHB) participants infected with genotype D and sub genotype A1 in the high and low endemic regions, respectively. Second, four cases of TNF-α-1031T>C were observed, two from the high endemic region, both infected with sub-genotype A1, and two from the low endemic region, infected with genotypes A and D, respectively. Finally, genotype A or its sub-genotype A1 exhibited four out of the six mutations detected in both 863C>A and 1031T>C among the participants from the low endemic region. None of the participants infected with the recombinant genotype D/E or sub-genotypes D4 presented with a mutation in the TNF-gene at the loci investigated in our study (Supplementary Material Table S1).

4. Discussion

Tumor necrosis factor alpha (TNF-α) has been described as a pleiotropic cytokine whose serum concentration is dependent on the polymorphisms in the promoter region of the gene that controls its expression. The effector function of the TNF-α-863C/A gene in the expression levels of TNF alpha is not fully understood. However, the TNF-α-863C/A SNPs have been reported to bind to the nuclear protein on the promoter region of the gene, influencing the expression levels of the gene and ultimately affecting the plasma levels of the TNF-α [28].
There was no significant association between the TNF-α-863 wild-type genotype CC and the TNF-α-863 C>A single nucleotide substitution with a risk of HBV infection for either the participants from the low or high endemic regions. Similarly, there was no significant association between the TNF-α-1031 wild-type genotype TT and the single nucleotide polymorphism T>C with the risk of HBV infection for either the participants from the low or high endemic regions.
In our study, the insignificant association between the TNF-α-863 wild-type genotype CC and the TNF-α-863 C>A single nucleotide substitution with the risk of HBV infection is in agreement with the findings from our meta-analysis of six studies among Asians, but contrary to the findings among Caucasians, which reported a strong association between the homozygous mutation TNF-α-863AA and the risk of HBV infection [21]. This is consistent with the studies by Xia et al. [2] and Kao et al. [40]. This finding is unexpected because from evolutionary trends, Caucasians have been closely linked to Blacks, the subjects used in the current study [41]. However, the differences observed in our study and the previous studies can be attributed to several factors: First, there are the racial differences between the subjects used in the current study and those used in the studies published in literature. Second, there are differences between the environment in our study and those in the published studies, and the environment is a key driver of mutations and evolutionary changes. Finally, there is a highly conserved nature regarding the gene promoter at the TNF-α-1031 and the TNF-α-863 loci positions.
Furthermore, the absence of a significant association between the TNF-α-1031T/C genotypes and the risk of HBV infection in the current study is in agreement with the findings from the meta-analysis performed by Xia et al. [2], who did not observe any association between the TNF-α-1031TT genotype with the risk of HBV infection/resolution of the infection. However, this finding contradicts the report from our meta-analysis, which implicated that the TNF-α-1031TT wild-type genotype and its allele T were significantly associated with protection against HBV infection or resolution of the infection [21]. A comparable result was suggested by Shin et al. [20]. They observed an increased survival time post-HBV HCC treatment among those with the TNF-α-1031TT genotype compared to those with the TNF-α-1031CC genotype among Asian populations. Therefore, in line with the findings of Shin et al. [20], our results suggest a protective effect of the predominant wild-type TNF-α-1031TT genotype, as well as increased post-HCC treatment survival in our setting.
The highly conserved nature of the TNF-α-863 and 1031 wild-type genotypes CC and TT, respectively, reported in our study has been reported among the Indian [4] and the Chinese population [42]. Fortunately, this is associated with beneficial outcomes. For example, both the wild-type genotypes TNF-α-863CC and 1031TT have been associated with HBV clearance and reduced susceptibility to infection [43]. Therefore, the determination of an explanation for the differences in the burden of HBV in our country in regards to the differences in the polymorphisms in the TNF-α-863C/A and 1031T/A positions within the promoter region of the TNF-α gene becomes elusive. The plausible explanation for the differences in the burden can be inferred from many sources, as highlighted from the studies in the literature. The first explanation involves viral factors, i.e., in our previous study, we established that there are particular genotypes circulating in the low and high endemic regions [36]. Moreover, infection with a particular genotype presents differences in both the infectivity and the disease profile [44,45]. Secondly, the risk factors of becoming infected with HBV, reported in our previous work, significantly differed between the low endemic and high endemic regions [46]. For example, a history of blood transfusion and familial contact with an HBV-infected person were major risk factors for HBV infection in the low endemic region compared to the high endemic region [46]. Thirdly, a study by our research team has shown that the HBsAb+/HBcAb+/HBeAb+ marker prevalence rate was much higher among participnats from the high endemic region compared to those from the low endemic region [46]. This is an indicator of an immune escape mutation and higher infectivity [47]. Finally, in our systematic review and meta-analysis on the prevalence and predictors of HBV in East Africa, our data synthesis has shown that the most important risk factor for infection was body scarification [48]. This is a vice that is more common among the persons from the high endemic regions than among those from the low endemic regions [49].
The high prevalence of genotypes A, D, and the recombinant genotype D/E reported in our study, on which our discussion has been based, has numerous considerations in the literature. Firstly, genotype A is associated with the sexual transmission route [50,51], increased chances of progressing to chronic disease, and better response to therapy with interferon, but increased resistance to nucleoside analogues [44]. Secondly, genotype D is associated with blood transfusion [52]; poor response to interferon therapy [53,54]; more aggressive disease, progressing to end stage liver disease (ESLD); and increased HBV-associated vasculitis compared to other genotypes, along with exhibiting a high propensity of seroconversion of HBeAg to HBeAb during adolescence. Finally, the mixed genotype D/E has been linked to a higher viral load than infection with either genotype D or E, increasing the risk of liver inflammation [45].
Therefore, as alluded to in the literature, our findings on the circulating genotypes have interesting implications towards the management of many aspects of HBV. These include: first, the unmet need for practicing safe sex; second, the need for the prerequisite to rigorously screen for blood prior to transfusion; and finally, the need for establishing the infecting genotypes before the patient is enrolled in antiviral therapy. Most importantly, close monitoring of the patients infected with genotype A, D, and the mixed genotype D/E should be performed because of the associated risks of the disease progressing to ESLD, as highlighted from literature.
When we disaggregated the data regarding the circulating genotypes by endemicity, our results showed that patients from the high endemic region were proportionately more infected by both genotypes A and D, as well as the sub genotype A1, whereas those from the low endemic region were more proportionately infected with the mixed genotype D/E.
Thus, in designing interventions to control and manage hepatitis B virus infection, these differences should be put into consideration. First, the quest for the need to practice safe sex is apparently more relevant in the high endemic region. Second, the propensity of transfusing infected blood has also been higher in the high endemic region. Most importantly, however, as noted in the literature, patients from the high endemic region should be enrolled in interferon therapy, since infection with genotype A is allied with resistance to nucleoside/nucleotide analogs. In contrast, patients from the high endemic region should be enrolled in nucleoside/nucleotide analog therapy due to the poor response of genotype D to interferon therapy.
The high burden of A1 has been linked to progression to HCC among Bantu speakers [44]. Because the Eastern Region is dominated by Bantu speakers, as opposed to the Northern Region, which is dominated by Luo speakers, this worry is justified. Moreover, genotype A, or its sub-genotype A1, displayed four out of the six mutations detected in both 863C>A and 1031T>C among the participants from the low endemic region. Additionally, the TNF-α-863AA and TNF-α-1031 CC recessive mutations have been associated with an increased risk of HBV infection [21]. Moreover, three-quarters of these mutations were from samples obtained from the high endemic region. The association of these mutations with HBV genotype A infection can provide an explanation for the higher risk, and perhaps the predominance, of HBV genotype A infection compared to that of other genotypes.
Finally, most of the CHBV-infected persons displayed a viral load within tolerable limits (≤20,000 IU/mL). This is attributable to several factors, as reported by our research and the results in the literature. The first factor is the predominance of the wild-type genotypes at both the 1031 and 863 TNF-α gene loci [20]. The second factor is the fact that both the wild-type genotypes TNF-α-863CC and 1031TT are associated with HBV clearance. This compromises an elevation in the viral load [43]. The third factor is the predominance of the HBV genotype A and its sub-genotype A1, which are generally associated with a low viral load [55].

5. Conclusions

The TNF-α-863CC and 1031TT wild-type genotypes are highly conserved among our study participants from the low/high endemic regions of our country. Thus, the tumor necrosis factor-alpha-863C>A and 1031T>C gene promoter single base substitution mutations may not contribute to the endemicity gap for HBV in Uganda.

6. Limitations

There are three key limitations that can be highlighted in our study. First, the lack of measurement of the levels of TNF-α in the blood stream among the HBsAg seropositive and seronegative among the two compression groups from both regions yields inconclusive results. However, these results can be tentative, pending further studies. Second, the small number of study subjects and the scope of the study being confined to the hospital setting is an additional limitation. Third, the genotyping platform could not resolve the problem of heterozygous genotypes. Therefore, our findings may not be generalized to the entire population. However, our results have provided key information pertaining to the role of cytokine gene promoter polymorphisms in regards to the differential HBV burden.

Supplementary Materials

The following supporting information can be downloaded at: https://www.mdpi.com/article/10.3390/livers3040037/s1, Table S1: Relationship between the TNF-α-863C/A and TNF-α-1031T/C mutations and the HBV genotypes in the low and high endemic area.

Author Contributions

H.M.K. and H.S. conceived the idea. H.M.K., P.O., D.N., H.K., A.K. and C.D.K. participated in the data presentation, analysis and discussion. H.M.K., K.E., F.A.K. and M.M.N. participated in conducting laboratory assays. H.M.K. and K.E. wrote the final manuscript draft. P.O., E.W., H.S., A.W., D.P.K. and J.E.S. reviewed the manuscript draft for important intellectual content. All authors have read and agreed to the published version of the manuscript.

Funding

This work was funded by the Makerere University Research and Innovations Fund (MakRIF) and the Islamic University in Uganda (IUIU) through the Islamic Development Bank (IsDB) Grant.

Institutional Review Board Statement

The research received ethical approval from the Research and Ethics Committee of the School of Biomedical Sciences, College of Health Sciences, Makerere University, reference number SBS-REC-708, and the Uganda National Council for Science and Technology (UNCST), reference number HS575ES.

Informed Consent Statement

This study was conducted following the guidelines of the Declaration of Helsinki, and all participants provided written consent for their participation in the study.

Data Availability Statement

All data generated or analyzed during this study are included in this published article and in the Supplementary Material. The data for the TNF-α-863C/A and 1031T/C genotypes NCBI accession numbers are available on request from the principal investigator (P.I.) via email: [email protected]. These data will be made public when all the downstream molecular analyses of the TNF-α-863C/A and 1031T/C genotypes are completed.

Acknowledgments

We are grateful to the Islamic Development Bank (IsDB) through the Islamic University in Uganda (IUIU) and the Makerere University Research and Innovation Fund (MakRIF) for funding our study. We also thank Ntanda K Moses, Makerere University College of Computing and Information Sciences, for the ICT technical support. Finally, we thank Haroon Yasin of the English language department of the Kibuli Secondary School who copy edited and proofread the manuscript.

Conflicts of Interest

The authors declare no conflict of interest.

Abbreviations

CORscrude odds ratios
ESLDend-stage liver disease
HBcAbhepatitis B core antibody
HBeAbhepatitis B pre-core antibody
HBeAghepatitis B pre-core antigen
HBsAbhepatitis B surface antibody
HBsAghepatitis B surface antigen
HBVhepatitis B virus
HCChepatocellular carcinoma
MHCmajor histocompatibility
NCBINational Center for Biotechnology Information
PCRpolymerase chain reaction
RDTrapid diagnostic test
SNPssingle nucleotide polymorphisms
TNFtumor necrosis factor

References

  1. Manjita, S.; Arttrika, R.; Jitendra, K.C.; Manish, K.T.; Smita, V.; Vinod, K.D.; Gopal, N.; Ashok, K.J. Role of Proinflammatory Cytokines (Interferon Gamma) and Anti Inflammatory Cytokine (Interleukin-10) Gene Polymorphisms in Chronic Hepatitis B Infection: An Indian Scenario. J. Interf. Cytokine Res. 2014, 34, 547–551. [Google Scholar]
  2. Xia, Q.; Zhou, L.; Liu, D.; Chen, Z.; Chen, F. Relationship between TNF-, alpha. Gene Promoter Polymorphisms and Outcomes of Hepatitis B Virus Infections: A Meta-Analysis. PLoS ONE 2011, 6, e19606. [Google Scholar] [CrossRef]
  3. Zhang, T.; Zhao, Y.; Hu, G.; Liu, X.; Huang, X. The relationship between tumour necrosis factor-a gene polymorphism and susceptibility and clearance of the persistent hepatitis B virus infection in a Chinese population: A meta-analysis. Clin. Microbiol. Infect. 2013, 20, 227–234. [Google Scholar] [CrossRef]
  4. Panigrahi, R.; Sarkar, N.; Biswas, A.; Pal, A.; Saha, D.; Singh, S.P.; Panigrahi, M.K.; Bandopadhyay, M.; Chakrabarti, S.; Chakravarty, R. Association of TNF-&alpha; Promoter Polymorphism with HBV Associated Disease Outcome Among HBV Infected Patients from Orissa, Southern Part of East India. J. Clin. Exp. Hepatol. 2014, 4, 202–208. [Google Scholar] [CrossRef]
  5. Azar, S.S.; Mansoori, M.; Attar, M.; Shahbazi, M. Tumor Necrosis Factor Alpha -308 G/A Single Nucleotide Polymorphism and Susceptibility to Hepatocellular Carcinoma Via Hepatitis B Infection. World J. Hepatol. 2016, 17, 3381–3384. [Google Scholar]
  6. Talaat, R.; Abdelkhalek, M.; El-Maadawy, E.; Abdel-Mageed, S.; El-Shenawy, S.; Osman, M. Association of TNF-Alpha Gene Polymorphisms and Susceptibility to Hepatitis B Virus Infection in Egyptians. Hum. Immunol. 2017, 78, 739–746. [Google Scholar] [CrossRef]
  7. Mathew, S.; Abdel-Hafiz, H.; Raza, A.; Fatima, K.; Qadri, I. Host nucleotide polymorphism in hepatitis B virus-associated hepatocellular carcinoma. World J. Hepatol. 2016, 8, 485–498. [Google Scholar] [CrossRef]
  8. Ma, L.; Chen, S.; Mao, X.; Lu, Y.; Zhang, X.; Lao, X.; Qin, X.; Li, S. The association between TNFR gene polymorphisms and the risk of hepatitis B virus-related liver diseases in Chinese population. Sci. Rep. 2018, 8, 9240. [Google Scholar] [CrossRef]
  9. Godkin, A.; Davenport, M.; Hill, A. Molecular analysis of HLA class II associations with hepatitis B virus clearance and vaccine nonresponsiveness. Hepatology 2005, 41, 1383–1390. [Google Scholar] [CrossRef] [PubMed]
  10. Mao, X.; Chen, H.; Yue, W. Genetic association of tumor necrosis factor (TNF)-alpha polymorphisms with hepatitis B in Gansu Province. Chin. J. Clin. Gastroenterol. 2005, 17, 289–292. [Google Scholar]
  11. Shi, K.Q.; Cai, X.H.; Xiao, D.D.; Wu, S.J.; Peng, M.M.; Lin, X.F.; Liu, W.Y.; Fan, Y.C.; Chen, Y.P.; Zheng, M.H. Tumour necrosis factorα-857T allele reduces the risk of hepatitis B virus infection in an Asian population. J. Viral Hepat. 2012, 19, 66–72. [Google Scholar] [CrossRef]
  12. Wilson, A.; Symons, J.; McDowell, T. Effects of a polymorphism in the human tumor necrosis factor alpha promoter on transcriptional activation. Proc. Natl. Acad. Sci. USA 1997, 94, 3195–3199. [Google Scholar] [CrossRef]
  13. Berchtold, S.; Manncke, B.; Klenk, J. Forced IFIT-2 expression represses LPS induced TNF-alpha expression at posttranscriptional levels. BMC Immunol. 2008, 9, 75. [Google Scholar] [CrossRef]
  14. Nakamura, I.; Nupp, J.; Cowlen, M. Pathogenesis of experimental neonatal woodchuck hepatitis virus infection: Chronicity as an outcome of infection is associated with a diminished acute hepatitis that istemporally deficient the expression of interferon gamma and tumornecrosis factor-alpha. Hepatology 2001, 33, 439–447. [Google Scholar] [CrossRef]
  15. Gusatti, C.d.S.; Costi, C.; Rubia, M.; Halon, L.; Grandi, T.; Ferrari, A.; Medeiros, R.; Dornelles, M.; Rodenbusch, R. Association between cytokine gene polymorphisms and outcome of hepatitis B virus infection in southern Brazil Association Between Cytokine Gene Polymorphisms and Outcome of Hepatitis B Virus Infection in. J. Med. Virol. 2016, 88, 1759–1766. [Google Scholar] [CrossRef]
  16. Kim, Y.J.; Lee, H.; Yoon, J.; Kim, C.Y.; Park, M.H.; Kim, L.H.; Park, B.L.; Shin, H.D. Association of TNF-a promoter polymorphisms with the clearance of hepatitis B virus infection. Hum. Mol. Gen. 2003, 12, 2541–2546. [Google Scholar] [CrossRef]
  17. Fletcher, G.J.; Samuel, P.; Christdas, J.; Gnanamony, M.; Ismail, A.M.; Anantharam, R.; Eapen, C.E. Association of HLA and TNF polymorphisms with the outcome of HBV infection in the South Indian population. Genes Immun. 2011, 12, 552–558. [Google Scholar] [CrossRef]
  18. Zheng, M.; Qiu, L.; Xin, Y.; Pan, H.; Shi, K.; Chen, Y. Tumor necrosis factor-α-308A allele may have a protective effect for chronic hepatitis B virus infection in Mongoloid populations. Int. J. Infect. Dis. 2010, 14, e580–e585. [Google Scholar] [CrossRef]
  19. Xiao, Q.; Fu, B.; Chen, P.; Liu, Z.Z.; Wang, W.; Ye, Q. Three polymorphisms of tumor necrosis factor-alpha and hepatitis B virus related hepatocellular carcinoma. Medicine 2016, 50, e5609. [Google Scholar] [CrossRef]
  20. Shin, S.; Kim, N.; Kim, J.; Lee, J.; Kim, J.; Park, H.; Kim, M.; Rim, K.S.; Hwang, S.G. Association between hepatocellular carcinoma and tumor necrosis factor alpha polymorphisms in South Korea. World J. Gastroenterol. 2015, 21, 13064–13072. [Google Scholar] [CrossRef]
  21. Kafeero, H.M.; Ndagire, D.; Ocama, P.; Walusansa, A.; Sendagire, H. Tumor Necrosis Factor-α-863C/A and 1031T/C single nucleotide polymorphic sites (SNPs) may be putative markers of HBV disease prognosis among Caucasoids: Evidence from a systematic review with meta-analysis. Gene Rep. 2022, 26, 101486. [Google Scholar] [CrossRef]
  22. Yun, J.-H.; Choi, J.-W.; Lee, K.-J.; Shin, J.-S.; Baek, K.-H. The promoter −1031(T/C) polymorphism in tumor necrosis factor-alpha associated with polycystic ovary syndrome. Reprod. Biol. Endocrinol. 2011, 9, 131. [Google Scholar] [CrossRef]
  23. Abutorabi, R.; Baradaran, A.; Sadat Mostafavi, F.; Zarrin, Y.; Mardanian, F. Evaluation of tumor necrosis factor alpha polymorphism frequencies in endometriosis. Int. J. Fertil. Steril. 2015, 9, 329–337. [Google Scholar]
  24. Higuchi, T.; Seki, N.; Kamizono, S.; Yamada, A.; Kimura, A.; Kato, H.; Itoh, K. Polymorphism of the 5′-flanking region of the human tumor necrosis factor (TNF)-α gene in Japanese. Tissue Antigens 1998, 51, 605–612. [Google Scholar] [CrossRef]
  25. Soga, Y.; Nishimura, F.; Ohyama, H.; Maeda, H.; Takashiba, S.; Murayama, Y. Tumor necrosis factor-alpha gene (TNF-α) −1031/−863, −857 single-nucleotide polymorphisms (SNPs) are associated with severe adult periodontitis in Japanese. J. Clin. Periodontol. 2003, 30, 524–531. [Google Scholar] [CrossRef]
  26. Yang, Y.A.N.; Qiu, X.; Yu, H.; Zeng, X.; Bei, C. TNF-α-863 polymorphisms and the risk of hepatocellular carcinoma. Exp. Ther. Med. 2012, 3, 513–518. [Google Scholar] [CrossRef]
  27. Laddha, N.; Dwivedi, M.; Begum, R. Increased tumor necrosis factor (TNF)-α and its promoter polymorphisms correlate with disease progression and higher susceptibility towards vitiligo. PLoS ONE 2012, 7, 52298. [Google Scholar] [CrossRef]
  28. Skoog, T.; Van’t Hooft, F.; Kallin, B.; Jovinge, S.; Boquist, S.; Nilsson, J.; Eriksson, P.; Hamsten, A. A common functional polymorphism (C→a substitution at position −863) in the promoter region of the tumour necrosis factor-α (TNF-α) gene associated with reduced circulating levels of TNF-α. Hum. Mol. Genet. 1999, 8, 1443–1449. [Google Scholar] [CrossRef]
  29. World Health Organization. World Health Statistics 2016: Monitoring Health for the SDGs Sustainable Development Goals; WHO: Geneva, Switzerland, 2016. [Google Scholar]
  30. UPHIA. Uganda Population HIV Impact Assesment, August, 2019; WHO: Geneva, Switzerland, 2019. [Google Scholar]
  31. Cochran, W.G. Sampling Techniques, 3rd ed.; John Wiley & Sons: New York, NY, USA, 1977. [Google Scholar]
  32. Eun Pyo Hong, J.W.P. Sample Size and Statistical Power Calculation in Genetic Association Studies. Genom. Inform. 2012, 10, 117–122. [Google Scholar] [CrossRef]
  33. Chevaliez, S.; Bouvier-Alias, M.; Laperche, S.; Hézode, C.; Pawlotsky, J.M. Performance of version 2.0 of the Cobas AmpliPrep/Cobas TaqMan real-time PCR assay for hepatitis B virus DNA quantification. J. Clin. Microbiol. 2010, 48, 3641–3647. [Google Scholar] [CrossRef]
  34. Ministry of Health. Uganda Guidelines for Prevention, Testing, Care and Treatment of Hepatitis B and C Virus Infection; Ministry of Health, Republic of Uganda: Kampala, Uganda, 2019; pp. 1–60. [Google Scholar]
  35. World Health Organization. Guidelines on Hepatitis B and C Virus Testing. Feburary 2017; WHO: Geneva, Switzerland, 2017. [Google Scholar]
  36. Kafeero, H.M.; Ndagire, D.; Ocama, P.; Kato, C.D.; Wampande, E.; Kajumbula, H.; Kateete, D.; Walusansa, A.; Kudamba, A.; Edgar, K.; et al. Disproportionate Distribution of HBV Genotypes A and D and the Recombinant Genotype D/E in the High and Low HBV Endemic Regions of Uganda: A Wake-Up Call for Regional Specific HBV Management. Int. J. Hepatol. 2022, 2022, 1–15. [Google Scholar] [CrossRef] [PubMed]
  37. Ga, N.; Fontana, R.; Gioffreda, D.; Valvano, R.; Iacobellis, A.; Facciorusso, D.; Niro, G.A.; Fontana, R.; Gioffreda, D.; Rosa, M.; et al. Tumor necrosis factor gene polymorphisms and clearance or progression of hepatitis B virus infection. Liver Int. 2005, 25, 1175–1181. [Google Scholar]
  38. Chen, J.; Yin, J.; Tan, X.; Zhang, H.; Zhang, H.; Chen, B. Improved multiplex-PCR to identify hepatitis B virus genotypes A-F and subgenotypes B1, B2, C1 and C2. J. Clin. Virol. 2007, 38, 238–243. [Google Scholar] [CrossRef] [PubMed]
  39. Chavan, Y.G.; Pawar, S.R.; Wani, M.; Raut, A.D.; Misra, R.N.; Biotechnology, D.Y.P.; Vidyapeeth, P.D.Y.P. Hepatitis B virus DNA polymerase gene polymorphism based prediction of genotypes in chronic HBV patients from Western India. Afr. Health Sci. 2017, 17, 762–772. [Google Scholar] [CrossRef] [PubMed]
  40. Kao, P.; Wu, J.; Ni, Y.; Lin, Y.; Chen, H.; Hsu, S.H.; Hsu, H. Tumour necrosis factor- a promoter region polymorphisms affect the course of spontaneous HBsAg clearance. Liver Int. 2010, 30, 1448–1453. [Google Scholar] [CrossRef] [PubMed]
  41. Masatoshi, N.; Roychoudhury, A. Genic Variation within and between the Three Major Races of Man, Caucasoids, Negroids, and Mongoloids. Am. J. Hum. Genet. 1974, 26, 421–443. [Google Scholar]
  42. Chen, X.; Zhang, L.; Chang, Y.; Shen, T.; Wang, L.; Zhuang, H.; Lu, F. Association of TNF-α genetic polymorphisms with hepatocellular carcinoma susceptibility: A case-control study in a Han Chinese population. Int. J. Biol. Markers 2011, 26, 181–187. [Google Scholar] [CrossRef]
  43. Kummee, P.; Tangkijvanich, P.; Poovorawan, Y.; Hirankarn, N. Association of HLA-DRB1 * 13 and TNF- a gene polymorphisms with clearance of chronic hepatitis B infection and risk of hepatocellular carcinoma in Thai population. J. Viral Hepat. 2007, 14, 841–848. [Google Scholar] [CrossRef]
  44. Kew, M.C.; Kramvis, A.; Yu, M.C.; Arakawa, K.; Hodkinson, J. Increased Hepatocarcinogenic Potential of Hepatitis B Virus Genotype A in Bantu-Speaking Sub-Saharan Africans. J. Med. Virol. 2005, 521, 513–521. [Google Scholar] [CrossRef]
  45. Mahgoub, S.; Candotti, D.; El Ekiaby, M.; Allain, J. Hepatitis B Virus (HBV) Infection and Recombination between HBV Genotypes D and E in Asymptomatic Blood Donors from Khartoum, Sudan. J. Clin. Microbiol. 2011, 49, 298–306. [Google Scholar] [CrossRef]
  46. Kafeero, H.M.; Ndagire, D.; Ocama, P.; Kato, C.D.; Wampande, E.; Walusansa, A.; Kajumbula, H.; Kateete, D.; Sendagire, H. Hepatitis B virus (HBV) serological patterns among the HBsAg negative hospital attendees screened for immunization. Sci. Rep. 2022, 12, 7425. [Google Scholar] [CrossRef] [PubMed]
  47. Brechot, C.; Naupas, B.; Couronce, A.M. Evidence that Hepatitis B Has a Role in Liver-Cell Carcinoma in Alcoholic Liver Disease. N. Engl. J. Med. 1982, 306, 1384–1387. [Google Scholar] [CrossRef] [PubMed]
  48. Kafeero, H.M.; Ndagire, D.; Ocama, P.; Kudamba, A.; Walusansa, A.; Sendagire, H. Prevalence and predictors of hepatitis B virus (HBV) infection in east Africa: Evidence from a systematic review and meta-analysis of epidemiological studies published from 2005 to 2020. Arch. Public Health 2021, 79, 167. [Google Scholar] [CrossRef] [PubMed]
  49. Bwogi, J.; Braka, F.; Makumbi, I.; Mishra, V.; Bakamutumaho, B.; Nanyunja, M.; Opio, A.; Downing, R.; Biryahwaho, B.; Lewis, R.F. Hepatitis B infection is highly endemic in Uganda: Findings from a national serosurvey. Afr. Health Sci. 2009, 9, 98–108. [Google Scholar]
  50. Halfon, P.; Bourlière, M.; Pol, S.; Benhamou, Y.; Ouzan, D.; Rotily, M. Multicentre study of hepatitis B virus genotypes in France: Correlation with liver fibrosis and hepatitis B e antigen status. J. Viral Hepat. 2006, 13, 329–335. [Google Scholar] [CrossRef]
  51. Koedijk, F.; van Houdt, R.; Op de Coul, E.; Dukers, N.; Niesters, H.; Mostert, M.; Al, E. Hepatitis B virus transmission patterns in the Netherlands, 2004. Ned Tijdschr Geneeskd 2008, 152, 2673–2680. [Google Scholar]
  52. Sanchez-Tapias, J.; Costa, J.; Mas, A.; Bruguera, M.; Rodes, J. Influence of hepatitis B virus genome on the long-term outcome of chronic hepatitis B virus in western patients. Gastroenterology 2002, 123, 1848–1856. [Google Scholar] [CrossRef]
  53. Erhardt, A.; Blondin, D.; Hauck, K.; Sagir, A.; Kohnle, T.; Heintges, T. Response to interferon alfa is hepatitis B virus genotype dependent: Genotype A is more sensitive to interferon than genotype D. Gut 2005, 54, 1009–1013. [Google Scholar] [CrossRef]
  54. Wai, C.; Chu, C.; Hussain, M. HBV genotype B is associated with better response to interferon therapy in HBeAg (+) chronic hepatitis than genotype C. Hepatol. Hepatol. 2002, 36, 1425–1430. [Google Scholar]
  55. Yousif, M.; Mudawi, H.; Bakhiet, S. Molecular characterization of hepatitis B virus in liver disease patients and asymptomatic carriers of the virus in Sudan. BMC Infect. Dis. 2013, 13, 328. [Google Scholar] [CrossRef]
Figure 1. Representative results of the One Step Hepatitis B Virus Combo Test Cassette for the HBV serological markers among the HBsAg negative participants. Abbreviations: HBsAg, hepatitis B surface antigen; HBV, hepatitis B virus; HBsAb, hepatitis B surface antibody; HBeAb, hepatitis B pre-core antibody; HBcAb, hepatitis B core antibody.
Livers 03 00037 g001
Figure 2. Screening algorithm used to obtain the samples for inclusion in the evaluation of the TNF-α-863 and 1031 single nucleotide polymorphisms. Abbreviations: HBsAg, hepatitis B surface Antigen; HBV, hepatitis B virus; HBsAb, hepatitis B surface antibody; HBeAb, hepatitis B pre-core antibody; HBcAb, hepatitis B core antibody; TNF, tumor necrosis factor; LER, low endemic region; and HER, high endemic region.
Livers 03 00037 g002
Figure 3. A 2% agarose gel electrophoresis for the PCR products. Lane M shows the DNA 100 bp marker (Amersham Biosciences, Buckinghamshire, UK); lanes 5, 6, 8–11, and 15–17 show the HBV pol gene amplicons. Lanes 1–4, 7, 12–14, and 18 are negative samples for the HBV pol gene.
Livers 03 00037 g003
Figure 4. Graphs showing FASTA format sequences with the corresponding chromatograms from BioEdit for the representative sequences: KIT05 (for Kitgum) and KB63 (for Kibuku).
Livers 03 00037 g004
Figure 5. A 1.5% agarose gel electrophoresis of the PCR products. Lane L shows the DNA 100 bp marker (Amersham Biosciences, Buckinghamshire, UK); lanes 1–10 and 11–27 show the amplicons for the human TNF-α gene.
Livers 03 00037 g005
Figure 6. Sequence analysis of the TNF-α gene from the samples using the reference genotype from the NCBI gene bank (Ref. No MH180382.1 Homo sapiens isolate RKL WG_new TNF-alpha gene); * Wild type alleles.
Livers 03 00037 g006
Table 1. Socio-demographic characteristics of the participants screened for HBsAg serostatus from both the high and low endemic regions who participated in the study regarding the SNP analysis for TNF-α-863C/A and 1031T/A.
VariableStatusLow EndemicHigh Endemic
NumberPercentageNumberPercentage
HBsAgNegative3050.8%2645.6%
Positive2949.2%3154.4%
SexFemale2949.2%2849.1%
Male3050.8%2950.9%
Age category Elderly ≥ 6046.8%35.3%
Middle aged (31–59)2949.2%3256.1%
Young adults (18–30)2644.1%2238.6%
Marital statusDivorced58.5%610.5%
Married3661.0%3561.4%
Single1828.8%1628.1%
Education levelPost-Secondary1220.3%915.8%
Primary2339.0%2747.4%
Secondary1728.8%1628.1%
Unknown711.9%58.8%
Total 59100.0%57100.0%
HBsAg: hepatitis B surface antigen.
Table 2. Genotype, sub-genotype, recombinant genotype, and viral load distribution in the low and high endemic regions.
Variable Low Endemic, n (%) High Endemic, n (%)OR (95% CI) p Value
HBV genotype
A10 (34.5%)7 (22.6%)1.00 (Reference)
D5 (17.2%)11(35.5%)1.54 (0.3678 to 6.4478)0.5545
Sub-genotype
A112 (41.4%)1 (3.2)1.00 (Reference)
D40 (0.0%)1 (3.2%)25.0 (0.6688 to 934.5048)0.0815
Mixed genotype
D/E2 (6.9%)11 (5.53%)0.26 (0.04338 to 1.5552)0.1398
Viral load (IU/mL)
<20,00017 (58.6%)23 (74.2%)1.00 (Reference)
≥20,00012 (41.4%)8 (25.8%)4.07 (1.3661 to 12.1431)0.0117 *
HBV: hepatitis B virus. * p < 0.05 significant at the 95% confidence interval.
Table 3. Genotype and allele frequencies of the TNF-α-863C/A and TNF-α-1031T/C gene in patients and controls from the low endemic area.
Low Endemic HBsAg+, n (%)HBsAg−, n (%)OR (95%CI)p Value
TNF-α-863C/A
Genotypes
C>A1 (3.45)1 (3.3)1.00 (reference)
CC28 (96.5)29 (96.7)1.0357 (0.06173 to 17.3775)0.9805
Allele
A2 (3.45)2 (3.3)1.00 (reference)
C56 (96.5)58 (96.7)1.0357 (0.141 to 7.6079)0.9725
TNF-α-1031T/C
T>C2 (6.9)1 (3.3)1.00 (reference)
TT27 (93.1)29 (96.7)2.1481 (0.1841 to 25.0699)0.5419
Allele
C4 (6.9)2 (3.3)1.00 (reference)
T54 (93.1)58 (96.7)2.1481 (0.378 to 12.207)0.3884
Low endemic
TNF-α-863C/A
Genotypes
C>A1 (3.23)2 (7.7)1.00 (reference)
CC30 (9.68)24 (92.3)0.400 (0.03418 to 4.6809)0.4653
Allele
A2 (3.23)4 (7.7)1.00 (reference)
C60 (9.68)48 (92.3)0.400 (0.07026 to 2.2774)0.3018
TNF-α-1031T/C
Genotypes
T>C2 (6.45)3 (11.1)1.00 (reference)
TT29 (9.35)24 (88.9)0.55 (0.0851 to 3.5768)0.5329
Allele
C4 (6.45)6 (11.1)1.00 (reference)
T58 (93.5)48 (88.9)0.57 (0.1523 to 2.1447)0.4069
TNF: tumor necrosis factor.
Table 4. Distribution of the TNF-α-863C/A and TNF-α-1031T/C genotypes and alleles in the low and high endemic regions.
SNPEndemicity AlleleAllele Frequency, n (%)95%CIp Value
TNF-α-863C/ALow C114 (96.6)
A4 (3.4)43.99% to 97.09%<0.0001 *
High C109 (95.6)
A5 (4.4)47.04% to 96.08%<0.0001 *
TNF-α-1031T/CLow T 112 (94.9)
C6 (5.1)49.59% to 95.3%<0.0001 *
HighT105 (92.1)
C9 (7.9)51.5% to 91.99%<0.0001 *
GenotypeGenotype frequency, n (%)
TNF-α-863C/ALow CC57 (96.6)
C>A2 (3.4)28.03% to 97.36%<0.0001 *
HighCC54 (94.7)
C>A2 (3.5)25.91% to 96.12%<0.0001 *
TNF-α-1031T/CLow TT56 (94.9)
T>C3 (5.1)33.71% to 95.77%<0.0001 *
High TT52 (92.9)
T>C4 (7.1)36.05% to 93.77<0.0001 *
TNF: tumor necrosis factor; * p < 0.05 significant at the 95% confidence interval.
Disclaimer/Publisher’s Note: The statements, opinions and data contained in all publications are solely those of the individual author(s) and contributor(s) and not of MDPI and/or the editor(s). MDPI and/or the editor(s) disclaim responsibility for any injury to people or property resulting from any ideas, methods, instructions or products referred to in the content.