1. Introduction
In energy equipment, nuclear power plants, aerospace systems, and chemical storage and transportation systems, gas-sealing reliability is a key factor for long-term safe operation [
1]. Long-duration pressure-holding tests are widely used to verify sealing integrity and prevent safety events caused by working-medium leakage [
2]. Among these tests, the airtightness pressure-holding test of hydrogen-cooled generator systems is a critical task during nuclear power unit outages [
3,
4]. Its assessment accuracy and test duration directly affect unit safety and maintenance economics [
5,
6]. Hydrogen has a low molecular weight, high diffusivity, and a wide flammability range [
7]. Even small leakage may lead to unit shutdown or safety events [
8]. Therefore, strict requirements are imposed on the airtightness assessment of hydrogen-cooled systems in nuclear power plants [
9]. In China, the Test Methods and Evaluation for Airtightness of Hydrogen-Cooled Electrical Machines and nuclear power maintenance procedures usually use the 24 h pressure-holding result as the basis for airtightness assessment to ensure the reliability of the test result.
Existing engineering assessment methods for airtightness tests mainly rely on empirical thresholds or simplified calculations based on the slope of the pressure curve. These methods assume that the pressure decay process is approximately stable and that pressure variation can be directly mapped to the actual leakage rate of the system. However, during field pressure-holding tests of hydrogen-cooled generator systems in nuclear power plants, the early-stage pressure signal is often affected by several non-steady physical processes. As a result, the pressure curve shows clear nonlinearity and non-stationarity. It is difficult to directly relate the early pressure signal to the true sealing state of the system. First, pressure and temperature follow the ideal gas equation, but the internal structure of the generator is complex, and the heat-capacity distribution is nonuniform. After hydrogen charging, the system needs a relatively long time to reach thermal equilibrium. Day–night ambient temperature variation may also cause slight casing deformation and gas temperature fluctuation. These effects lead to periodic pressure variation over the 24 h test period. If the test duration is too short, the observed pressure drop may be a pseudo-leakage caused by temperature variation. Second, gas–liquid mass transfer in the seal oil system further increases the difficulty of interpretation [
10]. During the contact between seal oil and hydrogen, part of the gas dissolves into the oil, according to Henry’s law, and migrates with the oil circuit. This effect is more pronounced in the early stage before dissolution saturation is reached. Such gas loss may be misinterpreted as pressure decay caused by sealing failure. In addition, micropore diffusion at shaft seals, material permeation at end covers, and the coupling of multiple physical effects further blur the boundary between true leakage and measurement disturbance.
However, the redundant 24 h pressure-holding duration significantly extends the critical path of nuclear power unit outages. For a gigawatt-class nuclear power unit, each additional hour of pressure holding may lead to considerable generation-revenue loss. At the same time, traditional methods cannot effectively distinguish pseudo-leakage from true leakage trends in the early stage of the test. This has become a key bottleneck for improving nuclear power maintenance efficiency [
11]. Scientifically shortening the pressure-holding duration while maintaining assessment safety and accuracy has become an important engineering problem in nuclear power equipment maintenance optimization [
12,
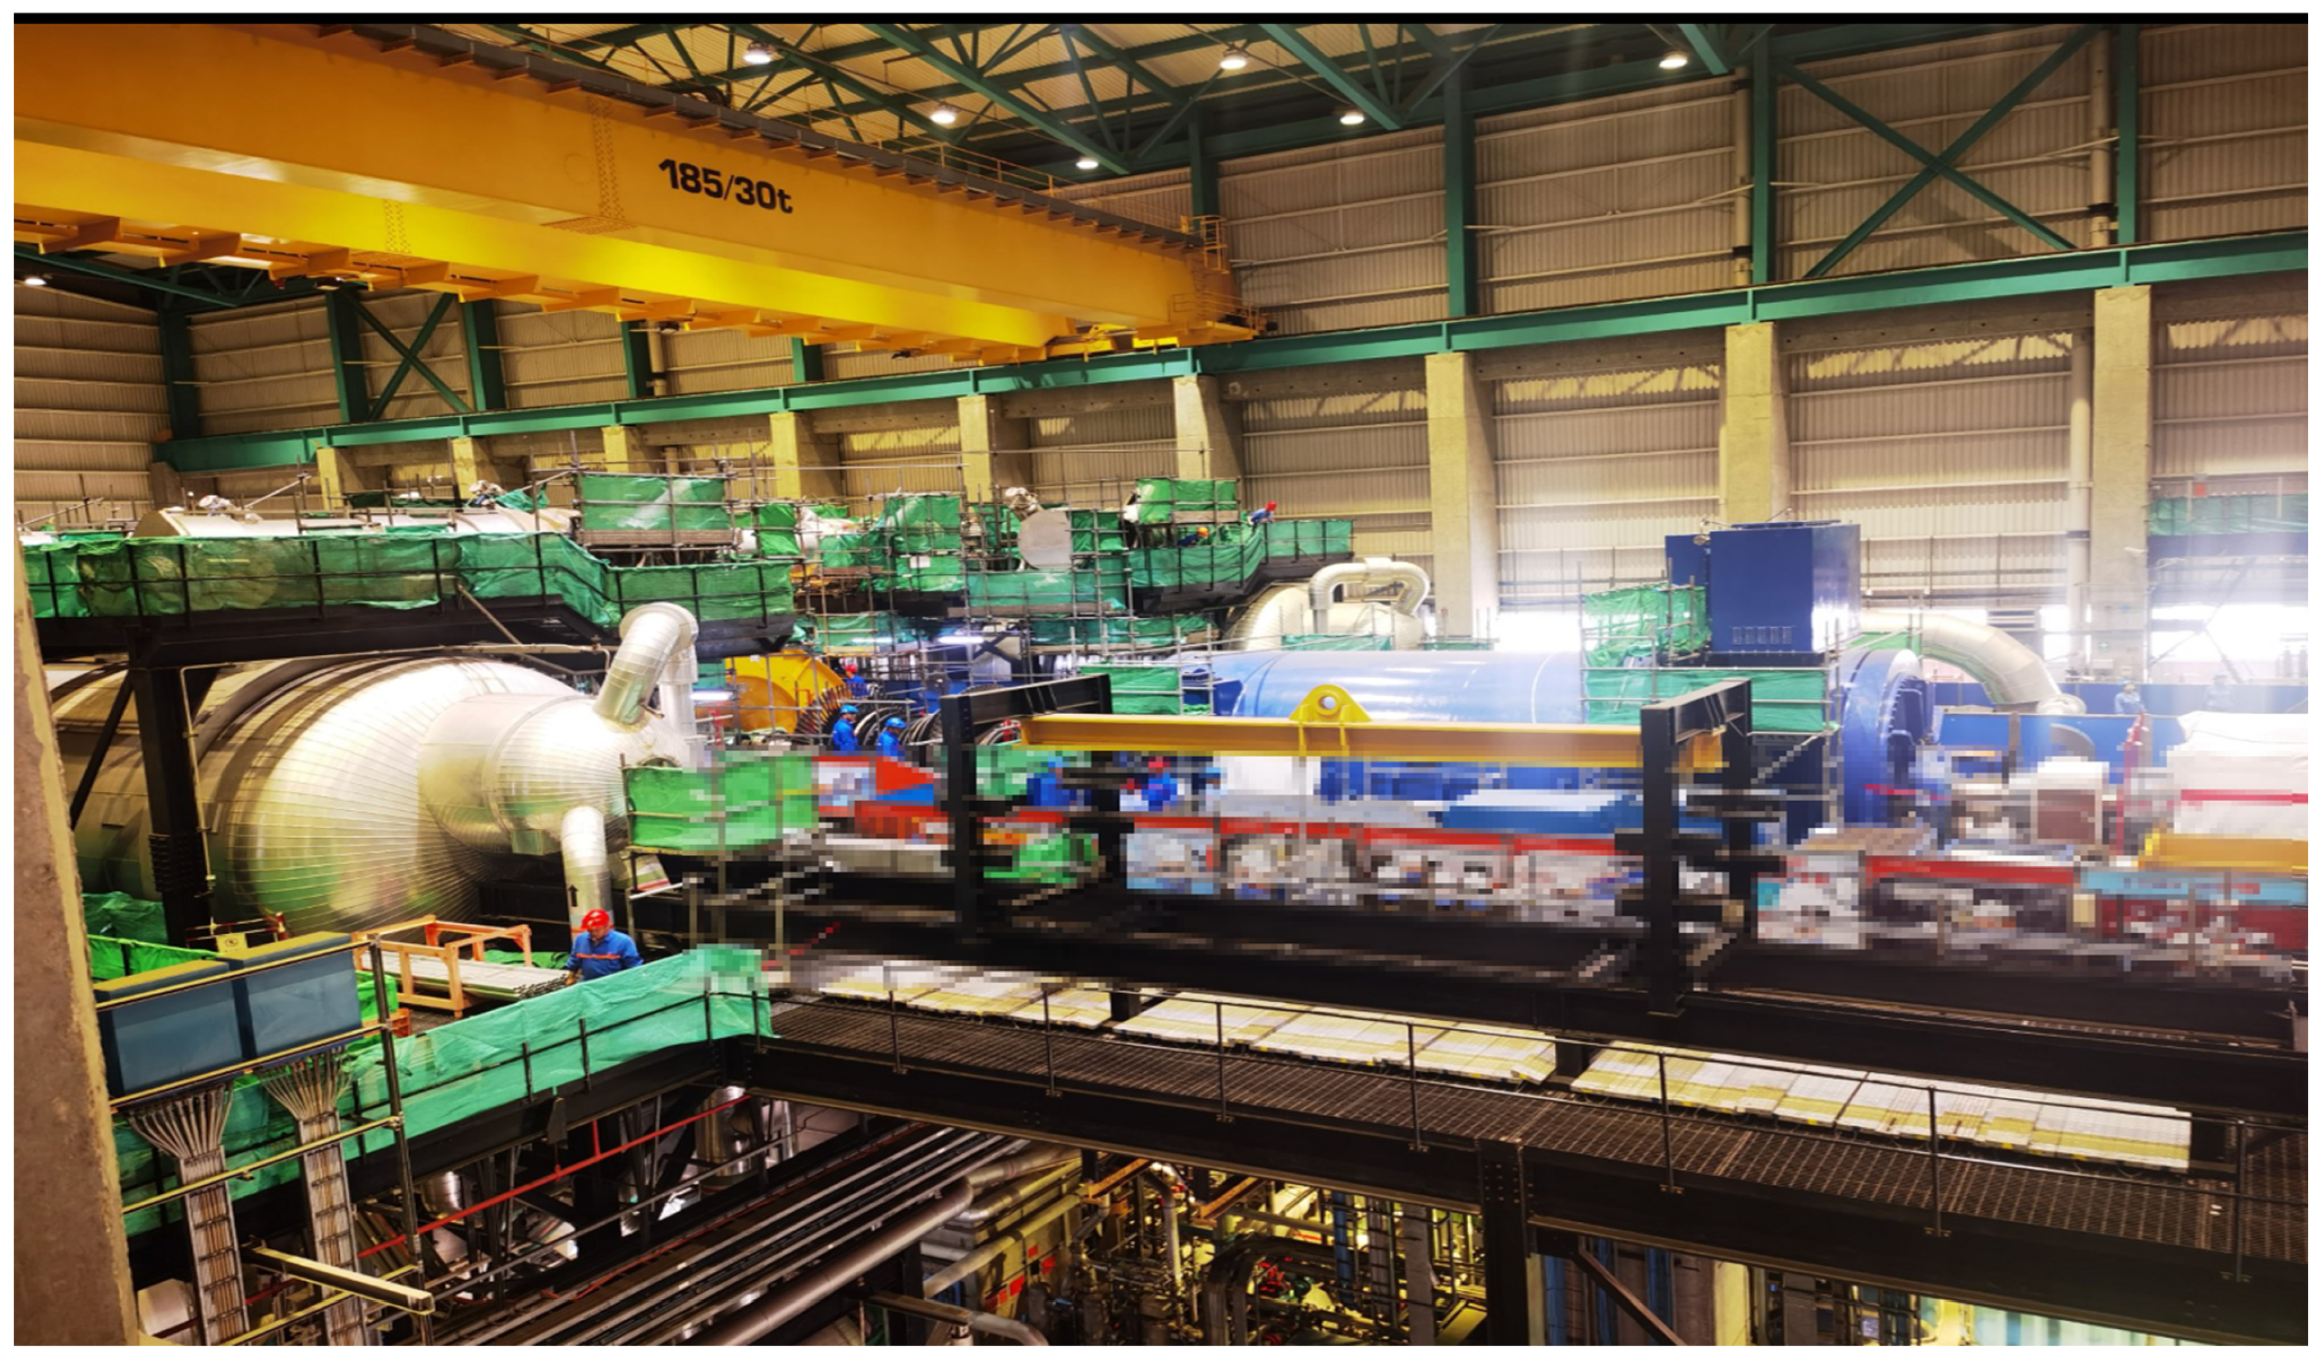
13]. The field implementation of the airtightness pressure-holding test is shown in
Figure 1.
In recent years, data-driven methods have been widely used in energy equipment condition monitoring, industrial time-series analysis, and equipment anomaly detection [
14]. For operation and maintenance data accumulated over long periods in nuclear power plants, data-driven methods can extract temporal evolution features from multivariate time-series signals that are difficult to identify using traditional empirical assessment [
15]. These features can provide auxiliary evidence for equipment condition assessment. Previous studies have applied machine learning, recurrent neural networks, and convolutional neural networks to operating parameter prediction, equipment fault diagnosis, and small-sample imbalanced fault recognition in nuclear power systems [
16,
17,
18]. These studies show that data-driven modeling can assist in identifying system state evolution under complex noise conditions. However, the airtightness pressure-holding test of hydrogen-cooled generator systems has clear field engineering constraints and safety boundaries. General fault diagnosis methods cannot be directly used to support early termination of the test. Existing studies still have three main limitations in this scenario. First, the time-series evolution of the 24 h airtightness pressure-holding process in hydrogen-cooled systems has not been fully analyzed. There is still a lack of historical-data-based evidence for the feasibility of short-duration assessment. Second, real failed samples in nuclear power plants are very rare, and the dataset is highly imbalanced [
19]. Directly trained supervised models tend to favor the majority class, which makes it difficult to strictly control the false-negative risk for failed samples in nuclear power applications [
20,
21]. Third, existing data-driven methods often rely on a single model output. They lack a conservative review mechanism for field execution, and thus, cannot fully balance early assessment with safety redundancy.
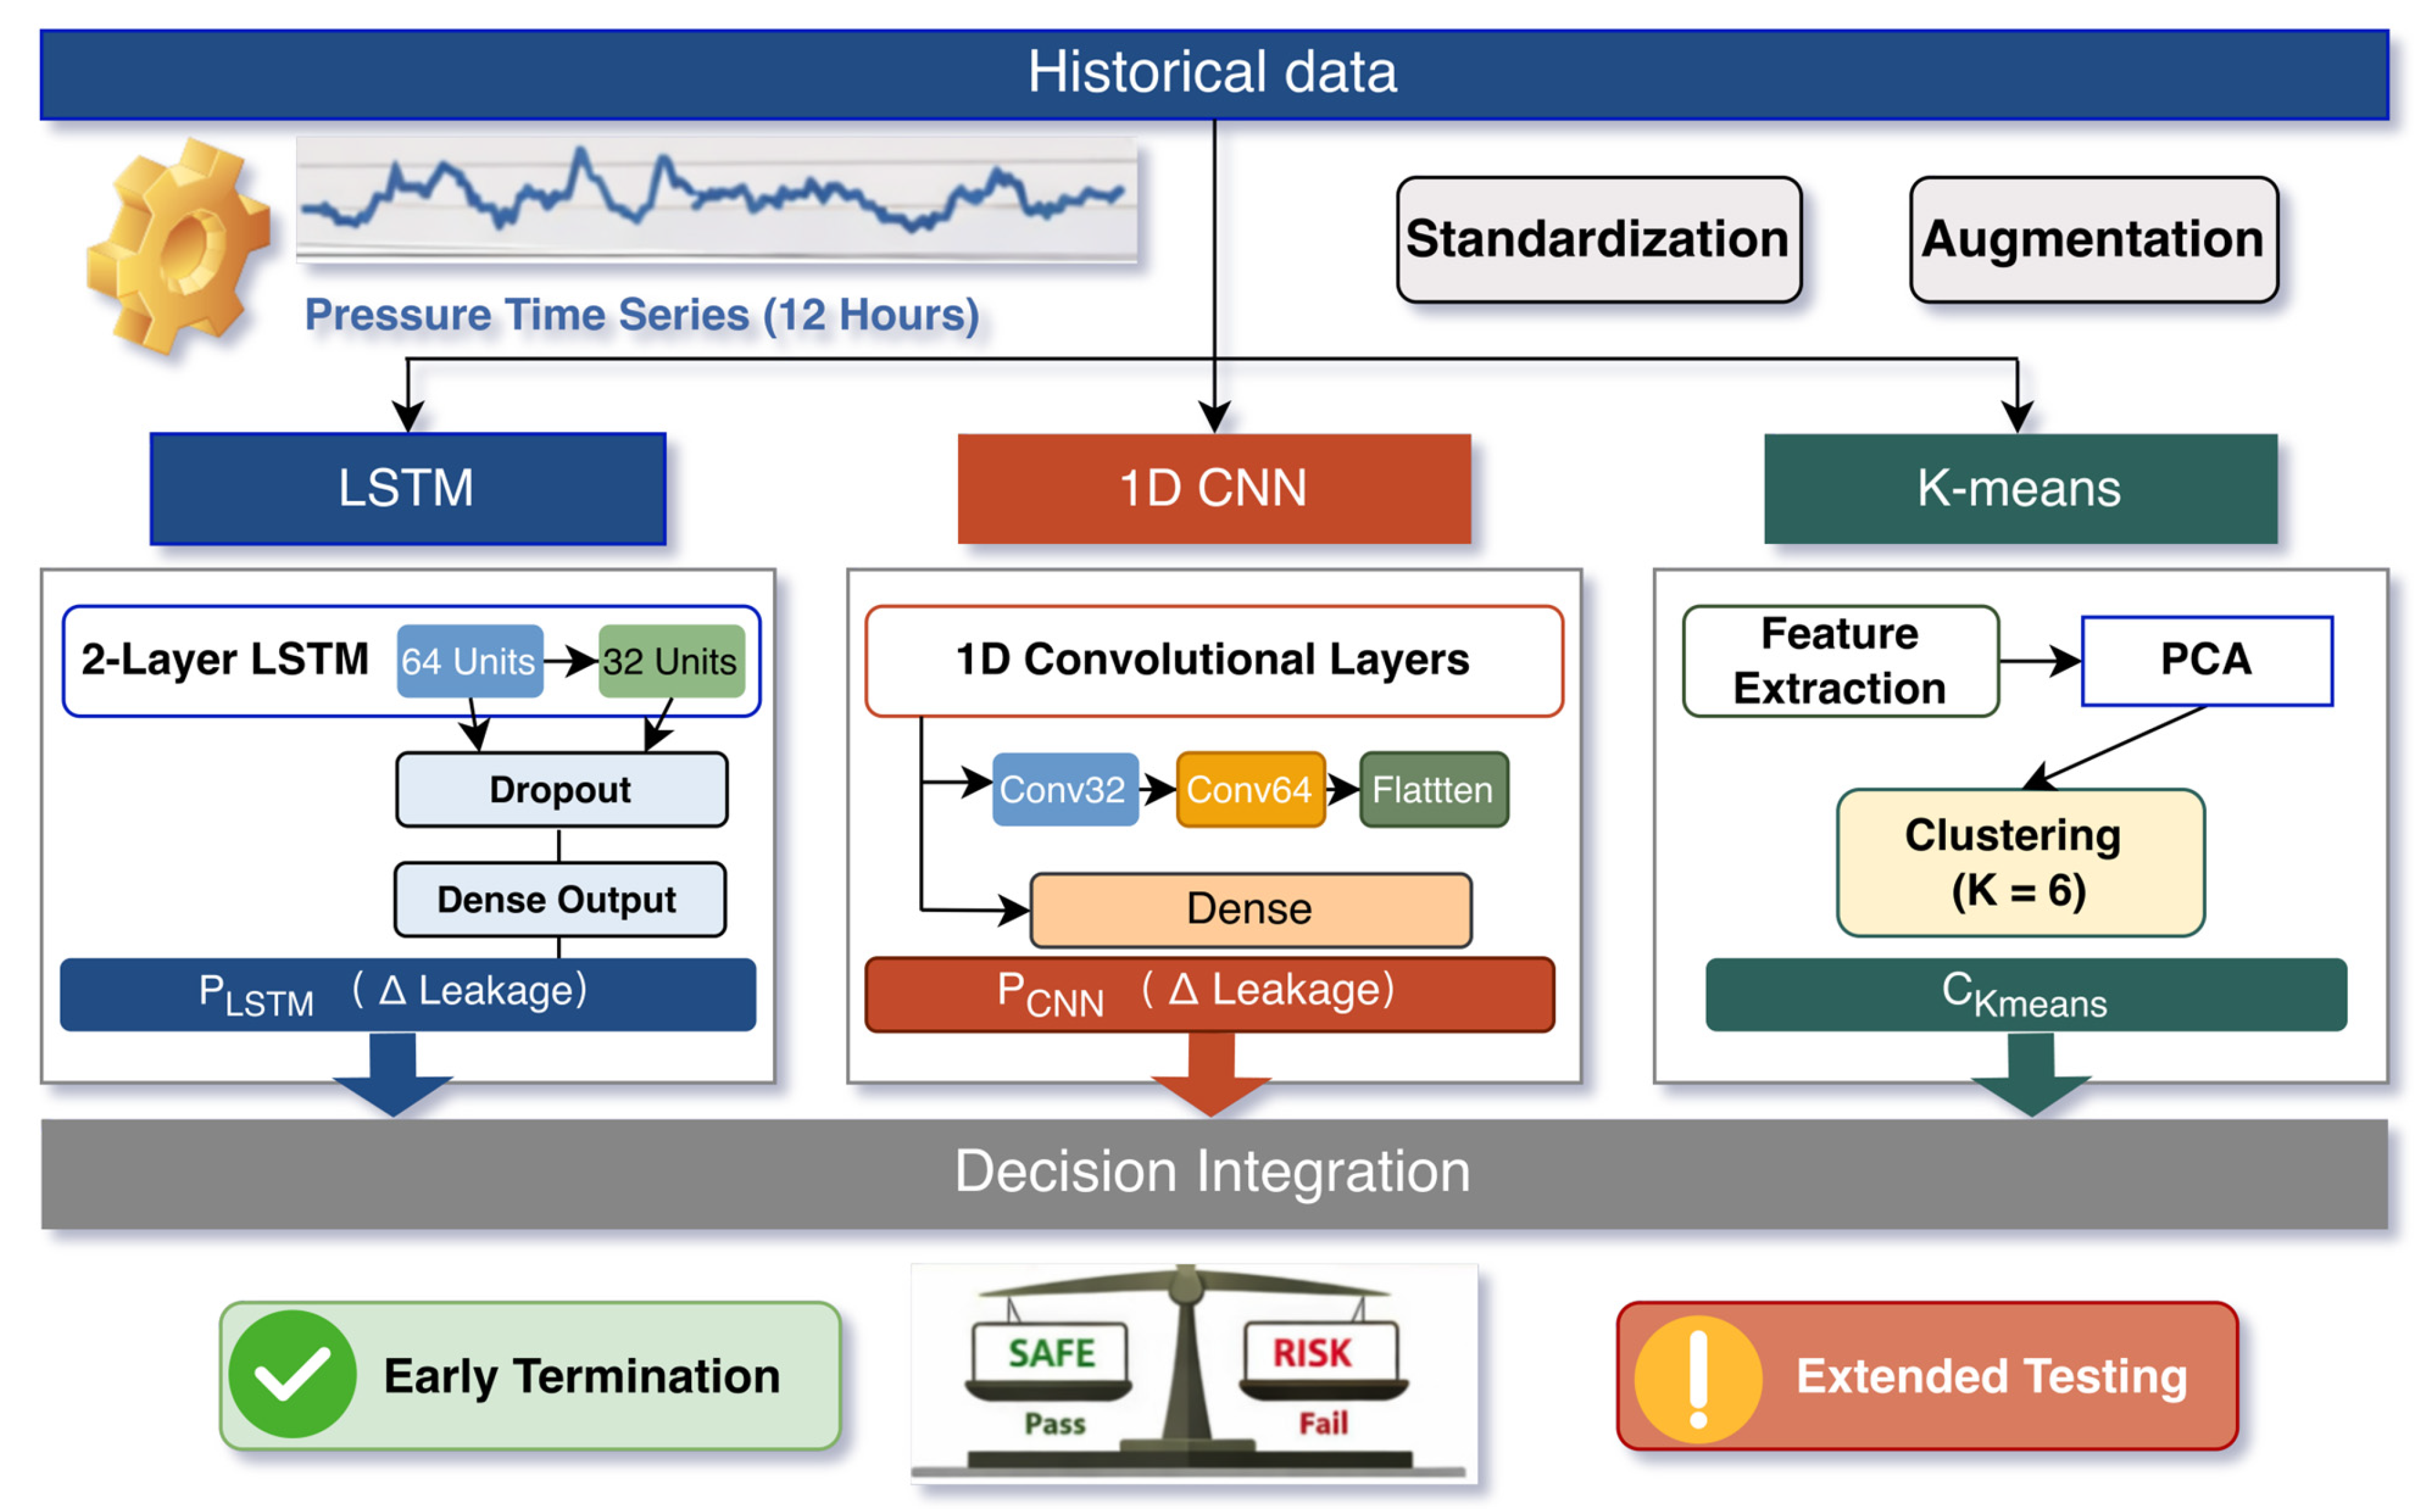
To address these problems, this study focuses on the airtightness test of hydrogen-cooled generator systems in nuclear power plants and proposes a short-duration auxiliary assessment framework for field application. The aim is to provide auxiliary evidence for test duration optimization and safety assessment through data-driven methods. Unlike approaches that mainly pursue classification accuracy, this study focuses more on conservativeness and reviewability in nuclear power field applications. When model outputs are consistent and far from the risk boundary, the system provides a short-duration auxiliary assessment result. When the prediction is close to the threshold, the model outputs are inconsistent, or the sample is located near an abnormal region in the feature space, the system triggers extended pressure holding and sliding-window review. This decision logic is used to control the false-negative risk for failed samples. The assessment workflow is shown in
Figure 2. First, pressure-holding test data from different plants are converted and standardized. Second, multivariate time-series features from the first 12 h are extracted, and synthetic minority over-sampling technique (SMOTE) is used during training to alleviate the scarcity of failed samples [
22]. Third, long short-term memory (LSTM), one-dimensional convolutional neural network (1D CNN), and principal component analysis (PCA)-assisted K-means are used to evaluate each sample from the perspectives of trend, local fluctuation, and feature-space distribution, respectively [
23,
24,
25]. Finally, consistency assessment and a one-vote veto strategy are used to generate field auxiliary recommendations.
The main contributions of this study are as follows. (1) Based on historical airtightness test data from hydrogen-cooled generator systems in multiple nuclear power plants, a unified equivalent leakage rate conversion and standardized data-processing procedure is established. This provides a consistent data basis for cross-plant comparison. (2) The staged evolution of pressure and temperature signals during the 24 h pressure-holding process is analyzed. The results show that the first 12 h data cover the key transition from a strongly non-stationary state to a quasi-steady state. This provides physical and data-based support for short-duration auxiliary assessment. (3) A multi-branch assessment framework is developed by combining LSTM-based trend prediction, 1D CNN-based local fluctuation identification, and PCA-assisted K-means-based feature-space validation. A conservative auxiliary decision process is formed by integrating a one-vote veto rule and dynamic review strategy. (4) The feasibility of the short-duration assessment method is verified using historical samples. False alarms, boundary samples, and extended pressure-holding strategies are also analyzed. The results provide an engineering reference for critical-path optimization during nuclear power outages.
2. Materials and Methods
A short-duration auxiliary assessment method is developed in this section for field airtightness pressure-holding tests in nuclear power plants. The existing 24 h pressure-holding acceptance criterion is retained. Instead, the 24 h leakage state is assessed in advance by using historical data and real-time monitoring data from the first 12 h. For samples that meet conservative criteria, auxiliary evidence can be provided to support the field decision on whether the test can be ended earlier. For samples with inconsistent model outputs, predictions close to the threshold, or abnormal locations in the feature space, continued pressure holding and further review are recommended by the system. In this design, the data-driven model is used to support field safety decisions and does not replace the existing standard or manual review process.
2.1. Industrial Criteria and Quantitative Acceptance Criterion for Airtightness
The dataset used in this study was obtained from pressure-holding test records of hydrogen-cooled generator systems collected over many years from eight nuclear power plants, denoted as Plants A to H. Detailed sample sizes and original acceptance criteria for each plant are summarized in
Table 1. The historical acceptance criteria, such as leakage-rate thresholds, pressure-drop indicators, and medium conversion methods, differed among plants. To ensure cross-plant comparability, the original measurements were standardized. Specifically, all observations were converted into an equivalent hydrogen leakage rate. The sample label was then determined according to whether the 24 h pressure-holding leakage rate exceeded the unified threshold. After data cleaning, 283 valid records were obtained. Among them, 276 samples were qualified, and only 7 were unqualified leakage samples. The dataset showed a pronounced class imbalance, with unqualified samples representing only a small fraction of the available records. This scarcity of leakage samples may lead to poor minority-class recognition and overfitting during model training. Typical field measurement records of the 24 h airtightness pressure-holding test are illustrated in
Table 2.
2.2. Analysis of Non-Stationary Physical Disturbances in Multivariate Sequences
The airtightness pressure-holding test of a hydrogen-cooled system is a key procedure for verifying the sealing integrity of a nuclear power generator. Its basic principle is based on the ideal gas equation. The equivalent hydrogen leakage rate is calculated from the pressure and temperature variations in a closed chamber during the pressure-holding period. The sealing performance is then judged according to industrial criteria. The ideal gas equation is shown in Equation (1):
The leakage-rate conversion used in this study follows the engineering calculation method adopted in field airtightness pressure-holding tests. Based on the ideal gas relation, the gas amount in the closed hydrogen-cooled system at time
can be written as:
where
and
= 273.15 +
T(
t). The gas amount loss between
and
is
Δ. This gas amount loss is then converted into the equivalent standard-state volume loss as
Finally, the equivalent 24 h leakage rate is calculated as
After substitution, this gives the engineering leakage-rate expression:
where
is the absolute pressure at time
,
is the internal generator pressure,
is the atmospheric pressure,
is the thermodynamic temperature,
is the measured temperature,
is the effective volume of the hydrogen-cooled system,
is the amount of hydrogen at time
,
is the ideal gas constant,
and
are the standard-state temperature and pressure,
is the gas amount loss between
and
,
is the equivalent standard-state volume loss, and
is the equivalent 24 h leakage rate. In field engineering conditions, the pressure–temperature time series during pressure holding is not an ideal steady-state process. It shows clear stage-wise evolution under the coupling of multiple physical effects. In the early stage, from 0 to 5 h, the system is affected by adiabatic compression heating, nonuniform heat distribution, and oil–gas coupling. The pressure and temperature signals fluctuate strongly and show significant non-stationarity. In this stage, pressure variation is mainly dominated by non-leakage disturbances. Therefore, it is difficult to reflect the true sealing state. As shown in
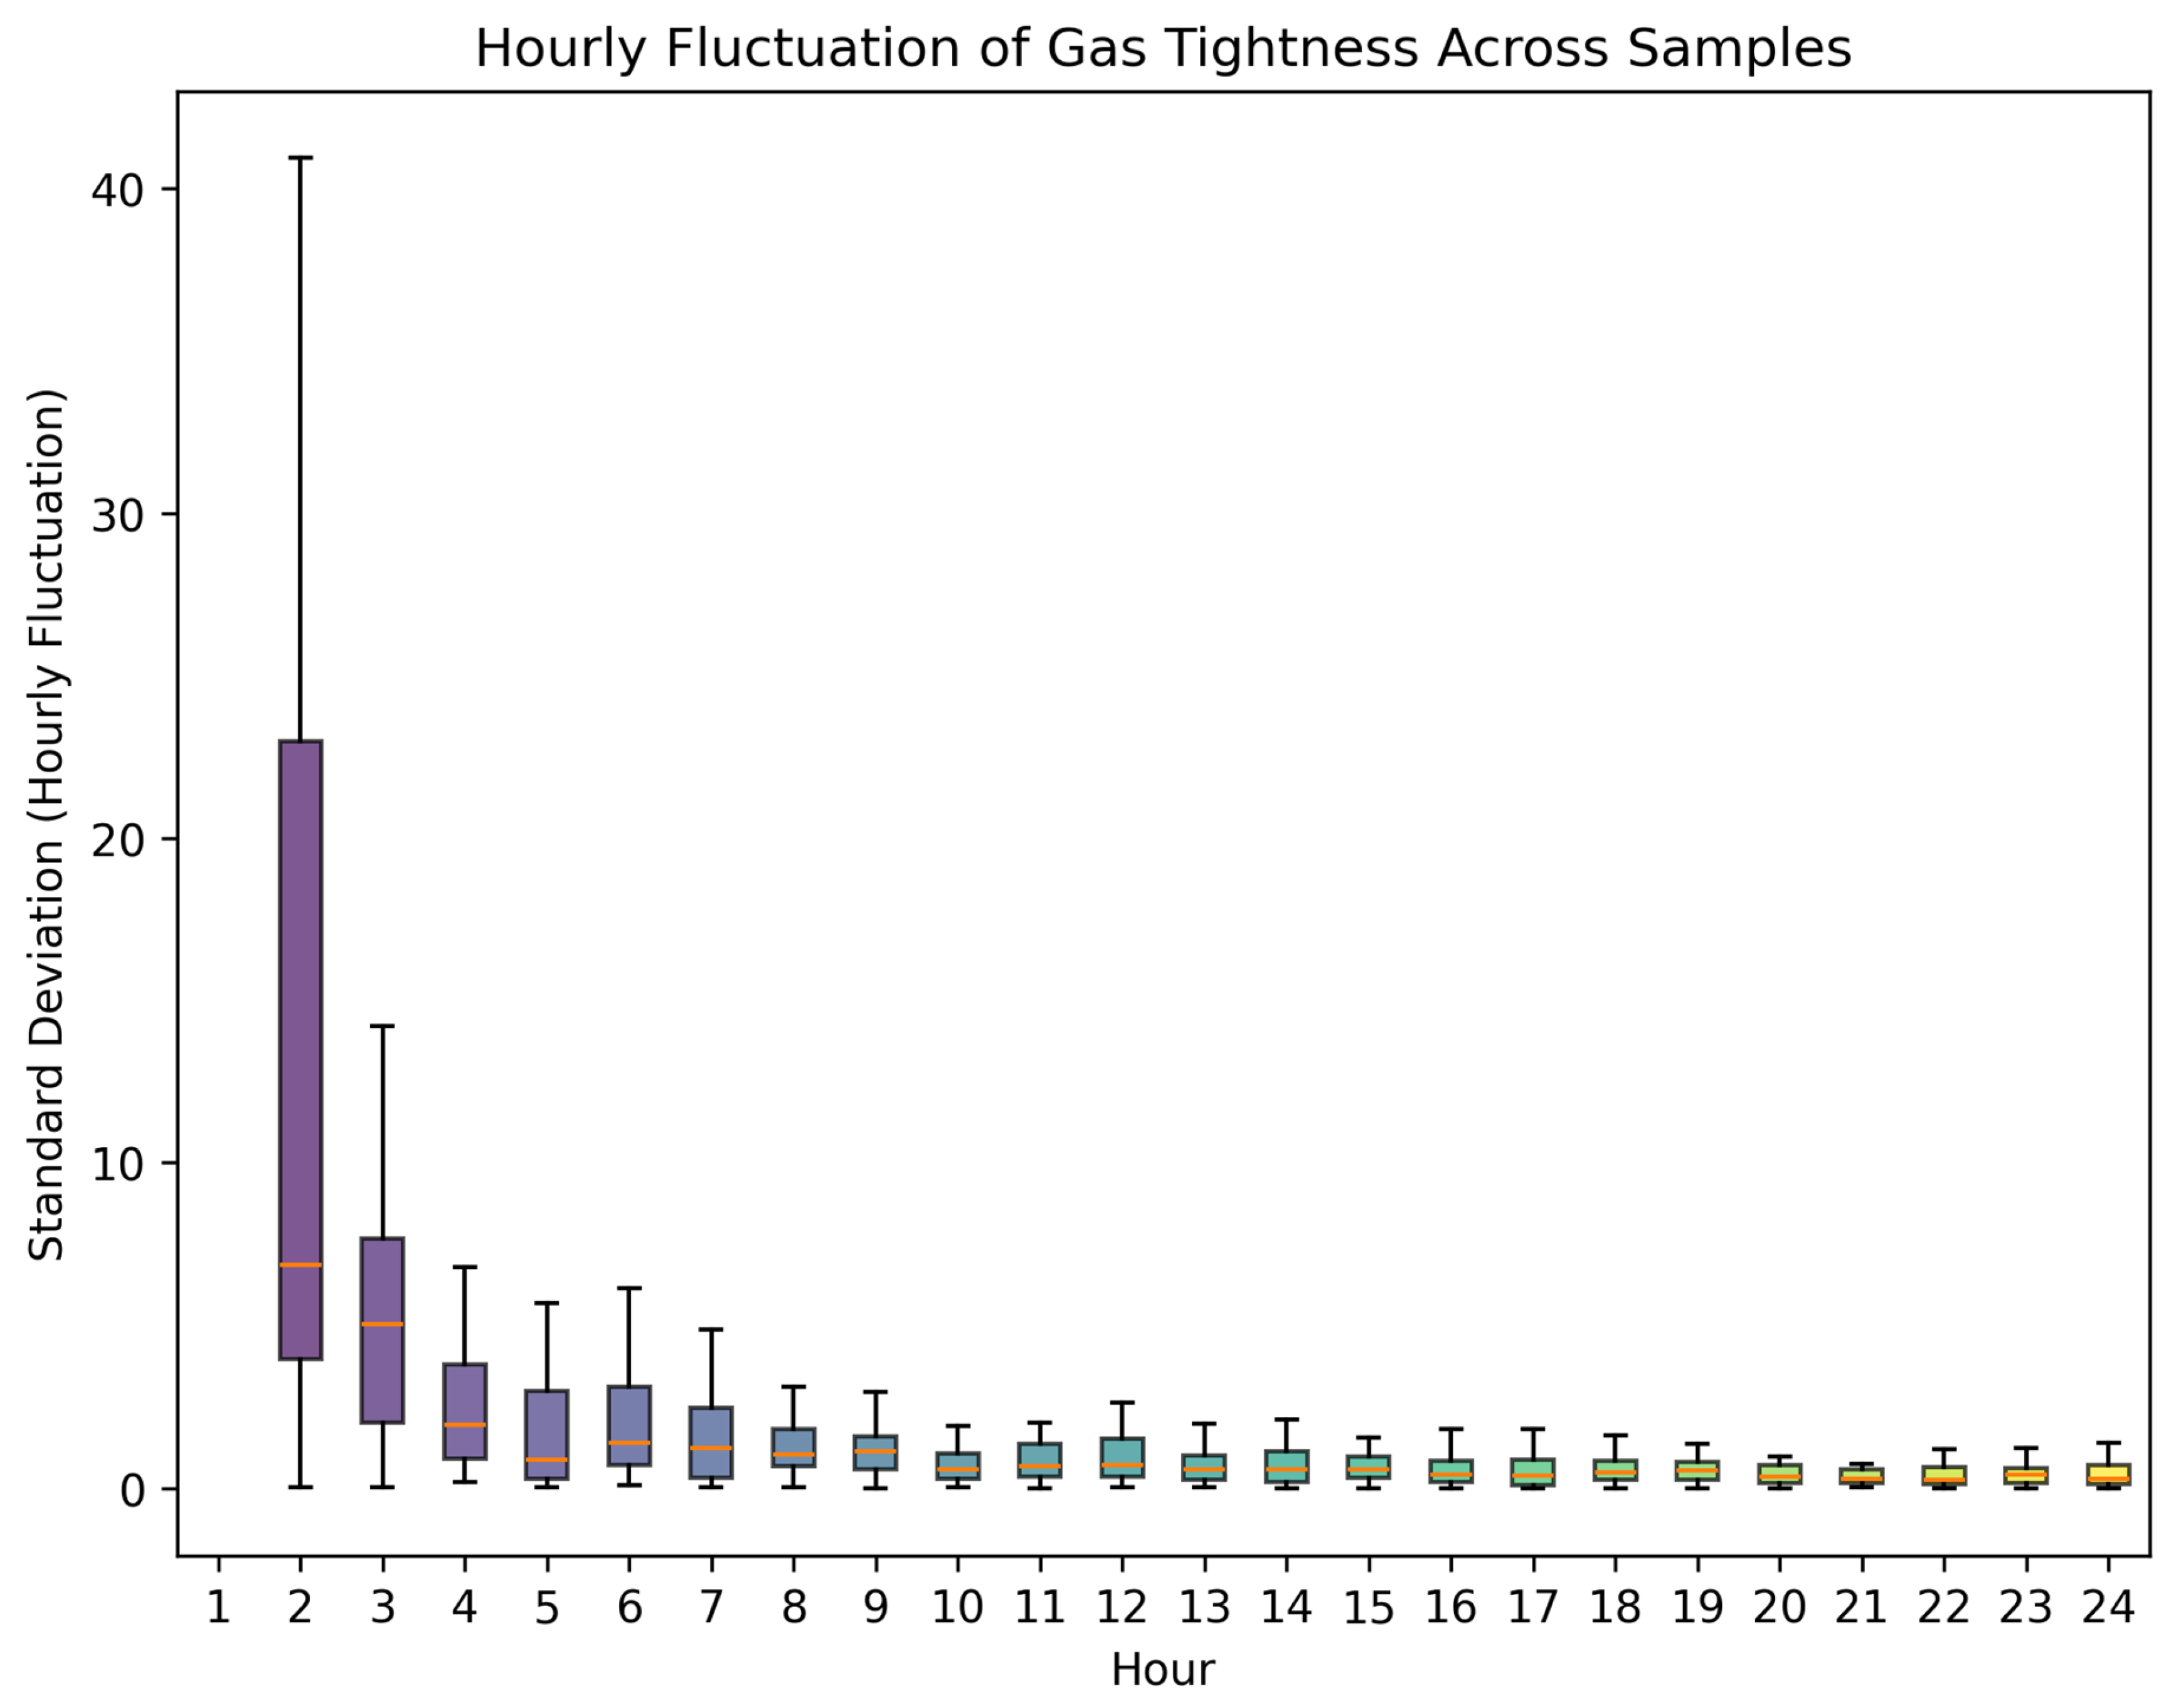
Figure 3, the pressure standard deviation of different samples is highly dispersed in this stage. The median and interquartile range are much higher than those in later periods. Some samples also show standardized fluctuation indicators that are clearly higher than those in later periods.
As time increases, pressure fluctuations gradually decrease, and the standard deviation drops significantly. Around 12 h, the fluctuation tends to become stable. The thermal equilibration process is largely completed, and the time-series changes begin to reflect true leakage behavior more clearly. After 12 h, the system further enters a quasi-steady thermodynamic state. The pressure mainly fluctuates slightly with ambient temperature, and its decay trend shows a more stable relationship with the actual leakage rate. This is one reason why existing industrial criteria use the 24 h pressure-holding result as the acceptance basis. Based on this evolution pattern, the time-series data from the first 12 h cover the transition from a strongly non-stationary state to a quasi-steady state. These data contain key information for distinguishing true leakage from pseudo-leakage disturbances. Therefore, they provide an important physical basis for data-driven leakage-trend prediction and pressure-holding duration optimization.
2.3. Synthetic Augmentation Strategy for Imbalanced Leakage Samples
Unqualified samples in field airtightness tests of nuclear power plants are typical low-frequency events. The dataset used in this study contains 283 valid records, but only 7 of them are unqualified samples. The class distribution is seriously imbalanced. Under this sample structure, a model trained directly on the original data tends to favor the majority qualified class. This may weaken its ability to identify unqualified samples. Considering the strict control of false-negative risk in nuclear power field applications, minority-class sample augmentation is introduced during training. This strategy is used to improve the learning ability of the model near the unqualified decision boundary. SMOTE generates synthetic samples by linear interpolation between minority-class samples and their nearest neighbors. Its expression is shown in Equation (6):
where o is the original minority-class sample, x is its neighboring sample, and rand(0,1) is a random number between 0 and 1. Compared with simple replication of minority-class samples, SMOTE can expand the feature space near unqualified samples to some extent. It also helps reduce majority-class bias.
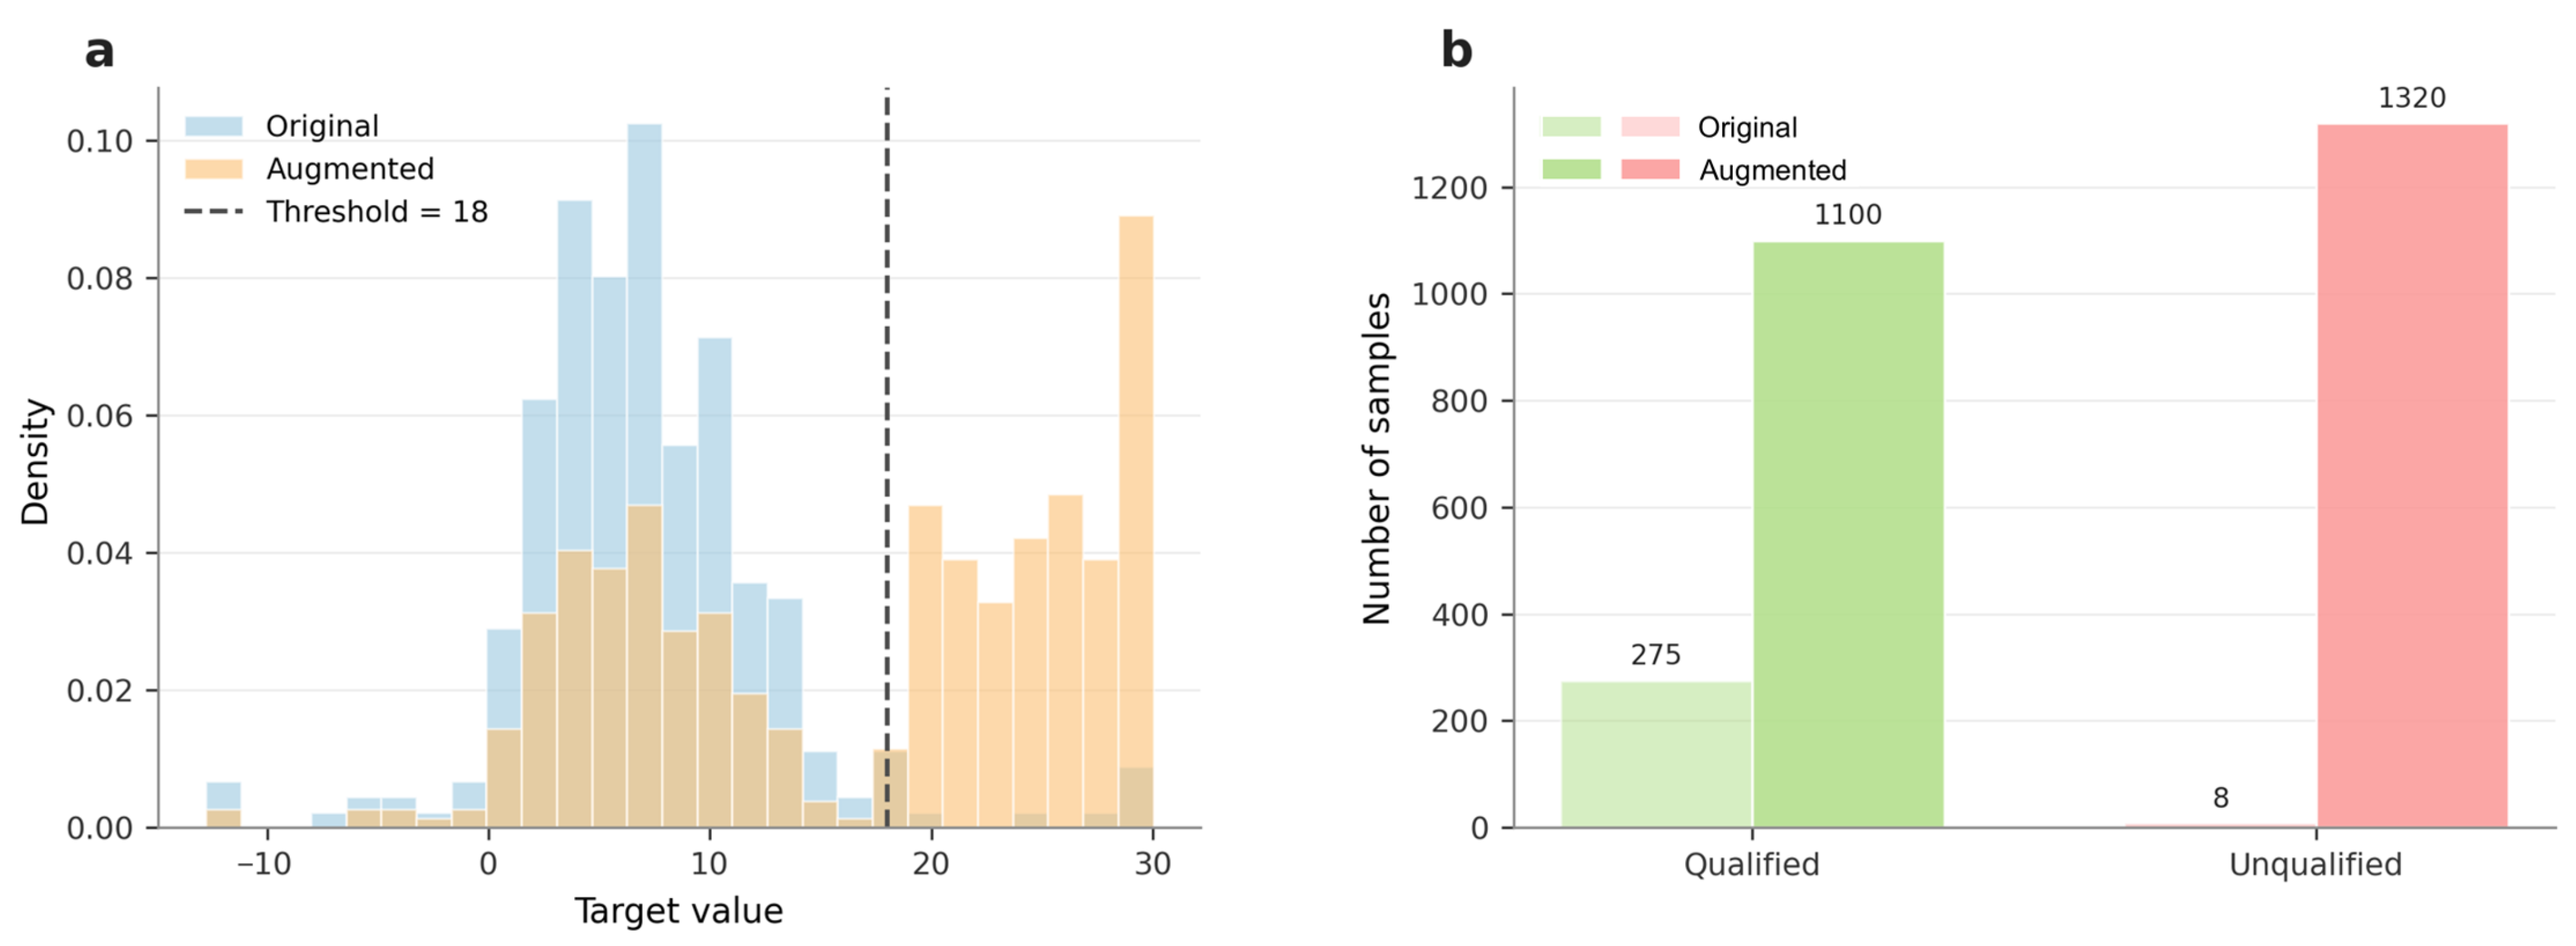
By comparing the target-value density distributions before and after augmentation, the augmented data show improved coverage around the sparse high-target-value region while maintaining a similar overall distribution to the original data, as shown in
Figure 4a. The black dashed line denotes the acceptance threshold. This helps fill the sparse high-target-value region in the original data. The class distribution comparison further shows that the original dataset has a clear class imbalance, with very few unqualified samples. After augmentation, the number of samples in the high-leakage-rate region increases substantially, and the class distribution becomes more balanced than that of the original dataset. This partly reduces the potential model bias caused by class imbalance and improves the representation of boundary and unqualified conditions during training, as shown in
Figure 4b.
The augmented samples are used only as a feature-space supplement during training. They cannot replace real unqualified field samples from nuclear power plants. To avoid overly optimistic evaluation caused by synthetic samples, the validation set retains the original historical sample distribution. The evaluation focuses on whether unqualified samples are missed and whether boundary samples trigger conservative review. In addition to SMOTE, amplitude perturbation, feature mixing, and temporal mixing are also compared in the ablation analysis. The results show that combining multiple augmentation methods does not necessarily improve model performance, because excessive augmentation may cause a shift in the training distribution. Therefore, moderate SMOTE augmentation is used as the main training strategy in the subsequent experiments.
2.4. Multi-Branch Short-Duration Auxiliary Assessment Framework
After data cleaning and standardization, each sample was constructed from the first 12 h of monitoring data. Since the leakage rate at the initial time cannot be calculated, 23 valid time steps were used as the model input. Each input sample was organized as a multivariate time-series matrix with a shape of , where 23 denotes the time steps and 4 denotes the pressure–temperature-related variables. The prediction target was the 24 h equivalent hydrogen leakage rate, and the qualified/unqualified label was determined according to the leakage-rate criterion. The AI-based framework consisted of three branches: LSTM for leakage-trend prediction, 1D CNN for local fluctuation extraction, and PCA-assisted K-means for feature-space validation.
The airtightness pressure-holding data of hydrogen-cooled systems are multivariate industrial time series. In the early stage of pressure holding, pressure and temperature signals are strongly affected by thermal equilibration, environmental disturbance, and oil–gas coupling. After the system enters the quasi-steady stage, the signals gradually reflect the true leakage trend. Therefore, short-duration auxiliary assessment needs to identify both long-term trend evolution and early local fluctuations that may be related to leakage. Based on this need, LSTM is used to model the leakage trend, and 1D CNN is used to identify local temporal fluctuations. The two outputs are used as auxiliary assessment evidence.
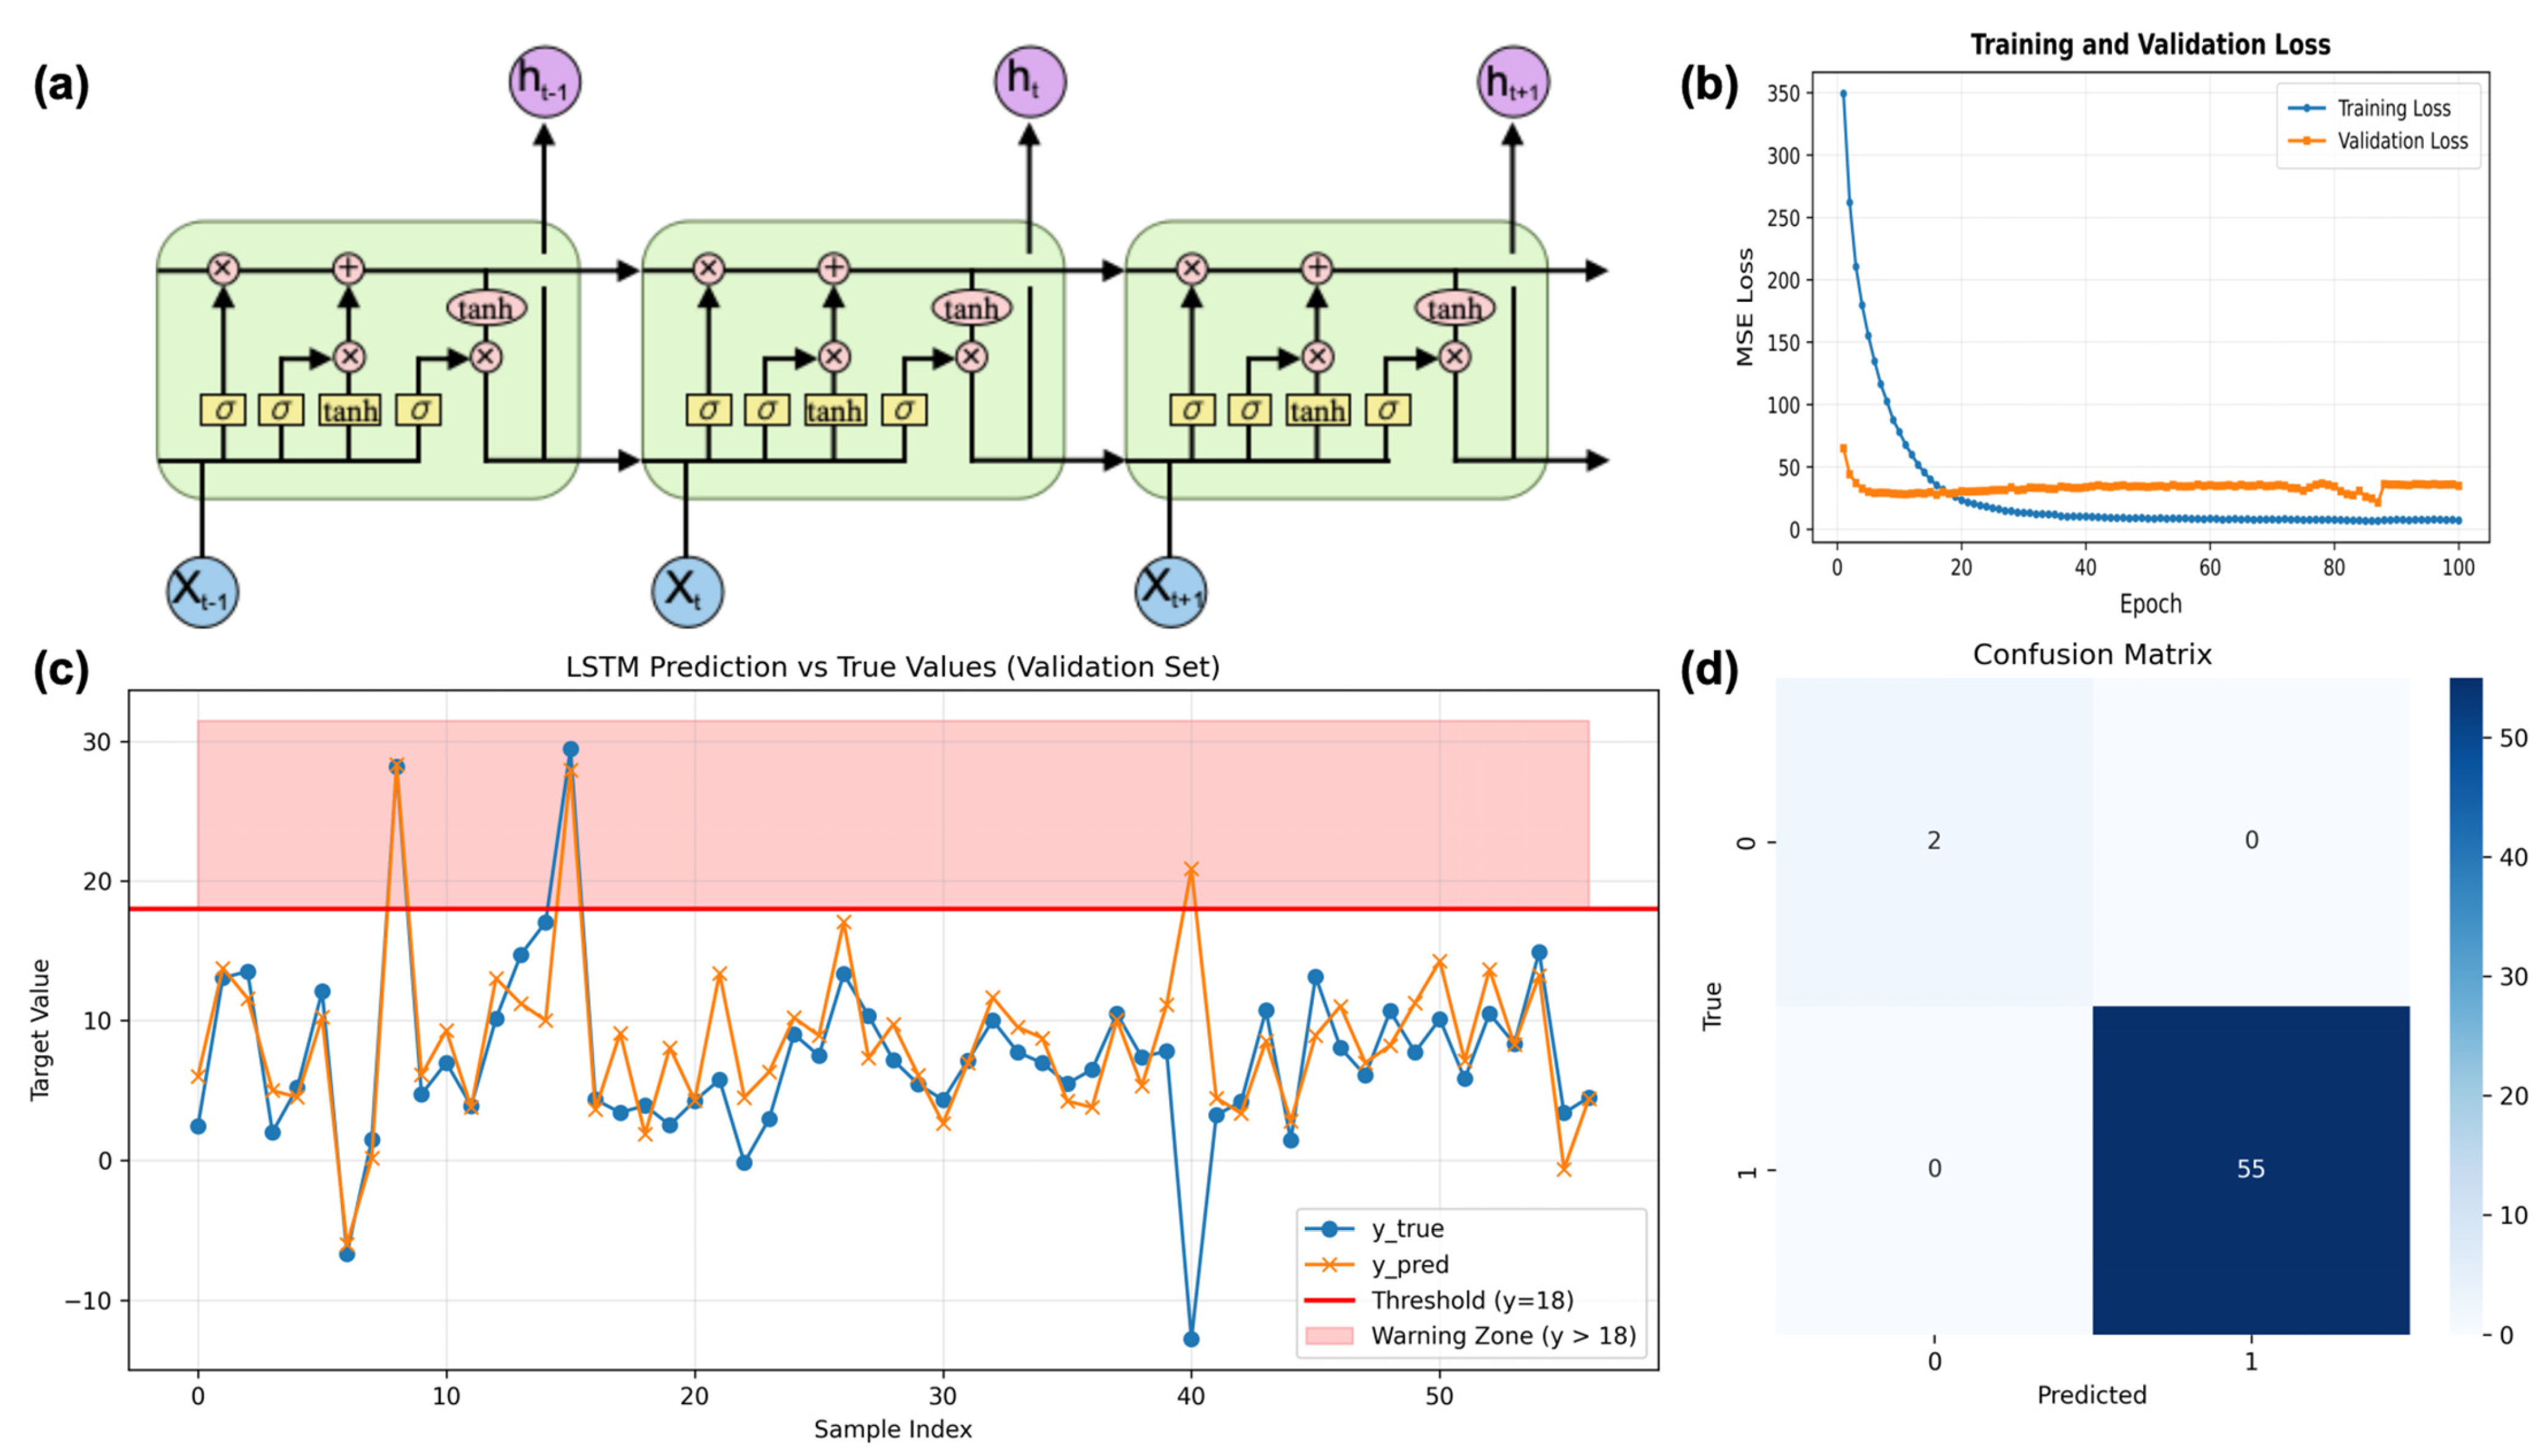
The LSTM branch is designed to model the long-term dependence of pressure evolution and to predict the leakage rate at the 24th hour from the trend perspective. Because the leakage rate at 0 h cannot be calculated, the 23 available time steps within the first 12 h are used as the input sequence. The first 12 h multivariate sequence is used as the input tensor with a shape of (batch, 23, 4). The input contains pressure and related auxiliary features in a multivariate time-series form. A two-layer stacked LSTM structure is adopted in this branch. The first layer has 64 hidden units, and the second layer has 32 hidden units. Tanh and Sigmoid activation functions are used in the gate structures to learn the long-term evolution trend of the pressure signal. A dropout rate of 0.3 is used to reduce overfitting under leakage-sample scarcity. The LSTM output is mapped to the final prediction value through a fully connected layer. This branch mainly focuses on the overall evolution trend and is used to assess whether early time-series information can represent the full-period leakage behavior.
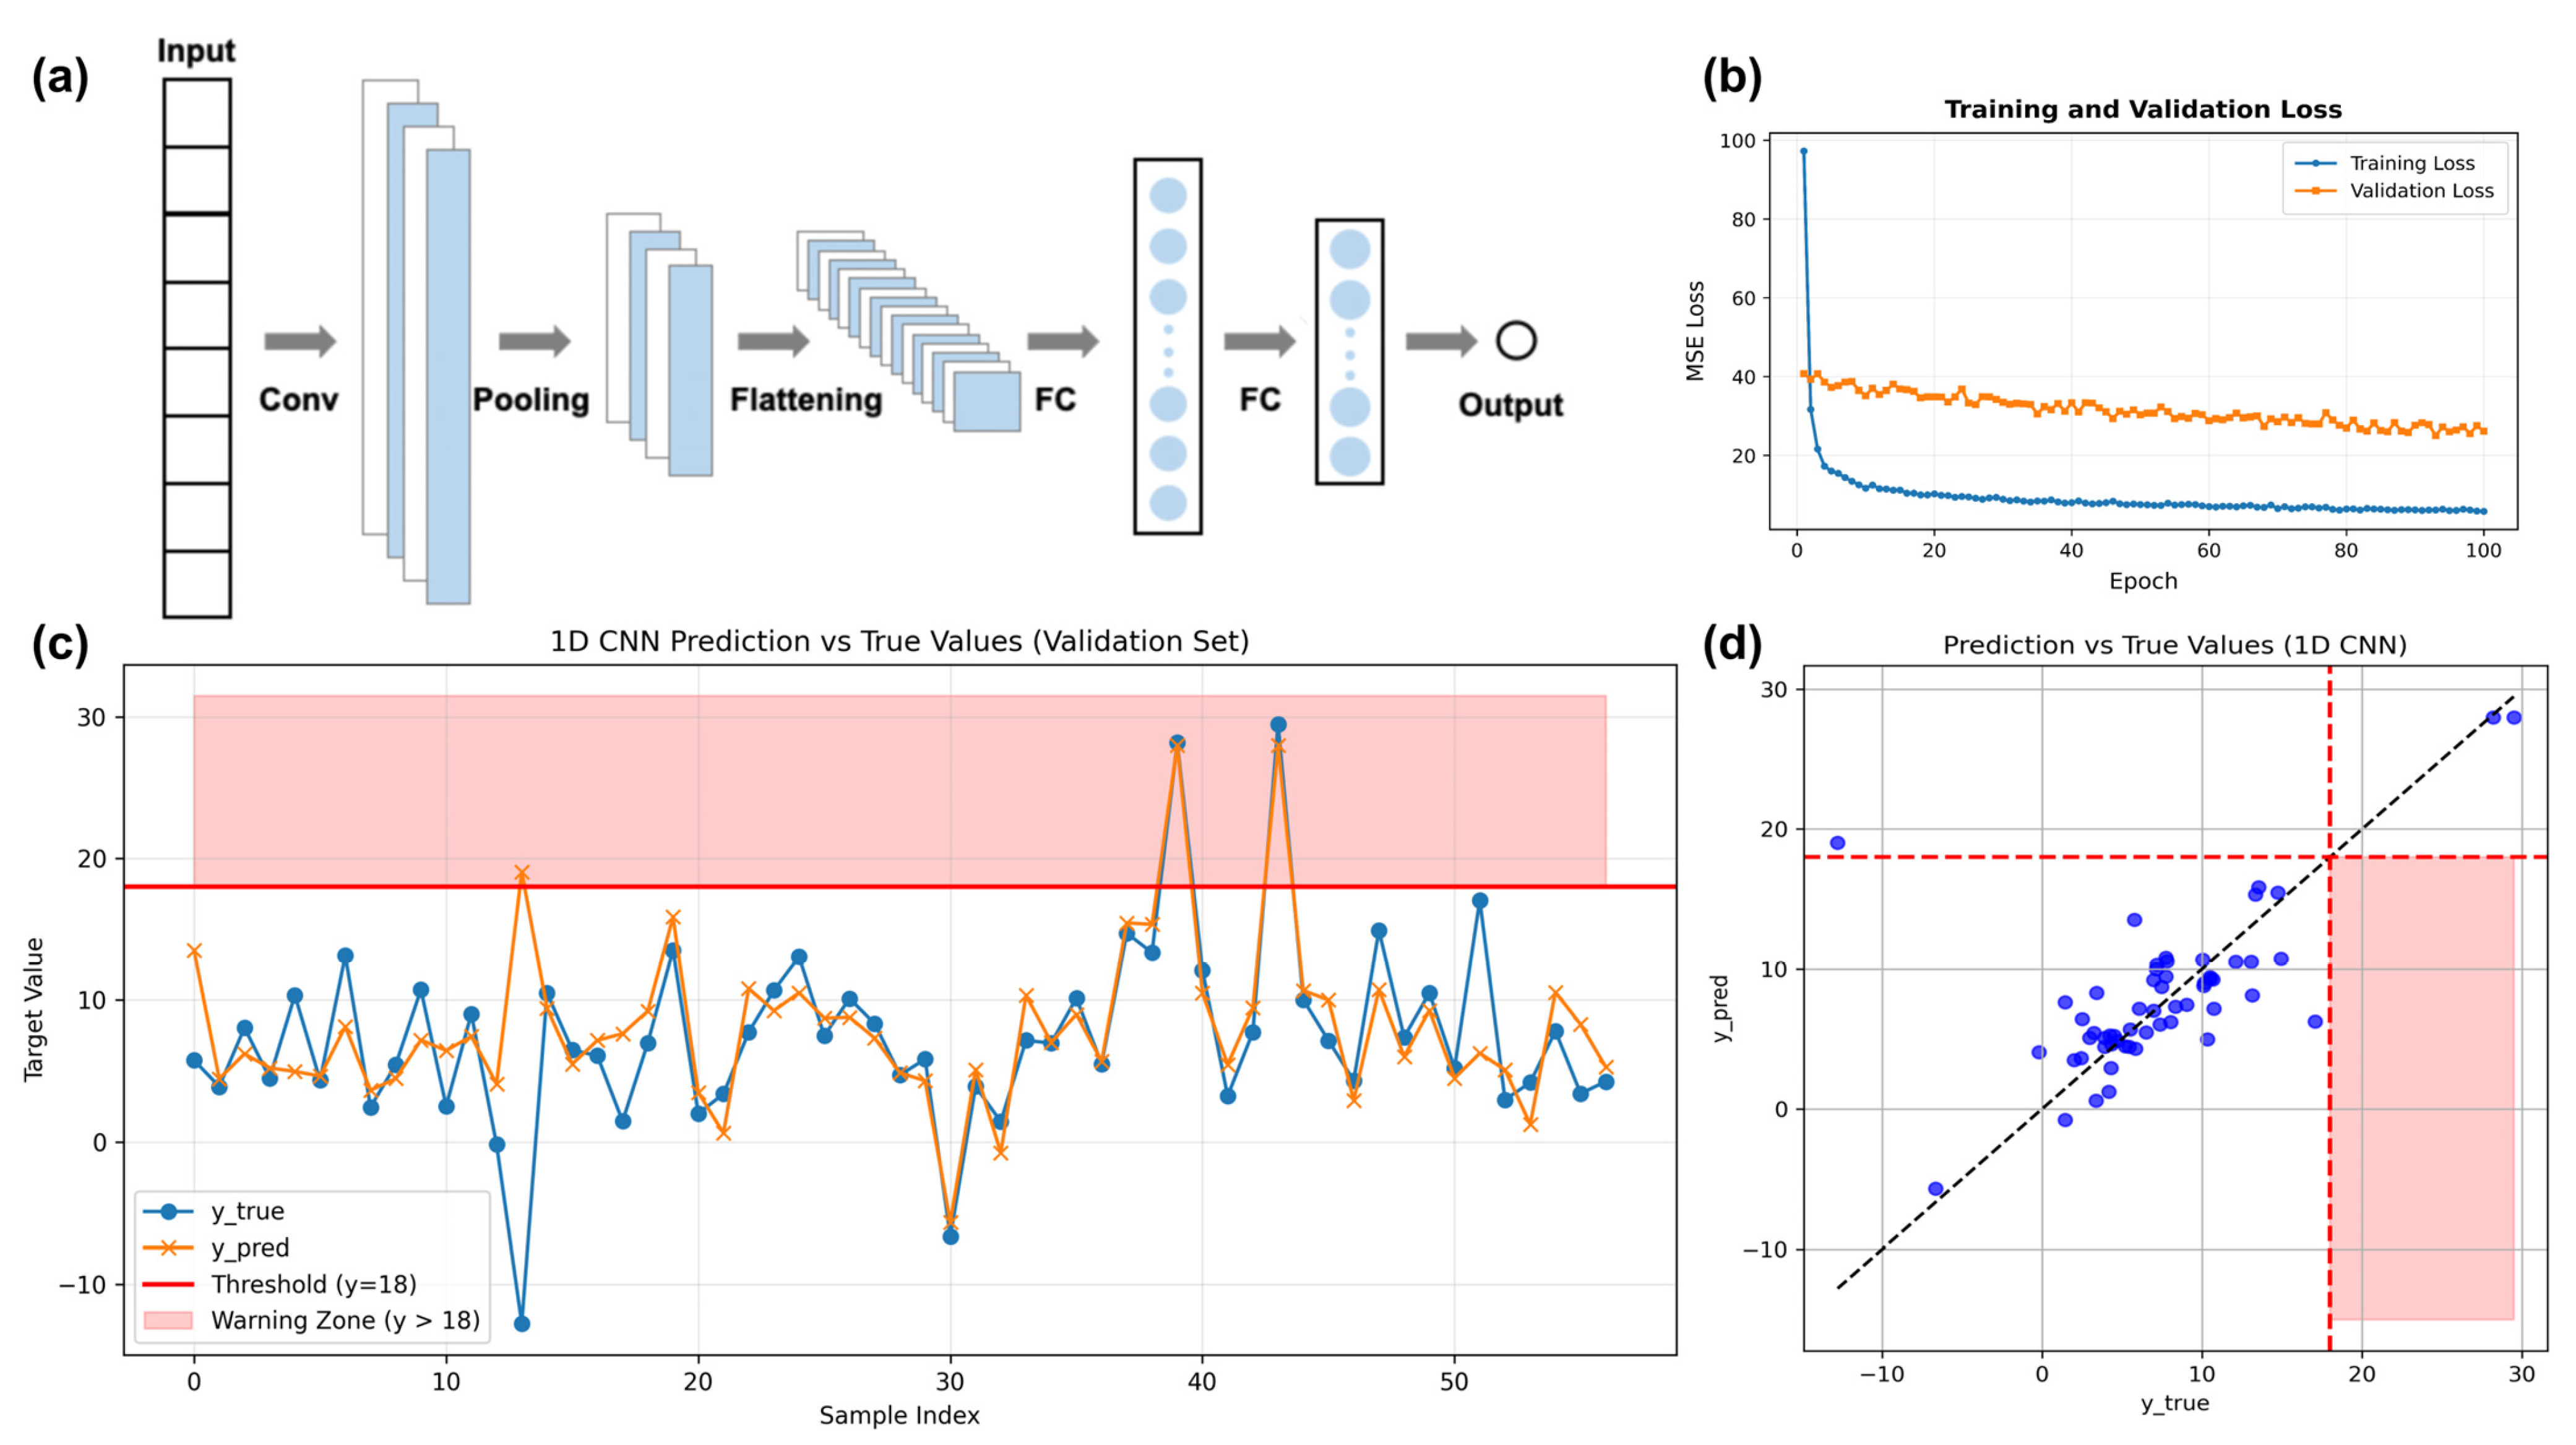
The 1D CNN branch is used to identify local fluctuation features in the pressure and temperature sequences, where the 1D convolution kernels slide along the temporal dimension to extract local fluctuation patterns from the early-stage pressure-holding process. In the early stage of pressure holding, local pattern changes may be caused by thermal equilibration, sensor response, oil–gas coupling, or minor leakage. Long-term trend prediction alone may miss such short-time-scale abnormal fluctuations. The input is also the first 12 h multivariate sequence with a shape of (batch, 23, 4), and the output is a single leakage prediction value with a shape of (batch, 1). This branch consists of two one-dimensional convolutional layers. The number of convolution filters increases from 32 to 64, and the kernel size is 3. A max-pooling layer is used for downsampling and noise suppression. The convolutional features are flattened and then passed to a fully connected regression layer to obtain PCNN. By extracting early small fluctuations and local shape features, this branch provides direct numerical evidence for leakage assessment and complements the long-term trend prediction from LSTM.
To avoid full dependence on supervised model outputs in short-duration assessment, PCA-assisted K-means clustering is introduced as a feature-space validation branch. This branch does not directly predict the leakage rate at 24 h. Specifically, a 92-dimensional flattened time-series feature vector is constructed from the first 12 h multivariate sequence. The features are standardized using z-score normalization. PCA is then fitted on the training set only, and the first four principal components are retained, explaining 91.9% of the total variance. K-means clustering with K = 6 is performed in this four-dimensional PCA space. K-means++ is used for initialization. The random seed is set to 42, and the process is repeated 20 times to reduce the risk of local optima. After clustering, the abnormal risk cluster is identified according to the distribution of known unqualified samples in the training set. If a new sample is assigned to the abnormal risk cluster, it is marked as a sample requiring review. This branch outputs and provides independent feature-space evidence for the overall assessment. The robustness and credibility of the system can, therefore, be improved.
The model is implemented in PyTorch 2.3.1, and the detailed hyperparameter settings of each branch are summarized in
Table 3. To ensure that the evaluation is not affected by the distribution of synthetic samples, data augmentation is applied only to the training set, while the validation set keeps the original historical sample distribution. The continuous leakage-rate prediction task uses the mean squared error loss. The acceptance assessment uses threshold mapping and confusion matrix analysis, with special attention to false negatives for unqualified samples. To ensure scientific evaluation and to reduce overfitting, the dataset is first split into training and validation sets, and SMOTE augmentation is then applied only to the training set. The training set is used for model weight updating, while the validation set is used only for performance evaluation and early stopping. It does not participate in data augmentation or parameter updating. The Adam optimizer is used during training. The main learning rate is set to 0.0005, and the batch size is 64. Different branches use different training epochs according to validation-set convergence. The LSTM regression branch and 1D CNN branch are trained for 100 epochs, and the LSTM classification branch is trained for 50 epochs. Mean squared error loss is used for continuous leakage-rate prediction, and cross-entropy loss is used for classification.
The three parallel branches output PCNN, PLSTM, and the decision label Ckmeans, respectively. The prediction results are mapped into qualified or unqualified labels according to the current 24 h leakage limit. This framework combines numerical prediction and distribution-based assessment. It provides multi-dimensional evidence for auxiliary assessment within the 12 h observation window.
3. Results and Discussion
3.1. Leakage-Trend Prediction Based on the LSTM Model
For the long-period time-series characteristics of nuclear power generator airtightness tests, a two-layer LSTM branch was constructed. It was used to model the long-term dependence of pressure evolution and to predict the leakage endpoint at the 24th hour using monitoring data from the first 12 h. The visualization results on the validation set are shown in
Figure 5. The applicability of this branch in the short-duration auxiliary assessment task was evaluated from two aspects: numerical regression and threshold-based classification. From the time-series fitting results, the predicted curve showed good agreement with the trend of the true leakage rate. This indicates that the first 12 h sequence contains effective information related to the subsequent leakage state.
The model generally captured the overall trend of the leakage rate evolution in the validation samples. Relatively stable predictions were also obtained for some samples with obvious pressure fluctuations. This indicates that the LSTM gating structure can extract nonlinear temporal relationships in the generator pressure-holding process to some extent. It can also smooth short-term noise caused by temperature fluctuation, oil-system disturbance, and other factors. As a result, trend information related to the sealing-state evolution can be obtained.
In the threshold-based safety assessment, risk indications could be provided by the LSTM branch when the true leakage rate was close to or exceeded the acceptance limit. The model performance was evaluated using a confusion matrix with 57 validation samples. The results showed that all 55 true qualified samples were classified as qualified. The two true unqualified samples also were classified as unqualified. This result indicates that no false negatives were observed for unqualified samples within the limited validation set. Therefore, the LSTM branch can provide trend-prediction evidence for short-duration auxiliary assessment.
It should be noted that the number of unqualified samples in the validation set was limited. Therefore, the above result cannot be directly generalized to all field conditions. In this study, the LSTM branch was not used as the sole basis for early termination of the pressure-holding test. It was used as a trend-prediction branch and was combined with 1D CNN-based local fluctuation identification and K-means-based feature-space validation for the final decision. For samples with predictions close to the threshold, large prediction deviations, or inconsistent outputs among different branches, extended pressure holding and further review were still recommended by the system.
3.2. Leakage-Rate Prediction Based on the 1D CNN Model
The 1D CNN branch was mainly used to identify local fluctuation features in the pressure and temperature sequences within the first 12 h. Unlike the LSTM branch, which focuses on the overall trend, 1D CNN extracts local shape information at short time scales through temporal-window convolution. It was used to determine whether early signals contained abnormal fluctuations or local changes related to leakage. As shown in
Figure 6, the 1D CNN model showed a certain fitting ability for the leakage-rate variation of most validation samples. The unqualified samples in the validation set could also be identified. In the scatter plots, most sample points were located near the y = x diagonal line. This indicates that the predicted values and true values showed a generally good correspondence.
From the model mechanism, local variation patterns in the multivariate sequence can be extracted by sliding convolution kernels along the time axis. For example, early leakage may cause pressure-gradient changes, local non-stationary fluctuations, or abnormal disturbances at short time scales. Compared with LSTM, which focuses on long-term trend modeling, 1D CNN is more suitable for capturing shape changes within local windows. Therefore, it can be used as a supplement to the LSTM trend-prediction result.
During the first 12 h of pressure holding, the system may still be affected by thermal equilibration, ambient temperature changes, sensor response lag, and oil–gas coupling. Local fluctuation features do not necessarily correspond to true leakage. Therefore, the 1D CNN branch was not used as an independent basis for early termination of the pressure-holding test. It was used to assist in identifying local abnormal signals. When the 1D CNN output was consistent with the LSTM trend-prediction result, and no feature-space anomaly was indicated by the K-means branch, the sample was considered to satisfy the conditions for short-duration auxiliary assessment. When local anomalies were identified by 1D CNN, or when its output was inconsistent with other branches, the sample was included in the continued pressure-holding and review process.
The experimental results show that the 1D CNN branch can provide auxiliary information at the local-shape level for short-duration assessment. Its main role is to supplement the long-term trend judgment of LSTM and to reduce the uncertainty caused by a single model output. This provides support for multi-branch consistency assessment.
3.3. Unsupervised Leakage-Pattern Clustering Based on K-Means
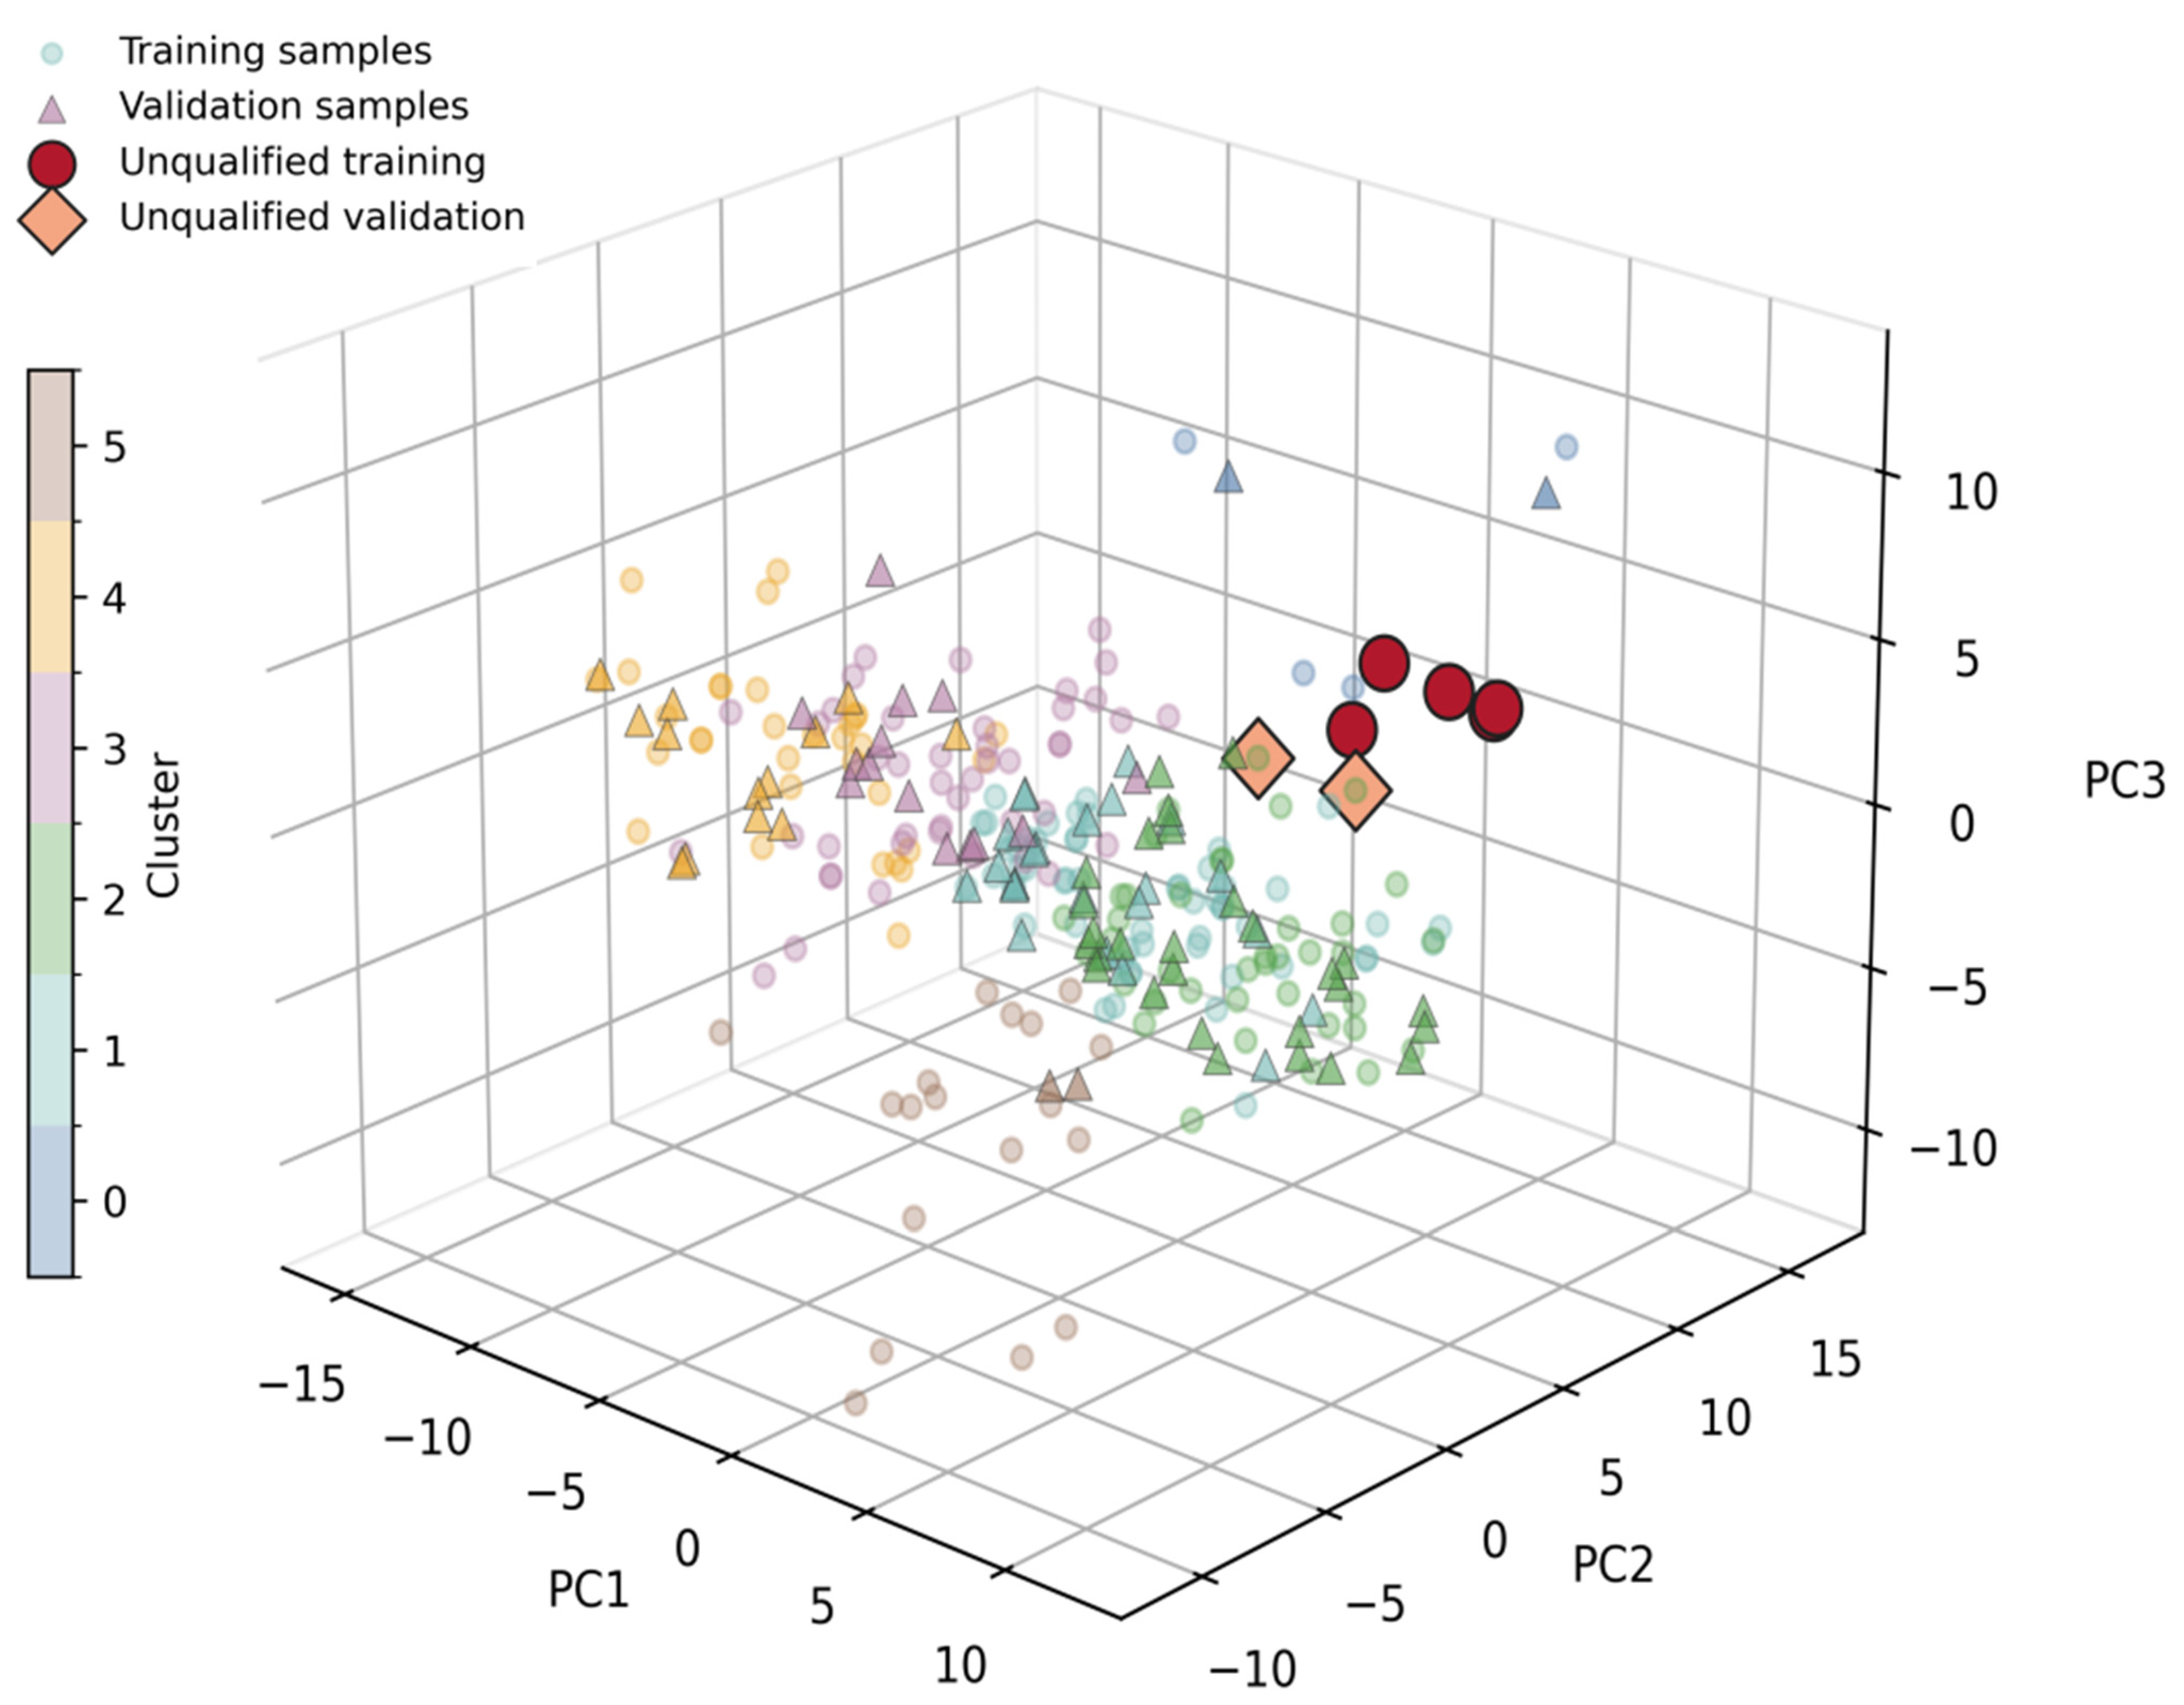
To further examine the distribution characteristics of unqualified samples in the feature space, a PCA-assisted K-means clustering was applied to the statistical features extracted from the first 12 h. The first three principal components were then projected onto a three-dimensional PCA space for visualization. The results showed that some unqualified samples in the training set were concentrated in a specific cluster. This indicates that the statistical features from the first 12 h contain feature-space distribution information related to the airtightness state.
The training data were first clustered by K-means with K = 6. The abnormal risk cluster was then identified according to the distribution of unqualified samples in the training set. As shown in
Table 4, only Cluster 0 was identified as the cluster with a relatively high concentration of unqualified samples. This cluster contained nine samples, among which five were unqualified. The unqualified ratio was 55.6%. No unqualified sample appeared in the other clusters. This result indicates that the unqualified samples showed a certain clustering tendency in the feature space. It can provide auxiliary evidence for abnormal-sample identification.
The validation samples were projected into the same PCA space. True unqualified samples were marked as red hollow circles, and qualified samples incorrectly predicted as unqualified were marked as orange hollow circles. The results showed that the true unqualified samples fell into or near the abnormal region identified during training. This indicates that the abnormal cluster obtained from the training set had a certain continuity in the validation set. Some qualified samples were also assigned to the abnormal cluster or located near its boundary, which led to false alarms. For field airtightness tests in nuclear power plants, false alarms mainly lead to extended pressure holding and further review. They do not directly reduce the safety margin. In contrast, false negatives may lead to higher safety risk. Therefore, a certain number of false alarms was allowed in the decision logic, and samples near the boundary of the abnormal cluster were included in the conservative review range.
The visualization results in
Figure 7 further show that unqualified samples had a certain clustering tendency in the feature space and were not completely randomly distributed. This indicates that, although no supervision information was explicitly introduced during K-means clustering, the statistical features from the first 12 h still contained distribution differences related to the airtightness state. From the perspective of generalization, both unqualified validation samples were assigned to the risk cluster, while two qualified samples were conservatively flagged as risk samples. This suggests that the feature-space partition had a certain ability to identify unqualified patterns. In comparison, the false-alarm samples were mainly located near the boundary of the abnormal cluster. This implies that these samples had certain similarities to unqualified samples in the feature space. They may correspond to critical operating conditions or potential risk samples.
Overall, these results indicate that the PCA-assisted K-means branch can serve as an independent validation tool outside the supervised models. It can be used to identify boundary samples and potential risk samples. However, the clustering results are affected by feature construction, sample distribution, and the choice of cluster number. Therefore, this branch was not used as an independent basis for acceptance assessment. It was included as part of the multi-branch consistency decision.
3.4. Multi-Model Collaborative Decision Framework and Dynamic Safety Strategy
In field applications in nuclear power plants, short-duration assessment methods must follow the principle of safety first. Based on this requirement, a field auxiliary decision strategy was developed by combining multi-branch consistency assessment with dynamic review. In this strategy, a single model output is not used as the basis for early termination of the pressure-holding test. Instead, conservative conditions must be satisfied at the same time by trend prediction, local fluctuation identification, and feature-space validation.
Specifically, a sample is considered to satisfy the conditions for short-duration auxiliary assessment only when three conditions are met. First, the 24 h leakage rate predicted by the LSTM branch is lower than the acceptance threshold and has a sufficient safety margin. Second, no obvious abnormal fluctuation is identified by the 1D CNN branch. Third, the PCA-assisted K-means branch shows that the sample is located in the normal region of the feature space. Under these conditions, the model output can be used as auxiliary evidence for field engineers to judge whether the pressure-holding test can be ended earlier.
When any of the following cases occurs, early termination of the test is not recommended by the system: the predicted leakage rate is close to or higher than the threshold; the outputs of LSTM and 1D CNN are inconsistent; the sample is assigned to the abnormal cluster or is located near the boundary of the abnormal cluster; or the input data contain missing values, abnormal jumps, or unstable sensor states. These cases trigger the one-vote veto mechanism. The pressure-holding test is then continued on site, and the leakage trend and risk state are recalculated in the subsequent time window.
The main goal of this strategy is to reduce the false-negative risk for unqualified samples. If a qualified sample is classified as risky, only the pressure-holding duration and review cost are increased. If an unqualified sample is incorrectly released, the operation safety of the hydrogen-cooled system may be affected. Therefore, a conservative decision rule is adopted in this study. The short-duration assessment is limited to an auxiliary decision tool, while the existing 24 h standard criterion and manual review process are retained.
4. Conclusions
A short-duration auxiliary assessment and safety review method was developed for airtightness pressure-holding tests of hydrogen-cooled generator systems in nuclear power plants. The method addresses the long test duration and its occupation of the outage critical path. The existing 24 h leakage-rate criterion is used as the basis. The subsequent airtightness state is assessed in advance by analyzing the pressure, temperature, and leakage-rate time-series information from the first 12 h. A multi-branch consistency assessment and conservative review strategy are also included. This method provides auxiliary evidence for duration optimization of field airtightness tests in nuclear power plants.
The results show that the airtightness pressure-holding process of hydrogen-cooled generator systems has clear stage-wise characteristics. In the early stage, the pressure signal is strongly affected by thermal equilibration, environmental disturbance, and oil–gas coupling. It shows clear non-stationary characteristics. As the pressure-holding process continues, the system gradually enters a quasi-steady state. The relationship between pressure variation and leakage trend becomes stronger. Historical data analysis shows that the monitoring sequence from the first 12 h covers the key transition from a non-stationary state to a quasi-steady state. It can provide effective information for the assessment of the 24 h leakage state.
To address the scarcity of unqualified field samples and the class imbalance problem, SMOTE was introduced during training to augment minority-class samples. The original historical sample distribution was retained in the validation stage. The validation results show that the multi-branch framework, including LSTM-based trend prediction, 1D CNN-based local fluctuation identification, and PCA-assisted K-means-based feature-space validation, can use the first 12 h data to support the auxiliary assessment of the 24 h leakage state. No false negatives for unqualified samples were observed in the current validation set. For boundary samples and samples with inconsistent model outputs, extended pressure holding and further review were recommended by the system. Due to the natural scarcity of genuine unqualified samples in nuclear power plant airtightness tests, the current validation results should be regarded as preliminary evidence and should be continuously verified through long-term field application.
The proposed method should be regarded as a short-duration auxiliary assessment tool. Its application should be combined with field data quality control, model consistency validation, threshold safety margins, and manual review procedures. For samples with predictions close to the threshold, feature-space anomalies, or inconsistent model decisions, the pressure-holding test should be continued, and review should be performed in the subsequent time window. This conservative strategy can maintain the safety margin required in nuclear power field applications while shorter test duration is being explored.
Future work should further increase the number of real unqualified samples. Cross-plant, cross-season, and cross-unit validation should also be carried out, together with systematic comparisons between the proposed data-driven auxiliary framework and traditional analytical extrapolation models or pressure–temperature trend models. In addition, new ambient-temperature measurement points, simulation-based temperature-field correction, and online incremental learning should be integrated. These improvements can enhance the long-term stability and engineering applicability of the method under complex field conditions.





 ,
,