Article

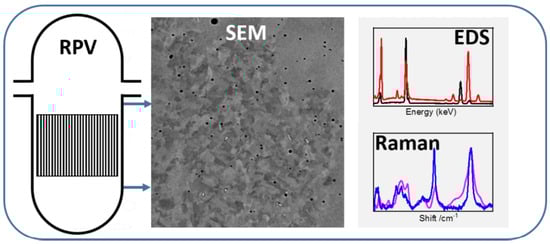
Phase Characterization of (Mn, S) Inclusions and Mo Precipitates in Reactor Pressure Vessel Steel from Greifswald Nuclear Power Plant

1
Institute of Resource Ecology, Helmholtz-Zentrum Dresden-Rossendorf, 01328 Dresden, Germany
2
Institute of Chemistry and Biochemistry, Freie Universität Berlin, 14195 Berlin, Germany
3
Institute for Nuclear Waste Disposal, Karlsruhe Institute of Technology, 76344 Eggenstein-Leopoldshafen, Germany
*
Author to whom correspondence should be addressed.
J. Nucl. Eng. 2025, 6(2), 12; https://doi.org/10.3390/jne6020012
Submission received: 21 March 2025 / Revised: 24 April 2025 / Accepted: 25 April 2025 / Published: 2 May 2025

Abstract

:
This study presents a comprehensive analysis of the microstructural characteristics and chemical composition of base and weld materials from reactor pressure vessels in the first (units 1 and 2) and second (unit 8) generations of Russian VVER 440 reactors at the Greifswald nuclear power plant. We measured the specific activities of 60Co and 14C in activated samples from units 1 and 2. 60Co, with its shorter half-life (t1/2 = 5.27 a), is a key dose-contributing radionuclide during decommissioning, while 14C (t1/2 = 5700 a) plays an important role in a geological repository for low- and intermediate-level radioactive waste. Our findings reveal differences in the proportions of trace elements between the base and weld materials as well as between the two reactor generations. Microstructural analysis identified Mo-rich precipitates and (Mn, S)-rich inclusions containing secondary micro-inclusions in the unit 1 and 2 samples. Raman spectroscopy confirmed iron oxides (γ-Fe2O3, Fe3O4), silicates (Mn-SiO3), and Cr2O3/NiCr2O4 in the base metal as well as MnFe2O3 in the weld metal. X-ray photoelectron spectroscopy identified Mn inclusions as MnS, MnS2, or mixed Mn, Fe sulfides, and the Mo precipitates as MoSi2. These findings offer valuable insights into the speciation of elements and the potential release of radionuclides through corrosion processes under repository conditions.

Graphical Abstract

1. Introduction

Nuclear energy has been considered an important near-CO2-neutral source for satisfying and fostering the electricity requirements in modern society over the last decades. All over the world, numerous nuclear power plants (NPPs) are planned, under construction, in operation, or already shut down. One of the main shielding barriers of the radioactive fuel in the NPP is the reactor pressure vessel (RPV). The RPV contains the reactor core, where nuclear fission chain reactions take place, and is therefore exposed to high neutron fluence during operation. In the surrounding structures, several activation products are generated by neutron-induced reactions with the alloying elements, thus producing different radioisotopes, such as 14C, 54Mn, 55Fe, 60Co, 59Ni, 63Ni, 93mNb, 94Nb, and 99Tc [1,2,3]. Moreover, the RPV steel performance is affected by different parameters, including neutron fluence and flux, temperature, steel composition, and mechanical stresses [4,5,6,7].
Various studies have investigated the impact of irradiation and high pressure and temperature on the structure of RPV steel on a microscopic level [4,6,7]. Pristine (unirradiated) material was utilized, focusing on steel embrittlement due to high-temperature and -pressure conditions and the resulting changes in the mechanical properties of the material [8,9,10,11,12]. In addition, the impact of irradiation was investigated by performing mechanical testing and embrittlement studies on steel material, either from decommissioned NPPs [13,14,15,16] or from materials subjected to neutron [17,18,19,20,21,22,23] or ion irradiation [24,25]. The investigations showed that irradiation-induced structural changes that affect the mechanical properties are on the nm scale [17,18,19,20,23,26]. Additionally, the influence of the material composition, especially the copper impurity level, on such mechanical changes has been studied [5,26,27]. However, deeper understanding of the RPV steel material of both the first and second generation of VVER 440 is still scarce. Investigating the material composition and the possible phases present in the steel is an important step in understanding corrosion processes that have occurred after decommissioning and during long-term intermediate storage.
The aim of this study is the analysis of the RPV steel material, focusing on different phases occurring within the Fe-based/low metal alloy material samples, particularly in identified inclusions and precipitates where radioactive neutron activation products and their daughter isotopes may accumulate. For this purpose, RPV steel samples were selected from the first- and second-generation reactor units of Greifswald nuclear power plant, GW-NPP. The investigated steel samples include both the base and weld materials, specifically, irradiated steel from GW-NPP first-generation units 1 (U1) and 2 (U2), which underwent long-term operation for a period of 15 years, and pristine RPV steel from the GW-NPP second-generation unit 8 (U8), which was never operational. It is important to note that the steel materials underwent storage under ambient conditions for over 30 years, since 1990, prior to their analysis. The results of this study provide insights into potential corrosion processes affecting RPV material during the pre-decommissioning phase, after decommissioning, and throughout the intermediate storage prior to their final disposal.
The elemental composition of all base and weld metal samples of both first- and second-generation RPV steel was determined by optical emission spectroscopy (OES). Radioanalytical characterization of the samples was performed by calculating the neutron fluence to which the samples were exposed during operation and by measuring the resulting activities of the two most important radionuclides with respect to dismantling (60Co) and final disposal (14C). Microstructural analysis was performed using scanning electron microscopy/energy dispersive X-ray spectroscopy (SEM/EDS). Furthermore, X-ray photoelectron spectroscopy (XPS) and Raman spectroscopy were employed to identify precipitates and inclusions in the materials and to characterize their mineral phase compositions.
The results will provide detailed insights into the phase composition of the precipitates and inclusions in the RPV steel that may influence corrosion behavior and, consequently, the potential release of radionuclides under specific conditions during dismantling, intermediate storage, and final disposal.
Finally, we acknowledge that, due to radiation protection constraints, our study was limited to low-level activated material. However, since the physicochemical properties of the steel are only marginally affected by neutron irradiation, our findings and conclusions can be reliably extrapolated to activated material with significantly higher activities, which has to be stored in a nuclear waste repository.

2. Materials and Methods

2.1. Sampling and Materials

The GW-NPP comprised eight RPV reactor units of the VVER-440 type. The first four units (U1–U4) of the V-230 model (first generation) were in operation. The last reactor units (U5–U8) of the V-213 model (second generation) were only briefly tested (U5) or not in operation at all (U6–U8). The base metal of these RPVs consists of iron-based low-alloy steel. During manufacturing, the steel was forged into rings at some parts of the reactor, which were welded, thereby forming the weld metal. Samples of both steel materials, i.e., base (B) and weld (W) metal from U1 and U2 as well as U8 were selected for this study.
The first-generation reactor units underwent long-term operation mode for a period of 15 years (U1: 1 December 1973 to 18 December 1990, 11.5 full-power years; U2: 23 December 1974 to 14 February 1990, 11.0 full-power years) at an inlet operational temperature of 265 °C (water temp. at RPV). One trepan was taken from U1 at an upper position of the RPV part representing the base material (U1-B); a second trepan was taken from U2 at a lower position of the RPV, representing weld material (U2-W). The positions of the samples from reactor units U1 and U2 are given schematically in the Supporting Information (Figure S1). A detailed description of the trepanning procedure can be found elsewhere [28,29]. U1-B and U2-W are characterized by their low neutron fluence in comparison with other positions at closer proximity to the region of the reactor core. Due to their low neutron fluence compared with regions closer to the reactor core and the elapsed time since decommissioning, U1-B and U2-W are comparable with regard to their low activation to pristine samples from the second-generation reactor unit U8. Both trepans (U1-B and U2-W) were taken from the RPV wall and cut horizontally into smaller samples with dimensions of (10 × 10 × 1) or (10 × 2.5 × 1) mm. From both units, duplicate samples were selected at two different positions from the reactor core, that is, at a distance of 39 mm (labeled “in”) and at a distance of 71 mm (labeled “out”). A summary of all samples, their labeling, and positions is given in Table 1. In addition, RPV steel of the 2nd-generation reactor unit U8 was sampled (U8-B and U8-W) and cut into (10 × 10 × 1) mm thin squares.
Samples from units U1, U2, and U8 were further prepared for SEM/EDS, Raman, and XPS analysis. These were initially surface-polished using silicon carbide sandpaper with a grain size of 66 µm followed by additional polishing in two steps with diamond suspension gels of 3 µm and 1 µm grain sizes. They were cleaned with ethanol solution, immediately dried, and stored in a desiccator prior to analysis. Additional samples were prepared for OES measurements; these were only surface polished using Zircon paper with 60 µm grain size prior to analysis.

2.2. Methods

2.2.1. Optical Emission Spectroscopy (OES)

OES analyses were performed on polished metal samples with SPECTROMAXx (Spectro Analytical Instruments, Kleve, Germany). The calibration was performed on a calibrant sample based on the material of iron/low metal alloy steel (code number: K7225), which is adequate to the concentrations of the alloying material present within the RPV steel samples. Calibration was performed prior to each analysis; the sample measurement was repeated six times for each analysis. The data were analyzed with the program Spark Analyzer Pro MAXx V.2.00.0013.

2.2.2. Radioanalytical Methods

60Co was determined by gamma spectrometry using a high-purity germanium (HPGe) coaxial N-type photon detector system (GMX30 P4-76-C-S, 30% efficiency, Ortec-Ametek, Oak Ridge, TN, USA). Three samples per position with dimensions of (10 × 10 × 1) mm (one piece) and (10 × 2.5 × 1) mm (two pieces) were placed with 8 cm distance to the detector and measured for 1.5 h (U1-B) to 60 h (U2-W). The measurements were analyzed with the software InterWinner 8.0. 14C was determined by liquid scintillation counting (LSC Hidex, Hidex Oy, Turku, Finland) after oxidative combustion with a fully automated and controlled oxidizer (Hidex 600 OX Oxidizer, Hidex Oy, Turku, Finland). One sample piece with dimensions of (10 × 2.5 × 1) mm was placed in the sample holder (ceramic boat) and heated to 900 °C for 20 min in an oxygen stream. The resulting CO2 was absorbed directly into the LSC vial filled with the liquid scintillation cocktail OX Radiocarbon (Hidex Oy, Turku, Finland) and measured directly. Two samples were analyzed for each position. The measured 60Co and 14C activities were recalculated to 31 December 2020.

2.2.3. Neutron Fluence Calculation

Neutron fluences for U1 and U2 of the GW-NPP were calculated using the radiation transport code Monte-Carlo N-Particle (MCNP, version 6.2 [30]). For the radiation transport calculations, a detailed and comprehensive model of the VVER-440/V-230 was developed that covers the complete reactor pressure vessel, reactor internals, reactor lid, annular water tank, and parts of the concrete structures. The required neutron source distributions were based on data calculated using a routine burnup code. The data were already provided by NIS Ingenieursgesellschaft mbH Rheinsberg (now: Siempelkamp NIS) in the scope of earlier investigations [31]. Neutron-induced fission spectra and cross sections were primarily taken from the cross-section library ENDF/B-VIII.0. The fluences of neutrons with energies above 0.5 MeV were calculated as it is commonly used to determine changes in the ductile-to-brittle transition temperature of VVER-440 RPVs. More details on the calculations can be found in Ref. [32].

2.2.4. Scanning Electron Microscopy/Electron Dispersive X-Ray Spectroscopy (SEM/EDS)

SEM investigations of the thin, polished RPV steel samples were carried out with a Zeiss EVO 50 SEM (Carl Zeiss Microscopy, Oberkochen, Germany) equipped with a tungsten filament electron cathode operated at 15 kV acceleration voltage. EDS measurements were performed using a Bruker EDS system AXS QUANTAX 200 (Bruker, Madison, WI, USA) as single-point measurements. In order to collect low noise spectra, an integration time of about 1 min with a beam current of about 1 nA was used.

2.2.5. X-Ray Photoelectron Spectroscopy (XPS)

XPS measurements were performed with an XPS system PHI 5000 VersaProbe II (ULVAC-PHI Inc., Hagisono Chigasaki, Japan) equipped with a scanning microprobe X-ray source (monochromatic Al Kα, hν = 1486.7 eV). The analysis area was set to 0.6 × 0.2 mm2. Survey scans were recorded with a pass energy of the analyzer of 187.85 eV. Narrow scans of the elemental lines were recorded at 23.5 eV pass energy, which yields an energy resolution of 0.69 eV FWHM at the Ag 3d5/2 elemental line of pure silver. Calibration of the binding energy scale of the spectrometer was performed using well-established binding energies of elemental lines of pure metals (monochromatic Al Kα: Cu 2p3/2 at 932.62 eV, Au 4f7/2 at 83.96 eV) [33]. Error of binding energies of elemental lines was estimated to ± 0.3 eV. The narrow Fe 2p3/2 elemental line of the metal at 707.0 eV [34] was used as internal binding energy reference.

2.2.6. Raman Spectroscopy

The Raman investigations were conducted on a LabRAM Aramis Raman microscope, equipped with a 532 nm laser for excitation (HORIBA Jobin Yvon, Lyon, France) using a grating of 1200 lines/mm. Measurements were conducted with the 0.90/100 × objective, resulting in a laser spot size of <1 μm. Different areas appearing as dark contrast inclusions in the polished RPV samples, as observed by SEM, were identified with the Raman microscope. Single points were then analyzed by collecting 10 spectra, each spectrum acquired over 5–10 s.

3. Results

3.1. Elemental Analysis of the RPV Steel Samples (OES)

The chemical composition of the alloying material within the RPV governs its mechanical properties in providing its high fracture toughness under severe conditions of neutron irradiation [27,35,36,37]. For a proper interpretation of our experimental data, the knowledge of the chemical composition of our samples is crucial. Therefore, OES was initially performed on both the first-generation units U1 and U2 (U1-B and U2-W) and the second-generation unit U8 (U8-B and U8-W), in each case base and weld metal samples, to identify the quantitative chemical compositions of the alloying materials. The results are listed in Table 2.
The elemental compositions of U1-B and U2-W are comparable to their counterparts U8-B and U8-W, respectively, as shown in Table 2. However, the alloying material from the first generation, U1 and U2, contains more Ni and Cu, and slightly more Co, than that from the second generation, U8. Furthermore, the base material of both reactor types contains approximately twice as much Cr and V, slightly more Mo and Ni, and less (half) Mn than the weld material. Co and S contents are similar in both base and weld materials. The material composition of the base metals is within the nominal range of the crude steel used for the production of the RPVs [38]. Our results, listed in Table 2, are in good agreement with previous measurements of the same material [15,29,39,40].

3.2. Radioanalytical Characterization

Many investigations concerning the influence of irradiation on the mechanical characteristics of the RPV steel material of GW-NPP, like hardness, yield stress, or cleavage fracture toughness, have been performed [16,22,28,29,31,40,41]. Activation measurements have been published for 93mNb, 63Ni, and 99Tc [28,32]. 93mNb is produced by the neutron reactions 93Nb(n,n’)93mNb and 92Mo(n,γ)93Mo, followed by decay to 93mNb. 63Ni is generated by the reaction 62Ni(n,γ)63Ni, and 99Tc is a decay product of 99Mo, which is produced by the reactions 98Mo(n,γ)99Mo and 100Mo(n,2n)99Mo. However, the most important radionuclide during the decommissioning and dismantling phase is the gamma emitter 60Co, with a half-life of 5.27 years. It is mainly produced by thermal and epithermal neutrons in the reaction 59Co(n,γ)60Co. In addition to that, the beta emitter 14C is the key radionuclide for repositories of low- and intermediate-level radioactive waste, owing to its long half-life of 5700 years. 14C is primarily produced by thermal neutrons in the reaction 14N(n,p)14C. To the best of our knowledge, no radiological characterization of 60Co or 14C in RPV steel from GW-NPP has been published to date. Specific activities of 60Co and several beta emitters, including 14C, are provided for a VVER RPV steel sample in Ref. [42]. However, the reactor unit, exact sampling location, and reference date for the activity measurements are not specified in this publication [42], preventing a direct comparison with our data.
We measured the activities of 60Co and 14C at the same locations where the subsequent microstructural investigations were conducted. The results are listed in Table 3. The samples were taken from positions above and well below the fission zone. Compared with RPV samples taken from the height of the fission zone, the specific activities are very low [28,31]. The errors for 14C are relatively high. This may be due to the heterogeneous N distribution in the steel; hence, the individual measurement results are more scattered than those for 60Co. Neutron transport calculations resulted in very low fast-neutron fluences of about 1 × 10¹⁸ neutrons/cm2 (E > 0.5 MeV) at position U1 and of about 2 × 10¹⁵ n/cm2 (E > 0.5 MeV) at position U2 (see Table 3). For RPV steel samples at the height of the reactor core, much higher neutron fluences were calculated (up to about 5 × 10¹⁹ neutrons/cm2), resulting in respective higher activations. Own measurements resulted in about 5 × 10³ up to 1.5 × 10⁵ Bq/g for 60Co, depending on the horizontal position (the largest specific activities were at the inner side of the RPV). Due to radiation safety restrictions, we were not able to use such highly activated samples for the following microstructural characterization investigations. However, the physicochemical behavior is not influenced by irradiation on the µm scale, but only on the nm scale [17,18,19,20,23,26]. Therefore, we performed the microstructural investigations with the less-irradiated samples. The outcome of these investigations is directly transferable to highly irradiated steel material, which has to be stored in a deep geological radioactive repository.
In contrast to the samples taken from the height of the reactor core, the calculated fast-neutron fluence of the U2-W samples is larger for the outer sample than for the inner one. This is attributed to the transport of neutrons in the gap between the RPV and the annular water tank. Neutrons are scattered by the annular water tank back into the RPV, as can be shown using MCNP’s cell-flagging feature. The fraction of thermal neutrons, however, is especially large at the inner side of the RPV due to the coolant water [31]. Therefore, a smaller fast-neutron fluence and smaller 60Co-specific activity but larger 14C-specific activity of sample U2-W-in compared with U2-W-out is no contradiction.

3.3. Microstructural Characterization and Elemental Analysis (SEM/EDS)

Comprehensive SEM/EDS analyses were performed for all samples (see Table 1). Figure 1 shows the microstructural features of a typical base and weld material of the RPV U8. Generally, in all RPV samples, the base material was characterized by bainitic ferrite and the weld material by acicular ferrite microstructure, a typical feature within the RPV steel material after heat treatment during the production process [43,44]. In identifying the chemical composition of the alloying material, SEM imaging experiments were accompanied by EDS measurements. The corresponding elemental compositions within their matrices contain high concentrations of Fe with the presence of Cr, V, Mo, Si, and Mn in trace amounts. In agreement with the OES results, in the base metal, the Cr and V trace concentrations are slightly higher than in the weld metal, whereas Si and Mn concentrations are slightly lower in the base than in the weld metal.

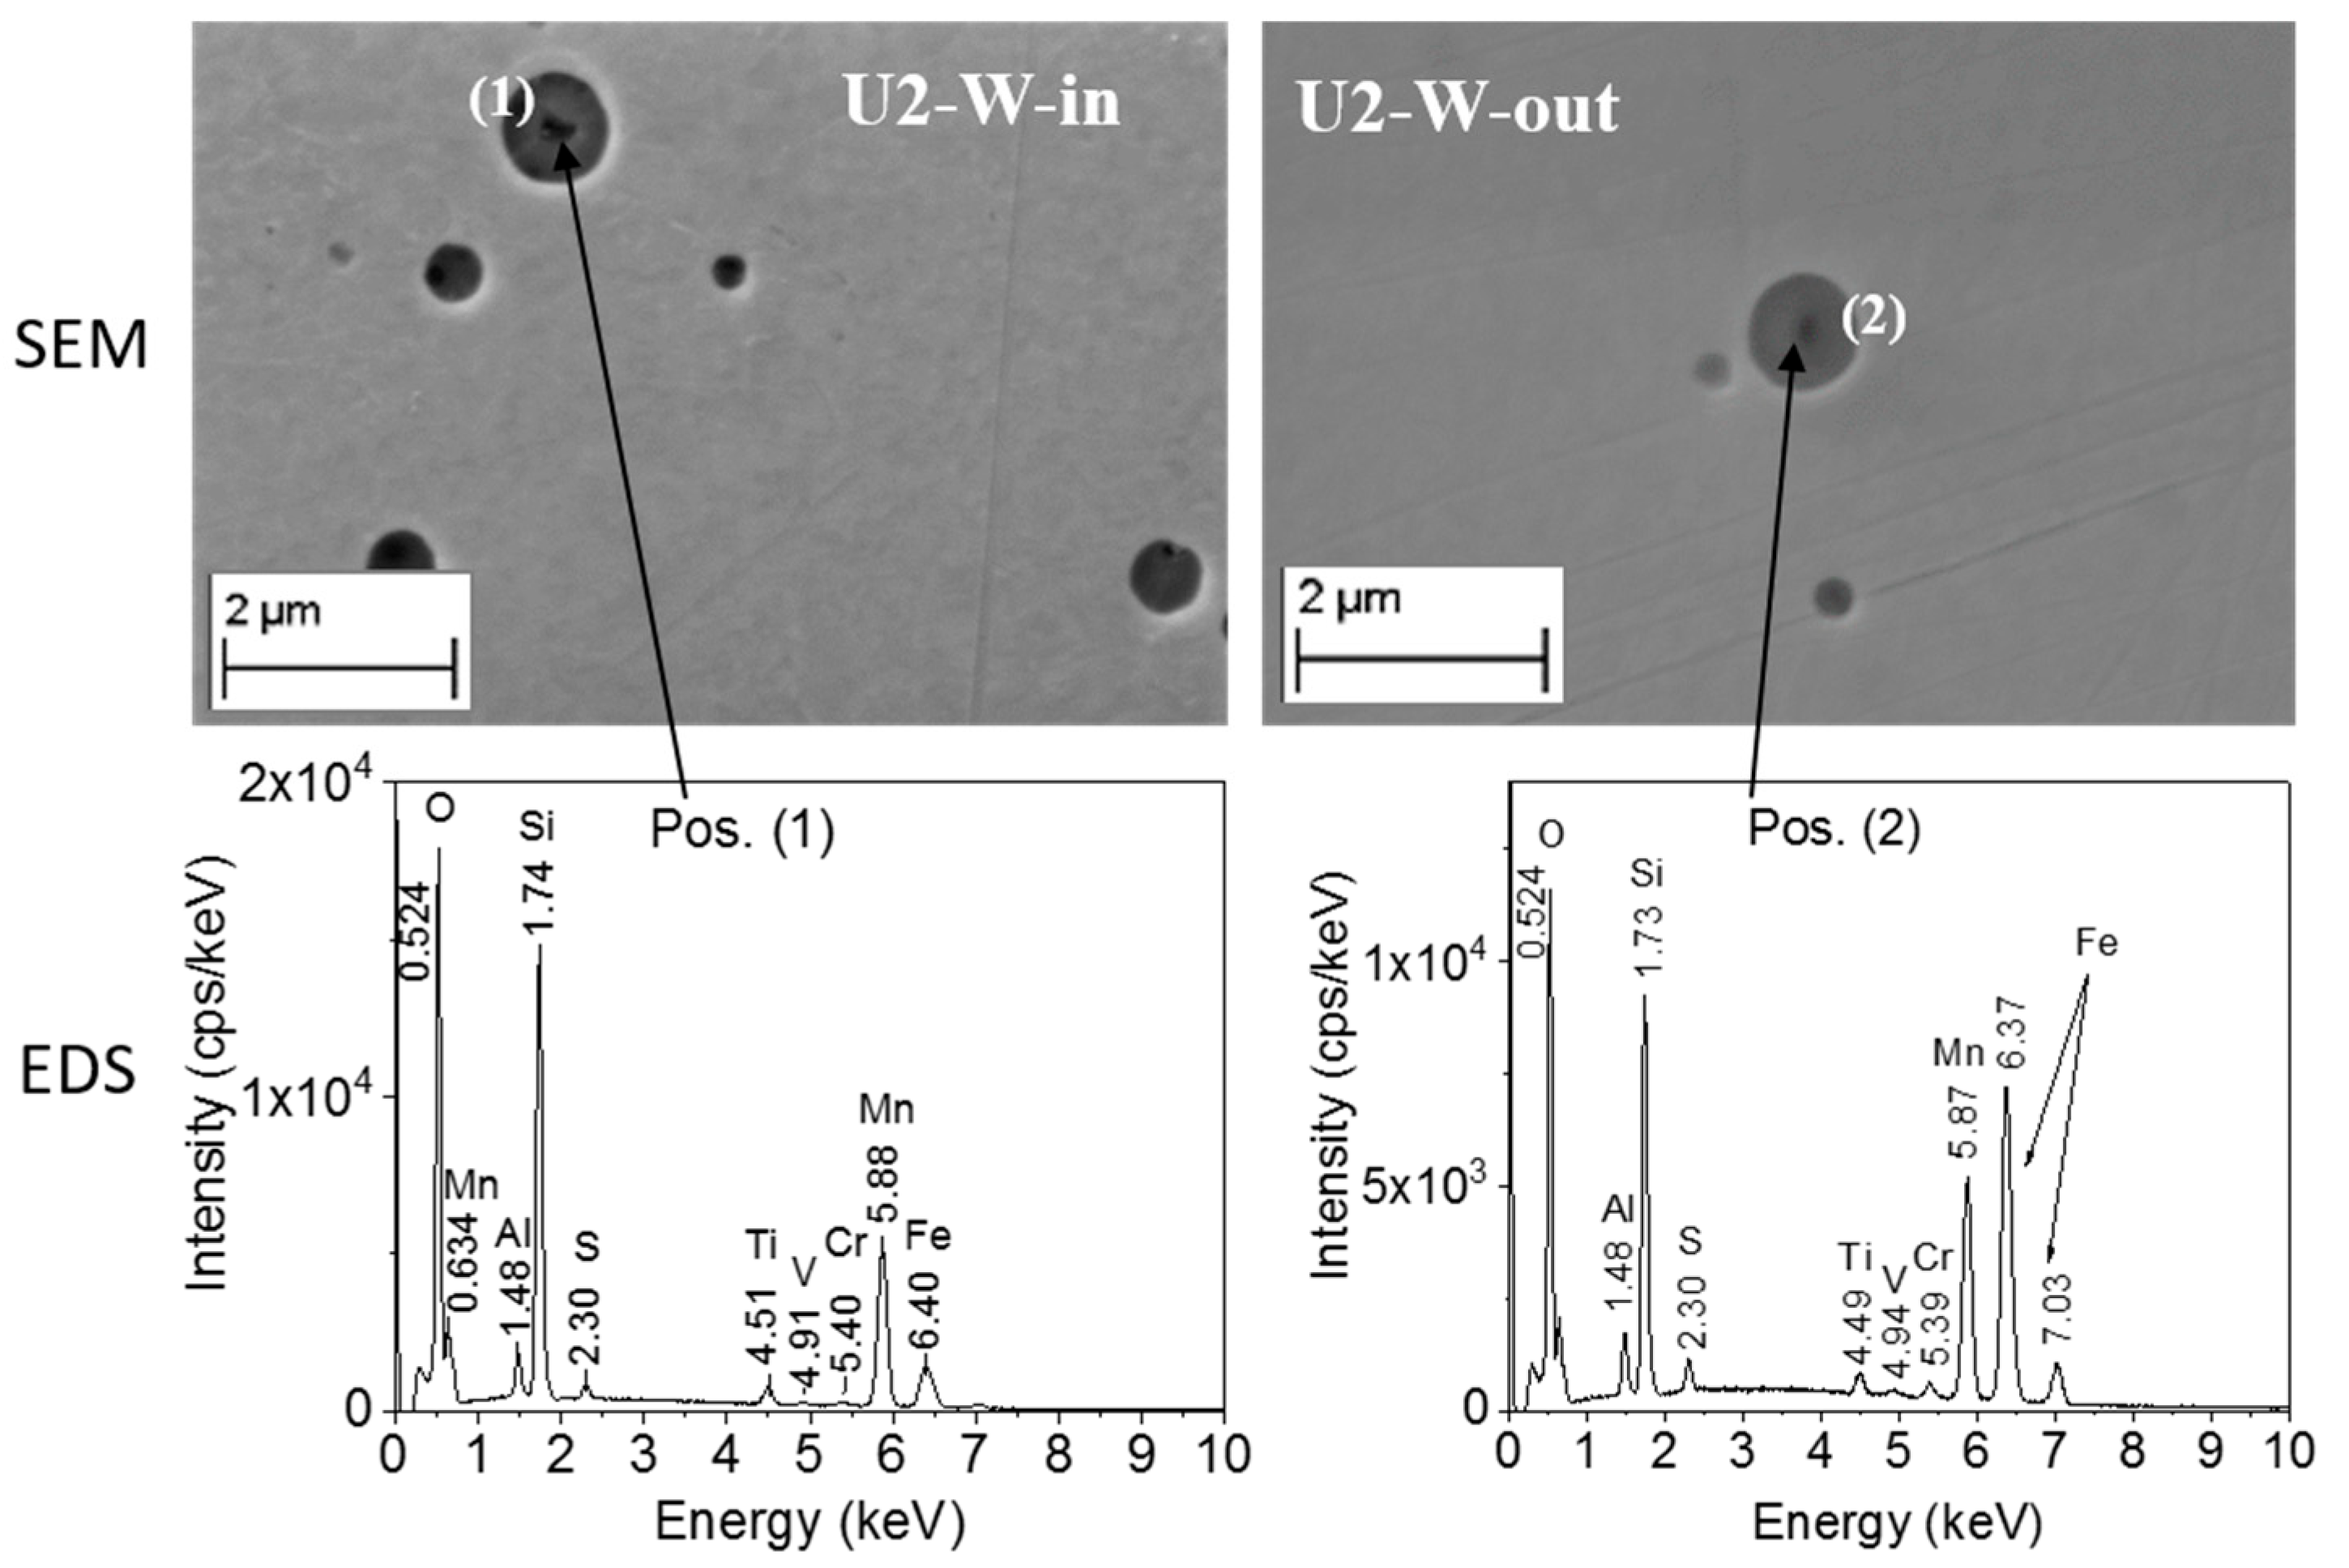
3.3.1. Characterization of the RPV First-Generation (U1 and U2) Samples

Surface analysis SEM/EDS was performed on the material of the RPV first-generation reactor units that underwent normal operation in the GW-NPP. Figure 2 and Figure 3 present typical secondary electron images of U1-B samples from the inner (-in) and outer (-out) RPV wall (base material) and of U2-W samples also from the inner (-in) and outer (-out) RPV wall (weld material), as well as EDS data from distinct inclusions. Additional SEM images from U1 and U2 material are presented in the Supporting Information, Figures S2–S4.
SEM imaging of the U1 and U2 samples revealed typical microstructural features in both the base and weld materials, namely, inclusions with circular morphology appearing as dark contrast areas, and smaller precipitates appearing as bright contrasts (shown in the Supporting Information, Figure S2). EDS confirmed that the dark contrast areas contained mainly Mn and S, while the bright precipitates are Mo-enriched. However, focusing on the (Mn, S)-rich inclusions, their morphology revealed the presence of additional discrete areas (micro-inclusions), appearing either at their centers or along the inclusion/matrix boundaries. We named such discrete deep, dark areas as “secondary micro-inclusions”. Figure 2 presents two samples of U1-B that were taken at different distances from the reactor core; 39 mm (in) and 71 mm (out); however, the neutron fluences were very similar at these positions (see Table 1). EDS confirmed that the large inclusions contain basically Mn and S (see Figure 2, Pos. (1)), while EDS of the secondary micro-inclusions (see Figure 2, Pos. (2)) identified high concentrations of Fe, Si, and O. This indicates the presence of iron oxides and silicates in addition to Mn, S, and trace amounts of Cr and V. The elongated/circular (Mn, S)-rich inclusions were observed with a size of ca. 6–9 µm, while the secondary micro-inclusions exhibited an average size of ca. 860 nm (see Figure S5, Supporting Information). Notably, the presence of such secondary micro-inclusions within the (Mn, S) inclusions was identified at both horizontal distances from the inner wall of the RPV.
Similar features were observed in the weld material, U2-W, that was extracted from the lower part of the RPV at the same distances of 39 mm (in) and 71 mm (out) from the inner wall, both characterized by very low neutron fluence (see Table 1). In both U2-W samples, the distribution of the inclusions with circular morphologies is observed as shown in Figure 3. The size of these inclusions is in the average range of ca. 0.09–2 µm, and again, deep, dark contrast areas of the secondary micro-inclusions clearly appear in their center (see Figure 3, Pos. (1) and Pos. (2)). The chemical compositions of these micro-inclusions were confirmed by EDS experiments, which revealed a high concentration of O, Si, and Fe, suggesting the formation of silicates and iron oxides. Additionally, Mn and Al were detected, along with trace amounts of V, Cr, and Ti (see Figure 3). SEM analysis revealed that the (Mn, S) inclusions within the weld material are more homogeneously distributed throughout their matrices compared with those identified in the base material (Figures S3 and S4, Supporting Information), and exhibit significantly smaller sizes, within the nanometer range. Therefore, when identifying the chemical compositions of their secondary micro-inclusions, they were not clearly distinguishable from their host, unlike in the base material (shown in Figure 3).

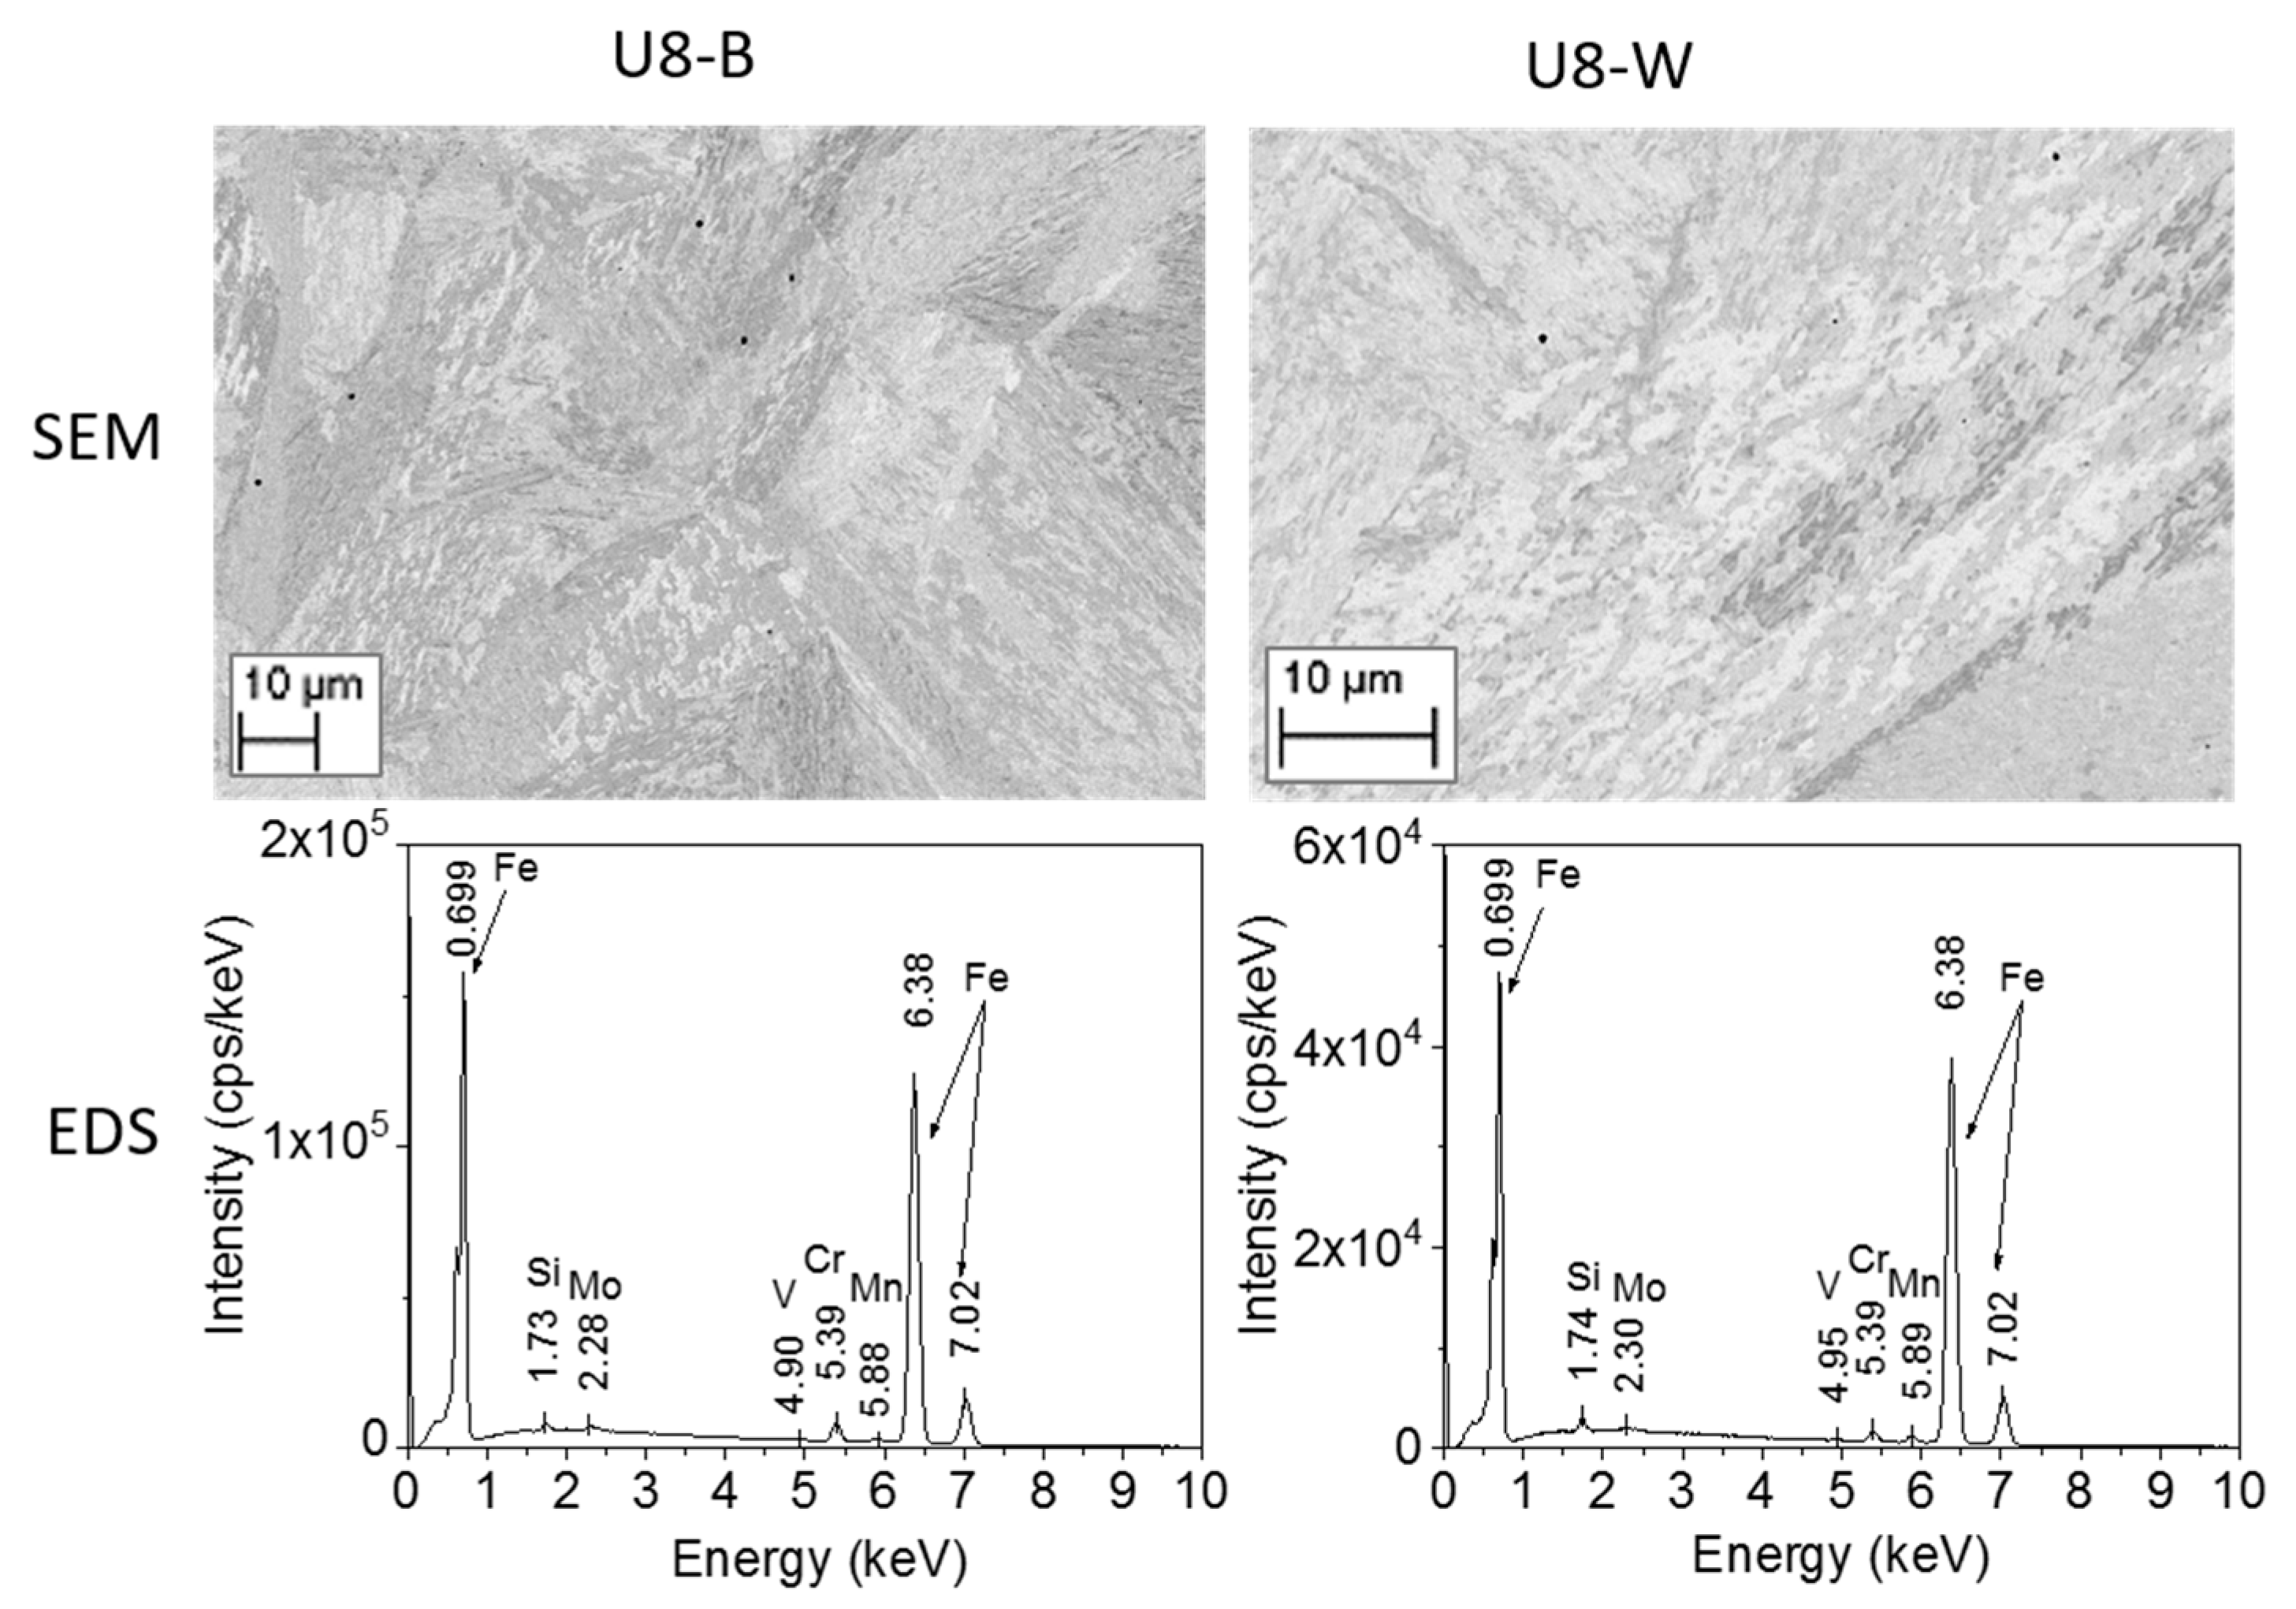
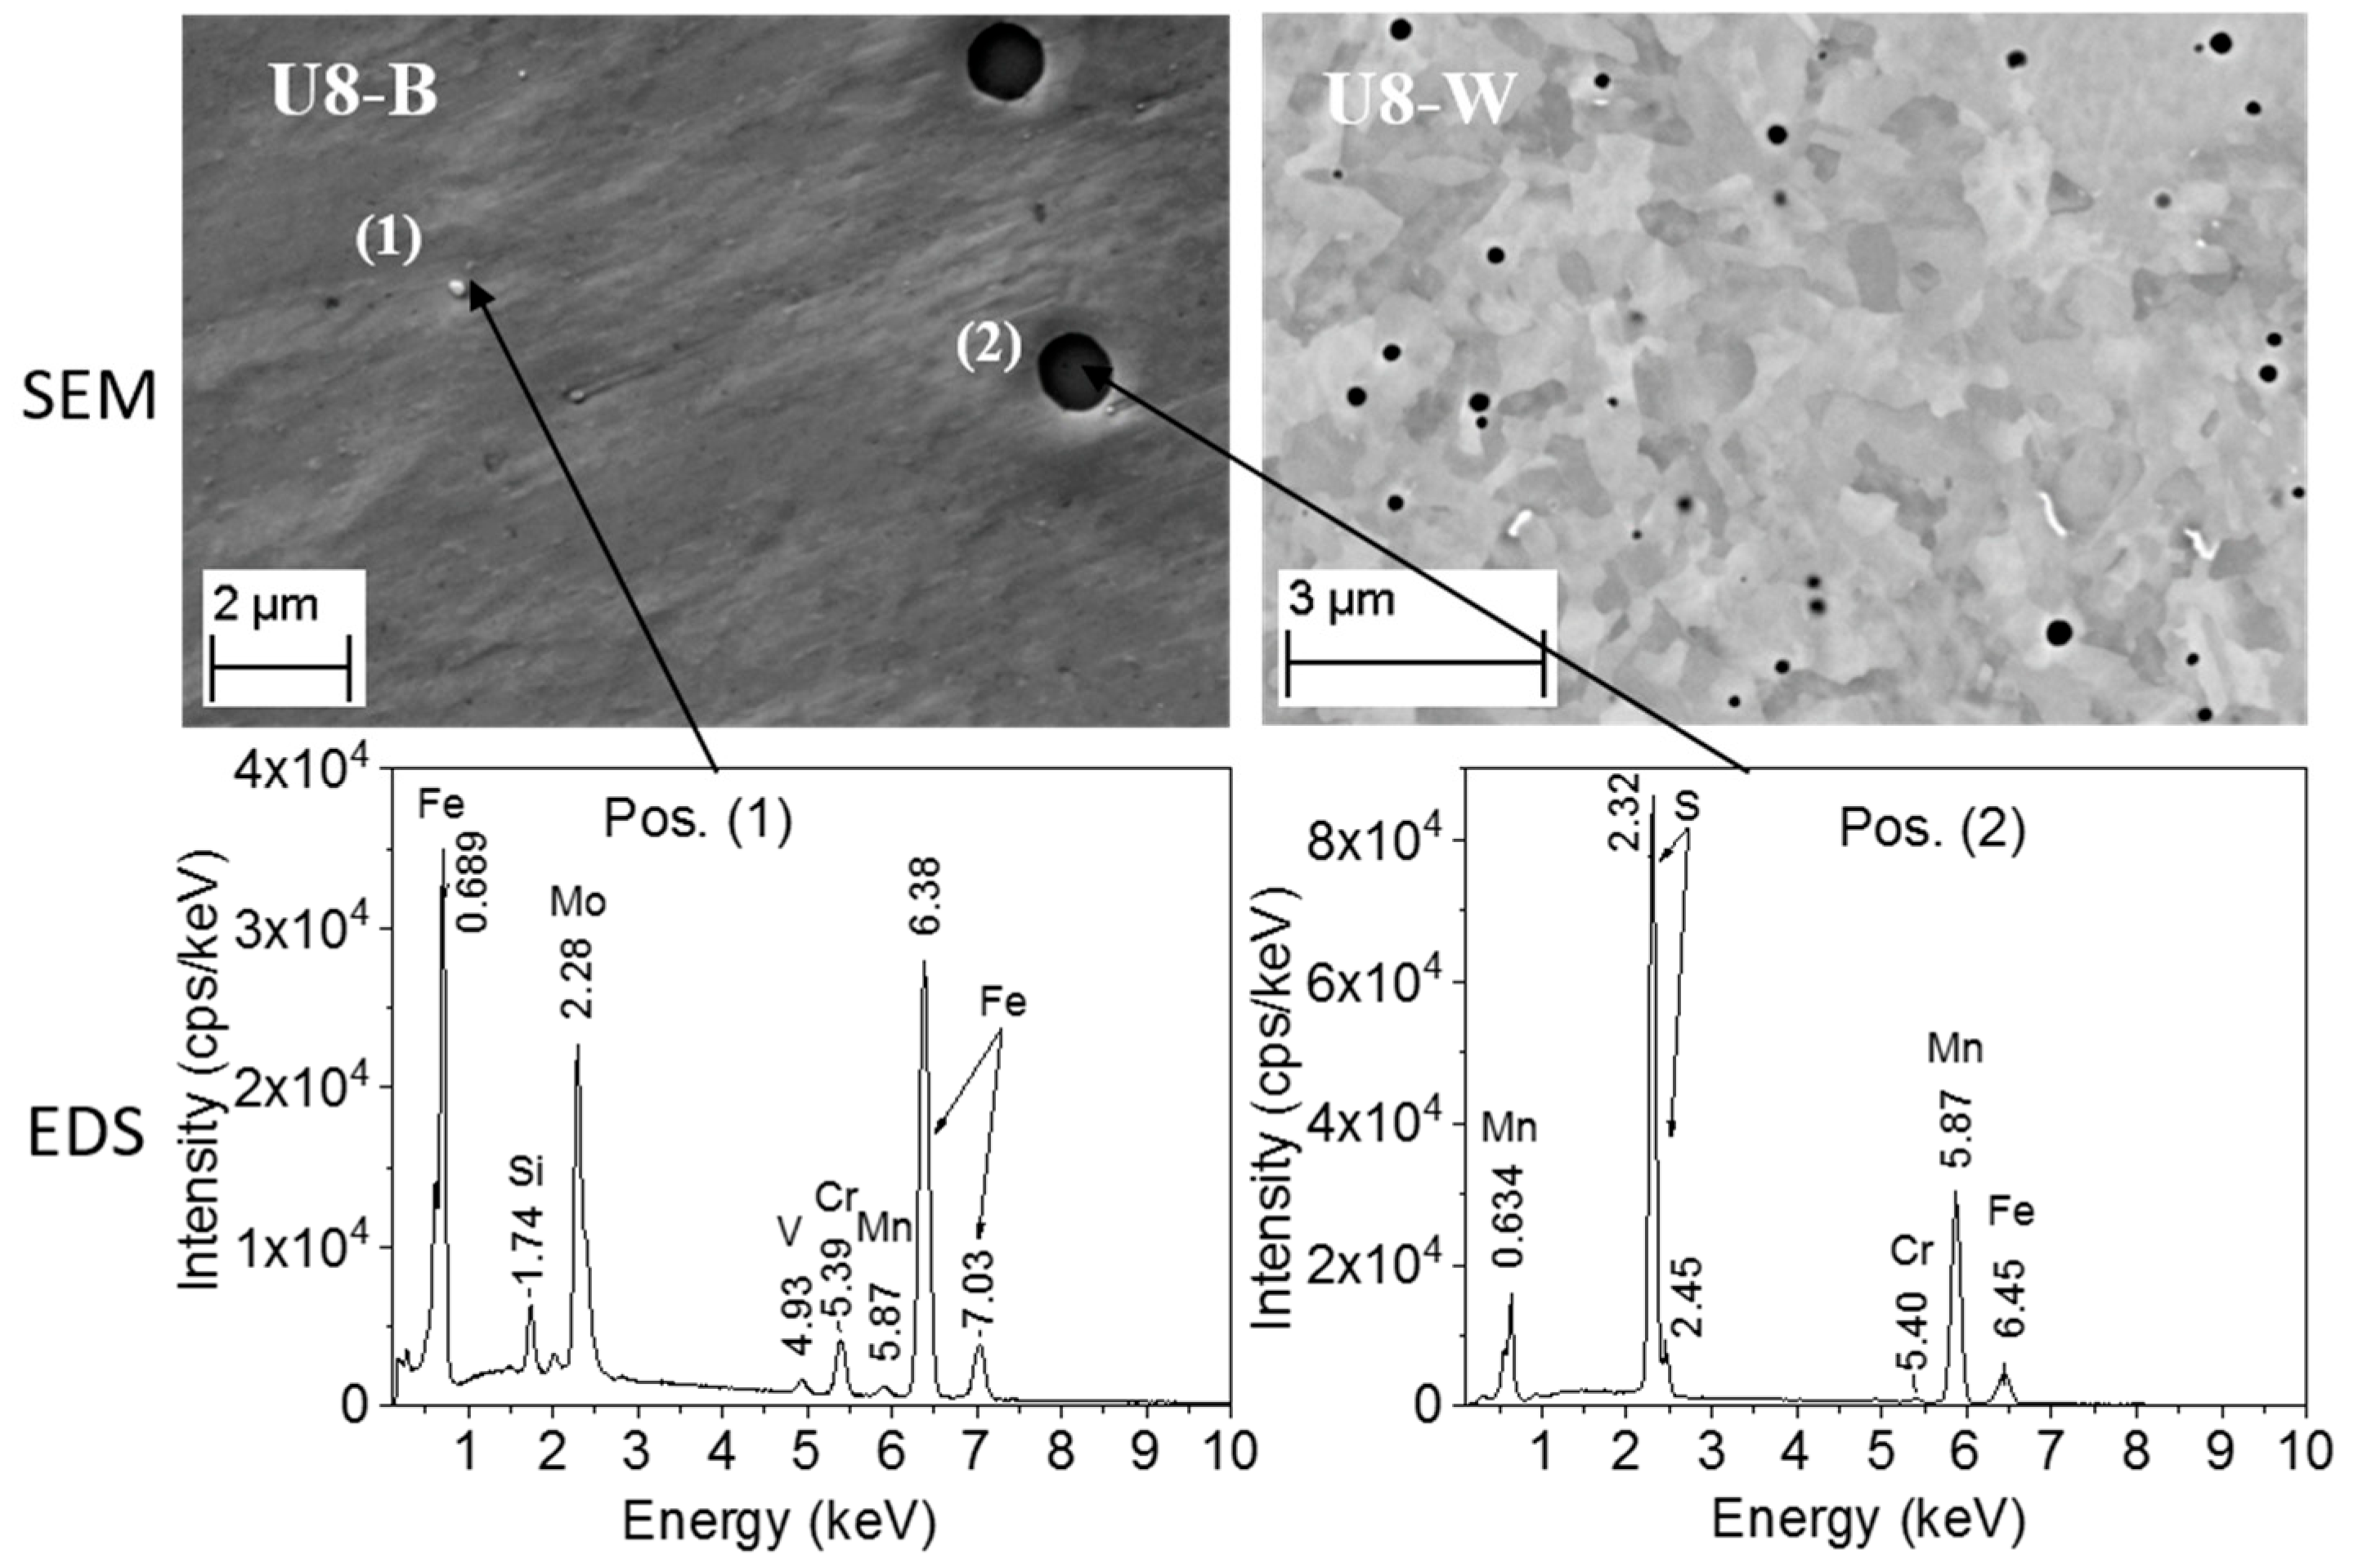
3.3.2. Characterization of the RPV Second-Generation U8 Samples

Similarly, surface analysis using SEM/EDS was performed on the second-generation reactor unit, U8, of the GW-NPP. Figure 4 and Figures S6–S8 in the Supporting Information show typical examples of inclusions with circular morphologies, appearing as dark contrast distributed across different areas of the steel material, and smaller precipitates, appearing as bright contrast.
The dark-appearing inclusions were characterized with sizes ranging from 1 µm to 100 µm (see Figure 4 and Figure S6A, Supporting Information). In contrast, the bright-appearing precipitates were observed with a size range from ca. 100 nm to 1 µm (Figure S6B). EDS analysis revealed that the bright-appearing precipitates (e.g., Pos. (1) in Figure 4) contain, in addition to Fe, high amounts of Mo, with the presence of Si and Cr and trace levels of V and Mn. This indicates that these precipitates consist of mainly Mo-rich phases. The dark-appearing inclusions (Pos. (2) in Figure 4) contain mainly Mn and S along with trace amounts of Fe and Cr. Similar SEM/EDS experiments were performed on the weld material (U8-W) RPV samples. These revealed the same observations, indicating the presence of (Mn, S)-rich inclusions and Mo-rich precipitates. Similarly, the (Mn, S) inclusions in the weld material were found to have a smaller size range (ca. 350 nm–1.5 µm, see Figure 4), following the same trend observed for the samples from the first-generation reactor units, U1 and U2.
In summary, both the first- and second-generation reactor units exhibited similar material properties. However, the (Mn, S) inclusions in the first-generation U1 and U2 reactor units displayed a distinct circular/elongated morphology, with larger sizes along with discrete deep, dark-appearing areas identified as secondary micro-inclusions, in both the base and weld materials. These features were not identified in the second-generation U8 reactor unit. Elemental analysis of these secondary micro-inclusions in U1 and U2 revealed a high concentration of Fe, Si, and O, suggesting that silicates and iron oxides are the primary phase constituents.

3.4. Spectroscopic Characterization of Steel Inclusions

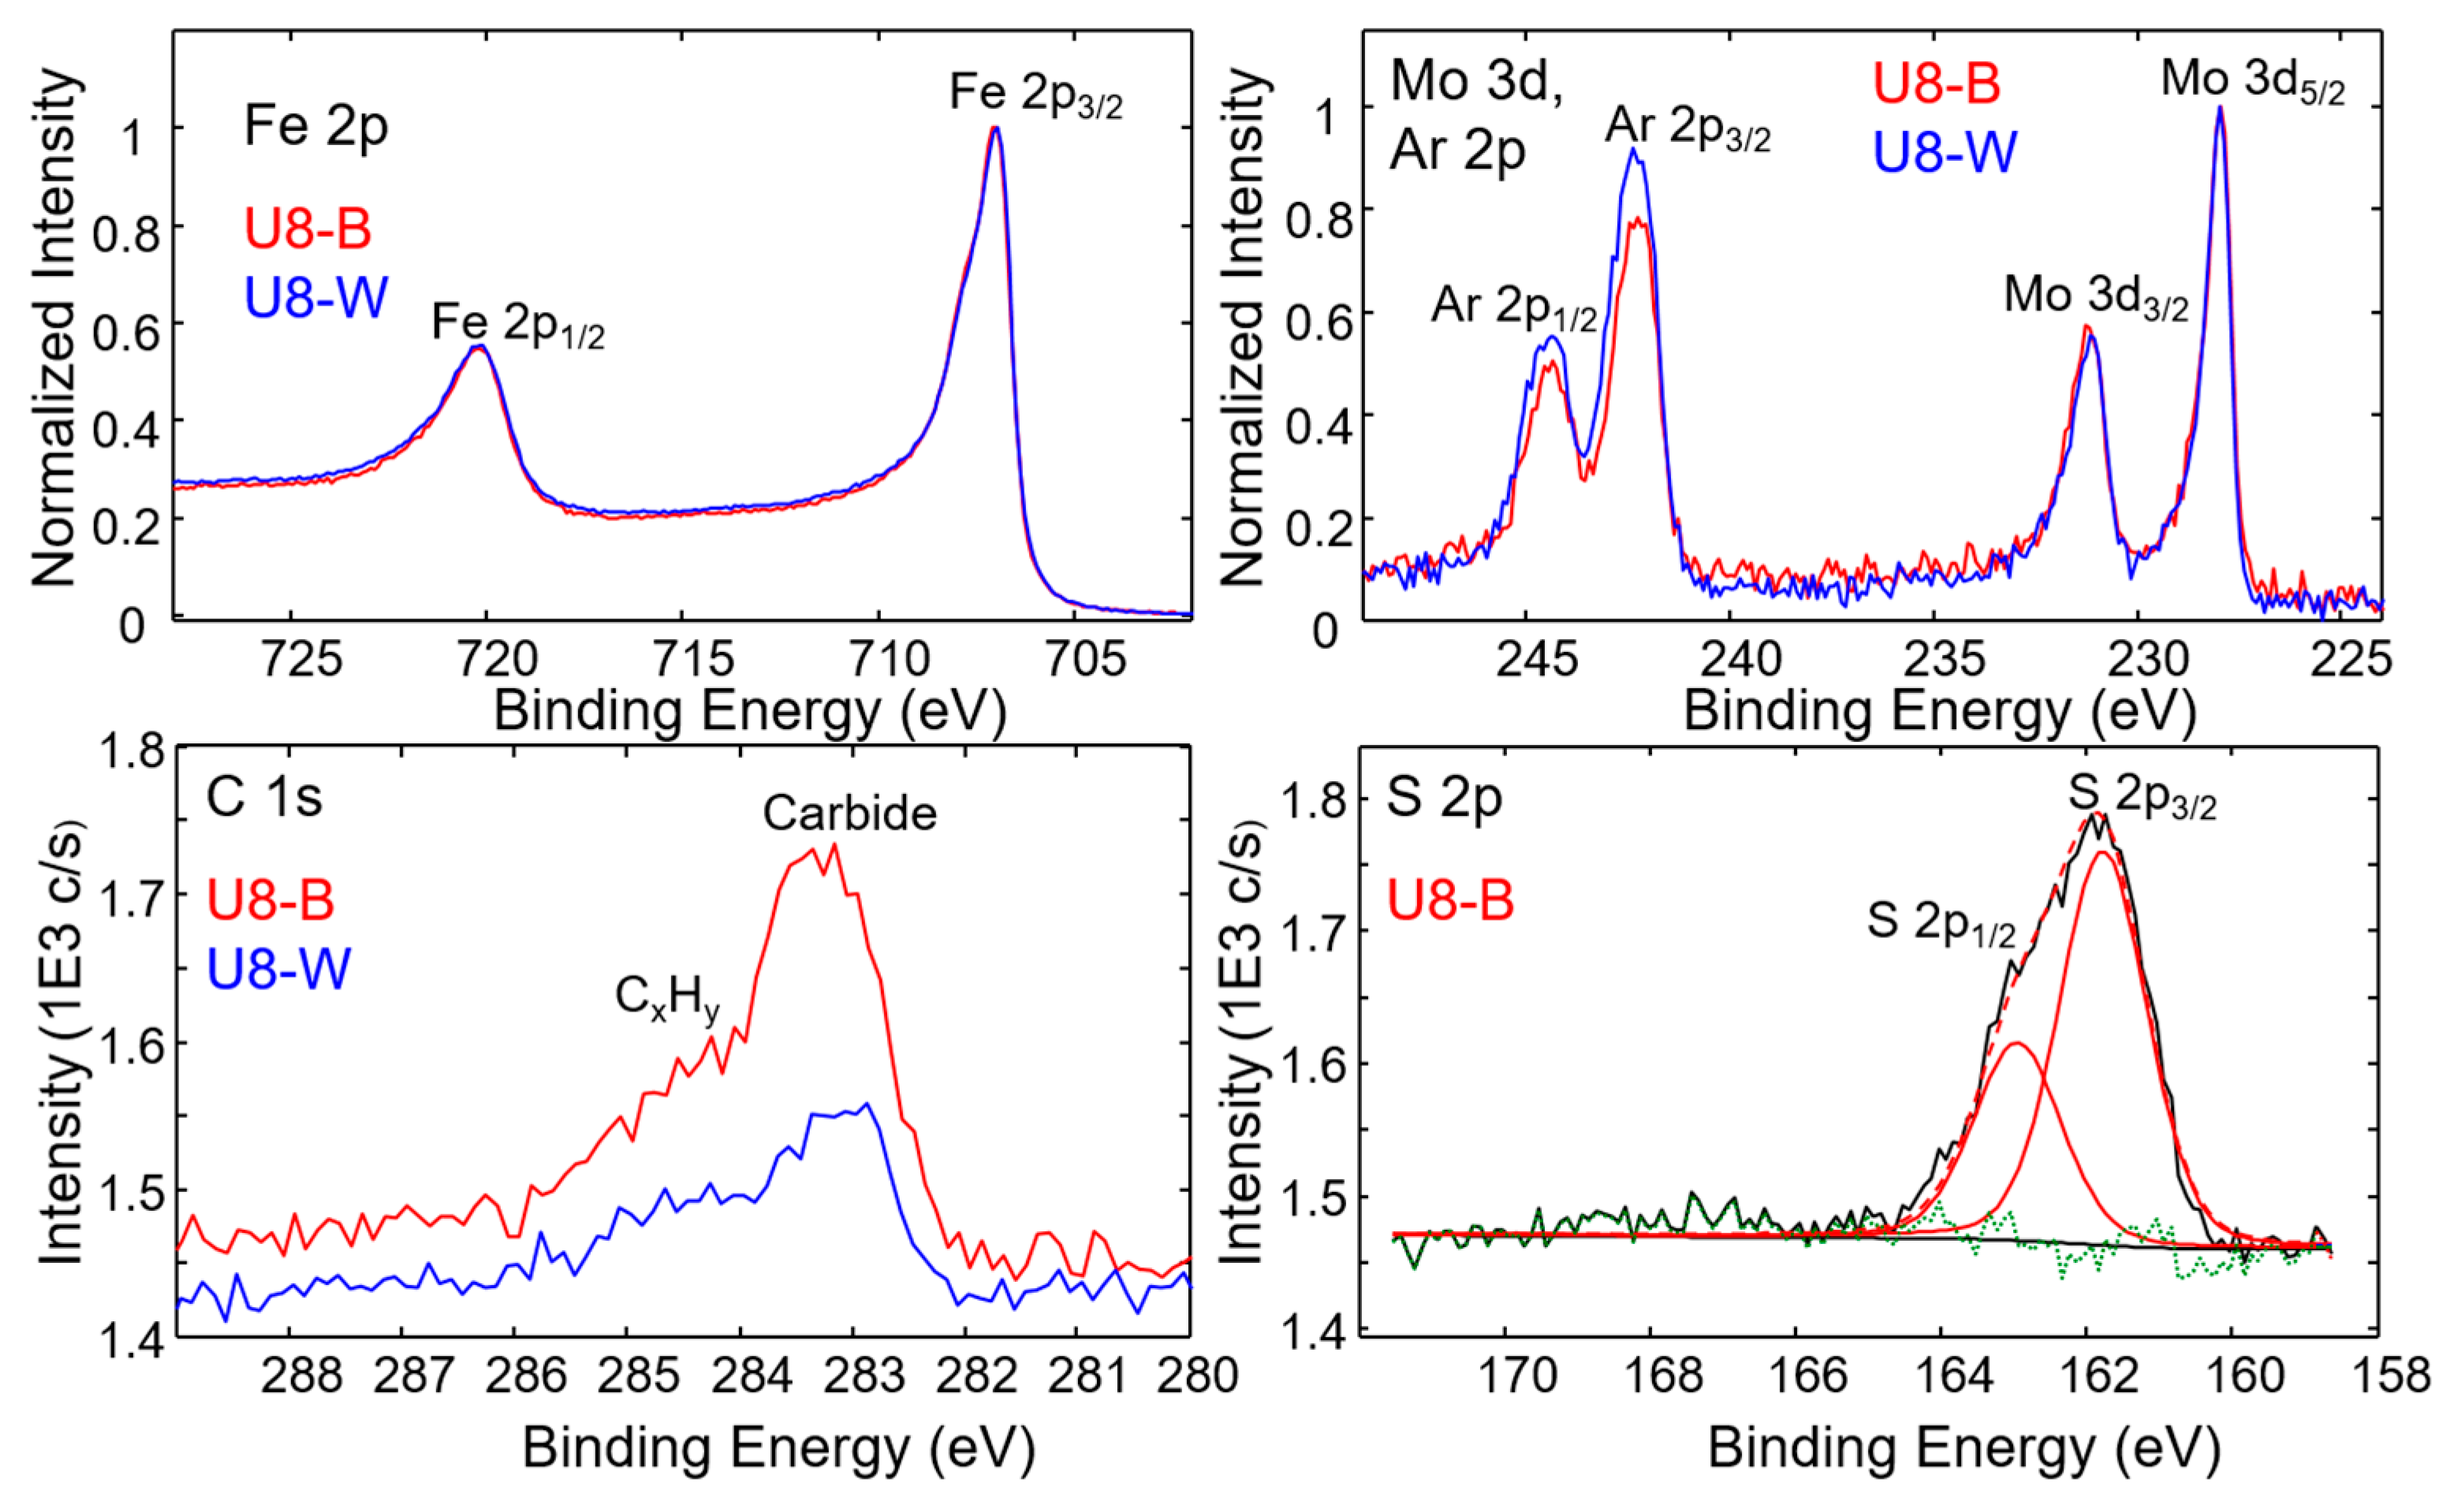
3.4.1. X-Ray Photoelectron Spectroscopy (XPS)

To understand the composition of the Mn-S inclusions and the Mo precipitates identified during the SEM analysis, XPS measurements were performed on the base (U8-B) and weld (U8-W) samples. Although the sizes of the identified Mn inclusions in the weld material were smaller than those in the base samples, both sample types showed similar XPS spectra for the elemental lines. The measurement results are summarized in Figure 5. Figure S9 in the Supporting Information shows an overview over the whole measurement region.
After 10 min of ultrasonic cleaning of the sample surface by phosphoric acid detergent, the S 2p3/2 elemental line at a binding energy of 161.8 eV could be assigned to sulfide, while no sulfate or sulfite was detected (Figure 5). S 2p3/2 reference binding energies are 162.7 eV (Cr2S3), 161.8 eV (MnS), 161.9 eV (MnS2), 160.8 eV (FeS), (161.3–162.9) eV (FeS2), and (161.3–163.4) eV (MoS2) [45]. Based on these reference values, MnS and the disulfides of Mn, Fe, and Mo could be assigned to the measured value in the U8 steel samples. With the clear correlation of high manganese and sulfur concentrations in the micro-inclusions, determined by SEM/EDS (see Section 3.3.2), the presence of MnS, MnS2, or mixed Mn, Fe-sulfides in the steel samples is very likely. Due to the very similar binding energies, however, an unambiguous assignment of the stoichiometry of the manganese sulfides cannot be made.
After subsequent argon ion etching to remove oxides from the surface (Ar+, 3 keV, 1.3 × 1.3 mm2, 1 min, 4 µA, Zalar rotation), sulfur elemental lines were not detected anymore due to preferential sputtering. The Mo 3d5/2 elemental line was found at 228.0 eV binding energy. This value is identical to the reference binding energy for metallic Mo; however, reference binding energies of MoSi2 (227.7 eV), Mo2C (227.8 eV), and MoO (228.3 eV) are within the experimental resolution of the XPS measurements [45]. Therefore, the composition of the Mo precipitates identified in the EDS investigations cannot be unambiguously assigned from the XPS data. Our EDS analyses, however, showed the coexistence of Mo and Si, with the absence of O in the precipitates. Based on the measured binding energies in the XPS investigations, this suggests the presence of at least MoSi2 precipitates in the steel samples. The Ar 2p3/2 elemental line of implanted Ar by sputter etching is observed at 242.3 eV binding energy (Figure 5).

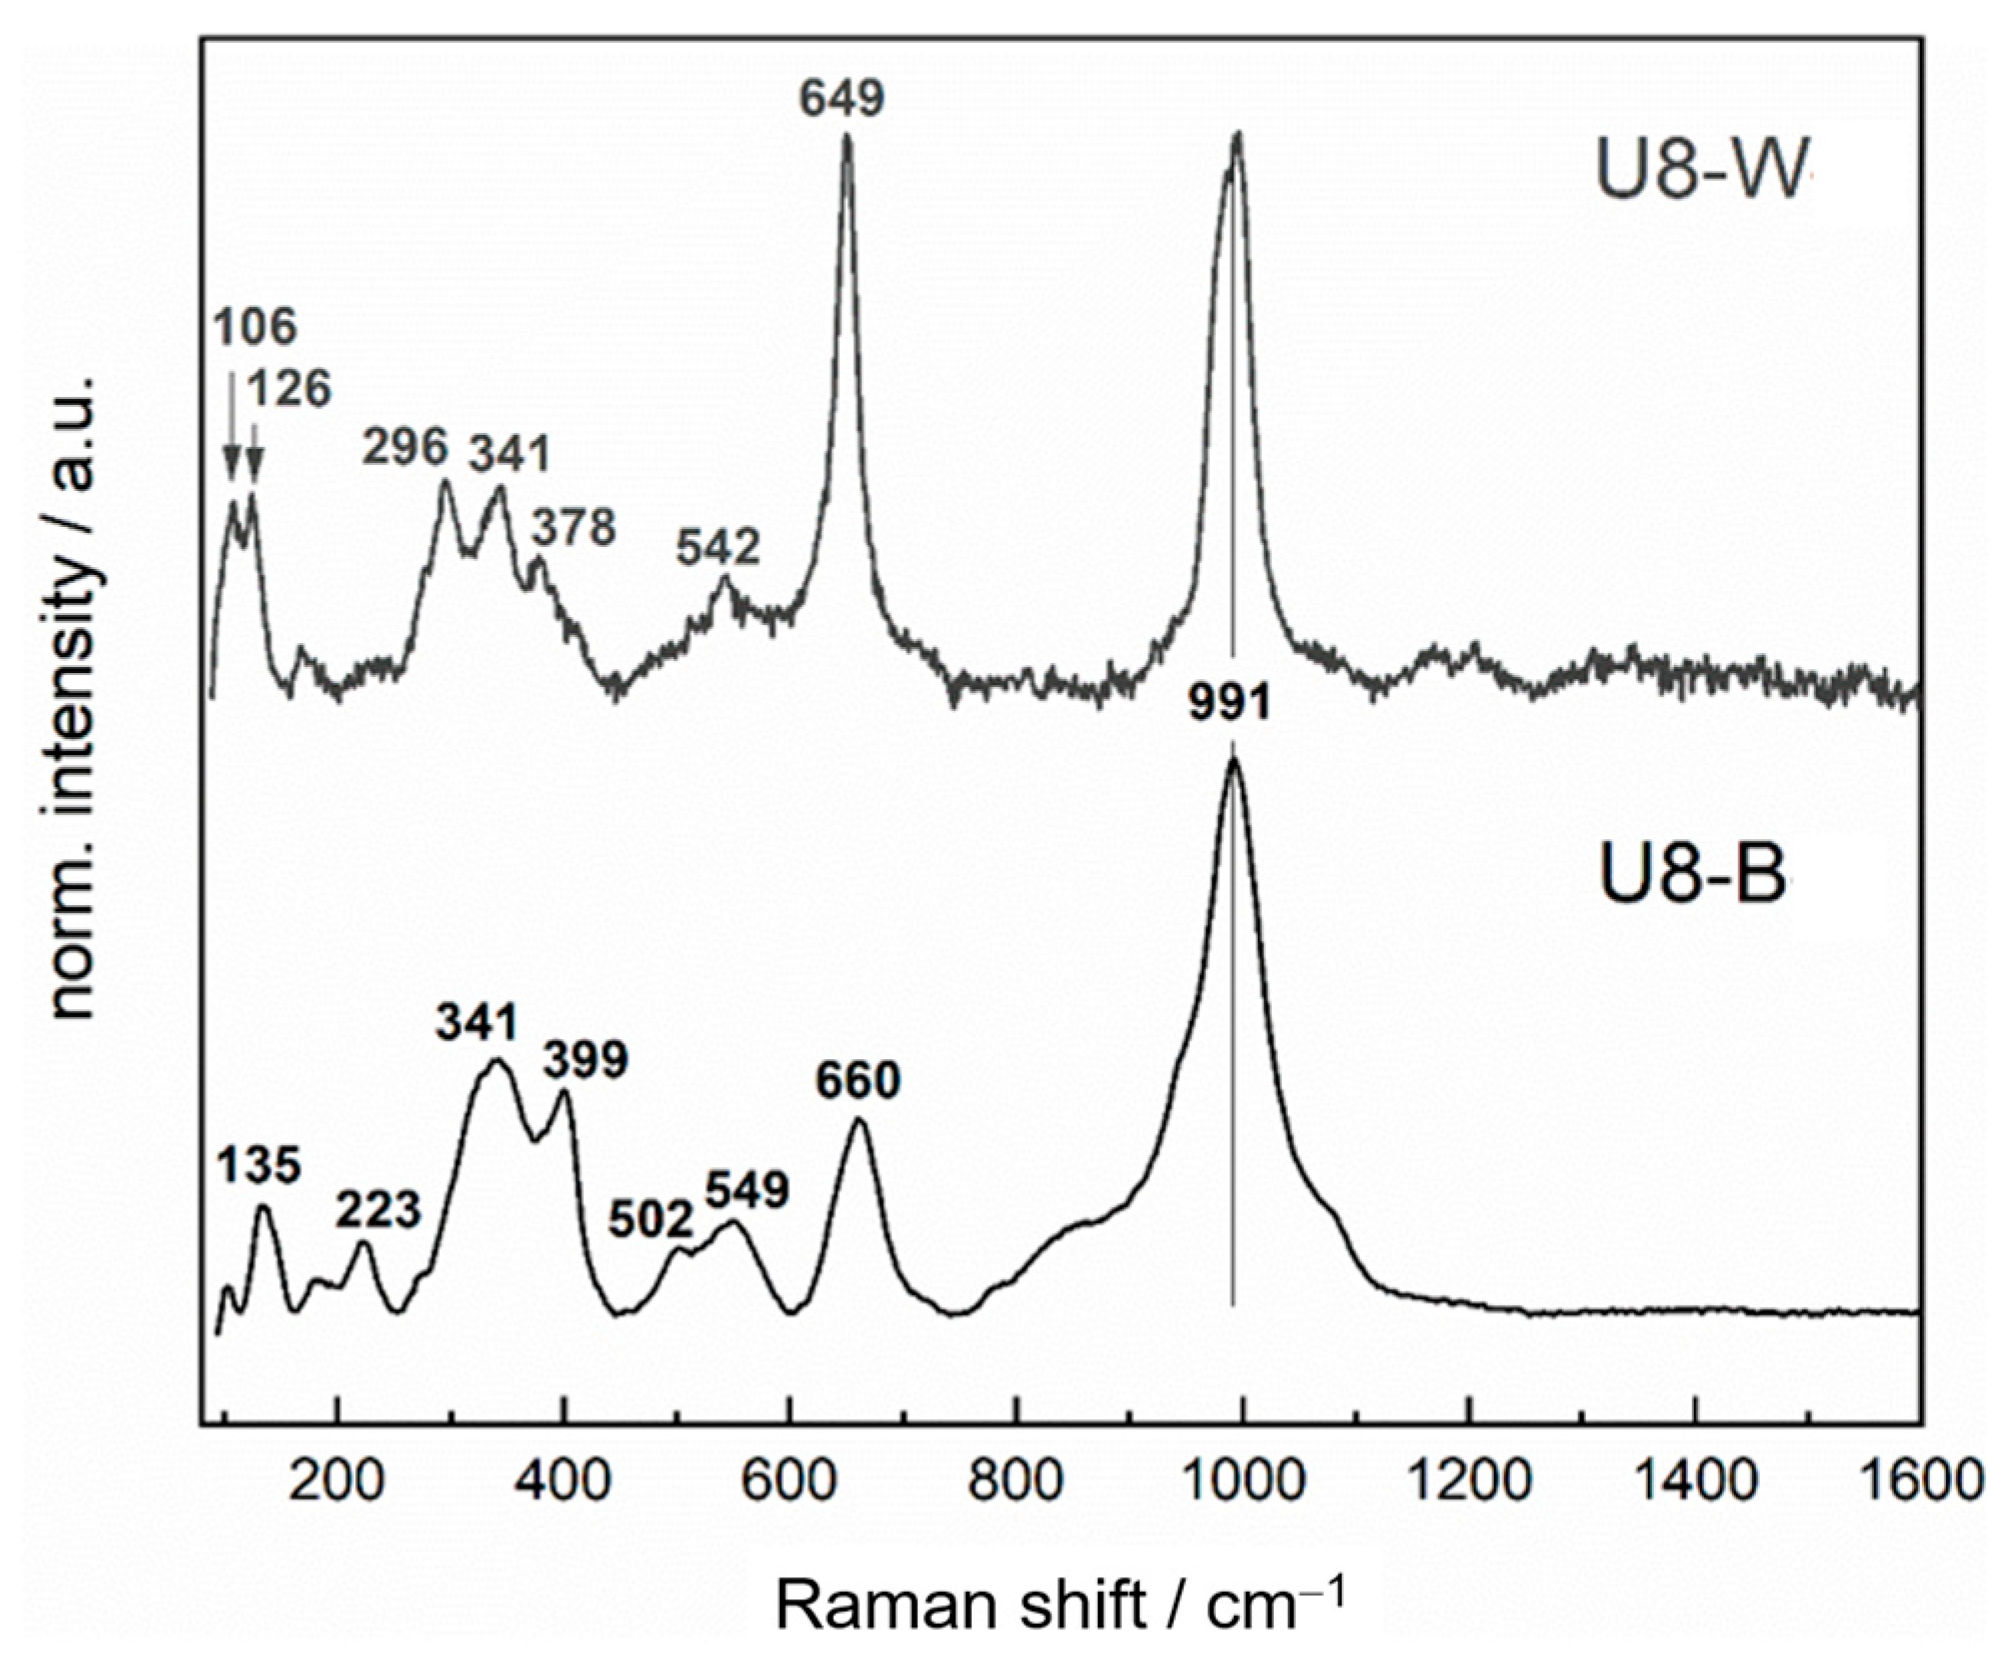
3.4.2. Raman Spectroscopy

In addition to EDS analysis, where Mn-containing inclusions and the formation of iron oxide or silicate phases were discerned, Raman spectroscopy was applied to both samples from the first-generation (U1, U2) and the second-generation (U8) RPV samples. Raman spectroscopy measures the frequency shift of inelastic scattered light caused by the excitation of the molecules within the sample by a laser light, with this shift being a characteristic of the studied material [8]. Previous studies have been conducted on different metal alloy steel materials in aqueous medium at elevated temperature and pressure for understanding the corrosion behavior related to the chemical composition of the materials. Kim et al. performed in situ Raman analyses of Ni-based alloy/low alloy steel dissimilar weld metals (DWMs) that were used as key components in the nuclear power plants [8]. Maslar et al. conducted several studies of in situ Raman measurements of iron as well as stainless steel corrosion in air-saturated water conditions [10,46]. Li and Hihara used µ-Raman spectroscopy to identify inclusions in carbon steels [47]. Our interpretations of the Raman spectra are based on this and other selected literature [8,9,10,46,47,48,49,50,51,52,53,54,55,56,57,58] (listed in the Supporting Information, Table S1).
Raman experiments were performed on both the base and the weld material of both the first-generation RPV samples (U1-B, U2-W) and the second-generation (U8-B, U8-W) samples. Because the size of the Raman laser beam is within the µm range, we focused on characterizing the matrix containing the identified inclusions. The positions of the respective Raman laser beams are provided in the Supporting Information, Figures S10 and S11.
To understand the phase composition of the (Mn, S) inclusions, we first analyzed inclusions without secondary micro-inclusions. After identifying their phase compositions, we then focused our analysis on their secondary analogs. Therefore, we started our Raman measurements on the second-generation material on both the base U8-B and weld U8-W samples, and their respective spectra are presented in Figure 6. The peak positions and their respective assignments are summarized in Table 4. The peak positions are slightly different when comparing the two RPV steels. Furthermore, the main peak of inclusions in the base material at 991 cm−1 is rather asymmetric and significantly broader in comparison with the weld sample.
The strong peak at 991 cm−1 is very typical for silicates [51,52,53], possibly in connection with Mn2+ [51]. Furthermore, both metals show typical bands representing γ-Fe2O3 in U8-B at 660 cm−1, 502 cm−1, 341 cm−1; and in U8-W at 649 cm−1, 341 cm−1 [10]; α-Fe2O3 in U8-B at 502 cm−1, 399 cm−1, 223 cm−1; and in U8-W at 296 cm−1 [10,50]. The strong band at 660 cm−1 from the base metal U8-B could also be assigned to Fe3O4 [9,10] or even in combination with the band at 502 cm−1 to NiCr2O4 [8]. This could be explained by a higher content of Ni and Cr in the base metal compared with the weld metal (see Table 2, OES results). Due to the same reason, the smaller band at 549 cm−1 of U8-B could be assigned to Cr2O3 [8]. In contrast, U8-W, which contains more Mn than base metal (see Table 2, OES results), shows a strong peak at 649 cm−1, which can be assigned to MnFe2O4 [47].
According to EDS results, the steel inclusions should contain high concentrations of sulfur. Iron and manganese sulfides are characterized by rather weak signals with Raman shifts around 200–350 cm−1 [47,49,59,60]. Our weld metal sample shows a Raman signal at 296 cm−1. This could arise from an iron sulfide phase such as mackinawite, with a reported Raman shift at exactly 296 cm−1 [49]. As this range in the Raman spectra suffer from overlapping contributions from the above-discussed oxide phases, the presence of sulfides in the darker regions of the steel samples cannot be unambiguously confirmed and assigned in the Raman data. Finally, carbides such as FeC or MoC have characteristic Raman bands at >1300 cm−1 (D-band) and >1600 cm−1 (G-band) [61,62]. These are not present in our Raman spectra, and are therefore not present in the steel inclusions. Although Mo2C has been reported to show a strong Raman signal at 992 cm−1, which coincides with the prominent Raman signal (Figure 6) previously assigned to silicates, the carbide species should be accompanied by an additional, rather strong signal at approximately 820 cm−1, which cannot be detected in our Raman data. Therefore, the presence of carbide species can be excluded.
The Raman spectra collected for the U1 and U2 steel materials have been compiled in Figure 7, together with the spectra of the respective U8 samples, for comparison.
The base material of sample U1-B differs from that of the base material U8-B. U1-B shows a broad band in the range of 520 cm−1 to 680 cm−1, centering at approximately 593 cm−1, and a strong band at 282 cm−1 dominating the spectrum, along with medium-sized bands at 483, 387, and 223 cm−1 (Figure 7A). The broad band at 520–680 cm−1 might, on the one hand, arise from defects in present oxide materials in the irradiated base material, such as oxygen vacancies or interstitial oxygen clusters, as reported for various oxide materials following irradiation [63,64,65]. On the other hand, a recent publication presented Raman bands for different MnS phases showing up at 635 cm−1 [48]. This would confirm the EDS results that the inclusions mainly consist of MnS (see Figure 2). Additionally, the strong band at 282 cm−1 can be assigned to a (Fe, Mn)S solid solution [47], which also would support the assumption of the presence of MnS. Furthermore, the bands at 483 and 223 cm−1 could be possibly assigned to elemental sulfur [52]. All Raman data and the respective assignments of sample U1-B are summarized in Table 5.
The Raman spectrum of the U2-W weld material (Figure 7B) is very similar to that of U8-W. This is likely because the inclusions in the weld material are significantly smaller than those in the base material, making it difficult to distinguish between the matrix, inclusions, and micro-inclusions due to the size of the laser beam (see Figure S11, right, in the Supporting Information). The assignments of the identified peaks are similar to those of U8-W in Table 4. Briefly, the strong peak at 994 cm−1 can be assigned to silicate, and the other main peaks at 652, 341, and 296 cm−1 to iron oxides.

4. Discussion

The aim of the study is to deepen the understanding of RPV steel material by examining its microstructural features and the possible phase composition of the irradiated RPV material. This is crucial for assessing future nuclear waste repository scenarios, particularly with respect to corrosion processes that could lead to the mobilization of radionuclides. Therefore, RPV steel samples were selected from both first-generation (U1 and U2) and second-generation (U8) reactor units of the Greifswald NPP. OES analysis revealed that the first-generation steel had higher concentrations of Cu, Ni, and slightly increased Co compared with the second-generation steel. Specifically, the base and weld metals of the first-generation reactors U1 and U2 contained Cu concentrations of 0.17% and 0.16%, respectively, while the second-generation reactor unit U8 contained only 0.05% and 0.08% Cu, respectively (see Table 2). Previous studies have shown that Cu concentrations above 0.1% have a detrimental effect and can noticeably influence irradiation embrittlement [5,27]. Therefore, the sensitivity of steel is governed by the type and the composition of the alloying elements. Furthermore, the Ni content in the first generation, U1 and U2, was found to be 0.18% and 0.17%, respectively, while the second generation, U8, contained only 0.06% Ni. This indicates that, in addition to Cu, Ni also plays an important role in the material properties of the RPV steel material. Interestingly, Bing at al. applied machine learning methods to identify the most important factors influencing irradiation embrittlement in RPV steel [66]. They confirmed that Cu, P, and Ni are critical in determining irradiation embrittlement [66]. In this study, we were able to reveal the differences in the elemental compositions, particularly Cu and Ni, between the first- and second-generation RPV steel samples and correlate these differences with their microstructural features.
SEM/EDS measurements were performed to compare the microstructural characteristics of the first-generation reactor units (U1 and U2) with those of the second-generation reactor units (U8). Both the U1 and U2 as well as the U8 reactor units showed the presence of Mo-rich precipitates and (Mn, S) inclusions. The (Mn, S) inclusions of the first generation (U1-B and U2-W) revealed the presence of secondary micro-inclusions, characterized by discrete dark areas either in their center or at their inclusion/matrix boundaries. EDS measurements revealed high concentrations of O, Fe, and Si, indicating the presence of iron oxides and silicates, along with traces of metal alloys such as Cr, V, and Ti. These secondary micro-inclusions were a characteristic feature of the first-generation reactor units (U1 and U2). Furthermore, the sampling position from the reactor core, specifically, the base U1-B and weld U2-W materials, showed no significant influence from low neutron fluence or potential temperature gradients during operation on the material properties of these inclusions. Samples taken at 39 mm (in) and 71 mm (out) from the inner RPV wall exhibited similar material properties for the (Mn, S) inclusions, suggesting uniformity across both positions. Therefore, the difference in the microstructural features of the (Mn, S) inclusions between both generations can be attributed primarily to variations in alloy composition. Our studies confirm that the composition of the alloying material, particularly Cu content > 0.1% and Ni 0.2%, significantly influences microstructural features of the RPV steel material, as observed in the first-generation reactor units U1 and U2.
To acquire a deeper knowledge of the phase composition of the precipitates and inclusions within the steel matrices, we performed XPS and Raman spectroscopy. XPS supports the EDS results having Mo precipitates, probably in the form of MoSi2. Raman spectroscopic data confirmed the presence of iron oxides (γ-Fe2O3, Fe3O4) and silicates (Mn-SiO3) along with Cr2O3/NiCr2O4 in the base material. Additionally, Cr and Ni were found to have higher concentrations in the base than in the weld material. However, the results confirmed the presence of MnFe2O3 in the weld material, which is characterized by a higher amount of Mn, in agreement with OES experiments. Furthermore, the Raman spectrum of the U1-B sample showed the additional features of the presence of high levels of MnS and FeS phases. Following the EDS results, these phases could represent the inclusions with the deep, dark-appearing areas at their centers and at the inclusion/matrix boundary, that is, their secondary micro-inclusions.
It is important to note that after long-term operation, the RPV steel significantly contributes to radioactivity during both decommissioning and long-term nuclear waste storage. Due to the large number of components and impurities in the RPV steel, a variety of radionuclides can be produced by neutron activation. During decades of operation, considerable activities can be produced in the RPV in the height of the fission zone. The most important radionuclides with half-lives longer than one year are 14C, 55Fe, 60Co, 59Ni, 63Ni, 93Mo, 93mNb, and 99Tc.
55Fe is primarily produced by the reaction 54Fe(n,γ)55Fe and, to a small extent, by 56Fe(n,2n)55Fe. High specific activities are expected to be found in the bulk material and secondary micro-inclusions at the end of the operation phase due to the production by isotopes of the main component of the steel. However, a vast majority of its activity will decay in the decommissioning phase due to its short half-life of 2.7 years. 54Mn is mainly produced by fast-neutron activation of 54Fe by the reaction 54Fe(n,p)54Mn. The reaction 55Mn(n,2n)54Mn plays only a minor role. The majority of 54Mn is expected to be found in the bulk material rather than in the Mn-rich inclusions; however, most 54Mn has a very short half-life of 312 d, and it normally decays during the decommissioning phase.
The most important radionuclide during the decommissioning and dismantling phase is 60Co. We could measure remarkable amounts of 60Co in both the U1 and U2, samples from the first-generation RPV, even more than 30 years after shutdown of the reactors (see Table 3). It should be noted that the smaller Co mass fraction found in the second-generation compared with the first-generation steel samples (see Table 2) would cause the production of smaller 60Co activities.
For intermediate and final storage, the long-lived radionuclides are essential, with 14C being the key critical nuclide. Even in the samples from low activated regions that we investigated here, we could measure 14C activities (see Table 3). 59Ni and 63Ni are primarily produced by the reactions 58Ni(n,γ)59Ni and 62Ni(n,γ)63Ni, respectively. Production of 63Ni is also possible by fast-neutron activation of copper by the reaction 63Cu(n,p)63Ni. The smaller Cu mass fraction of the second-generation RPV steel was chosen to limit the radiation embrittlement. Together with the slightly decreased Ni mass fractions, it would also cause a slightly smaller production of the radionuclides 59Ni (half-life 76,000 years) and 63Ni (100 years). 93Mo is primarily produced by the reaction 92Mo(n,γ)93Mo and only to a small extent by the 94Mo(n,2n) reaction. It has a half-life of 4000 years and decays to 93Nb (ground state, stable) or 93mNb (half-life 16 years). After several decades, however, a radioactive equilibrium of 93Mo and 93mNb will be reached. Additionally, 99Tc, with a half-life of 211,000 years, is a decay product of 99Mo that is produced by the reactions 98Mo(n,γ) and 100Mo(n,2n). All three radionuclides are therefore expected to be found in the Mo precipitates. Of these, 99Tc is particularly important for long-term storage due to its long half-life and the high mobility of the TcVIIO4 main species under oxidizing conditions.
As corrosion reduces the integrity of the steel material, there is a potential risk that radionuclides concentrated in precipitates and micro-inclusions, such as 99Tc and 93mNb under intermediate- to long-term storage as well as 55Fe during the early stage of decommissioning and short-term storage, in addition to 60Co, 59Ni, and 63Ni, could be leached from the steel. Whereas the 14C release and speciation from irradiated steel due to corrosion has been studied several times [67,68,69,70,71,72,73], similar investigations concerning the other radionuclides of interest listed here are rare [74]. Therefore, further studies are needed to assess the release and speciation of these activation products under repository-relevant conditions. Investigations based on the influence of the oxide and sulfide phases and their interaction with radionuclides are important to be performed in the future. In particular, it is necessary to quantify and understand the speciation of these radionuclides in the presence of such phases, considering the conditions of a potential geological repository.

5. Conclusions

This study presents a comprehensive comparison of the first-generation (U1 and U2) and second-generation (U8) reactor units from Greifswald NPP. Through detailed chemical and microstructural characterization of both base and weld materials in the U8 and U1/U2 samples, we uncovered significant differences in the behavior of the (Mn, S) inclusions. Unlike in U8, the inclusions in U1 and U2 exhibited secondary micro-inclusions at their matrix/inclusion boundaries or within their centers. These microstructural variations are likely attributable to differences in the manufacturing processes between two distinct generations of the RPV steel, notably on the different alloy compositions between the first- and second-generation reactor units.
Our findings deepen the understanding of the material properties of RPV units from different generations that underwent operation, decommissioning, and ambient storage. This study marks an important step forward in developing more accurate models for assessing potential scenarios in future nuclear waste repositories. Future research on relevant conditions is essential to evaluate possible corrosion processes and their impact on the potential release of radionuclides. In particular, detailed investigations into the corrosion behavior and kinetics of (Mn, S) inclusions and their associated oxide phases identified in this study are essential for advancing our knowledge of the long-term stability and safety of nuclear waste repositories.

Supplementary Materials

The following supporting information can be downloaded at: https://www.mdpi.com/article/10.3390/jne6020012/s1, Figure S1. Schematic of the sampling positions of trepans taken from RPV of Greifswald-NPP; Figure S2. SEM imaging of the first generation reactor units sample U1-B, revealing the presence of dark areas of (Mn, S) enriched inclusions and the presence of Mo bright precipitates; Figure S3. Microstructural features of base metal samples U1-B showing the distribution of (Mn, S) inclusions within the matrix, with different size dimensions within the range of ca. (6–9) µm; Figure S4. Microstructural features of the weld metal samples U2-W showing more homogeneous distribution of (Mn, S) inclusion, with smaller size within the range from ca. (1µ m to 90 nm) compared to U1-B; Figure S5. (Mn, S) inclusions within the first generation base material of U1-B within A) the inner wall and B) outer wall of the RPV with average size of the inclusions (6–9) µm and their secondary micro-inclusions of average size of 865 nm; Figure S6. Backscattered electron imaging of RPV steel material of U8-B showing (A) the (Mn, S) inclusions at different locations with size range (1 µm–10 µm) level, (B) Mo-precipitates of size range of ca. 100 nm on their boundaries; Figure S7. Backscattered electron imaging of the weld RPV material (U8-W) showing the distribution of the (Mn, S) inclusions with small size range (nm-µm) at different locations; Figure S8. Microstructural features U8-B (left) with (Mn, S)-inclusion of size range up to 20 µm material, indicating that the material might undergo inhomogeneity of the composition mixture at certain locations; and U8-W (right) with more homogenous distributed inclusions; Figure S9. XPS survey of base (U8-B) and weld (U8-W) samples; Figure S10. Optical image with indication of area analyzed by Raman spectroscopy of the laser spots taken within the (Mn, S)-rich inclusions of the second generation samples; base sample U8-B (left) and the weld sample U8-W (right); Figure S11. Optical image with indication of area analyzed by Raman spectroscopy of the laser spot taken within the (Mn, S)-inclusion of the first generation samples; of the base (U1-B, left) and the weld material (U2-W, right); Table S1. Summary of Raman bands from literature. References [8,9,10,28,46,47,48,49,50,51,52,53,54,55,56,57,58] are cited in the Supplementary Materials.

Author Contributions

Conceptualization, G.Y.; investigation, G.Y., E.P. and D.S.; writing—original draft preparation, G.Y., N.M.H. and A.B.; writing—review and editing, G.Y., E.P., N.M.H., D.S., J.K., K.M. and A.B.; visualization, G.Y., N.M.H., K.M. and A.B.; supervision, A.B.; project administration, J.K. and A.B.; funding acquisition, J.K. and A.B. All authors have read and agreed to the published version of the manuscript.

Funding

This research was funded by the German Federal Ministry of Research and Education BMBF under the contract number 15S9412.

Data Availability Statement

The raw data supporting the conclusions of this article will be made available by the authors on request.

Acknowledgments

The authors acknowledge Mario Houska and Vanessa Dykas for providing the samples of interest and information of their conditions. The authors thank Luiza Braga Ferreira dos Santos for her assistance with the Raman measurements.

Conflicts of Interest

The authors declare no conflicts of interest.

References

  1. Hou, X.L.; Roos, P. Critical comparison of radiometric and mass spectrometric methods for the determination of radionuclides in environmental, biological and nuclear waste samples. Anal. Chim. Acta 2008, 608, 105–139. [Google Scholar] [CrossRef] [PubMed]
  2. Li, W.Q.; Fang, S.; Li, H. Research on the induced radioactivity of HTR-PM’s reactor pressure vessel: A comparative study between FLUKA, KORIGEN and QAD-CGA. Ann. Nucl. Energy 2018, 114, 129–135. [Google Scholar] [CrossRef]
  3. Robertson, D.E.; Thomas, C.W.; Wynhoff, N.L.; Hetzer, D.C. Characterization of long-lived activation products in spent fuel assembly hardware and reactor pressure-vessel steel. Nucl. Eng. Des. 1990, 118, 463–486. [Google Scholar] [CrossRef]
  4. Das, A. Fracture complexity of pressure vessel steels. Philos. Mag. 2017, 97, 3084–3141. [Google Scholar] [CrossRef]
  5. Odette, G.R.; Lucas, G.E. Recent progress in understanding reactor pressure vessel steel embrittlement. Radiat. Eff. Defects Solids 1998, 144, 189–231. [Google Scholar] [CrossRef]
  6. Emerson, J.N.; Marrero-Jackson, E.H.; Nemets, G.A.; Okuniewski, M.A.; Wharry, J.P. Nuclear Reactor Pressure Vessel Welds: A Critical and Historical Review of Microstructures, Mechanical Properties, Irradiation Effects, and Future Opportunities. Mater. Des. 2024, 244, 34. [Google Scholar] [CrossRef]
  7. Zhou, L.J.; Dai, J.; Li, Y.; Dai, X.; Xie, C.S.; Li, L.Z.; Chen, L.S. Research Progress of Steels for Nuclear Reactor Pressure Vessels. Materials 2022, 15, 8761. [Google Scholar] [CrossRef]
  8. Kim, J.; Choi, K.J.; Bahn, C.B.; Kim, J.H. In situ Raman spectroscopic analysis of surface oxide films on Ni-base alloy/low alloy steel dissimilar metal weld interfaces in high-temperature water. J. Nucl. Mater. 2014, 449, 181–187. [Google Scholar] [CrossRef]
  9. Kim, J.; Kim, S.H.; Choi, K.J.; Bahn, C.B.; Hwang, I.S.; Kim, J.H. In-situ investigation of thermal aging effect on oxide formation in Ni-base alloy/low alloy steel dissimilar metal weld interfaces. Corros. Sci. 2014, 86, 295–303. [Google Scholar] [CrossRef]
  10. Maslar, J.E.; Hurst, W.S.; Bowers, W.J.; Hendricks, J.H.; Aquino, M.I. In situ Raman spectroscopic investigation of aqueous iron corrosion at elevated temperatures and pressures. J. Electrochem. Soc. 2000, 147, 2532–2542. [Google Scholar] [CrossRef]
  11. Wu, X.Q.; Katada, Y. Role of inclusions and carbide bands in corrosion fatigue of pressure vessel steel in high-temperature water. Corrosion 2004, 60, 1045–1057. [Google Scholar] [CrossRef]
  12. Xing, R.S.; Yu, D.J.; Xie, G.F.; Yang, Z.H.; Wang, X.X.; Chen, X. Effect of thermal aging on mechanical properties of a bainitic forging steel for reactor pressure vessel. Mater. Sci. Eng. A-Struct. Mater. Prop. Microstruct. Process. 2018, 720, 169–175. [Google Scholar] [CrossRef]
  13. Hytonen, N.; Que, Z.Q.; Arffman, P.; Lydman, J.; Nevasmaa, P.; Ehrnsten, U.; Efsing, P. Effect of weld microstructure on brittle fracture initiation in the thermally-aged boiling water reactor pressure vessel head weld metal. Int. J. Miner. Metall. Mater. 2021, 28, 867–876. [Google Scholar] [CrossRef]
  14. Que, Z.Q.; Lindroos, M.; Lydman, J.; Hytonen, N.; Lindqvist, S.; Efsing, P.; Nevasmaa, P.; Arffman, P. Brittle fracture initiation in decommissioned boiling water reactor pressure vessel head weld. J. Nucl. Mater. 2022, 569, 15. [Google Scholar] [CrossRef]
  15. Ulbricht, A.; Altstadt, E.; Bergner, F.; Viehrig, H.W.; Keiderling, U. Small-angle neutron scattering investigation of as-irradiated, annealed and reirradiated reactor pressure vessel weld material of decommissioned reactor. J. Nucl. Mater. 2011, 416, 111–116. [Google Scholar] [CrossRef]
  16. Viehrig, H.W.; Altstadt, E.; Houska, M.; Valo, M. Fracture mechanics characterisation of the beltline welding seam of the decommissioned WWER-440 reactor pressure vessel of nuclear power plant Greifswald Unit 4. Int. J. Press. Vessel. Pip. 2012, 89, 129–136. [Google Scholar] [CrossRef]
  17. Lindgren, K.; Boasen, M.; Que, Z.Q.; Stiller, K.; Efsing, P.; Thuvander, M. Post-irradiation annealing of high flux irradiated and surveillance material reactor pressure vessel weld metal. J. Nucl. Mater. 2022, 562, 10. [Google Scholar] [CrossRef]
  18. Lindgren, K.; Boasen, M.; Stiller, K.; Efsing, P.; Thuvander, M. Evolution of precipitation in reactor pressure vessel steel welds under neutron irradiation. J. Nucl. Mater. 2017, 488, 222–230. [Google Scholar] [CrossRef]
  19. Lindgren, K.; Stiller, K.; Efsing, P.; Thuvander, M. On the Analysis of Clustering in an Irradiated Low Alloy Reactor Pressure Vessel Steel Weld. Microsc. Microanal. 2017, 23, 376–384. [Google Scholar] [CrossRef]
  20. Saroun, J.; Kocik, J.; Garcia-Matres, E.; Muransky, O.; Strunz, P. Characterisation of radiation-induced precipitates in reactor pressure vessel steels. Z. Fur Krist. 2006, S23, 393–398. [Google Scholar]
  21. Ulbricht, A.; Hernandez-Mayoral, M.; Onorbe, E.; Etienne, A.; Radiguet, B.; Hirschmann, E.; Wagner, A.; Hein, H.; Bergner, F. Effect of Neutron Flux on an Irradiation-Induced Microstructure and Hardening of Reactor Pressure Vessel Steels. Metals 2022, 12, 369. [Google Scholar] [CrossRef]
  22. Viehrig, H.W.; Altstadt, E.; Houska, M. Radiation response of the overlay cladding from the decommissioned WWER-440 Greifswald Unit 4 reactor pressure vessel. Nucl. Eng. Des. 2015, 286, 227–236. [Google Scholar] [CrossRef]
  23. Wagner, A.; Bergner, F.; Chaouadi, R.; Hein, H.; Hernandez-Mayoral, M.; Serrano, M.; Ulbricht, A.; Altstadt, E. Effect of neutron flux on the characteristics of irradiation-induced nanofeatures and hardening in pressure vessel steels. Acta Mater. 2016, 104, 131–142. [Google Scholar] [CrossRef]
  24. Kapoor, G.; Chekhonin, P.; Kaden, C.; Vogel, K.; Bergner, F. Microstructure-informed prediction and measurement of nanoindentation hardness of an Fe-9Cr alloy irradiated with Fe-ions of 1 and 5 MeV energy. Nucl. Mater. Energy 2022, 30, 9. [Google Scholar] [CrossRef]
  25. Kumar, N.; Li, C.; Leonard, K.J.; Bei, H.; Zinkle, S.J. Microstructural stability and mechanical behavior of FeNiMnCr high entropy alloy under ion irradiation. Acta Mater. 2016, 113, 230–244. [Google Scholar] [CrossRef]
  26. Wagner, A.; Ulbricht, A.; Bergner, F.; Altstadt, E. Influence of the copper impurity level on the irradiation response of reactor pressure vessel steels investigated by SANS. Nucl. Instrum. Methods Phys. Res. Sect. B-Beam Interact. Mater. At. 2012, 280, 98–102. [Google Scholar] [CrossRef]
  27. Ghoneim, M.M.; Hammad, F.H. Pressure vessel steels: Influence of chemical composition on irradiation sensitivity. Int. J. Press. Vessel. Pip. 1997, 74, 189–198. [Google Scholar] [CrossRef]
  28. Rindelhardt, U.; Viehrig, H.W.; Konheiser, J.; Schuhknecht, J.; Noack, K.; Gleisberg, B. RPV material investigations of the former VVER-440 Greifswald NPP. Nucl. Eng. Des. 2009, 239, 1581–1590. [Google Scholar] [CrossRef]
  29. Viehrig, H.W.; Houska, M.; Altstadt, E. Radiation and annealing response of WWER 440 beltline welding seams. J. Nucl. Mater. 2015, 456, 334–343. [Google Scholar] [CrossRef]
  30. Werner, C.J. MCNP® User’s Manual; Code Version 6.2. 2017, LA-UR-17-29981; Los Alamos National Laboratory: Los Alamos, NM, USA, 2017. [Google Scholar]
  31. Rindelhardt, U.; Viehrig, H.W.; Konheiser, J.; Schuhknecht, J. Weld Material Investigations of a WWER-440 Reactor Pressure Vessel: Results from the First Trepan Taken from the Former Greifswald NPP. J. Eng. Gas Turbines Power-Trans. Asme. 2009, 131, 7. [Google Scholar] [CrossRef]
  32. Poenitz, E.; Konheiser, J. Investigation of RPV samples of the Greifswald NPP with focus on retrospective dosimetry. EPJ Web Conf. ISRD-17 2024, 308, 03009. [Google Scholar] [CrossRef]
  33. Seah, M.P.; Gilmore, L.S.; Beamson, G. XPS: Binding energy calibration of electron spectrometers 5—Re-evaluation of the reference energies. Surf. Interface Anal. 1998, 26, 642–649. [Google Scholar] [CrossRef]
  34. Moulder, J.F.; Stickle, W.F.; Sobol, P.E.; Bomben, K.D. Handbook of X-Ray Photoelectron Spectroscopy; Chastain, J., King, R.C., Jr., Eds.; ULVAC-PHI, Inc.: Chigasaki, Japan, 1992. [Google Scholar]
  35. Sun, J.L.; Tang, H.J.; Wang, C.L.; Han, Z.; Li, S.S. Effects of Alloying Elements and Microstructure on Stainless Steel Corrosion: A Review. Steel Res. Int. 2022, 93, 19. [Google Scholar] [CrossRef]
  36. Wang, Y.; Karasev, A.; Jonsson, P.G. Characterization of Nonmetallic Inclusions in Different Ferroalloys used in the Steelmaking Processes. Steel Res. Int. 2021, 92, 12. [Google Scholar] [CrossRef]
  37. Wang, Y.; Karasev, A.; Park, J.H.; Jonsson, P.G. Non-metallic Inclusions in Different Ferroalloys and Their Effect on the Steel Quality: A Review. Metall. Mater. Trans. B-Process Metall. Mater. Process. Sci. 2021, 52, 2892–2925. [Google Scholar] [CrossRef]
  38. Kepka, M.; Kletecka, Z.; Barackova, L. Chemische Inhomogenität und Güte großer Schmiedeblöcke. Stahl Und Eisen 1982, 102, 127–130. [Google Scholar]
  39. GRS. Sicherheitsbeurteilung des Kernkraftwerks Greifswald, Block 1—4; Gesellschaft für Reaktorsicherheit (GRS) mbH: Koln, Germany, 1990. [Google Scholar]
  40. Viehrig, H.W.; Schuhknecht, J. Fracture mechanics characterisation of the WWER-440 reactor pressure vessel beltline welding seam. Int. J. Press. Vessel. Pip. 2009, 86, 239–245. [Google Scholar] [CrossRef]
  41. Rindelhardt, U.; Viehrig, H.W.; Konheiser, J.; Schuhknecht, J. Asme. In Weld Material Investigations of a WWER-440 Reactor Pressure Vessel: Results Form the First Trepan Taken from the Former Greifswald NPP, Proceedings of the 16th International Conference on Nuclear Engineering, Orlando, FL, USA, 11–15 May 2008; The American Society of Mechanical Engineers: New York, NY, USA, 2008. [Google Scholar]
  42. Leskinen, A.; Salminen-Paatero, S.; Gautier, C.; Räty, A.; Tanhua-Tyrkkö, M.; Fichet, P.; Kekki, T.; Zhang, W.Z.; Bubendorff, J.; Laporte, E.; et al. Intercomparison exercise on difficult to measure radionuclides in activated steel: Statistical analysis of radioanalytical results and activation calculations. J. Radioanal. Nucl. Chem. 2020, 324, 1303–1316. [Google Scholar] [CrossRef]
  43. Bhadeshia, H.K.D.H. Bainite in Steels, 3rd ed.; CRC Press: London, UK, 2015. [Google Scholar]
  44. Ghoneim, M.M.; Nasreldin, A.M.; Elsayed, A.A.; Pachur, D.; Hammad, F.H. Instrumented impact properties of some advanced nuclear reactor pressure vessel steels. J. Mater. Eng. Perform. 1996, 5, 328–334. [Google Scholar] [CrossRef]
  45. NIST. NIST X-Ray Photoelectron Spectroscopy Database, Version 4.1, 2012; National Institute of Standards and Technology: Gaithersburg, MD, USA, 2012.
  46. Maslar, J.E.; Hurst, W.S.; Bowers, W.J.; Hendricks, J.H. In situ Raman spectroscopic investigation of stainless steel hydrothermal corrosion. Corrosion 2002, 58, 739–747. [Google Scholar] [CrossRef]
  47. Li, S.X.; Hihara, L.H. Identification of inclusions in carbon steels using micro-Raman spectroscopy. J. Raman Spectrosc. 2017, 48, 137–142. [Google Scholar] [CrossRef]
  48. Alanazi, A.M.; McNaughter, P.D.; Alam, F.; Vitorica-yrezabal, I.J.; Whitehead, G.F.S.; Tuna, F.; O’Brien, P.; Collison, D.; Lewis, D.J. Structural Investigations of alpha-MnS Nanocrystals and Thin Films Synthesized from Manganese(II) Xanthates by Hot Injection, Solvent-Less Thermolysis, and Doctor Blade Routes. ACS Omega 2021, 6, 27716–27725. [Google Scholar] [CrossRef]
  49. Bourdoiseau, J.A.; Jeannin, M.; Remazeilles, C.; Sabota, R.; Refait, P. The transformation of mackinawite into greigite studied by Raman spectroscopy. J. Raman Spectrosc. 2011, 42, 496–504. [Google Scholar] [CrossRef]
  50. Dywel, P.; Szczesny, R.; Domanowski, P.; Skowronski, L. Structural and Micromechanical Properties of Nd:YAG Laser Marking Stainless Steel (AISI 304 and AISI 316). Materials 2020, 13, 2168. [Google Scholar] [CrossRef] [PubMed]
  51. He, X.B.; Wang, L.J.; Chou, K.C. Basicity Contributions to Interfacial Structure and Oxygen Potential of CaO-MnO-SiO2 slag. Metall. Mater. Trans. B-Process Metall. Mater. Process. Sci. 2022, 53, 1583–1592. [Google Scholar] [CrossRef]
  52. Huidobro, J.; Aramendia, J.; Garcia-Florentino, C.; Ruiz-Galende, P.; Torre-Fdez, I.; Castro, K.; Arana, G.; Madariaga, J.M. Mineralogy of the RBT 04262 Martian meteorite as determined by micro-Raman and micro-X-ray fluorescence spectroscopies. J. Raman Spectrosc. 2022, 53, 450–462. [Google Scholar] [CrossRef]
  53. Takahashi, N.; Tsujimori, T.; Kamada, S.; Nakamura, M. In-situ Raman spectroscopic analysis of dissolved silica structures in Na2CO3 and NaOH solutions at high pressure and temperature. Contrib. Mineral. Petrol. 2022, 177, 15. [Google Scholar] [CrossRef]
  54. Girish, M.; Dhandayuthapani, T.; Sivakumar, R.; Sanjeeviraja, C. MnS thin films prepared by a simple and novel nebulizer technique: Report on the structural, optical, and dispersion energy parameters. J. Mater. Sci. Mater. Electron. 2015, 26, 3670–3684. [Google Scholar] [CrossRef]
  55. Maslar, J.E.; Hurst, W.S.; Bowers, W.J.; Hendricks, J.H.; Aquino, M.I.; Levin, I. In situ Raman spectroscopic investigation of chromium surfaces under hydrothermal conditions. Appl. Surf. Sci. 2001, 180, 102–118. [Google Scholar] [CrossRef]
  56. Molchan, I.S.; Thompson, G.E.; Lindsay, R.; Skeldon, P.; Likodimos, V.; Romanos, G.E.; Falaras, P.; Adamova, G.; Iliev, B.; Schubert, T.J.S. Corrosion behaviour of mild steel in 1-alkyl-3-methylimidazolium tricyanomethanide ionic liquids for CO2 capture applications. RSC Adv. 2014, 4, 5300–5311. [Google Scholar] [CrossRef]
  57. Rafique, M.Y.; Pan, L.Q.; Javed, Q.U.; Iqbal, M.Z.; Qiu, H.M.; Farooq, M.H.; Guo, Z.G.; Tanveer, M. Growth of monodisperse nanospheres of MnFe2O4 with enhanced magnetic and optical properties. Chin. Phys. B 2013, 22, 7. [Google Scholar] [CrossRef]
  58. Ramki, S.; Pandi, K.; Chen, S.M.; Ye, Y.T.; Chen, T.W.; Hao, Q.L. Hydrothermal Synthesis of Manganese Sulfide Decorated Graphene Oxide for Effective Electrochemical Sensing of Dopamine. Int. J. Electrochem. Sci. 2019, 14, 1069–1081. [Google Scholar] [CrossRef]
  59. Avril, C.; Malavergne, V.; Caracas, R.; Zanda, B.; Reynard, B.; Charon, E.; Bobocioiu, E.; Brunet, F.; Borensztajn, S.; Pont, S.; et al. Raman spectroscopic properties and Raman identification of CaS-MgS-MnS-FeS-Cr2FeS4 sulfides in meteorites and reduced sulfur-rich systems. Meteorit. Planet. Sci. 2013, 48, 1415–1426. [Google Scholar] [CrossRef]
  60. Rémazeilles, C.; Saheb, M.; Neff, D.; Guilminot, E.; Tran, K.; Bourdoiseau, J.A.; Sabot, R.; Jeannin, M.; Matthiesen, H.; Dillmann, P.; et al. Microbiologically influenced corrosion of archaeological artefacts: Characterisation of iron(II) sulfides by Raman spectroscopy. J. Raman Spectrosc. 2010, 41, 1425–1433. [Google Scholar] [CrossRef]
  61. Snovski, R.; Grinblat, J.; Sougrati, M.T.; Jumas, J.C.; Margel, S. Synthesis and characterization of iron, iron oxide and iron carbide nanostructures. J. Magn. Magn. Mater. 2014, 349, 35–44. [Google Scholar] [CrossRef]
  62. Upadhyay, S.; Pandey, O.P. One-pot synthesis of pure phase molybdenum carbide (Mo2C and MoC) nanoparticles for hydrogen evolution reaction. Int. J. Hydrogen Energ. 2020, 45, 27114–27128. [Google Scholar] [CrossRef]
  63. Grover, V.; Shukla, R.; Kumari, R.; Mandal, B.P.; Kulriya, P.K.; Srivastava, S.K.; Ghosh, S.; Tyagi, A.K.; Avasthi, D.K. Effect of grain size and microstructure on radiation stability of CeO2: An extensive study. Phys. Chem. Chem. Phys. 2014, 16, 27065–27073. [Google Scholar] [CrossRef]
  64. Song, Y.; Zhang, S.X.; Zhang, C.H.; Yang, Y.T.; Lv, K.Y. Raman Spectra and Microstructure of Zinc Oxide irradiated with Swift Heavy Ion. Crystals 2019, 9, 395. [Google Scholar] [CrossRef]
  65. Karcher, S.; Mohun, R.; Olds, T.; Weber, M.; Kriegsman, K.; Zhao, X.D.; Guo, X.F.; Corkhill, C.; Field, D.; McCloy, J. Benefits of using multiple Raman laser wavelengths for characterizing defects in a UO2 matrix. J. Raman Spectrosc. 2022, 53, 988–1002. [Google Scholar] [CrossRef]
  66. Bing, B.; Han, X.; Jia, L.; He, X.; Zhang, C.; Yang, W. Influence analysis of alloy elements on irradiation embrittlement of RPV steel based on deep neural network. Int. J. Adv. Nucl. React. Des. Technol. 2023, 5, 44–51. [Google Scholar] [CrossRef]
  67. Druyts, F.; Caes, S.; Thomas, P. Carbon-14 release and speciation from carbon steel in highly alkaline conditions. Radiocarbon 2018, 60, 1683–1690. [Google Scholar] [CrossRef]
  68. Cvetkovic, B.Z.; Salazar, G.; Kunz, D.; Tits, J.; Szidat, S.; Wieland, E. Quantification of dissolved organic 14C-containing compounds by accelerator mass spectrometry in a corrosion experiment with irradiated steel. Radiocarbon 2018, 60, 1711–1727. [Google Scholar] [CrossRef]
  69. De Visser-Tynová, E.; Swanton, S.W.; Williams, S.J.; Stijkel, M.P.; Walker, A.J.; Otlet, R.L. 14C release from irradiated stainless steel. Radiocarbon 2018, 60, 1671–1681. [Google Scholar] [CrossRef]
  70. Guillemot, T.; Salazar, G.; Rauber, M.; Kunz, D.; Szidat, S.; Wieland, E. Carbon-14 release and speciation during corrosion of irradiated steel under radioactive waste disposal conditions. Sci. Total Environ. 2022, 817, 9. [Google Scholar] [CrossRef]
  71. Mibus, J.; Diomidis, N.; Wieland, E.; Swanton, S.W. Release and speciation of 14C during the corrosion of activated steel in deep geological repositories for the disposal of radioactive waste. Radiocarbon 2018, 60, 1657–1670. [Google Scholar] [CrossRef]
  72. Rodríguez, M.; Gascón, J.L.; Magro, E.; Piña, G.; Lara, E.; Sevilla, L. 14C release from steels under aerobic conditions. Radiocarbon 2018, 60, 1729–1741. [Google Scholar] [CrossRef]
  73. Wieland, E.; Cvetkovic, B.Z.; Kunz, D.; Salazar, G.; Szidat, S. Carbon-14 Speciation During Anoxic Corrosion of Activated Steel in a Repository Environment. Atw-Int. J. Nucl. Power 2018, 63, 34–37. [Google Scholar]
  74. Lin, C.C. A review of corrosion product transport and radiation field buildup in boiling water reactors. Prog. Nucl. Energy 2009, 51, 207–224. [Google Scholar] [CrossRef]
Figure 1. SEM microstructural features and EDS results for matrix compositions of base material (U8-B, U1-B) and weld material (U8-W, U1-W) of RPV steel samples.
Jne 06 00012 g001
Figure 2. SEM of (Mn, S)-rich inclusions within the ferritic microstructures of the first-generation base metal (U1-B) within the inner (U1-B-in) and outer walls (U1-B-out) of the RPV and corresponding EDS of the Mn-rich inclusion material, Pos. (1) and their secondary micro-inclusions, Pos. (2), respectively.
Jne 06 00012 g002
Figure 3. SEM of the inclusions within the bainitic microstructures of the first-generation weld material (U2-W) within the inner (U2-W-in) and outer walls (U2-W-out) of the RPV and corresponding EDS of their secondary micro-inclusions of U2-W-in (Pos. (1)) and U2-W-out (Pos. (2)).
Jne 06 00012 g003
Figure 4. SEM images of second-generation base metal (U8-B) and weld metal (U8-W) and their corresponding EDS measurements of Mo precipitates (Pos. (1)) and Mn inclusions (Pos. (2)).
Jne 06 00012 g004
Figure 5. Narrow scans of elemental lines of second-generation base (U8-B) (red) and weld (U8-W) (blue) samples. The Fe, Mo, and C spectra were recorded after Ar ion etching. The S spectrum was recorded after cleaning with a phosphoric acid detergent.
Jne 06 00012 g005
Figure 6. Raman spectra of the dark inclusions in the second-generation base (U8-B) and weld (U8-W) material.
Jne 06 00012 g006
Figure 7. Raman spectra of the inclusions within the first-generation (A) (U1-B) base material and (B) (U2-W) weld material. The Raman spectra of the second-generation base (U8-B, black dashed traces in (A)) and weld (U8-W, gray dashed traces in (B)) materials have been included in the figure for comparison. The Raman shifts of the pristine material are indicated in Figure 6.
Jne 06 00012 g007
Table 1. Sample description of the RPV material from GW-NPP. Codes: U1, U2: first-generation reactor units 1 and 2; U8, second-generation reactor unit 8; B: base metal; W: weld metal.
Sample CodeSample DescriptionSample Position
Axial from Reactor Core Bottom (cm)Azimuthal (°)Horizontal from Inner Wall (mm)
U1-B-inBase metal27530039 ± 1
U1-B-out71 ± 1
U2-W-inWeld metal−16130039 ± 1
U2-W-out71 ± 1
U8-BBase metal
U8-WWeld metal
Table 2. Mass fraction (wt %) of selected elements within the RPV (first generation U1 and U2 and second generation U8) of both the base (B) and weld (W) materials determined by OES.
CSiMnCrNiVMoCu CoAlTiS
Nominal values for RPV crude steel (CrMoV) [38]
Min0.130.170.302.500.000.250.600.000.00n.i.n.i.0.00
Max0.180.370.603.000.400.350.800.150.020n.i.n.i.0.025
U8-B
p.w.0.150.260.472.870.0740.290.720.050.0090.0110.00020.012
SD*0.0060.0030.0030.010.00060.0010.0080.00020.00060.00010.00010.0009
U8-W
p.w.0.050.551.081.40.0530.170.530.0830.0050.0130.0030.012
SD*0.0020.0090.0020.00030.00010.0010.0060.0050.00040.00010.00010.0005
U1-B
[39]0.160.280.452.730.160.270.670.15n.i.n.i.n.i.0.015
p.w.0.1410.290.4253.060.180.2650.680.1730.0150.0010.00040.01
SD*0.0070.0080.0040.0140.0030.0010.010.0020.00040.00040.00010.001
U2-W
[39]0.080.170.631.500.190.170.460.18n.i.n.i.0.060.013
p.w.0.060.380.951.620.170.140.450.160.01650.0010.0040.01
SD*0.010.010.0060.040.0010.0030.0060.0020.0010.0040.00060.001
p.w. present work; n.i. no information available; SD* denotes uncertainty value based on the standard deviation. N.B.: Fe completes the total mass percentage of the steel RPV material.
Table 3. 60Co and 14C measurements as well as neutron fluence calculation results of U1 and U2 samples.
SampleNeutron Fluence ϕ
(> 0.5 MeV) (n/cm2)
60Co (Bq/g)14C (Bq/g)
U1-B-in(1.1 ± 0.2) × 1018273 ± 503.0 ± 2.1
U1-B-out(0.9 ± 0.2) × 1018208 ± 171.5 ± 0.6
U2-W-in(1.6 ± 0.3) × 10154.3 ± 1.30.31 ± 0.03
U2-W-out(2.4 ± 0.5) × 10157.4 ± 1.50.21 ± 0.07
Table 4. Raman bands and their respective assignments of samples U8-B and U8-W.
Raman Shift (cm−1) U8-BRaman Shift (cm−1) U8-WAssignmentReference
991991(Mn-)SiO3~1000 cm−1 [53]
~1000 cm−1 [51]
660 Fe3O4
γ-Fe2O3
NiCr2O4
665 cm−1 [10]
657 cm−1 [10]
665 cm−1 [8]
649γ-Fe2O3
MnFe2O4
657 cm−1 [10]
643 cm−1 [47]
549 Cr2O3550 cm−1 [8]
502 γ-Fe2O3
α-Fe2O3
NiCr2O4
507 cm−1 [10]
494 cm−1 [10]
508 cm−1 [8]
399 α-Fe2O3406 cm−1 [10]
400 cm−1 [50]
341341γ-Fe2O3339 cm−1 [10]
296α-Fe2O3

FeS
290 cm−1 [10]
280 cm−1 [50]
296 cm−1 [49]
223 α-Fe2O3224 cm−1 [10]
220 cm−1 [50]
Table 5. Raman bands and their respective assignments of sample U1-B.
Raman Shift (cm−1) U1-BAssignmentReference
520–680Fe3O4
γ-Fe2O3
NiCr2O4
MnFe2O4
Cr2O3
MnS
665 cm−1 [10]
657 cm−1 [10]
665 cm−1 [8]
643 cm−1 [47]
550 cm−1 [8]
635 cm−1 [48]
483, 223S474 cm−1, 221 cm−1 [52]
282(Mn, Fe)S
FeS
276 cm−1 [47]
282 cm−1 [47]
Disclaimer/Publisher’s Note: The statements, opinions and data contained in all publications are solely those of the individual author(s) and contributor(s) and not of MDPI and/or the editor(s). MDPI and/or the editor(s) disclaim responsibility for any injury to people or property resulting from any ideas, methods, instructions or products referred to in the content.

